Assessment and Management of Pressure on Water Quality Protection along the Middle Route of the South-to-North Water Diversion Project


Abstract
:1. Introduction
2. Methods
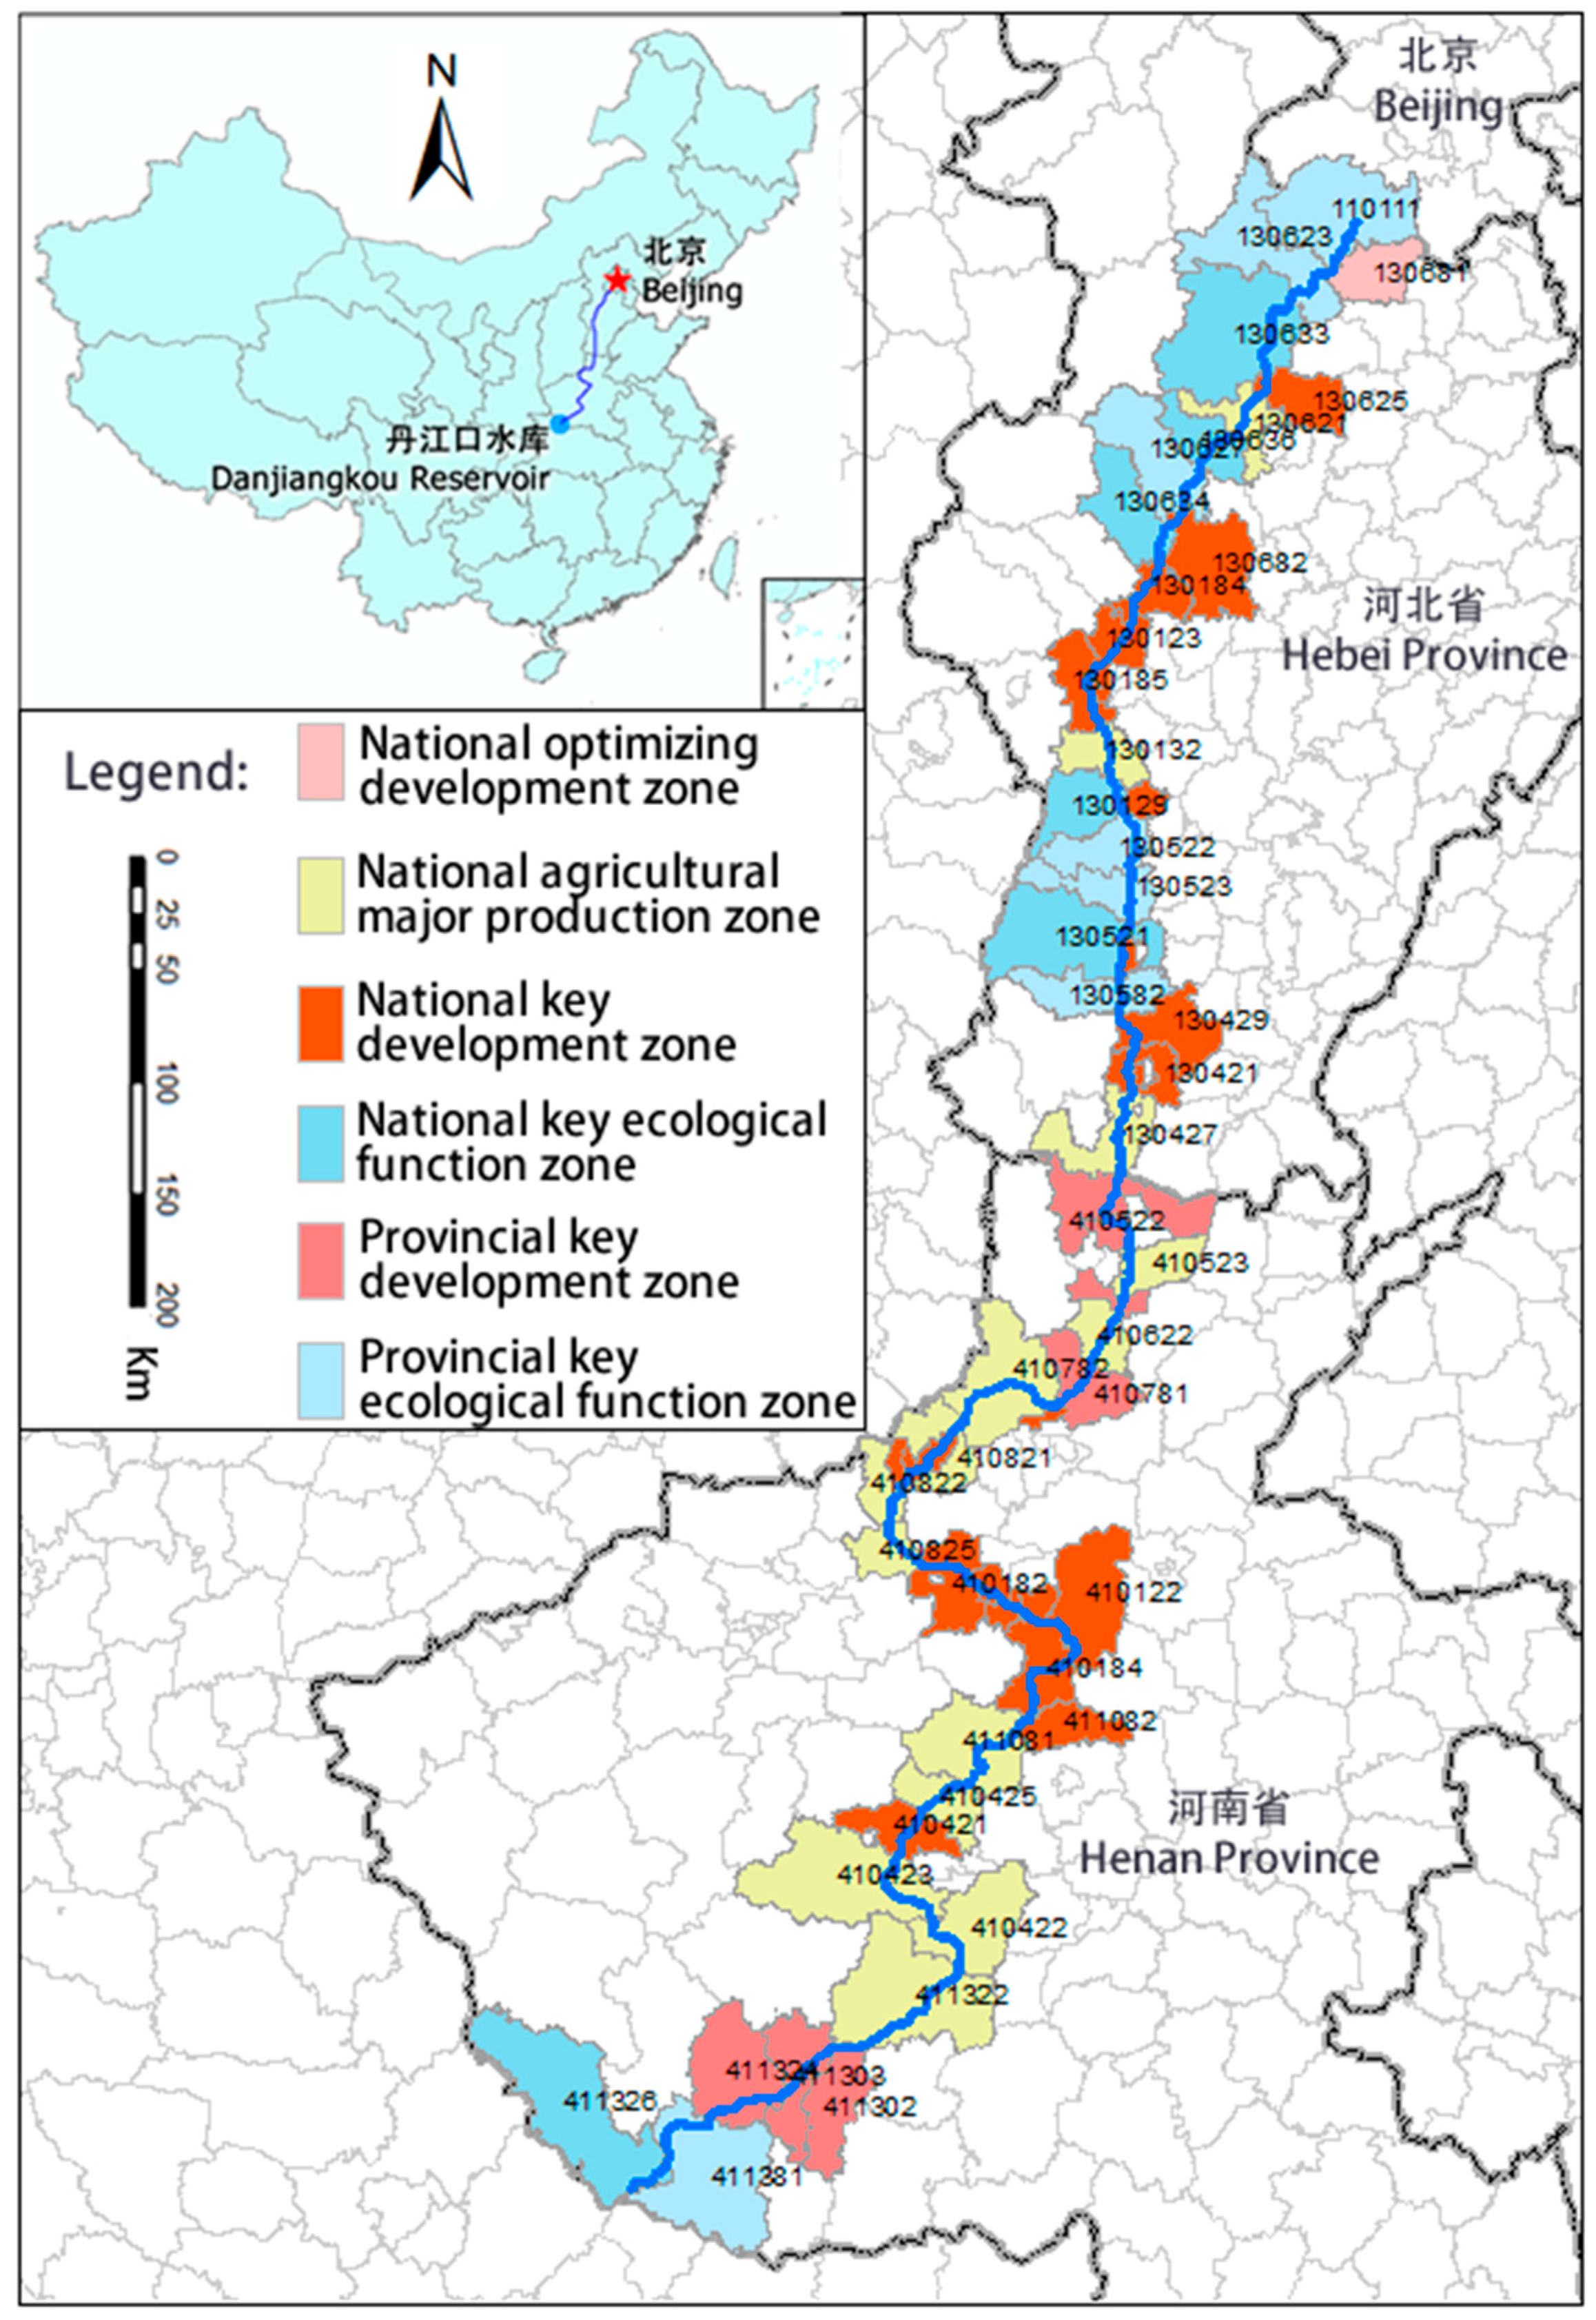
2.1. Research Area
2.2. Types of Water Quality Risks
2.2.1. Risk of Surface Water Pollution
2.2.2. Risk of Atmospheric Deposition Pollution
2.2.3. Risk of Groundwater Seepage Pollution
2.3. Data Source
2.3.1. Medium Resolution Land-Use Classification Data
2.3.2. Retrieving Land Surface Temperature (LST)
2.3.3. Elevation Data
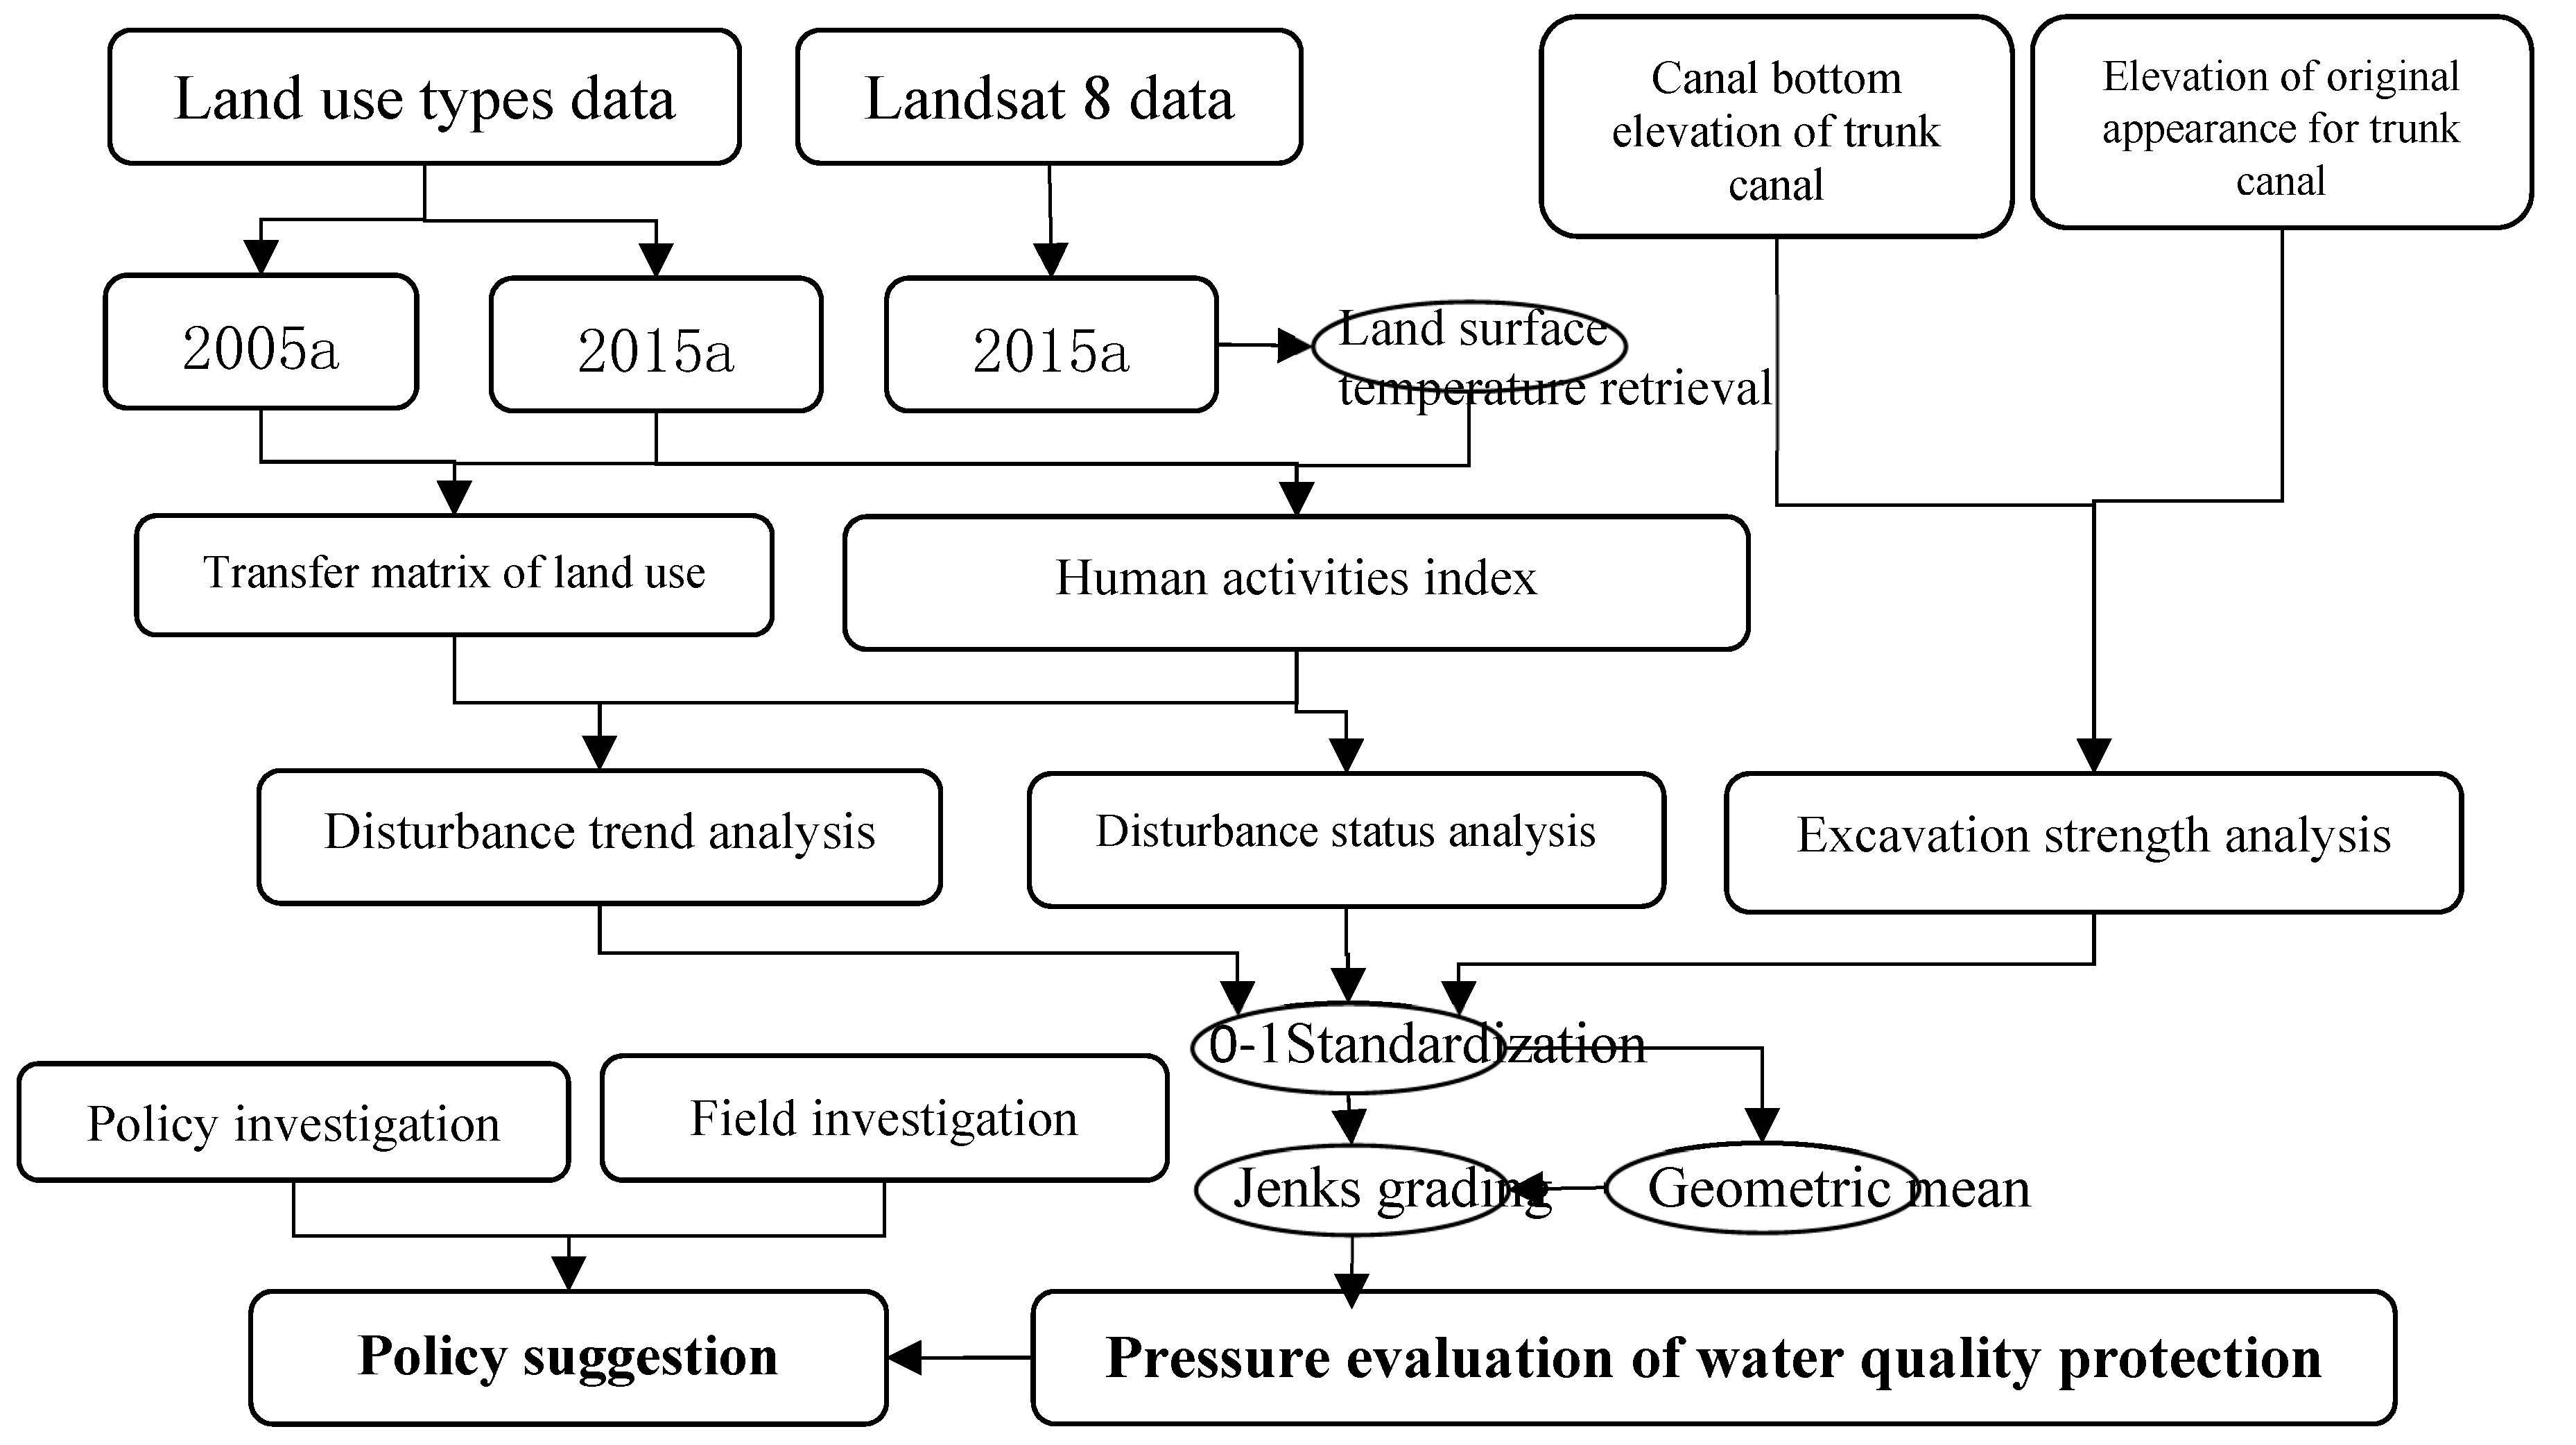
2.4. Methodological Framework
3. Results
3.1. Composition and Changes in Land Use
3.2. Current Situation and the Trend in Human Activity Disturbance
Depth of Canal Excavation and Mound
3.3. Water Quality Protection Pressure
4. Discussion
4.1. Causes of Land-Use Change along the Canal
4.2. Features of Human Activity Disturbance
4.3. Performance of Construction Land Expansion Controls
4.4. Scale Differences among Different Pressure Levels
5. Policy Suggestions
5.1. Policy Suggestions for Different Types of Pressure
5.2. Policy Suggestions for Different Types of Landscapes
5.3. Policy Suggestions Based on the Ecological Protection Red Lines Policies
5.4. Policy Suggestions Based on the Main Functional Zones Policy
6. Conclusions
Author Contributions
Funding
Conflicts of Interest
References
- Zhuang, W. Eco-environmental impact of inter-basin water transfer projects: A review. Environ. Sci. Pollut. Res. 2016, 23, 12867–12879. [Google Scholar] [CrossRef]
- Zhao, Z.; Zuo, J.; Zillante, G. Transformation of water resource management: A case study of the South-to-North Water Diversion project. J. Clean. Prod. 2017, 163, 136–145. [Google Scholar] [CrossRef]
- Liu, K.; Gan, Y.H.; Zhang, T.; Luo, Z.; Wang, J.J.; Gao, X.M.; Yue, Q.X. Study on Land Use Change in the Water Supplying Core Area of Middle Route of South-To-North Water Transfer Project. In Proceedings of the IGARSS 2018—2018 IEEE International Geoscience and Remote Sensing Symposium, Valencia, Spain, 22–27 July 2018; pp. 802–805. [Google Scholar] [CrossRef]
- Office of the South-to-North Water Diversion Project Construction Committee, State Council, People’s Republic of China the South-to-North Water Diversion Project. Engineering 2016, 2, 265–267. [CrossRef]
- Wang, L.; Ma, C. A study on the environmental geology of the Middle Route Project of the South–North water transfer. Eng. Geol. 1999, 51, 153–165. [Google Scholar] [CrossRef]
- Peng, Z.; Zhang, L.; Yin, J.; Wang, H. Study of impact factors of willingness to pay regarding water reserve of South-to-North Water Diversion Project in Beijing based on Bayesian network model. J. Clean. Prod. 2018, 184, 569–578. [Google Scholar] [CrossRef]
- Yan, B.; Chen, L. Coincidence probability of precipitation for the middle route of South-to-North water transfer project in China. J. Hydrol. 2013, 499, 19–26. [Google Scholar] [CrossRef]
- Lin, M.; Zhang, Q.; Li, Z.; Zhang, G.; Zhang, Z.; Yang, Z.; Si, S.; Niu, H.; Sun, J.; Fan, H.; et al. Characteristics of the variance of the water quality and quantity in the middle route of South-to-North Water Diversion Project and corresponding measures for urban water supply. J. Water Supply Drain. 2016, 52, 9–13. (In Chinese) [Google Scholar] [CrossRef]
- Liang, J.; Xin, X.; Lu, L.; Hu, S.; Zhu, D.; Tang, J. Analysis of water quality variation and potential pollution sources in main channel of Middle Route Project of South to North Water Diversion. Yangtze River 2017, 48, 6–9. (In Chinese) [Google Scholar] [CrossRef]
- Lin, M. Water resource risk and its solutions for the middle route of South-to-North Water Diversion Project. J. Water Supply Drain. 2017, 53, 9–14. (In Chinese) [Google Scholar] [CrossRef]
- Dong, M.; Tang, M.; Li, S.; Cao, H.; Deng, H.; Wu, G. Effects of water transfer project construction on vegetation patterns. Acta Ecol. Sin. 2016, 36, 6656–6663. (In Chinese) [Google Scholar]
- Yin, G.; Shao, J.; Guo, Y.; Dang, Y.; Xu, X. Study of Land Use Change and Eco-environmental Response in the Core Area ofMid-route of South-to-north Water Transfer Project. J. Geo-Inf. Sci. 2017, 19, 59–69. (In Chinese) [Google Scholar] [CrossRef]
- Guo, H.; LIu, R.; Hao, X.; Tian, Z. Eco-environmental evaluation of Middle Route of South-to-North Transfer Project based on PSR model. South-to-North Water Transf. Water Sci. Technol. 2017, 15, 65–70. (In Chinese) [Google Scholar] [CrossRef]
- Wu, H. Watershed prioritization in the upper Han River basin for soil and water conservation in the South-to-North Water Transfer Project (middle route) of China. Environ. Sci. Pollut. Res. 2018, 25, 2231–2238. [Google Scholar] [CrossRef]
- Yang, S.; Bai, J.; Zhao, C.; Lou, H.; Zhang, C.; Guan, Y.; Zhang, Y.; Wang, Z.; Yu, X. The assessment of the changes of biomass and riparian buffer width in the terminal reservoir under the impact of the South-to-North Water Diversion Project in China. Ecol. Indic. 2018, 85, 932–943. [Google Scholar] [CrossRef]
- The Central People’s Government of the People’s Republic of China. The Notice on the Plan for National Development Priority Zones. Available online: http://www.gov.cn/zwgk/2011-06/08/content_1879180.htm (accessed on 21 December 2010). (In Chinese)
- Arrighi, C.; Masi, M.; Iannelli, R. Flood risk assessment of environmental pollution hotspots. Environ. Model. Softw. 2018, 100, 1–10. [Google Scholar] [CrossRef]
- Li, Z.; Tang, B.; Wu, H.; Ren, H.; Yan, G.; Wan, Z.; Trigo, I.F.; Sobrino, J.A. Satellite-derived land surface temperature: Current status and perspectives. Remote Sens. Environ. 2013, 131, 14–37. [Google Scholar] [CrossRef] [Green Version]
- Christidis, N.; Stott, P.A.; Brown, S.J. The role of human activity in the recent warming of extremely warm daytime temperatures. J. Clim. 2011, 24, 1922–1930. [Google Scholar] [CrossRef]
- Ning, J.; Gao, Z.; Meng, R.; Xu, F.; Gao, M. Analysis of relationships between land surface temperature and land use changes in the Yellow River Delta. Front. Earth Sci. 2018, 12, 444–456. [Google Scholar] [CrossRef]
- Chen, J.; Yang, S.; Li, H.; Zhang, B.; Lv, J. Research on geographical environment unit division based on the method of natural breaks (Jenks). Int. Arch. Photogramm. Remote Sens. Spat. Inf. Sci. 2013, 47–50. [Google Scholar] [CrossRef]
- Zhang, L.; Wang, Z.; Chai, J.; Fu, Y.; Wei, C.; Wang, Y. Temporal and Spatial Changes of Non-Point Source N and P and Its Decoupling from Agricultural Development in Water Source Area of Middle Route of the South-to-North Water Diversion Project. Sustainability 2019, 11, 895. [Google Scholar] [CrossRef]
- Wang, W.; Zhang, X.; Wu, Y.; Zhou, L.; Skitmore, M. Development priority zoning in China and its impact on urban growth management strategy. Cities 2017, 62, 1–9. [Google Scholar] [CrossRef]


| To 2015a | |||||||
|---|---|---|---|---|---|---|---|
| From 2005a | Unit: Hectare | Agriculture land | Grassland | Woodland | Water area | Construction land | Unused land |
| Agriculture land | 347,870.52 | 117.00 | 783.27 | 3670.38 | 25,589.88 | 44.10 | |
| Grassland | 605.70 | 2376.27 | 82.62 | 62.91 | 350.73 | 0.00 | |
| Woodland | 1991.97 | 152.28 | 14,539.68 | 1050.93 | 2472.48 | 77.94 | |
| Water area | 814.59 | 2.25 | 179.37 | 7576.20 | 299.07 | 201.69 | |
| Construction land | 3921.39 | 25.11 | 130.68 | 116.91 | 73,381.50 | 17.64 | |
| Unused land | 29.34 | 0.00 | 45.81 | 0.18 | 13.32 | 63.63 | |
| Disturbance Status Grading | Disturbance Trend Grading | Excavation Depth Grading | Comprehensive Stress Grading | ||||||||
|---|---|---|---|---|---|---|---|---|---|---|---|
| 130681 | 130623 | 130633 | 130681 | 130623 | 130633 | 130681 | 130623 | 130633 | 130681 | 130623 | 130633 |
| 130609 | 130607 | 130636 | 130609 | 130607 | 130636 | 130609 | 130607 | 130636 | 130609 | 130607 | 130636 |
| 130631 | 130627 | 130682 | 130631 | 130627 | 130682 | 130631 | 130627 | 130682 | 130631 | 130627 | 130682 |
| 130634 | 130184 | 130123 | 130634 | 130184 | 130123 | 130634 | 130184 | 130123 | 130634 | 130184 | 130123 |
| 130105 | 130104 | 130110 | 130105 | 130104 | 130110 | 130105 | 130104 | 130110 | 130105 | 130104 | 130110 |
| 130132 | 130129 | 130127 | 130132 | 130129 | 130127 | 130132 | 130129 | 130127 | 130132 | 130129 | 130127 |
| 130522 | 130525 | 130523 | 130522 | 130525 | 130523 | 130522 | 130525 | 130523 | 130522 | 130525 | 130523 |
| 130521 | 130503 | 130582 | 130521 | 130503 | 130582 | 130521 | 130503 | 130582 | 130521 | 130503 | 130582 |
| 130481 | 130408 | 130403 | 130481 | 130408 | 130403 | 130481 | 130408 | 130403 | 130481 | 130408 | 130403 |
| 130404 | 130402 | 130427 | 130404 | 130402 | 130427 | 130404 | 130402 | 130427 | 130404 | 130402 | 130427 |
| 130423 | 410522 | 410505 | 130423 | 410522 | 410505 | 130423 | 410522 | 410505 | 130423 | 410522 | 410505 |
| 410506 | 410502 | 410523 | 410506 | 410502 | 410523 | 410506 | 410502 | 410523 | 410506 | 410502 | 410523 |
| 410611 | 410621 | 410622 | 410611 | 410621 | 410622 | 410611 | 410621 | 410622 | 410611 | 410621 | 410622 |
| 410781 | 410704 | 410782 | 410781 | 410704 | 410782 | 410781 | 410704 | 410782 | 410781 | 410704 | 410782 |
| 410821 | 410804 | 410811 | 410821 | 410804 | 410811 | 410821 | 410804 | 410811 | 410821 | 410804 | 410811 |
| 410802 | 410803 | 410823 | 410802 | 410803 | 410823 | 410802 | 410803 | 410823 | 410802 | 410803 | 410823 |
| 410822 | 410825 | 410182 | 410822 | 410825 | 410182 | 410822 | 410825 | 410182 | 410822 | 410825 | 410182 |
| 410102 | 410103 | 410104 | 410102 | 410103 | 410104 | 410102 | 410103 | 410104 | 410102 | 410103 | 410104 |
| 410122 | 410184 | 411082 | 410122 | 410184 | 411082 | 410122 | 410184 | 411082 | 410122 | 410184 | 411082 |
| 411081 | 410425 | 410421 | 411081 | 410425 | 410421 | 411081 | 410425 | 410421 | 411081 | 410425 | 410421 |
| 410423 | 410422 | 411322 | 410423 | 410422 | 411322 | 410423 | 410422 | 411322 | 410423 | 410422 | 411322 |
| 411327 | 411302 | 411303 | 411327 | 411302 | 411303 | 411327 | 411302 | 411303 | 411327 | 411302 | 411303 |
| 411324 | 411381 | 411326 | 411324 | 411381 | 411326 | 411324 | 411381 | 411326 | 411324 | 411381 | 411326 |
| Tips: the figures are zip codes of each county, the top left corner is the northernmost, the lower right is the southernmost, and they are arranged in a “Z” shape. The I-level pressure is the highest, and V the smallest. | I | II | III | IV | V | ||||||
© 2019 by the authors. Licensee MDPI, Basel, Switzerland. This article is an open access article distributed under the terms and conditions of the Creative Commons Attribution (CC BY) license (http://creativecommons.org/licenses/by/4.0/).
Share and Cite
Han, B.; Meng, N.; Zhang, J.; Cai, W.; Wu, T.; Kong, L.; Ouyang, Z. Assessment and Management of Pressure on Water Quality Protection along the Middle Route of the South-to-North Water Diversion Project. Sustainability 2019, 11, 3087. https://doi.org/10.3390/su11113087
Han B, Meng N, Zhang J, Cai W, Wu T, Kong L, Ouyang Z. Assessment and Management of Pressure on Water Quality Protection along the Middle Route of the South-to-North Water Diversion Project. Sustainability. 2019; 11(11):3087. https://doi.org/10.3390/su11113087
Chicago/Turabian StyleHan, Baolong, Nan Meng, Jiatian Zhang, Wenbo Cai, Tong Wu, Lingqiao Kong, and Zhiyun Ouyang. 2019. "Assessment and Management of Pressure on Water Quality Protection along the Middle Route of the South-to-North Water Diversion Project" Sustainability 11, no. 11: 3087. https://doi.org/10.3390/su11113087
APA StyleHan, B., Meng, N., Zhang, J., Cai, W., Wu, T., Kong, L., & Ouyang, Z. (2019). Assessment and Management of Pressure on Water Quality Protection along the Middle Route of the South-to-North Water Diversion Project. Sustainability, 11(11), 3087. https://doi.org/10.3390/su11113087