Article

An RP-MCE-SOP Framework for China’s County-Level “Three-Space” and “Three-Line” Planning—An Integration of Rational Planning, Multi-Criteria Evaluation, and Spatial Optimization

1
College of Public Administration, Central China Normal University, Wuhan 430079, China
2
Department of Geography and Planning, Queen’s University, Kingston, ON K7L 3N6, Canada
*
Author to whom correspondence should be addressed.
Sustainability 2019, 11(11), 2997; https://doi.org/10.3390/su11112997
Submission received: 23 April 2019 / Revised: 13 May 2019 / Accepted: 22 May 2019 / Published: 28 May 2019
(This article belongs to the Section Sustainable Urban and Rural Development)

Abstract

:
“Three-space” (including agricultural space, urban and rural construction space, and ecological space) and “three-line” (including urban development boundary, prime farmland control line, basic ecological control line) planning has been regarded as an essential measure for China’s city and county level “multiple-plan integration”. It handles the multiple planning objectives of development management, agricultural land preservation, and ecological resource protection. This article proposes a rational planning with multi-criteria evaluation and spatial optimization (RP-MCE-SOP) framework for China’s county-level “three-space” and “three-line” planning by following the rational planning (RP) model and taking advantages of multi-criteria evaluation (MCE) and spatial optimization (SOP) techniques. The framework includes five steps of building the SOP model, land suitability evaluation with MCE, optimization problem solving, post-processing of land allocation solutions, and applying post-processed solutions to “three-space” and “three-line” planning. The framework was implemented in Dongxihu District of Wuhan City with the Boolean aggregation and analytical hierarchy analysis (AHP) MCE techniques and the patch-based Non-dominated Genetic Algorithm (NSGA-II) SOP algorithm. The case study shows: (1) The framework is feasible and useful for assisting decision making in “three-space” and “three-line” planning. (2) The planning solutions protect ecologically sensitive spaces and high-quality agricultural land and plan future construction in the urban peripheral area or transportation convenient areas. (3) The solutions are useful for planning the hard boundaries for ecological resource protection and prime farmland preservation and setting both hard and soft boundaries for urban growth.

1. Introduction

Different levels of governments in China have implemented various spatial planning to guide and manage spatial development, preserve agricultural land, and protect ecological resources, such as major function oriented zoning, urban and rural comprehensive planning, land use planning, basic ecological control line or ecological red line planning, and so forth. These planning projects are designed and implemented by different governmental departments with different goals, while their planning contents have overlaps. The inconsistency and poor coordination between different planning projects have increased their implementation cost and reduced their effectiveness [1,2,3]. The Chinese government have realized this problem and started to implement spatial planning reform at different levels of governments. In 2014, the National Development and Reform Commission, the Ministry of Land and Resources, the Ministry of Environmental Protection, and the Ministry of Housing and Urban-Rural Development worked together to publish the announcement “Regarding implementing a pilot project for ‘Multiple-plan integration’ at city or county level”, and selected twenty-eight pilot cities or counties for implementing the spatial planning reform [1,4]. In January 2017, the Chinese central government published the National Spatial Planning Guideline, which indicated the beginning of the spatial planning reform at the national level [5]. Meanwhile, nine pilot provinces were selected for undertaking province-level spatial planning reform [6]. City-level and county-level planning will be the focus of the next stage of reform. Based on the experiences gained from the pilot “multiple-plan integration” practices since 2014, both the Chinese government and planning community have proposed “three-space” and “three-line” planning as a critical task for spatial planning reform at city or county level. It coordinates city-level and county-level planning with province-level planning by fulfilling the percentages of the “three-space”. Meanwhile, it handles multiple planning objectives by providing guidelines and setting baselines for special planning at the city or county level, such as urban or rural land use planning, prime farmland protection planning, basic ecological control line planning, land use planning for key construction projects, etc.
“Three-space” and “three-line” planning handles the multiple planning objectives of urban development, agricultural land preservation, and ecological resource protection simultaneously. “Three-space” planning designs the spatial distribution of agricultural space, urban and rural construction space, and ecological space. Among the “three-line”, the urban development boundary acts as the control boundary for urban sprawl, the prime farmland control line protects the farmland critical to food security, and the basic ecological control line protects the ecological space essential to local ecological security. With the characteristic of coping with multiple objectives, “three-space” and “three-line” planning shows some similarities with the triple-bottom-line planning principle/frame in western countries. The triple-bottom-line principle stems from the business community and is now popularly applied in the planning community. It attempts to strike a balance among the economic, social, and environmental priorities in regional planning and assumes that there is a certain bottom-line that should be met for each objective [7,8,9,10]. Nevertheless, there also exist differences between the two planning concepts. First, the “bottom-line” in the triple-bottom-line principle is not a specific limit. It could be the limit for urban or population growth or resource consumption, the cost of quality education or healthcare, the area for natural or cultural protection, or a combination of the above and other limits. In contrast, the “three-space” and “three-line” are specific spaces and boundaries for spatial management of development and protection. Moreover, the triple-bottom-line principle emphasizes the participation of stakeholders in the planning process, including the government, enterprises, local communities, non-governmental organizations, etc. By contrast, the government plays a dominant role in “three-space” and “three-line” planning in China’s policy background, even though it is often assisted with expert’s knowledge and technical guidelines. Therefore, it is important and necessary to provide scientific and applicable frameworks and methods for the planning in order to avoid irrationality and arbitrariness of the government’s decision.
“Three-space” and “three-line” planning has been implemented in some pilot provinces, cities or counties, and two approaches have been developed and followed [4,11,12,13]. The first approach plans the “three-space” and “three-line” based on the combination and adjustment of existing spatial planning, including urban comprehensive planning, land use planning, basic ecological control line planning and so on [1,4,14]. This approach has encountered several problems. First, it only works for “three-space” and “three-line” planning until 2020, since most existing land use or urban comprehensive planning only make land use plans until 2020. Second, the database, planning terms, and boundaries of different spatial planning are often inconsistent. Within a planning area, the designed use of the same land parcel in different spatial planning often fails to match; to determine the appropriate use of these controversial land parcels is a complex and time-consuming task.
The second approach advocates that “three-space” and three-line” planning does not have to depend on existing spatial planning. Instead, it should be designed based on a comprehensive assessment of physical, socio-economic, ecological conditions, and development strategies of the planning area [12,15,16]. For instance, Li and Ma [15] proposed a conceptual framework for “three-space” and “three-line” planning. It firstly simulated urban growth scenarios with the cellular automaton (CA) and agent-based models, then evaluated ecological suitability of land use under different scenarios, and finally determines the urban development boundary and the ecological control line based on the law of diminishing marginal utility. The framework takes care of the planning objectives of development management and ecological protection but does not give enough attention to agricultural land protection. Also, it is a conceptual framework whose applicability requires more empirical study. Moreover, the Planning Institution of China Center for Urban Development (PICCUD) [16] proposed a framework for planning the “three-space” and “three-line” based on the evaluation of ecological, agricultural, and urban development suitability. However, the framework does not provide effective techniques to handle the conflicts and make compromises among the multiple objectives, and the planning alternatives depend greatly on the planner’s understanding of local development strategies. Zhang et al. [12] developed a method to optimize the spatial allocation of the “three-space” by taking advantage of spatial optimization modeling and the genetic algorithm, but this method is not effective to assist decision making in “three-line” planning.
Among the two approaches for “three-space” and “three-line” planning, the second approach has been considered more applicable to China’s new-round spatial planning since the first approach fails to assist planning after 2020. However, two issues require further research in order to implement the second approach: (1) how to develop a rational and empirical framework that provides a clear workflow for the planning implementation; (2) what techniques can be used to handle the multiple planning objectives and assist decision making. Besides, even though the Chinese government has suggested implementing “three-space” and “three-line” planning at the province, city, and county level, the pilot planning practices indicate that it is difficult to make rational planning of “three-space” and “three-line” spatial allocation at the province level. As a result, some planners and researchers suggest designing the percentages of the “three-space” in province-level planning, while planning their spatial distribution in city or county level planning [11,14,17,18]. We agree on this viewpoint and propose a framework for China’s county-level “three-space” and “three-line” planning.
This article proposes a rational planning with multi-criteria evaluation and spatial optimization (RP-MCE-SOP) framework for China’s county-level “three-space” and “three-line” planning. The framework solves the planning problem by following the rational planning model and integrating the techniques of multi-criteria evaluation (MCE) and spatial optimization (SOP). The remainder of this article is organized as follows: Section 2 makes an introduction and a literature review of the rational planning model, multi-criteria evaluation (MCE) and spatial optimization (SOP) techniques. Section 3 presents and describes the workflow of the RP-MCE-SOP framework. Section 4 conducts a case study in a county-level division in China—Dongxihu District of Wuhan City—to illustrate how the framework works, test its feasibility and identify its challenges. Section 5 concludes the article, discusses its limitations and identifies further research directions.

2. Rational Planning, Multi-Criteria Evaluation, and Spatial Optimization

The RP-MCE-SOP framework is proposed to support “three-space” and “three-line” planning by following the rational planning model and integrating the techniques of multi-criteria evaluation (MCE) and spatial optimization (SOP). This section makes a literature review of the rational planning model, MCE, and SOP techniques.

2.1. Rational Planning Model

The rational planning model advocates a systematic forward progression from goal setting to implementation and back again through a feedback loop [19]. It emphasizes taking advantages of available data, information, analysis, and modeling efforts to generate rational planning alternatives. The land use planning framework proposed by the Food and Agriculture Organization of the United Nations (FAO) is a typical example of the rational planning model. There are two major procedures to generate planning alternatives by following the framework: land suitability evaluation and land allocation. Land suitability evaluates to what extent each land unit in the planning area is suitable for different land uses. Land allocation spatially allocates appropriate use to land units based on their land suitability levels [19,20]. Land suitability evaluation is the fundamental step of the land allocation procedure.

2.2. Multi-Criteria Evaluation (MCE)

Multi-criteria evaluation (MCE), also known as multi-criteria decision making, aims to investigate a number of choice possibilities in light of multiple criteria and conflicting objectives. Land suitability evaluation is an MCE problem since multiple criteria have to be evaluated to determine the suitability level of land units for specific use [21]. MCE is usually implemented with the support of GIS for land suitability evaluation. Table 1 makes a summary of the MCE methods widely applied to land suitability evaluation and illustrates the main characteristics of each method.

2.3. Spatial Optimization (SOP)

Spatial optimization (SOP) attempts to find the solutions that maximize or minimize one or more objectives subject to a few constraints, and spatial attributes, patterns or relationships that need to be handled. SOP is suitable for solving planning problems by following the rational planning model: the planning goals can be represented with the objectives; physical, socio-economic, and policy background can be incorporated and represented with the constraints; the planning alternatives can be generated through solving the SOP problem. Several SOP techniques, such as simulated annealing (SA), genetic algorithm (GA), particle swarm optimization (PSO), and ant colony optimization (ACO) have been developed and applied to land use planning, landscape planning, forest planning, natural reserve planning, and so forth [25,27,28,29,30,31,32,33].
Aerts and Heuvelink [30] applied SA to solve a multi-site land allocation problem by considering the objectives of minimizing development costs and maximizing spatial compactness of land use with a simulated dataset. Cao et al. [34] developed a boundary-based fast genetic algorithm (BFGA) to search for optimal planning solutions for sustainable land use. The solutions are achieved based on the trade-offs among economic, ecological, and social benefits, which were evaluated with GDP and land conversion cost, geological suitability and green space size, transportation accessibility and Not in My Back Yard influence (NIMBY), respectively. Liu et al. [35] developed a modified PSO algorithm for multi-objective (maximizing economic, social, and ecological benefits) land use planning in a coastal town in China by designing three patch-level operators. The economic, social, and ecological benefits are simply represented with the compactness level of land use, the scale of urban sprawl, and the area of forest, respectively. Masoomi et al. [36] developed a multi-objective particle swarm optimization algorithm (MOPSO) to find the optimum arrangement of urban land uses in parcel level by considering the objectives of maximizing compatibility, dependency, suitability, and compactness of land uses. Liu et al. [37] developed a multi-type ant colony optimization (MACO) algorithm for optimal land allocation in Panyu District of Guangzhou City by integrating the objectives of maximizing land suitability and spatial compactness and minimizing land conversion cost. The land suitability is evaluated by a linear combination of fourteen factors.
To summarize, even though SOP techniques have been widely applied to solve planning problems, previous research usually focuses on algorithm design. Planning problems are often simplified to implement and test the algorithms. For instance, economic, social, and ecological benefits or suitability are often evaluated with one or two simplified indicators. Little research has concentrated on taking advantage of SOP techniques to solve real-life planning problems that are more complicated. Because of this research gap, this article takes advantages of SOP techniques and real data to solve a real-life planning problem (“three-space” and “three-line” planning) at China’s county-level and conducts a case study in a real planning area.

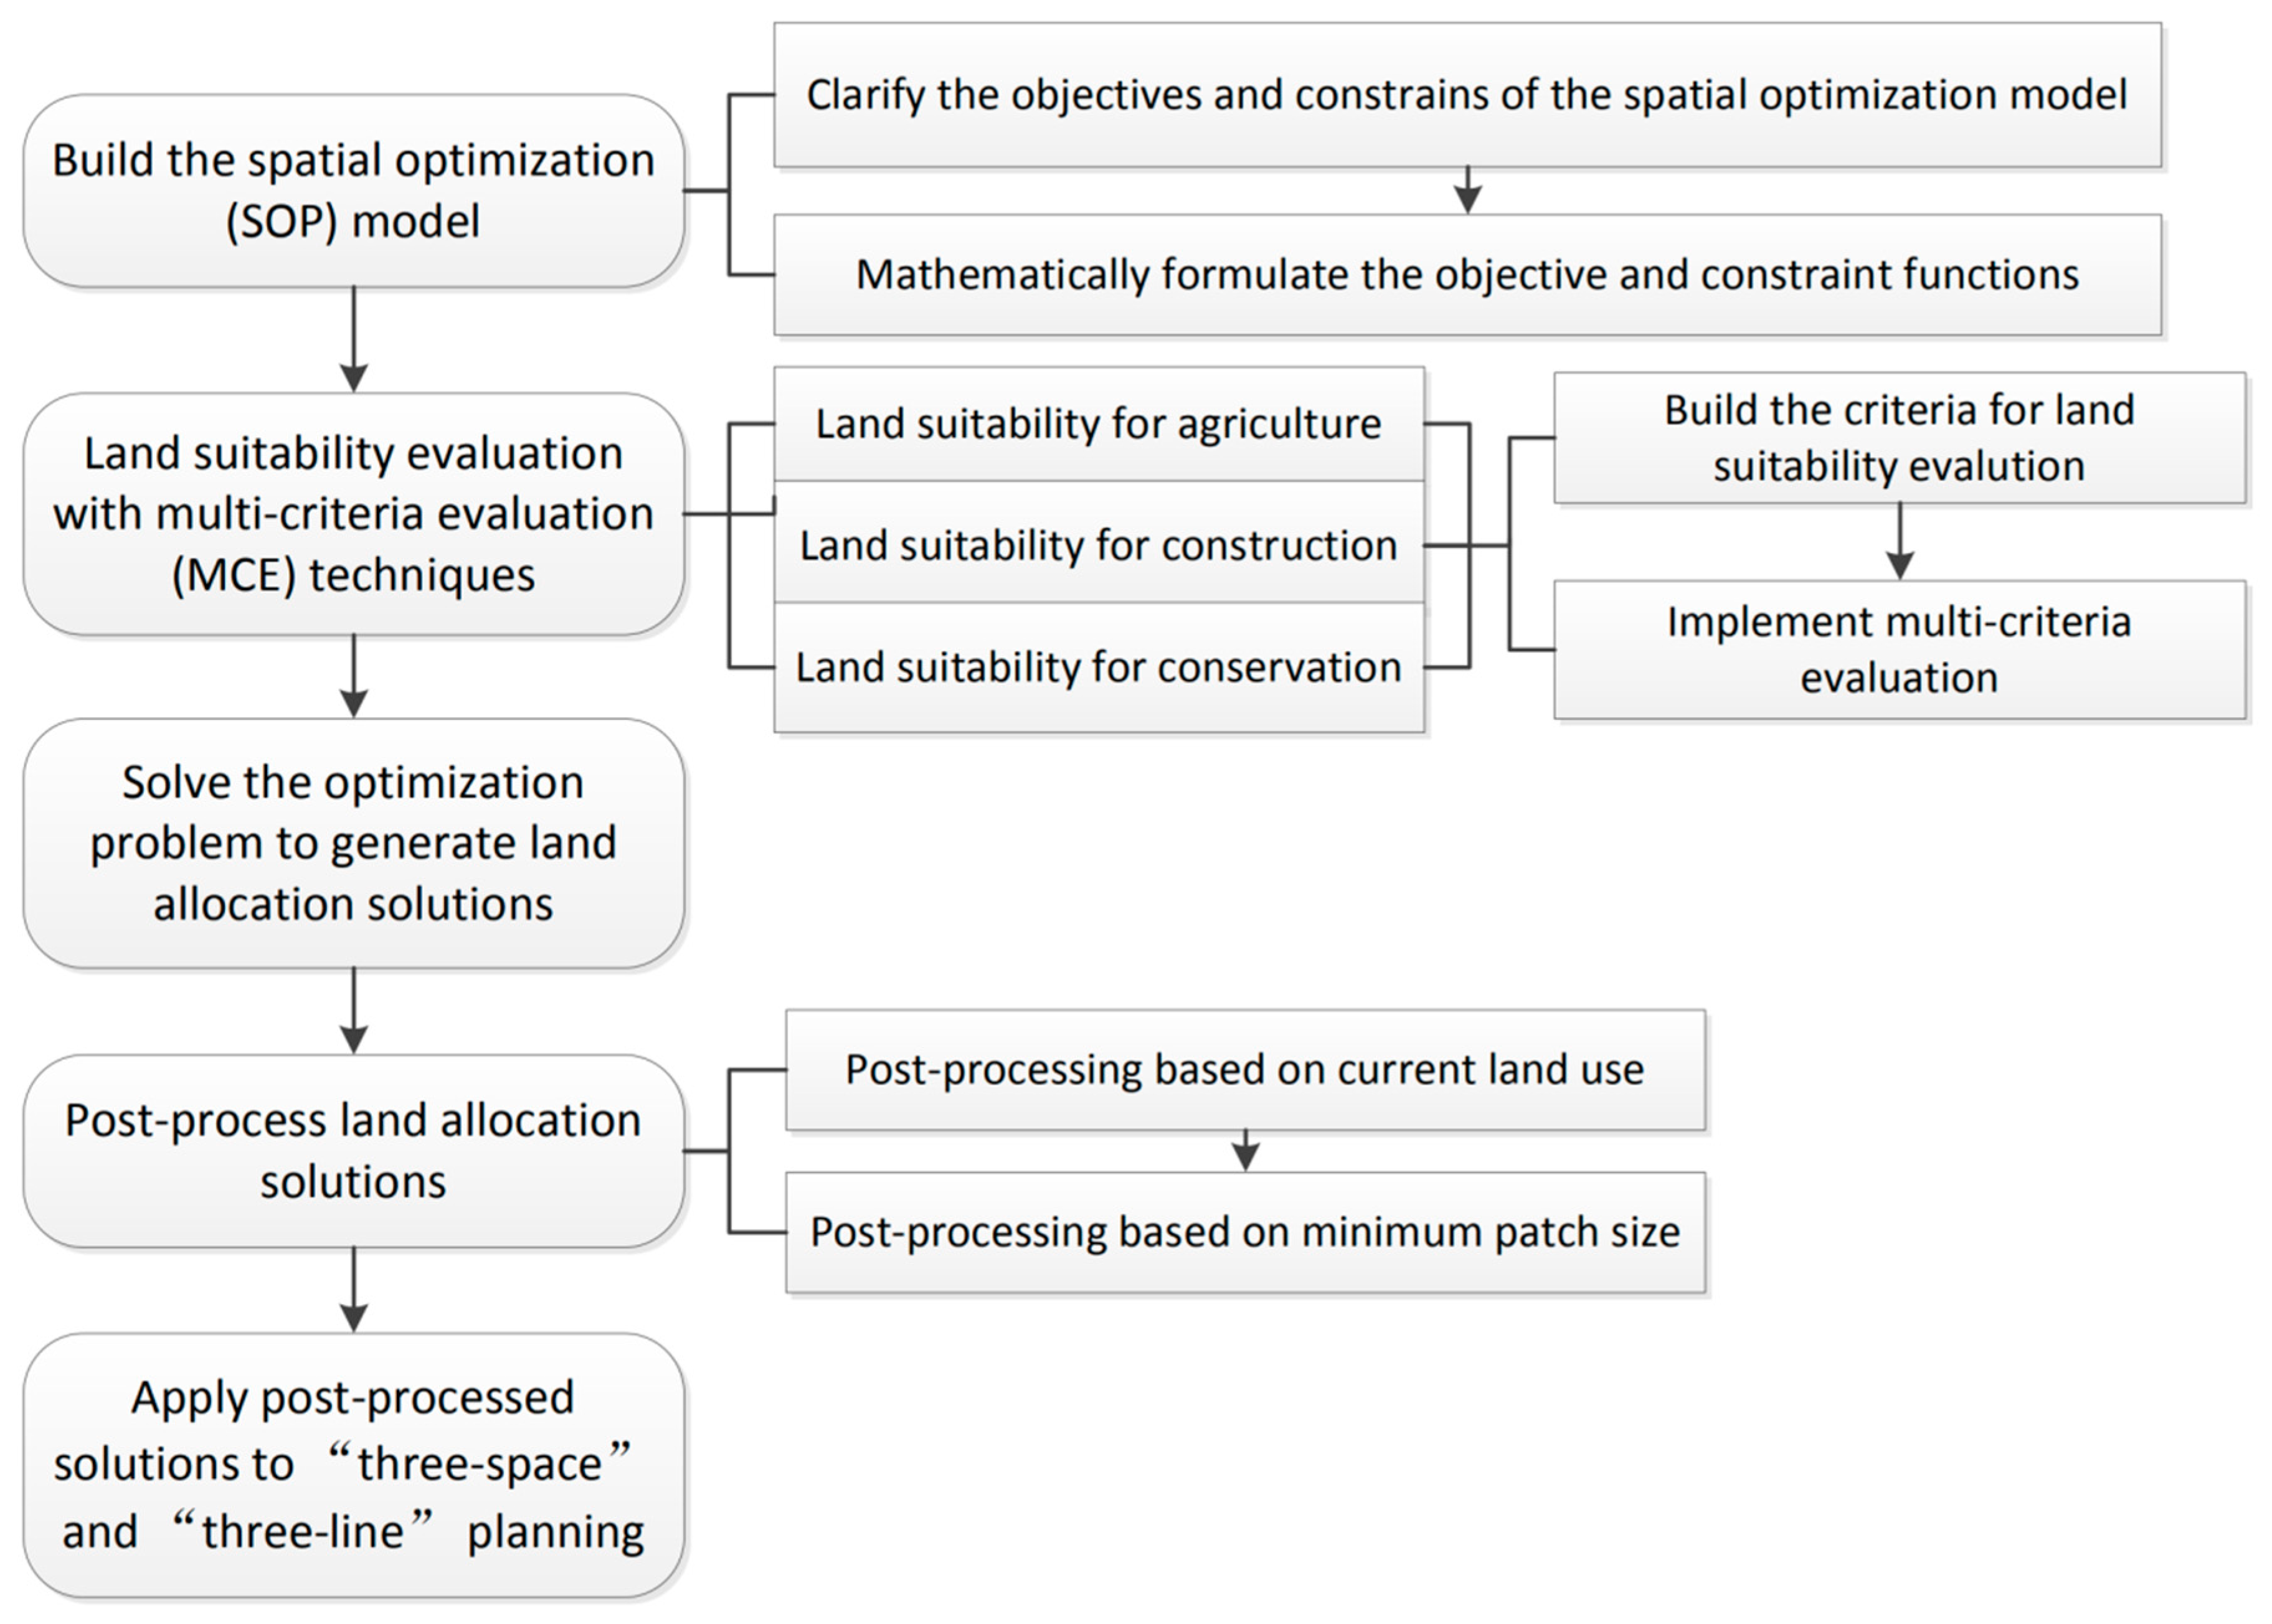
3. The RP-MCE-SOP Framework

The RP-MCE-SOP framework followed the rational planning model and integrated land suitability evaluation and land allocation procedures into a five-step workflow (Figure 1). Step-1 explicitly interpreted the planning problem as an SOP problem and built the SOP model. Step-2 implemented the land suitability evaluation for agriculture, construction, and conservation respectively with MCE techniques, and the evaluation results were used in the SOP model. Step-3 solved the SOP problem to generate land allocation alternatives. Step-4 post-processed the solutions generated in Step-3 by identifying the irrational pixels and redesigning their use based on planning knowledge. Step-5 applied the post-processed solutions to the “three-space” and “three-line” planning.

4. Case Study

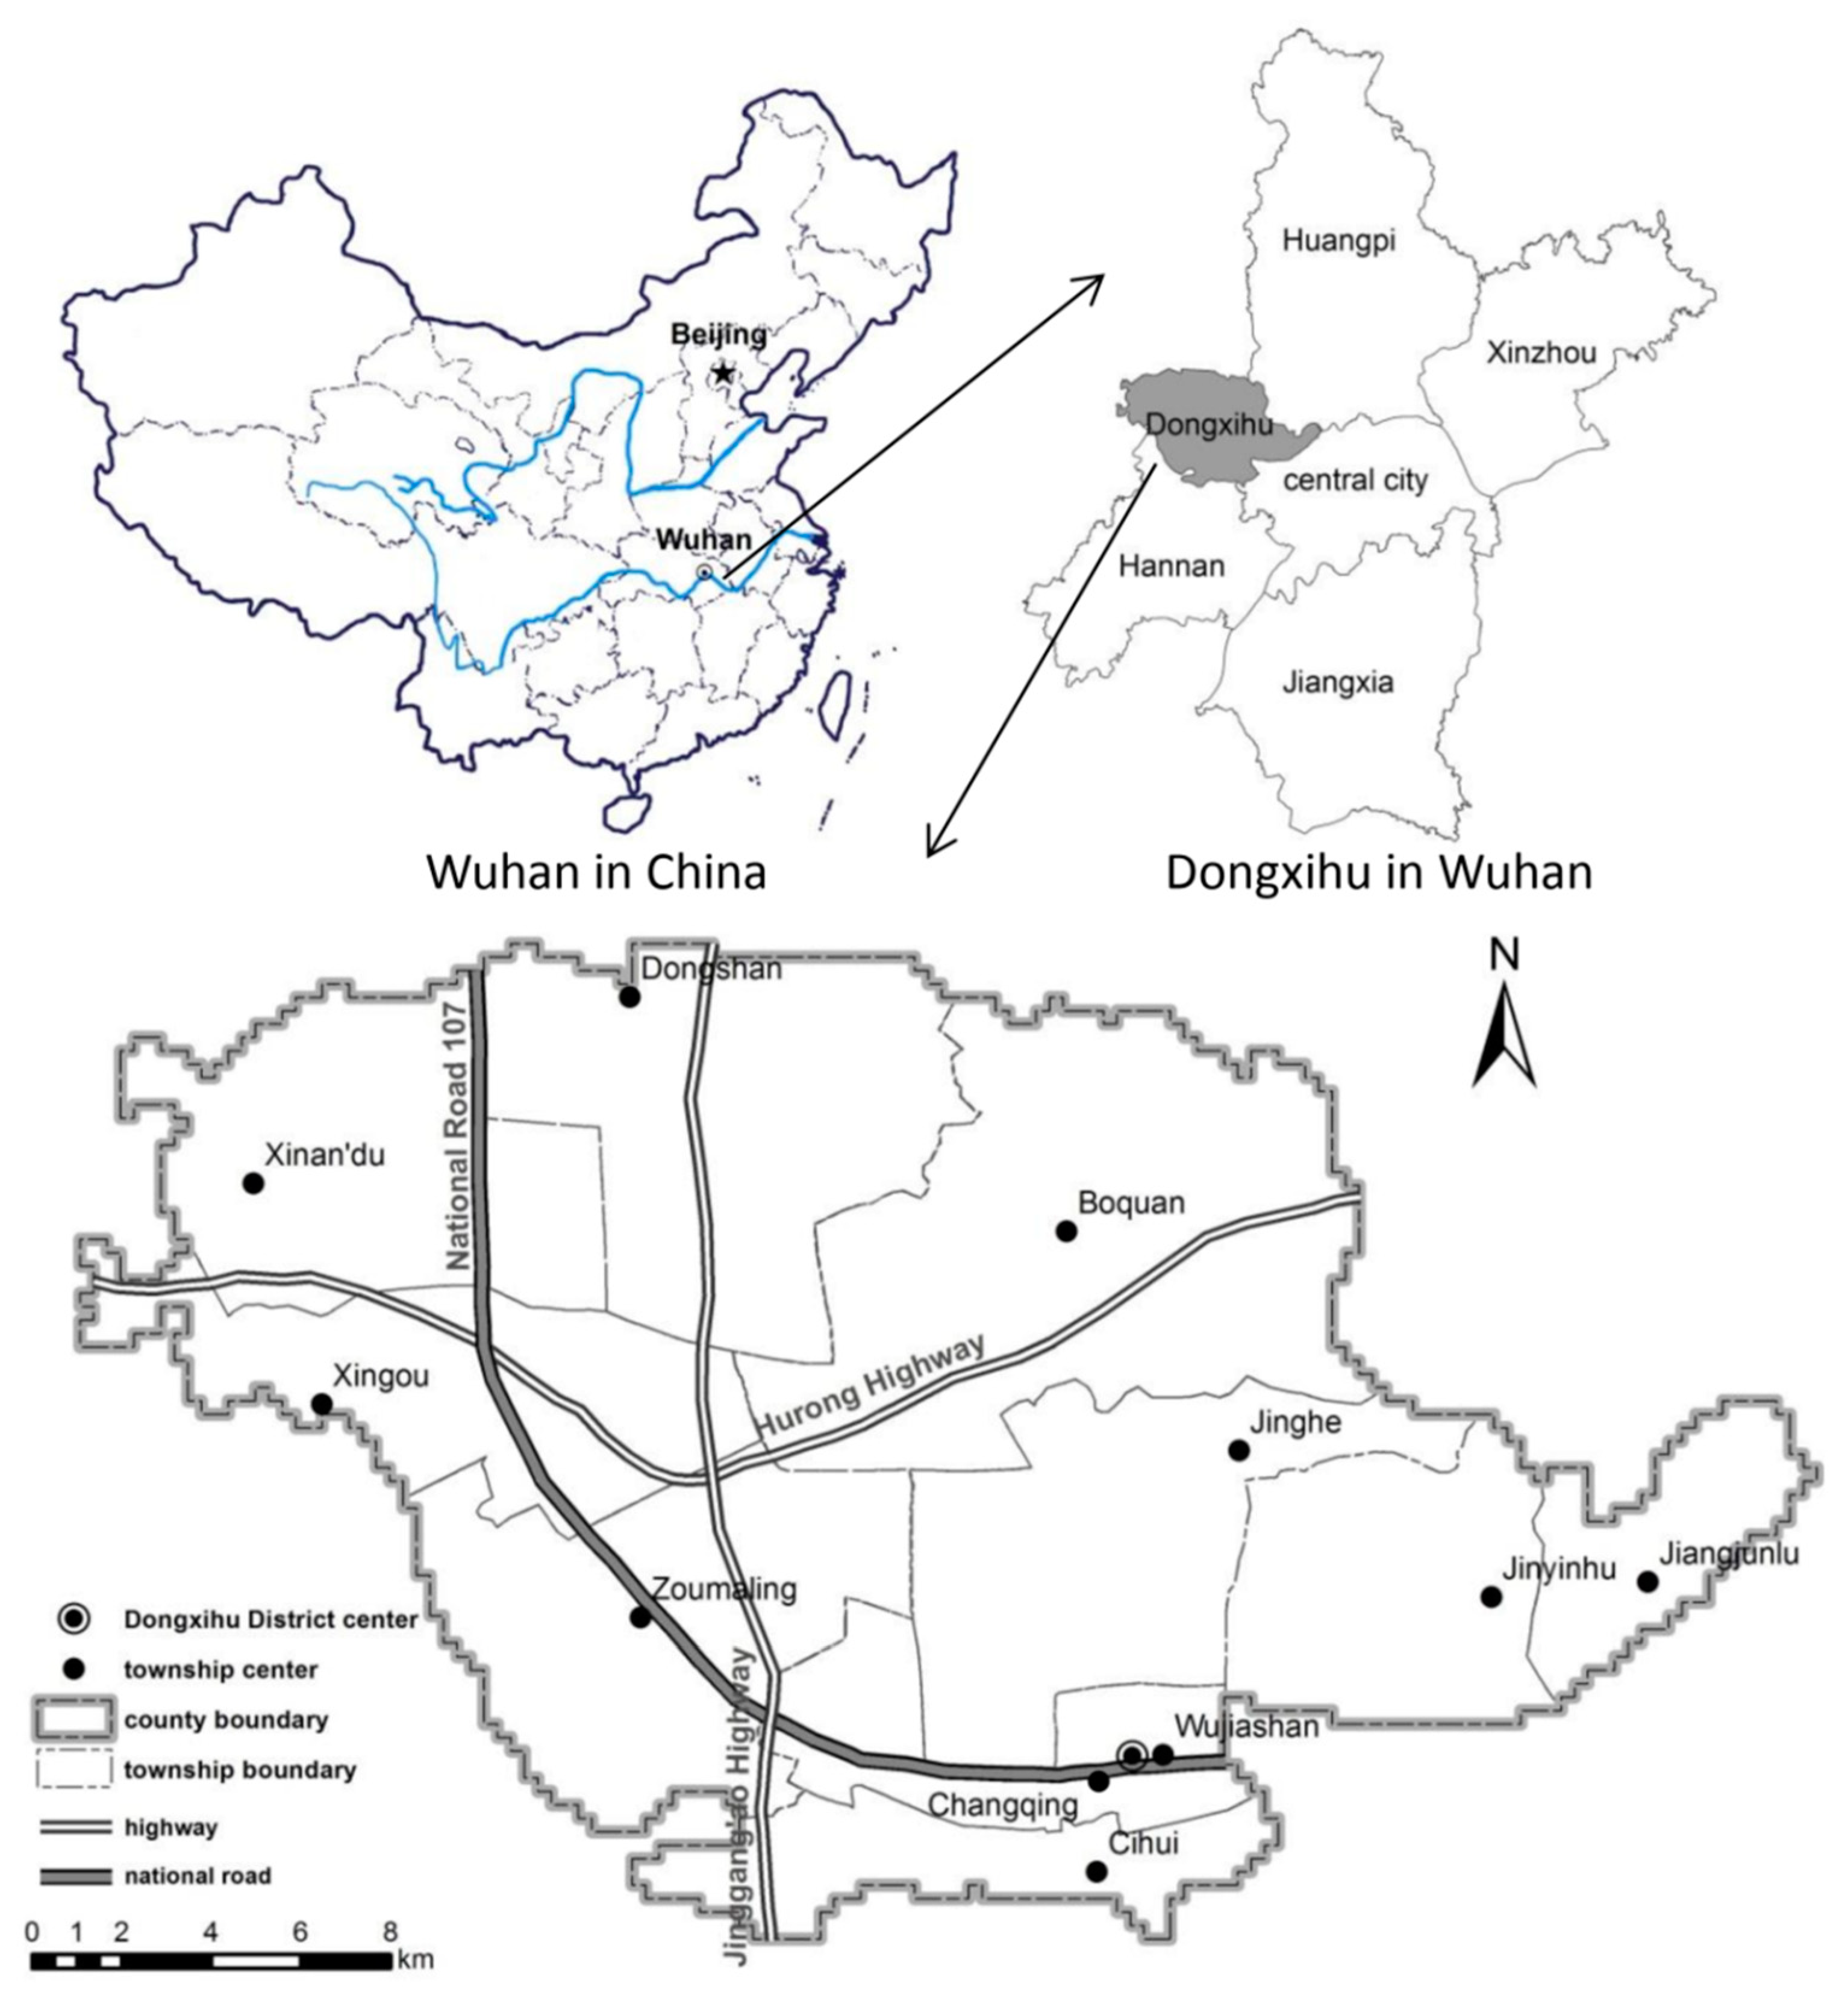
4.1. Study Area and Data

Dongxihu District is a county-level division in Wuhan City, China, with a total area of 496 km2. It includes ten townships of Wujiashan, Jiangjunlu, Jinyinhu, Jinghe, Cihui, Boquan, Dongshan, Xin’andu, Xingou, and Zoumaling. Wujiashan is the urban, socio-economic, and political center. The urban area is mainly in the townships of Wujiashan, Jiangjunlu, Jinyinhu, and Jinghe. Jinggang’ao Highway, Hurong Highway, and National Road 107 cross the area (Figure 2). Dongxihu District is located in the suburban area of the Wuhan metropolitan area. It is also a National Ecological Demonstration Area with precious ecological resources of lakes, wetlands, and urban forests. Land use in Dongxihu District suffers great pressure from urban sprawl. Spatial planning has to handle the multiple objectives of urban development management, agricultural land protection, and ecological resource protection. Therefore, it is highly suitable to be selected as the case study area for testing the proposed framework for “three-space” and “three-line” planning. The data used for the case study and their sources are listed in Table 2.
Current land use data were obtained through combination and reclassification of two datasets: the GlobelLand30 land cover data and the 1:10,000 land use map (2010). In response to the requirements of “three-space” planning,” this research reclassified land use into three types: agricultural land, construction land, and conservation land. Conservation land is the combination of forest, grassland, wetland, and water bodies. In China’s county-level land use planning, the suggested scale of the planning maps is 1:50,000, and the smallest patch shown on the planning maps is 5 hectares or 25 hectares [38]. “Three-space” and “three-line” planning designs spatial allocation pattern of agricultural, urban and rural construction, and ecological space and delineates control boundaries with which other spatial planning needs to keep consistent. Meanwhile, it gives other spatial planning projects some flexibility in planning land use at the local level. Therefore, the spatial resolution of the “three-space” and “three-line” planning maps should not be higher than that of the land use planning maps. Based on this context, we represented the planning area with a grid of cells; each cell represented a 300 m × 300 m (9 hectares) area in real life. However, if a patch was composed of less than 3 cells, it was not be shown on the map. This indicates that the smallest patch on the current land use map (Figure 3d) and the “three-space” and “three-line” planning maps is 27 hectares. This representation method takes care of the spatial resolution requirement of the planning and helped maintain the shape of patches. The reclassified current land use map is shown in Figure 3d.

4.2. Implementation of the RP-MCE-SOP Framework in Dongxihu District of Wuhan City

4.2.1. Building the Spatial Optimization Model

“Three-space” and “three-line” planning plays a connection and coordination role in China’s county-level “multiple-plan integration.” It has to fulfill the standards imposed by city-level or province-level planning. Also, it provides guidance and basic control lines for other county-level spatial planning. Besides, it attempts to handle the multiple planning objectives of development management, agricultural land preservation, and ecological resource protection.
The “three-space” includes agricultural space, urban and rural construction space, and ecological space, and “three-space” planning allocates each land unit for one of the three uses (agriculture, construction or conservation). Meanwhile, in the planning context, land units allocated for the same use are expected to be compactly allocated. Based on this background, four objectives were designed in the SOP model for “three-space” and “three-line” planning, including maximizing agricultural, construction, and ecological suitability, respectively, and maximizing spatial compactness. Moreover, county-level planning has to fulfill area or percentage limits for each space imposed by the higher-level (provincial-level or city-level) government. These limits were incorporated into the SOP model as constraints. Another constraint was to protect current conservation land from being used for agricultural or construction activities.
The planning area was represented with a grid, and each cell in the grid represented a land unit. The mathematical formulation of the SOP model is as follows.
Objective 1: maximize agricultural suitability
S u i t a g r = i = 1 M j = 1 N S i j a g r x i j a g r
Objective 2: maximize construction suitability
S u i t c s t = i = 1 M j = 1 N S i j c s t x i j c s t
Objective 3: maximize ecological suitability
S u i t c s v = i = 1 M j = 1 N S i j c s v x i j c s v
Objective 4: maximize spatial compactness. It is represented by maximizing the number of cells allocated for the same use in each cell’s eight neighboring cells
C o m p a c t n e s s = k = 1 K i = 1 N j = 1 M b i j k x i j k
where:
b i j k = x i 1   j   k + x i + 1   j   k + x i   j 1   k + x i   j + 1   k + x i 1   j 1   k + x i 1   j + 1   k + x i + 1   j 1   k + x i + 1   j + 1   k .
Equations (4) and (5) can be better explained with Figure 4. In spatial planning, we expect compact land allocation patterns (like Figure 4b) rather than scattered or random land allocation patterns (like Figure 4a). In Figure 4c, for cell R2 and R3, there are seven or eight neighboring cells allocated for the same use with the cell; this pattern encouraged compact land allocation. In contrast, for cell R1, there is only one cell allocated for the same use with the cell; this pattern resulted in scattered land allocation.
Constraints:
The upper and lower limit for the number of cells allocated for each use.
A k m i n i = 1 M j = 1 N x i j k A k m a x
Current conservation land is protected from agricultural or construction activities.
x i j c s v = 1 ,   W h e n   L U C i j c s v = 1
In the above formulas, K is the number of land use types. M and N are the total number of rows and columns of the planning area. When cell ( i , j ) is allocated for land use k , x i j k = 1; otherwise, x i j k = 0 . Specifically, when cell ( i , j ) is allocated for agriculture, x i j a g r = 1 ; otherwise, x i j a g r = 0 . Similarly, x i j c s t = 1 and x i j c s v = 1 represent cell ( i , j ) is used for construction and conservation, respectively. S i j a g r , S i j c s t , and S i j c s v are the land suitability level of cell ( i , j ) used for agriculture, construction, and conservation, respectively, also the objective function value (OFV) of the land allocation solution for Objective 1, 2 and 3, respectively. C o m p a c t n e s s is the spatial compactness level. L U C i j c s v = 1 represents cell ( i , j ) is currently used for conservation. A k m i n and A k m a x are the lower and higher limits for the number of units allocated for land use k , respectively (Table 3). They are set based on the Comprehensive Land Use Planning of Wuhan (2006–2020), the Outline for Comprehensive Land Use Planning in Dongxihu District, Wuhan (2006–2020), the Urban Comprehensive Planning of Wuhan (2010–2020), and the knowledge of planners in the Department of Land, Resource and Planning of Dongxihu District [39,40,41].

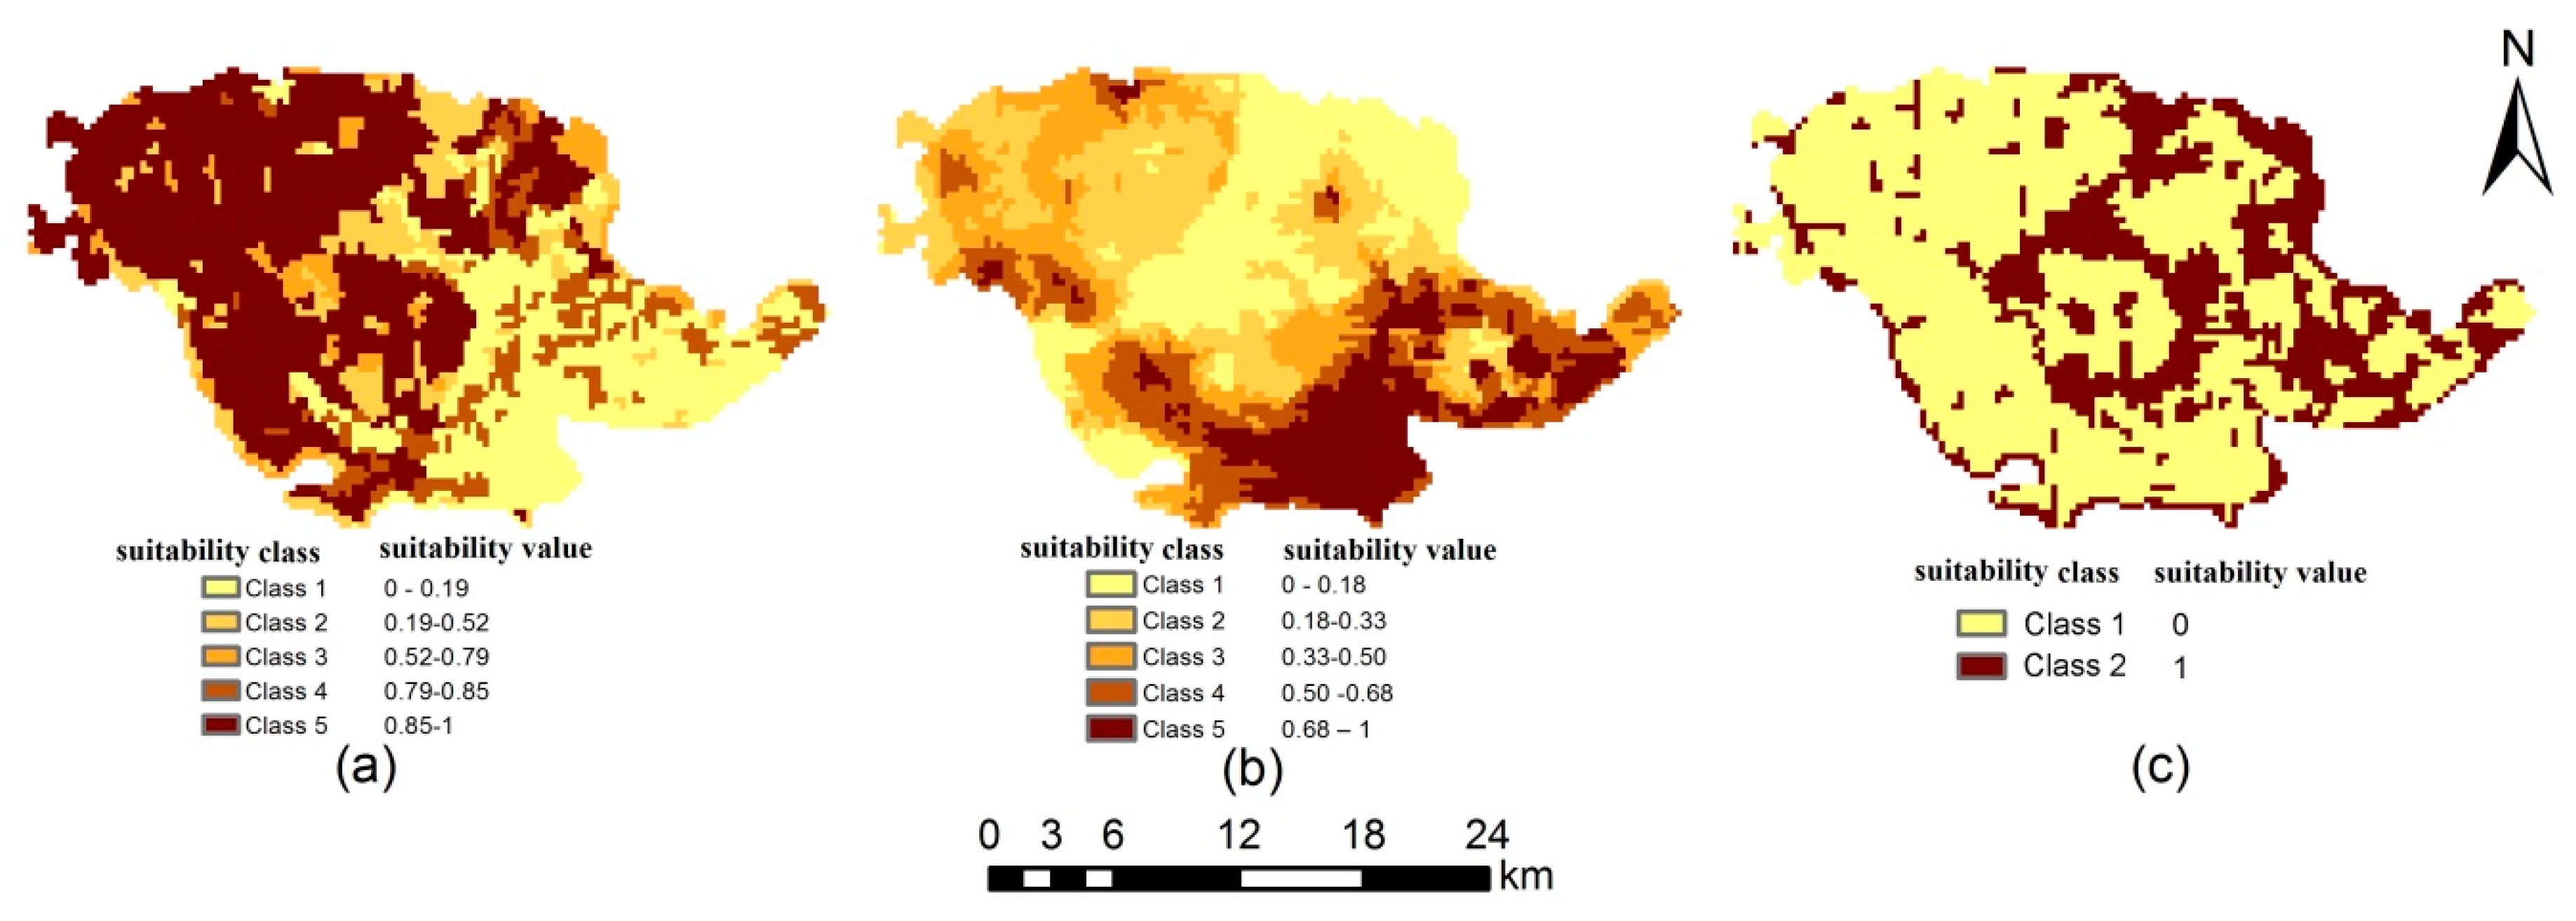
4.2.2. Land Suitability Evaluation with Multi-Criteria Evaluation

Land suitability evaluation is an important procedure in the rational planning model. Also, the land suitability levels of each unit for agriculture, construction, and conservation ( S i j a g r ,   S i j c s t   and   S i j c s v in Equations (1)–(3)) are important parameters in the SOP model. The evaluation of land suitability for a specified use is a MCE problem. There are two main tasks: establishing the criteria for the evaluation and implementing the MCE to obtain evaluation results.
(1) Land Suitability Evaluation Criteria
Much research has been done on the evaluation of land suitability for agriculture, construction, and conservation. Based on the criteria in previous research, the local contexts of Dongxihu District, and the requirements of “three-space” and “three-line” planning, this article establishes the criteria in Table 4, Table 5 and Table 6 for the evaluation of land suitability for agriculture, construction, and conservation, respectively.
(2) Land Suitability Evaluation Methods and Results
As to the land suitability evaluation for agriculture and construction, the multiple criteria were evaluated and aggregated through the analytical hierarchy analysis (AHP) method assisted with the knowledge of local experts [23]. The land suitability level of each cell for a specified use was finally normalized to the range [0, 1] through dividing it by the highest suitability level of all cells for the same use in the whole area. Then, all land units were classified into five classes based on their land suitability for agriculture and construction, respectively. The classification was done through the Jenks natural breaks classification method to minimize the variance within classes and maximize the variance between classes [58]. The land suitability level increased from Class 1 to Class 5. Figure 5a,b are the land suitability classification maps for agriculture and construction, respectively.
As for the land suitability evaluation for conservation, the multiple criteria were combined through (OR) Boolean aggregation; once a cell meets one or more criteria, it was given a suitability value of 1; otherwise, it was given a suitability value of 0. This Boolean aggregation method was adopted because meeting any criterion would make the land unit ecologically sensitive or significant, and therefore it needed to be protected from agricultural or construction activities. Then, based on the land suitability value, all land units were classified into two classes. Class 1 included the land units suitable for conservation, while Class 2 included the land units not suitable for conservation. Figure 5c is the land suitability classification map for conservation.
Readers can get more information about the land suitability evaluation procedure from our previous research [59].

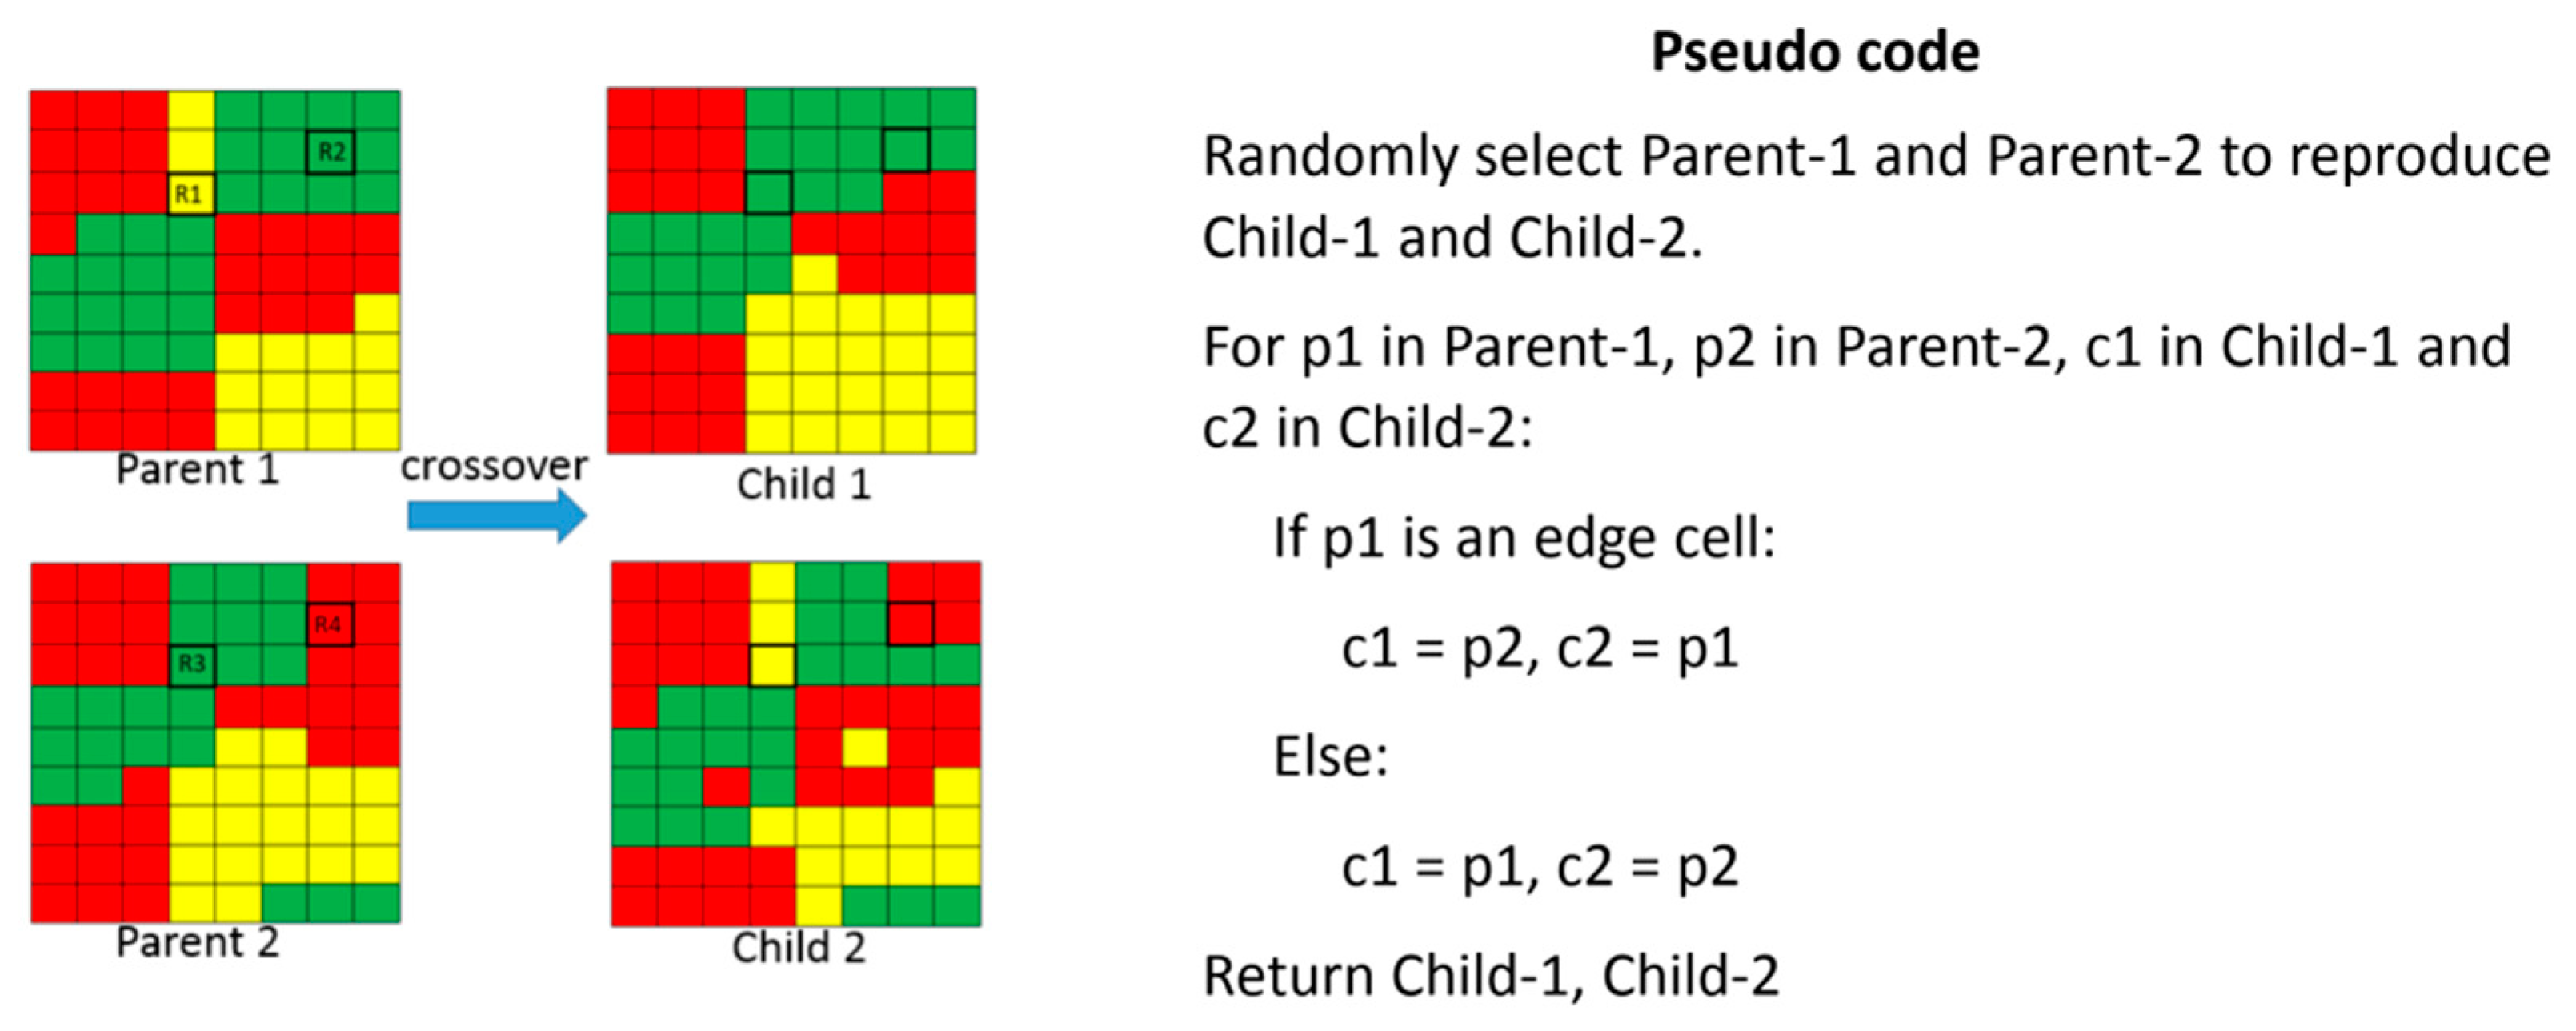
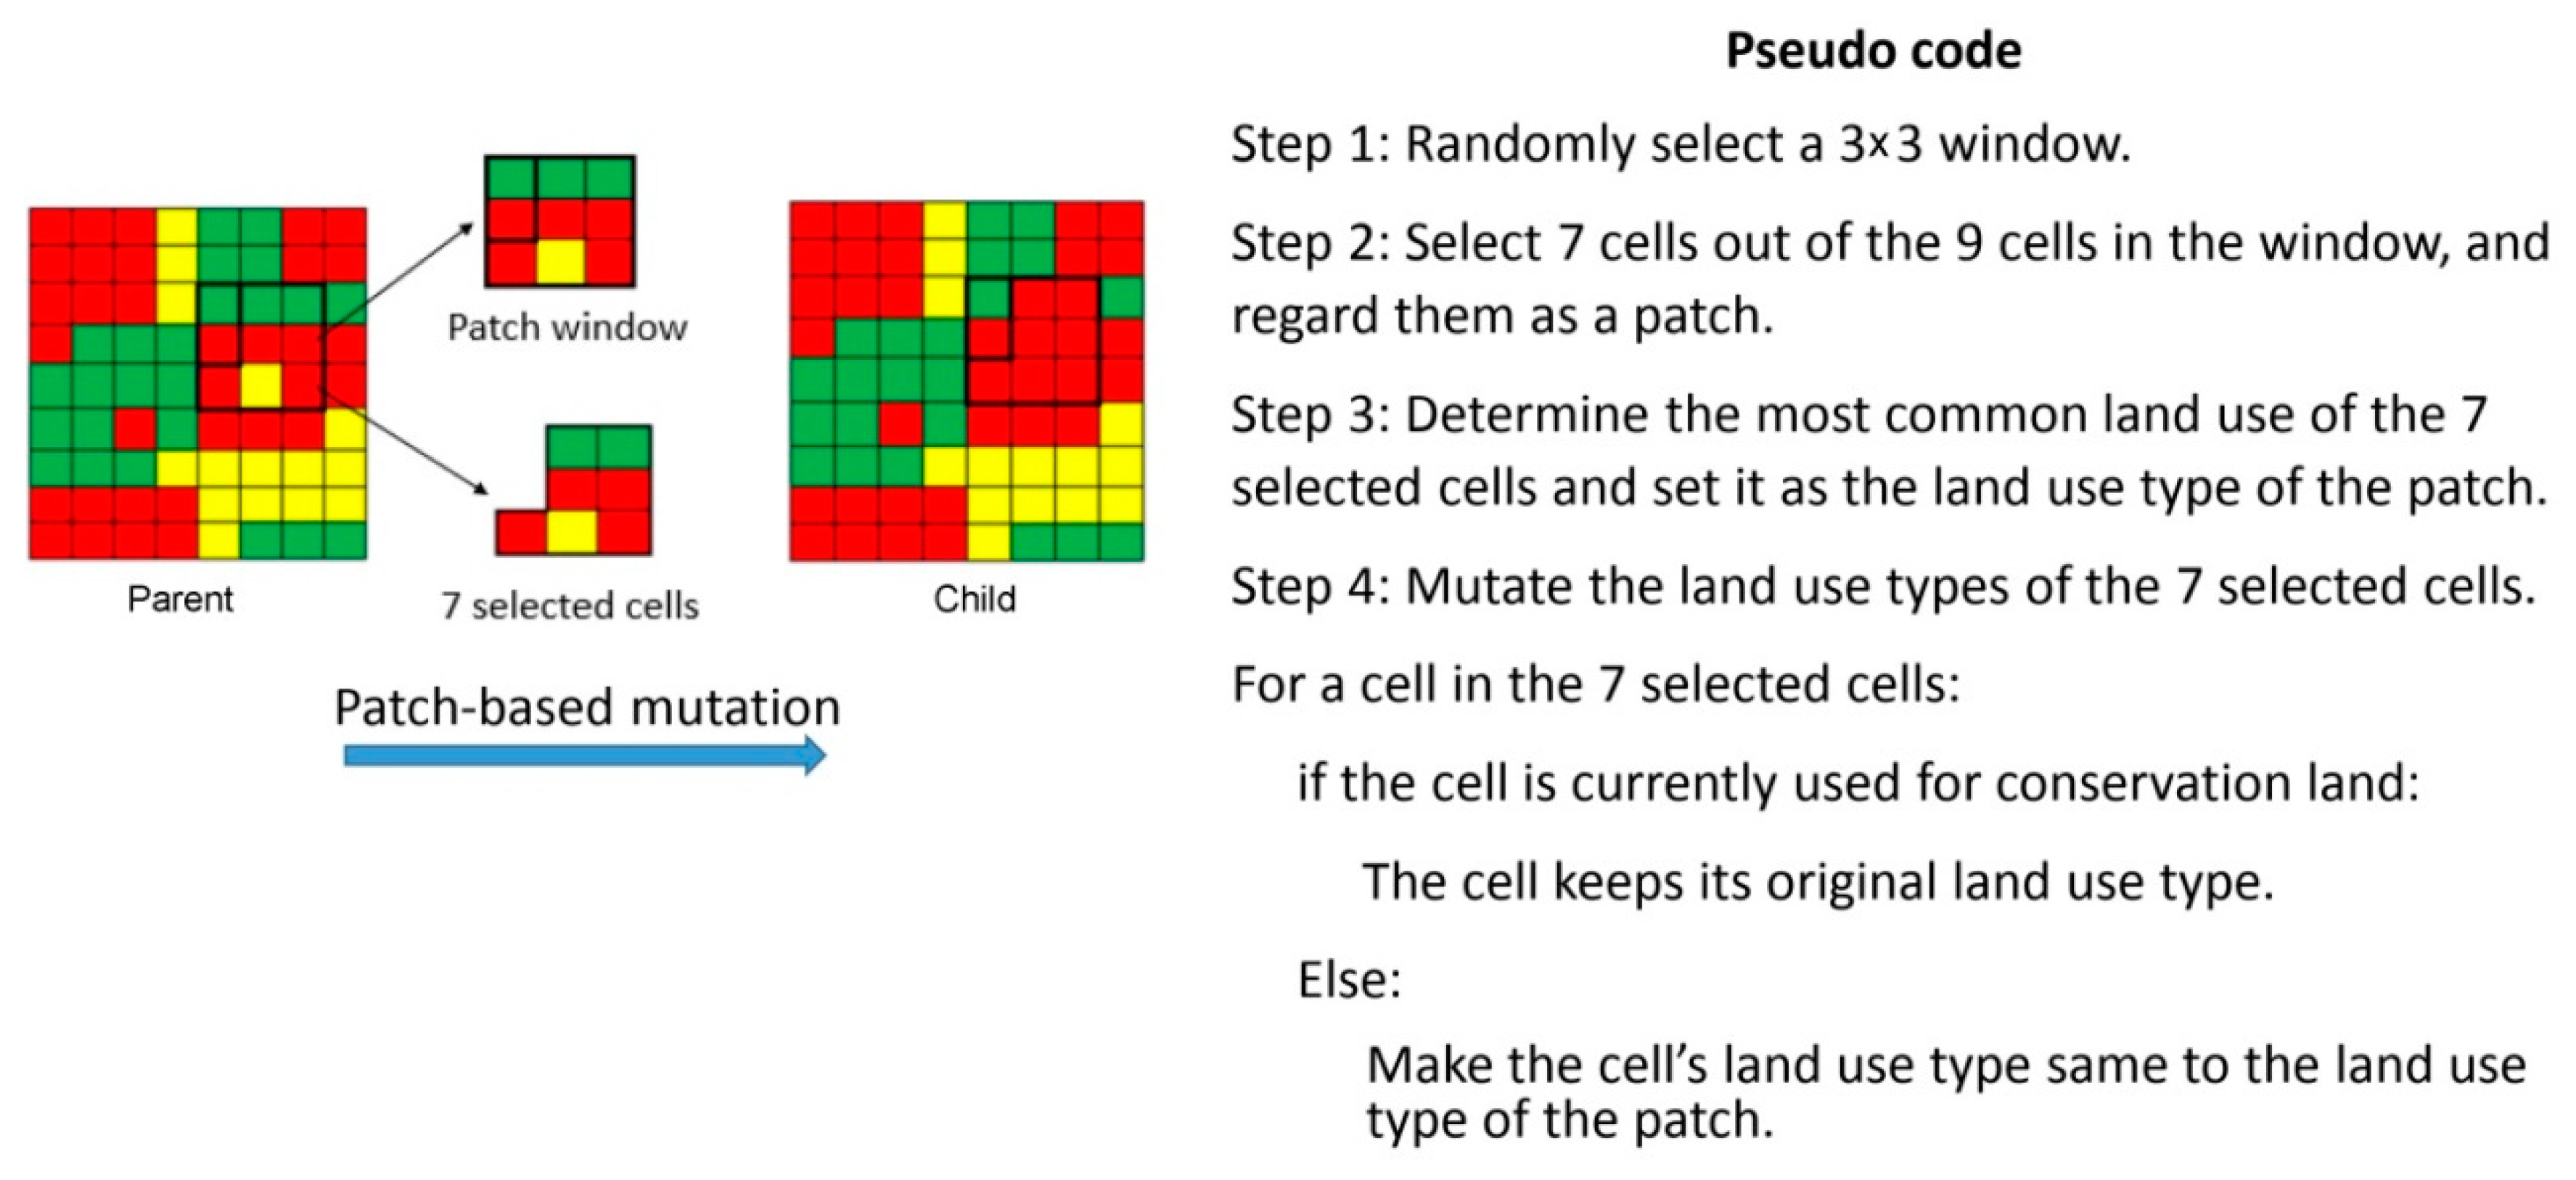
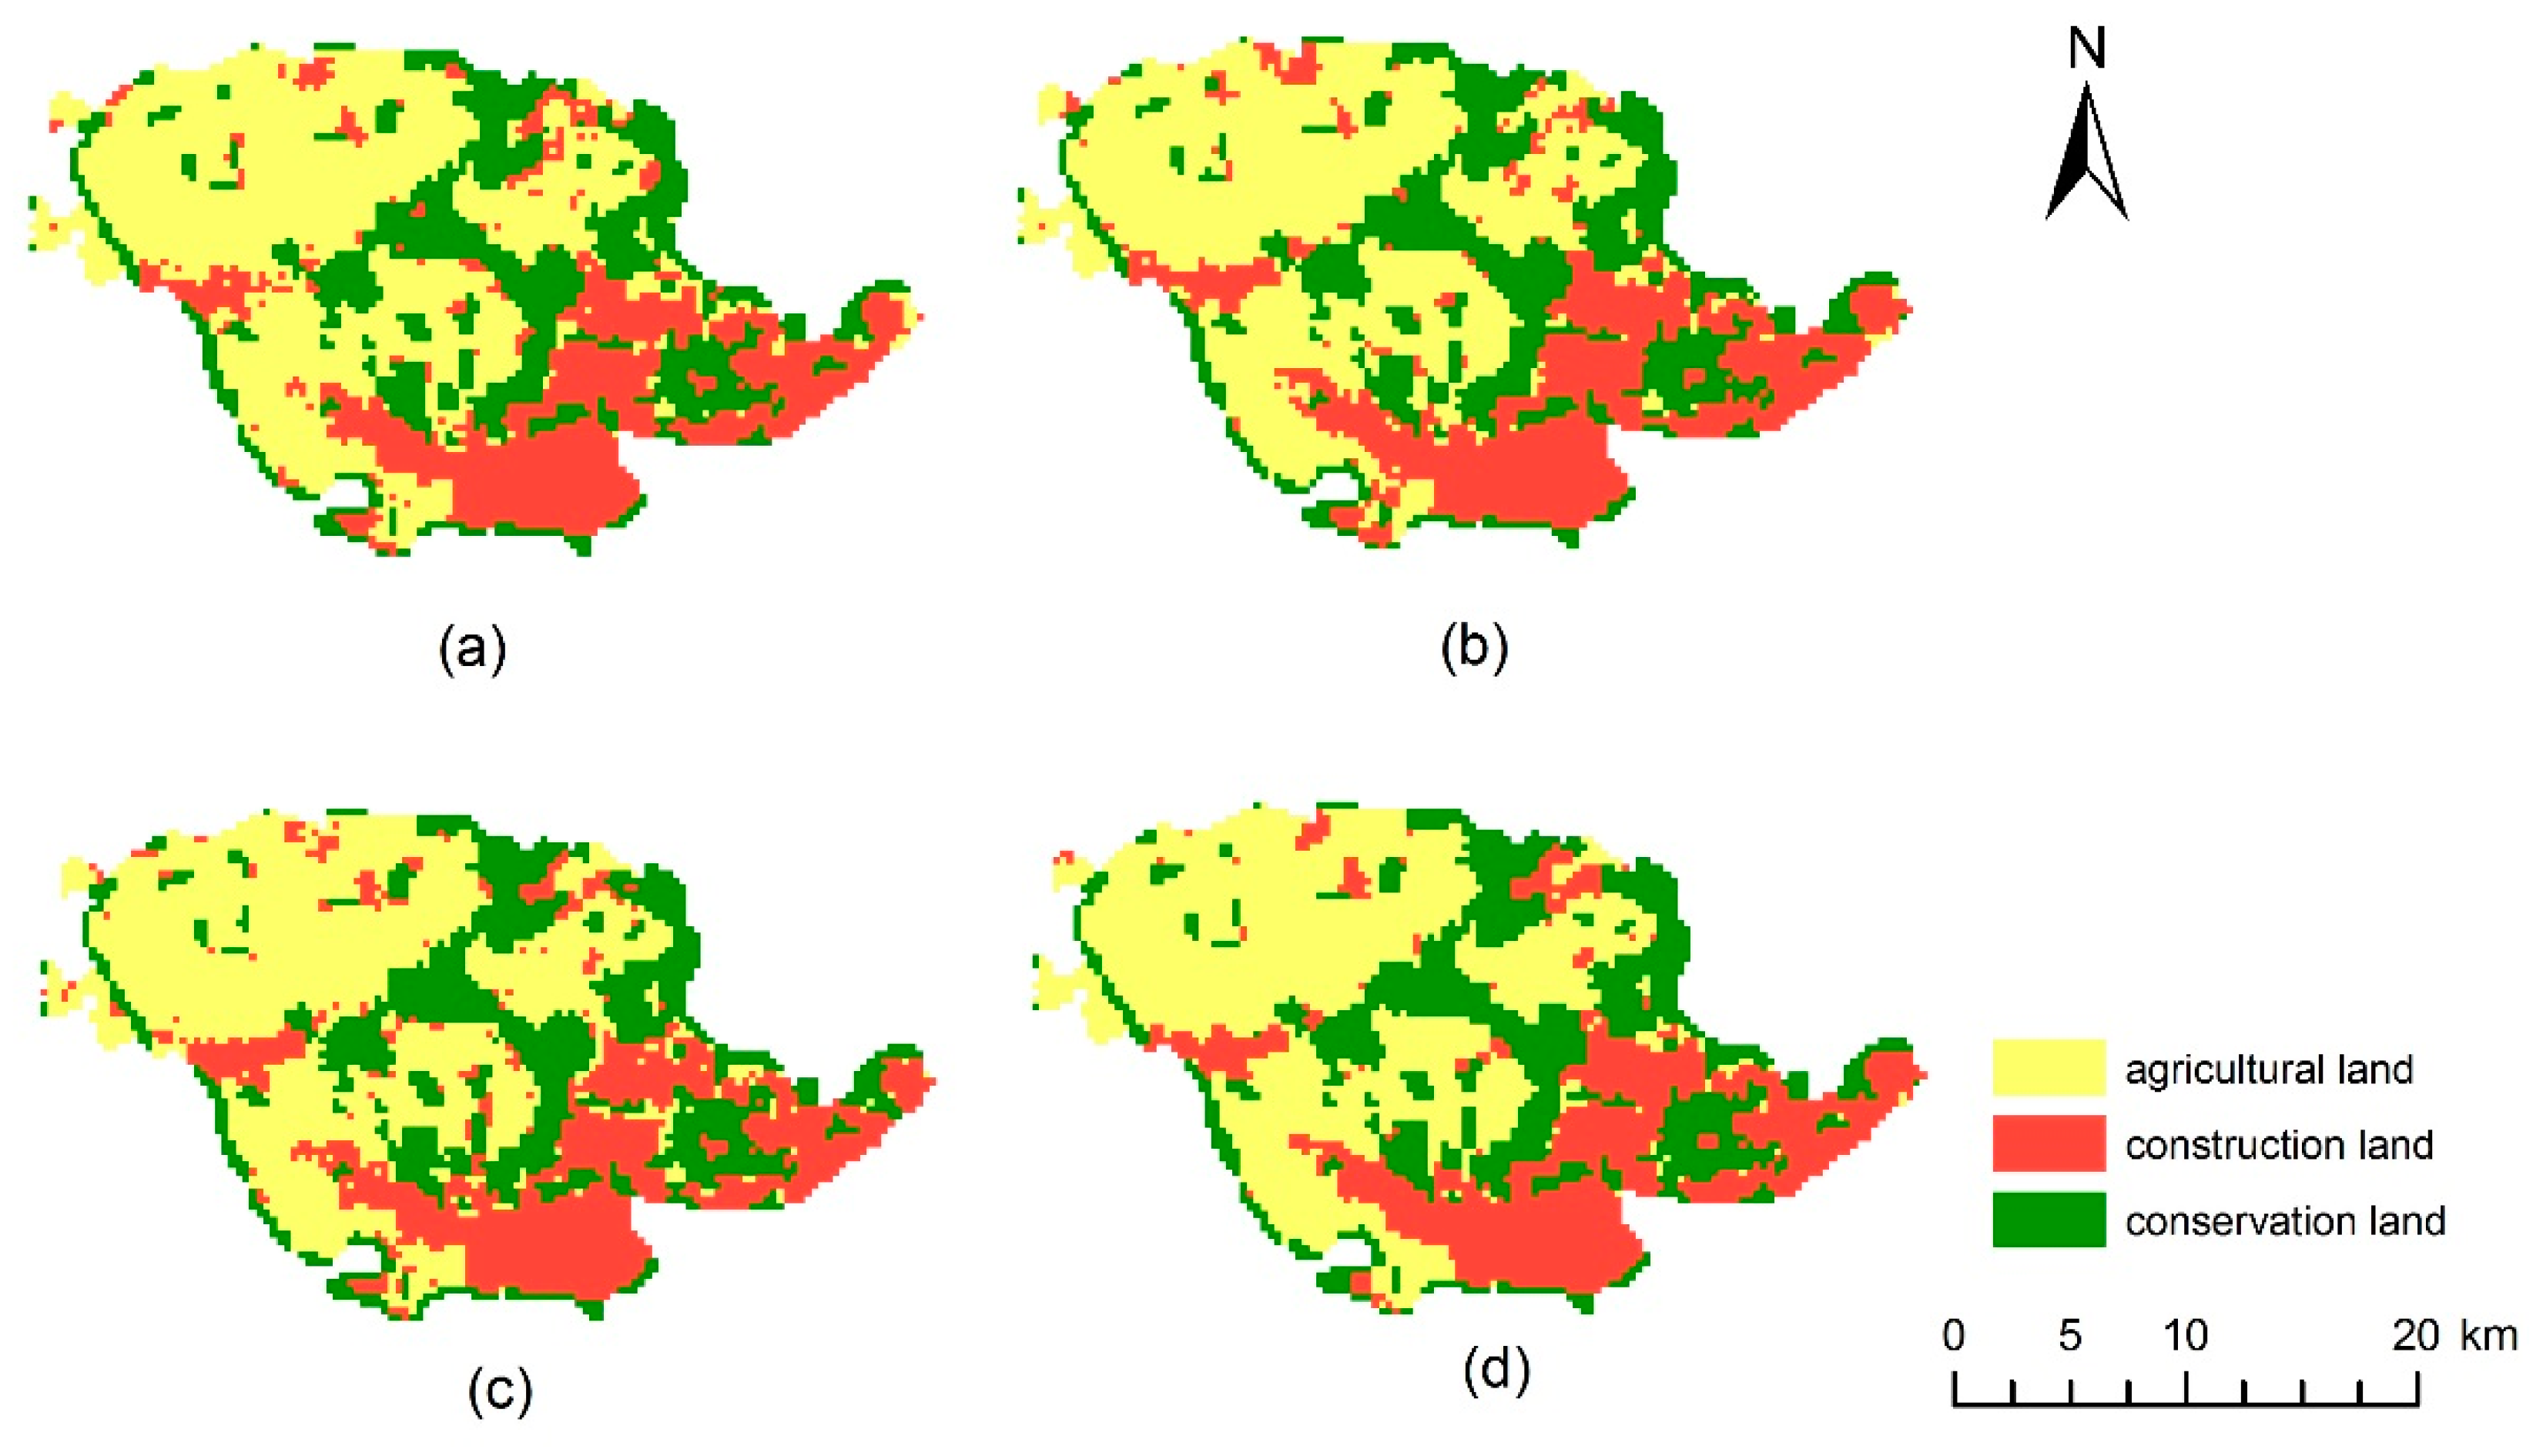
4.2.3. Spatial Optimization Problem Solving

(1) Patch-Based Non-dominated Sorting Genetic Algorithm (NSGA-II)
In this article, a land allocation alternative is represented with a grid, and a patch-based NSGA-II algorithm was developed and applied to solve the SOP problem. NSGA-II is a multi-objective optimization algorithm that attempts to identify non-dominated solutions that provide different trade-offs between multiple objectives; these solutions cannot improve one objective without degrading some others [60].
In previous research, we developed a knowledge-informed NSGA-II to solve a multi-objective land allocation (MOLA) problem [28]. Three knowledge-informed operators were designed to encourage compact land allocation following the patch-based idea, including edge_crossover, patch_based_mutation, and constraint_edge_mutation. Edge_crossover exchanged land use types of the edge cells between two patches. Patch_based_mutation mutated land use type of patches instead of randomly selected cells and took care of patch shape diversity. Constraint_edge_mutation steered infeasible solutions to feasible ones by mutating the land use type of edge cells. The knowledge-informed NSGA-II has been proven more effective and efficient than the classical NSGA-II in solving the MOLA problem. To design the patch-based NSGA-II for solving the SOP problem in this article, we kept the edge_crossover and patch_based_mutation operators in the knowledge-informed NSGA-II but made a minor revision to the constraint_edge_mutation operator to design a constraint_edge_suitability_mutation operator. Figure 6 and Figure 7 briefly illustrate how the edge_crossover and patch_based_mutation work. Readers can get more information about the algorithm designation and performance from our previous research [61].
In Section 4.2.2 (2), all land units in the planning area were classified based on their land suitability levels for agriculture, construction, and conservation, respectively. In the planning context, adjacent land units with similar suitability levels for a specified use are more likely to be allocated for the same use. The operator of constraint_edge_suitability_mutation was designed to take advantage of this planning knowledge and the land suitability classifications (Figure 5). Figure 8 includes an example and pseudo-code illustrating how the operator works.
The patch-based NSGA-II was applied to solve the SOP problem formulated in Section 4.2.1. The population size, crossover rate, and mutation rate employed in the algorithm are 80, 1.0, and 0.3, respectively. These parameters were set based on a previous test of the knowledge-informed NSGA-II. The algorithm was set to terminate at the 3000th-generation when the solutions make little improvement with increasing generations. Such termination status makes a compromise between the solution quality and the computational cost [61].
(2) Spatial Optimization Results
Among all non-dominated solutions generated by the patch-based NSGA-II, four representative solutions were selected for mapping and further analysis. Solutions (a–d) are the solutions with the highest OFV on Objective 1–4, respectively. In the planning context, they were the agriculture-oriented solution, construction-oriented solution, conservation-oriented solution, and the solution maximizing spatial compactness, respectively. Table 7 lists the OFV of each objective and the area of each land use in the four solutions. Figure 9 is the mapping of the solutions.
The four solutions provided different trade-offs between the four objectives. The differences were reflected by their OFVs on each objective, the area of each land use, and the mapping of solutions. Solution (a–c) gave priority to agricultural suitability, construction suitability, and conservation suitability, respectively. There were less scattered land units in solution (d), and the spatial compactness level of land allocation was the highest among the four solutions.
When the mappings of the solutions were compared, the four solutions showed globally similar but locally different patterns. All four solutions allocated future construction mainly in the current urban peripheral area. The township centers of Xingou and Dongshan were also planned for sprawl. Moreover, a few villages along the highways or National Road 107 were also planned for development. Meanwhile, agricultural land was mainly allocated in the townships of Dongshan, Xin’andu, Xin’gou, and Zoumaling, resulting in a large patch. Conservation land mainly included water bodies, wetland, and historical and tourism sites. To summarize, the four solutions planned to protect ecologically sensitive areas and agricultural land with large patch size and higher suitability. Also, they planned the space for urban sprawl and encourage construction expansion in areas with convenient transportation. The local differences were mainly concerned with where new construction land was allocated. Compared to Solution (a) and (c), Solution (b) planned larger spaces for urban and township center growth. The difference in the mapping patterns will be further analyzed in Section 4.2.5 (2).
Even though the global land allocation patterns in the four solutions are rational, there are some irrational local patterns. For instance, the township center of Xin’andu was not maintained. This township is far from the urban center and evaluated as less suitable for construction (Figure 5b). However, based on planning knowledge, even though the township center is not suitable for further development, its current construction area should be maintained. Also, there are a few scattered patches smaller than 27 hectares; they are not expected to be shown on the planning maps. The land uses of most scattered units fail to be optimized based on their surrounding land units. With these irrational local patterns, these solutions cannot be directly applied for “three-space” and “three-line” planning. They have to be post-processed based on the planning knowledge.

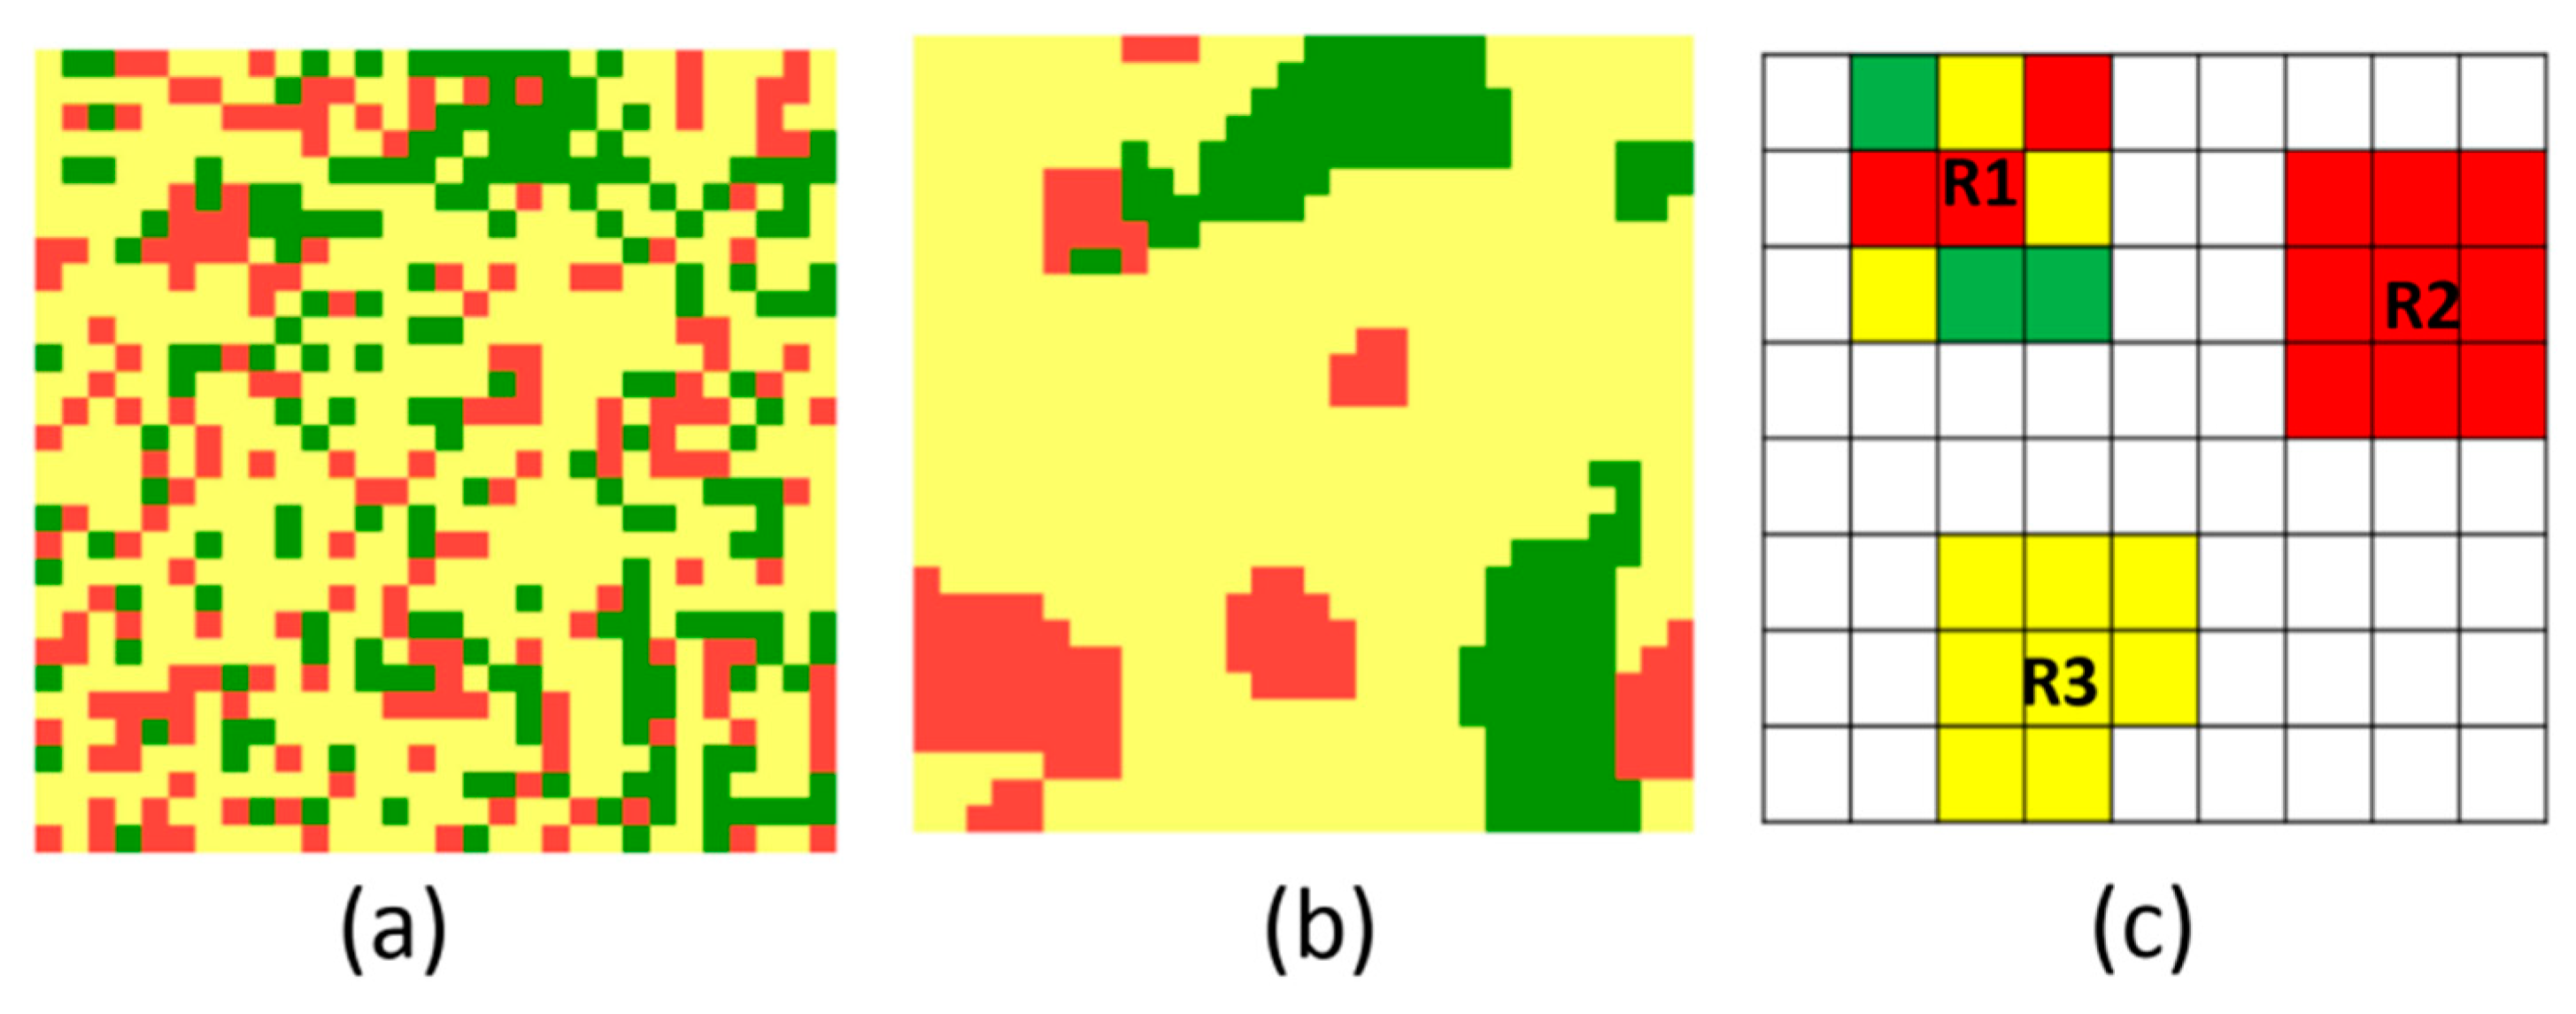
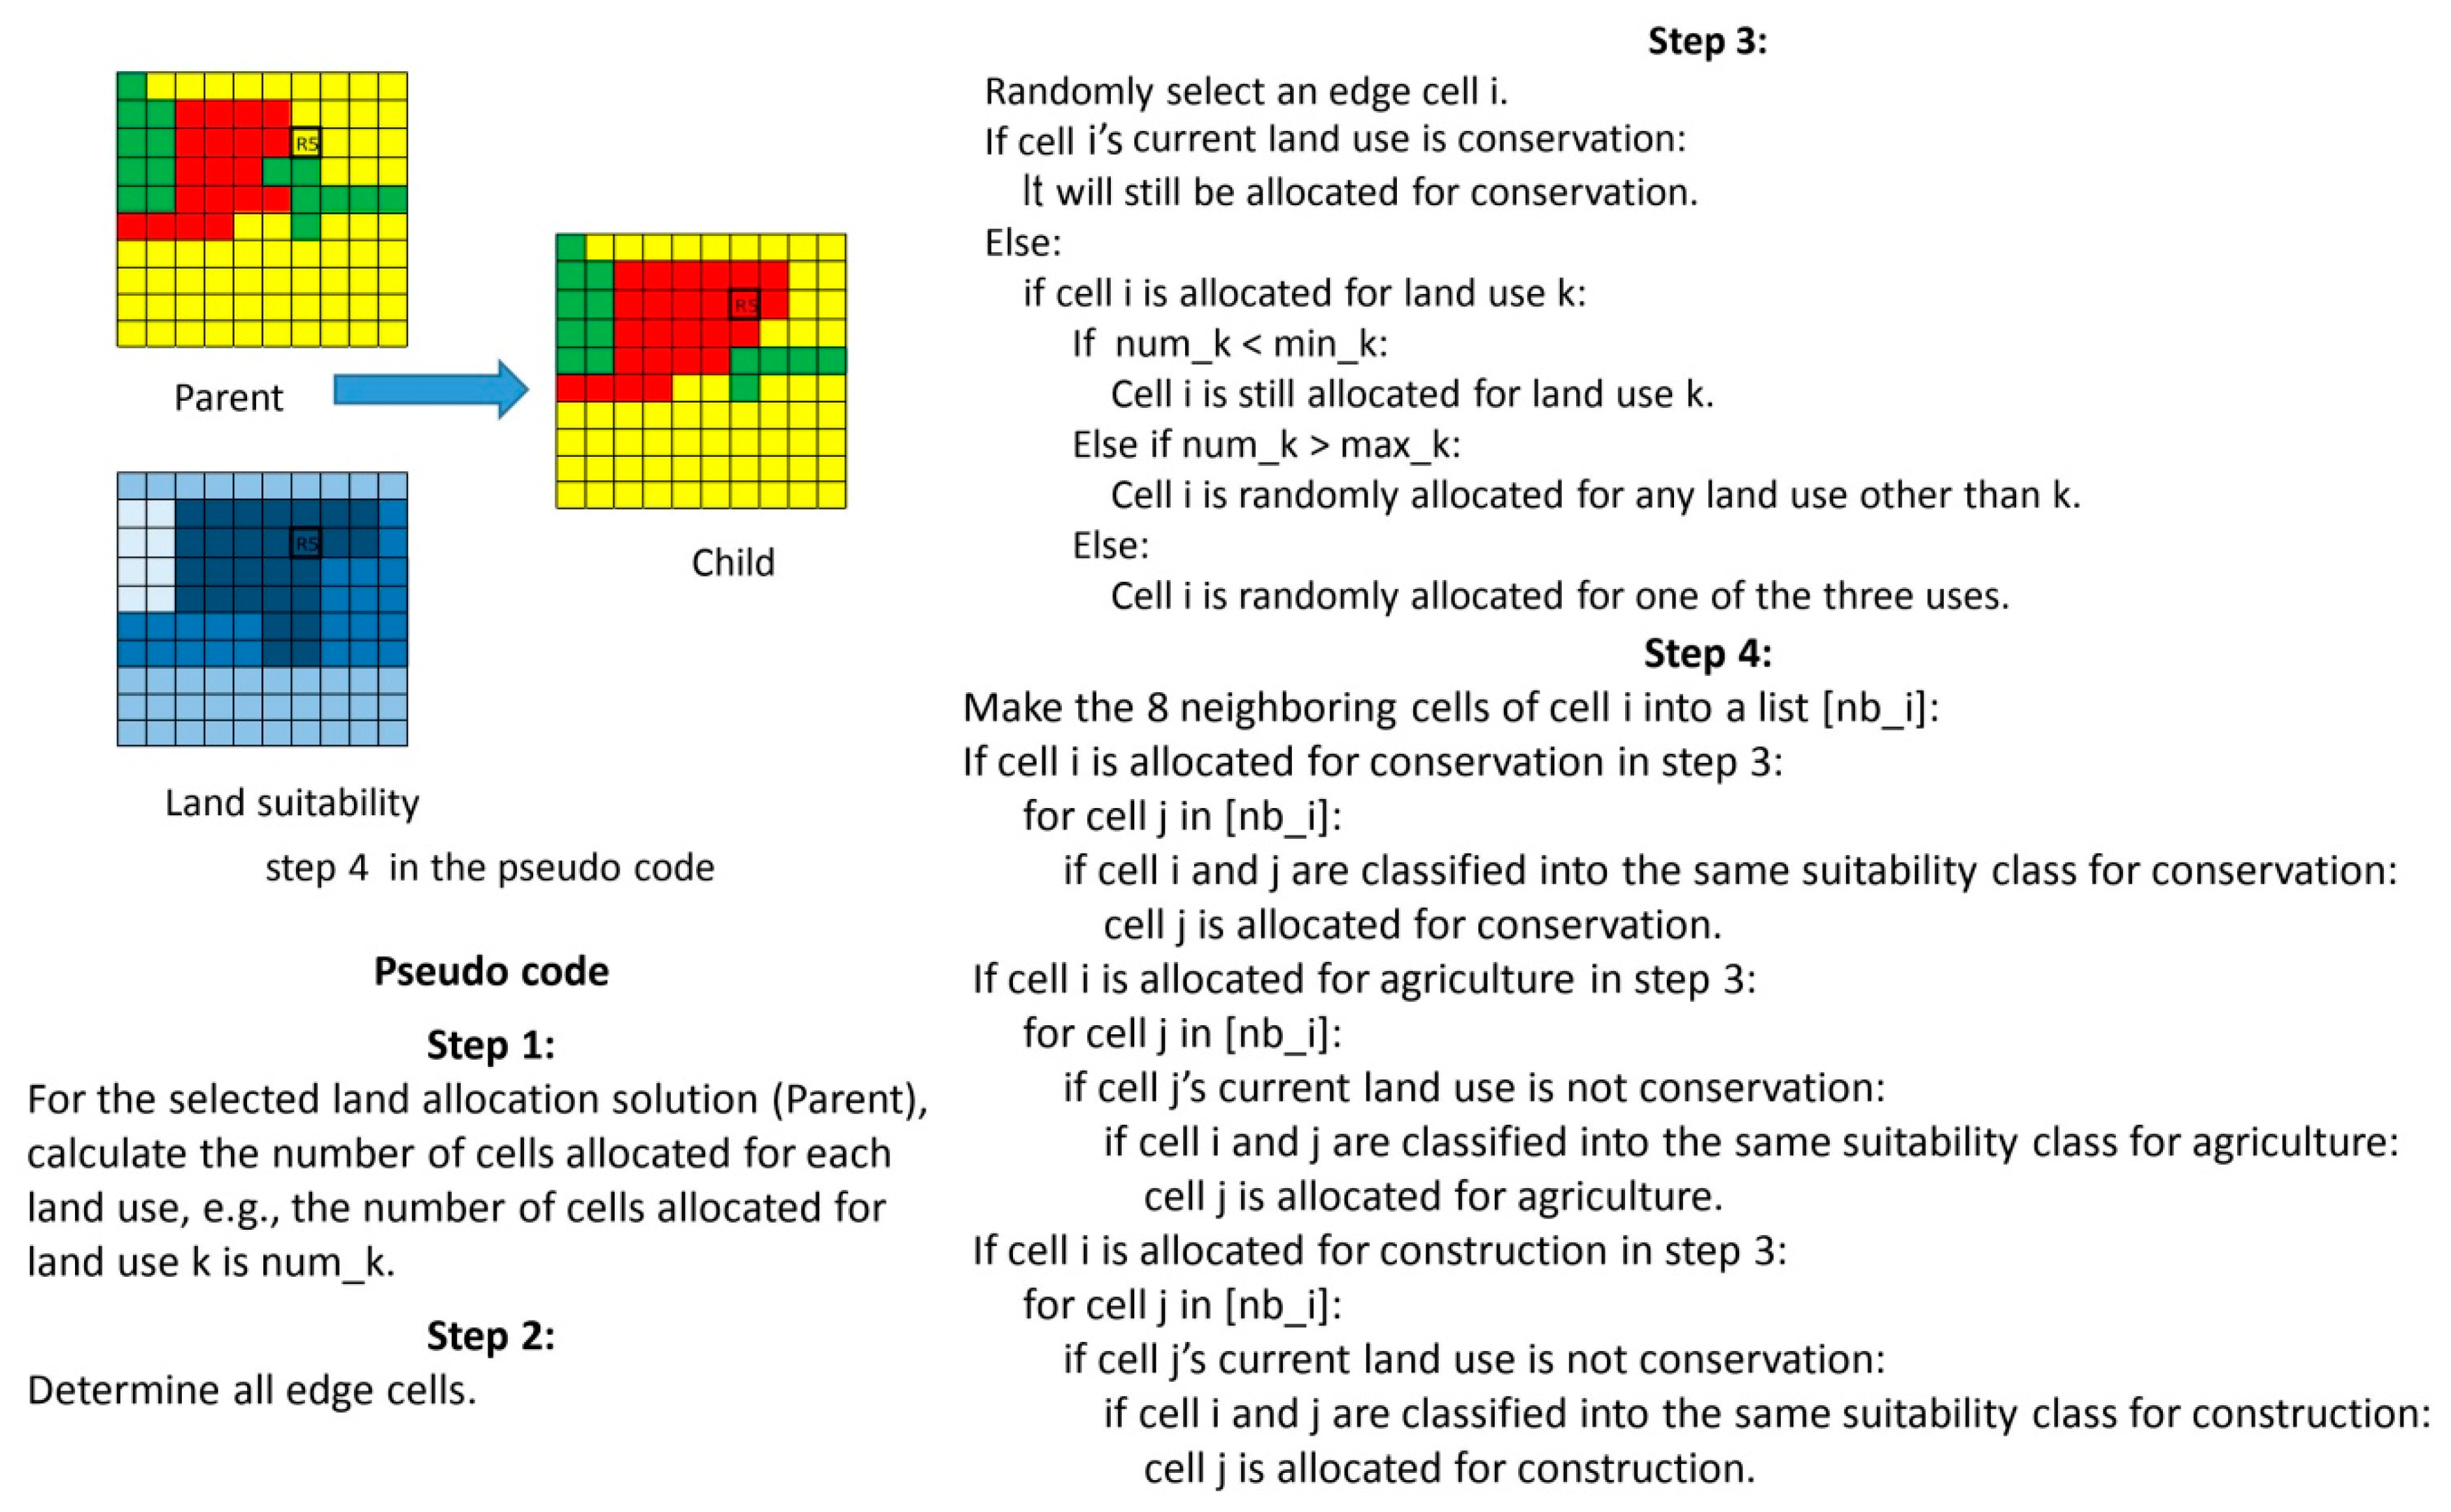
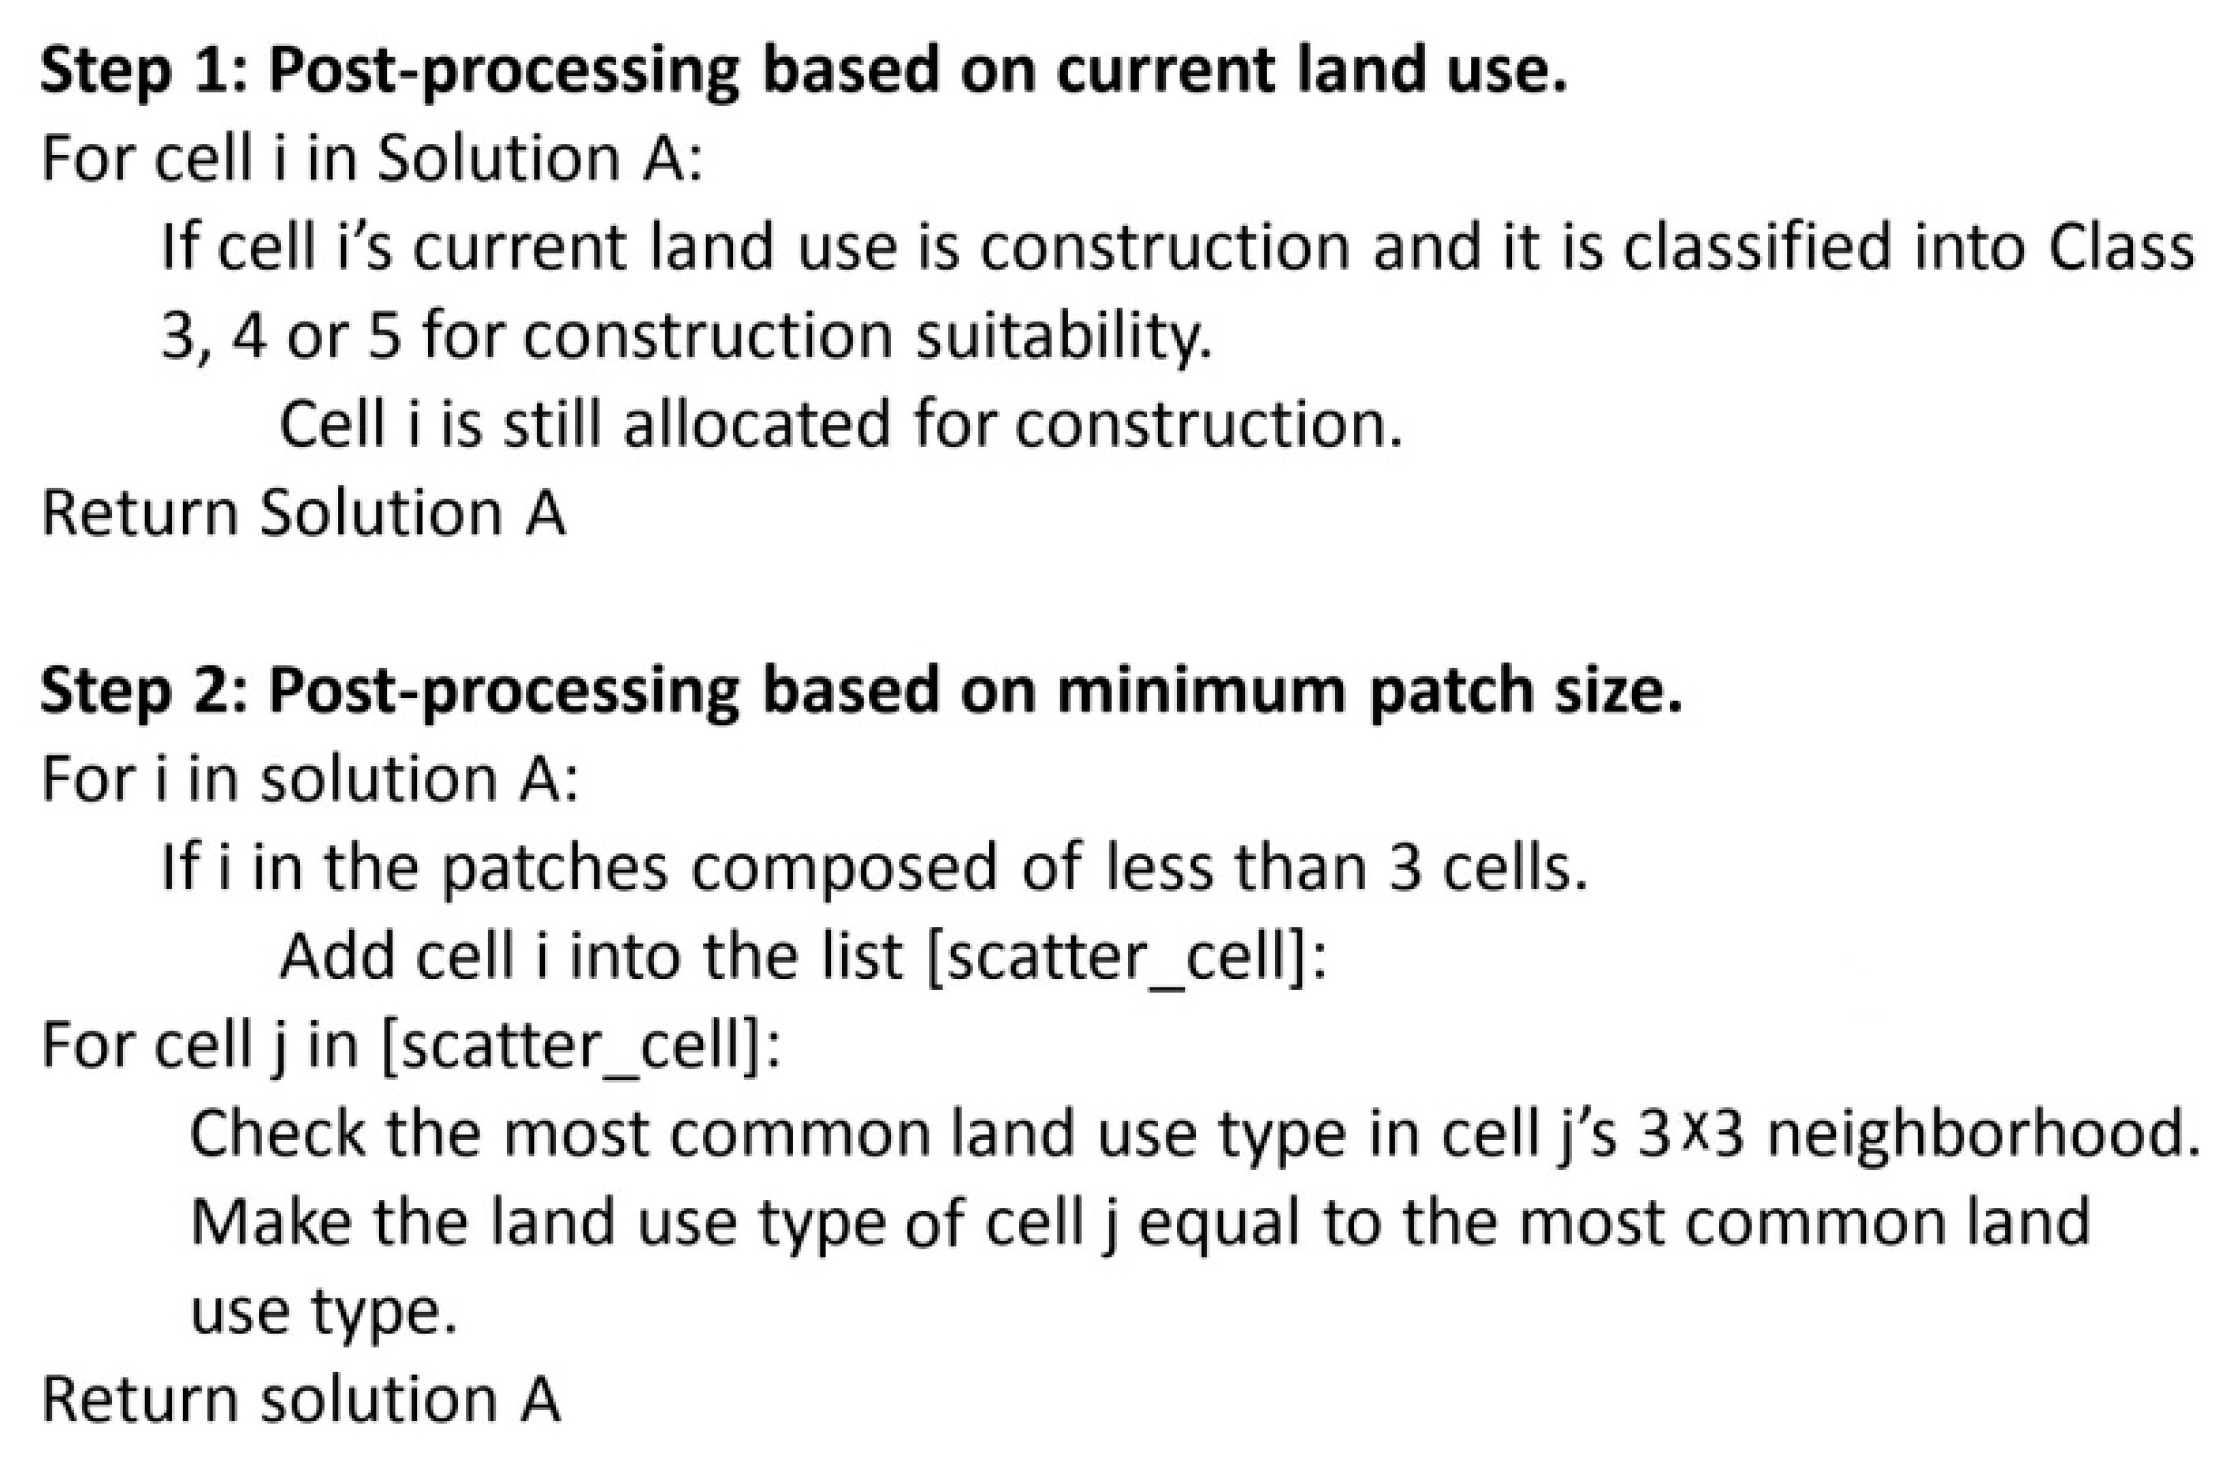
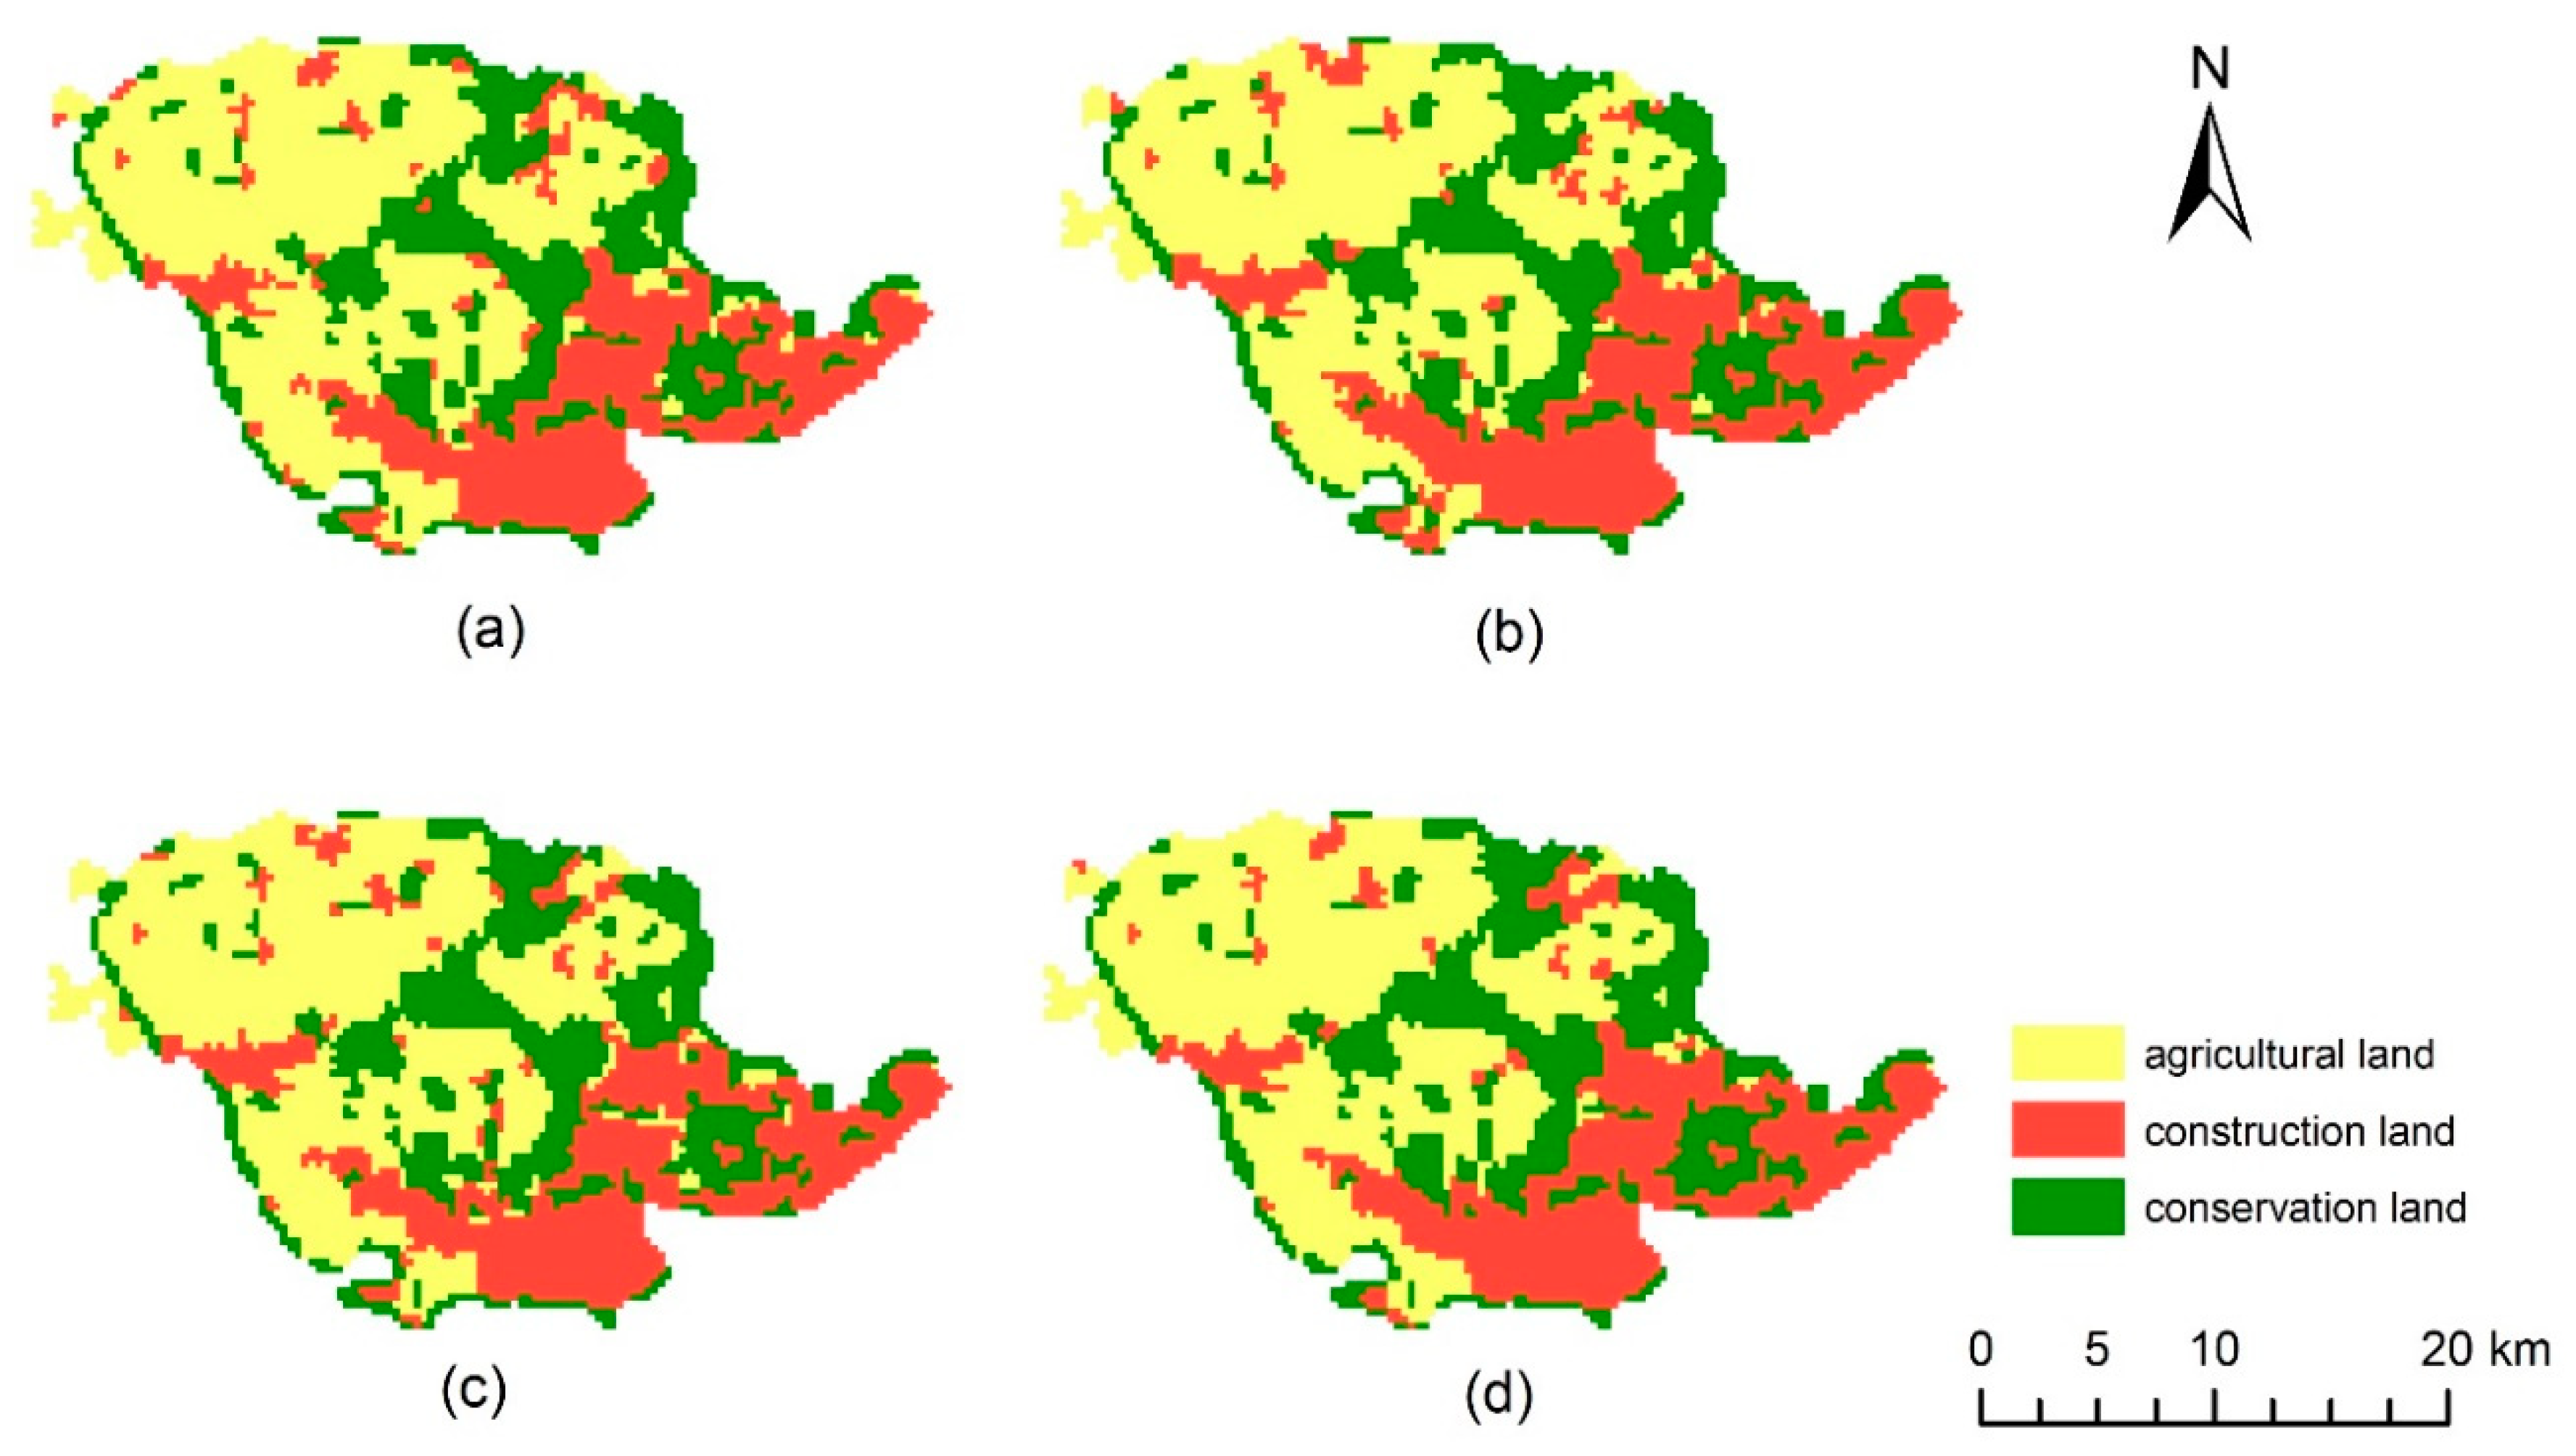
4.2.4. Post-Processing of Land Allocation Solutions

Considering the irrational local patterns in the solutions generated from spatial optimization, we propose a two-step post-processing procedure for the solutions based on the current land use (Figure 3d) and the expected minimum patch size of 27 hectares. The first step aimed to maintain current construction land with higher suitability; the second step determined the land use of the patches smaller than 27 hectares based on their surrounding land units.
The pseudo-code of the two-step post-processing procedure is shown in Figure 10. Table 8 lists the area of each land use in the post-processed solutions. The four post-processed solutions all satisfied the area/percentage limits in Table 3. Figure 11 is the mapping of the post-processed solutions.

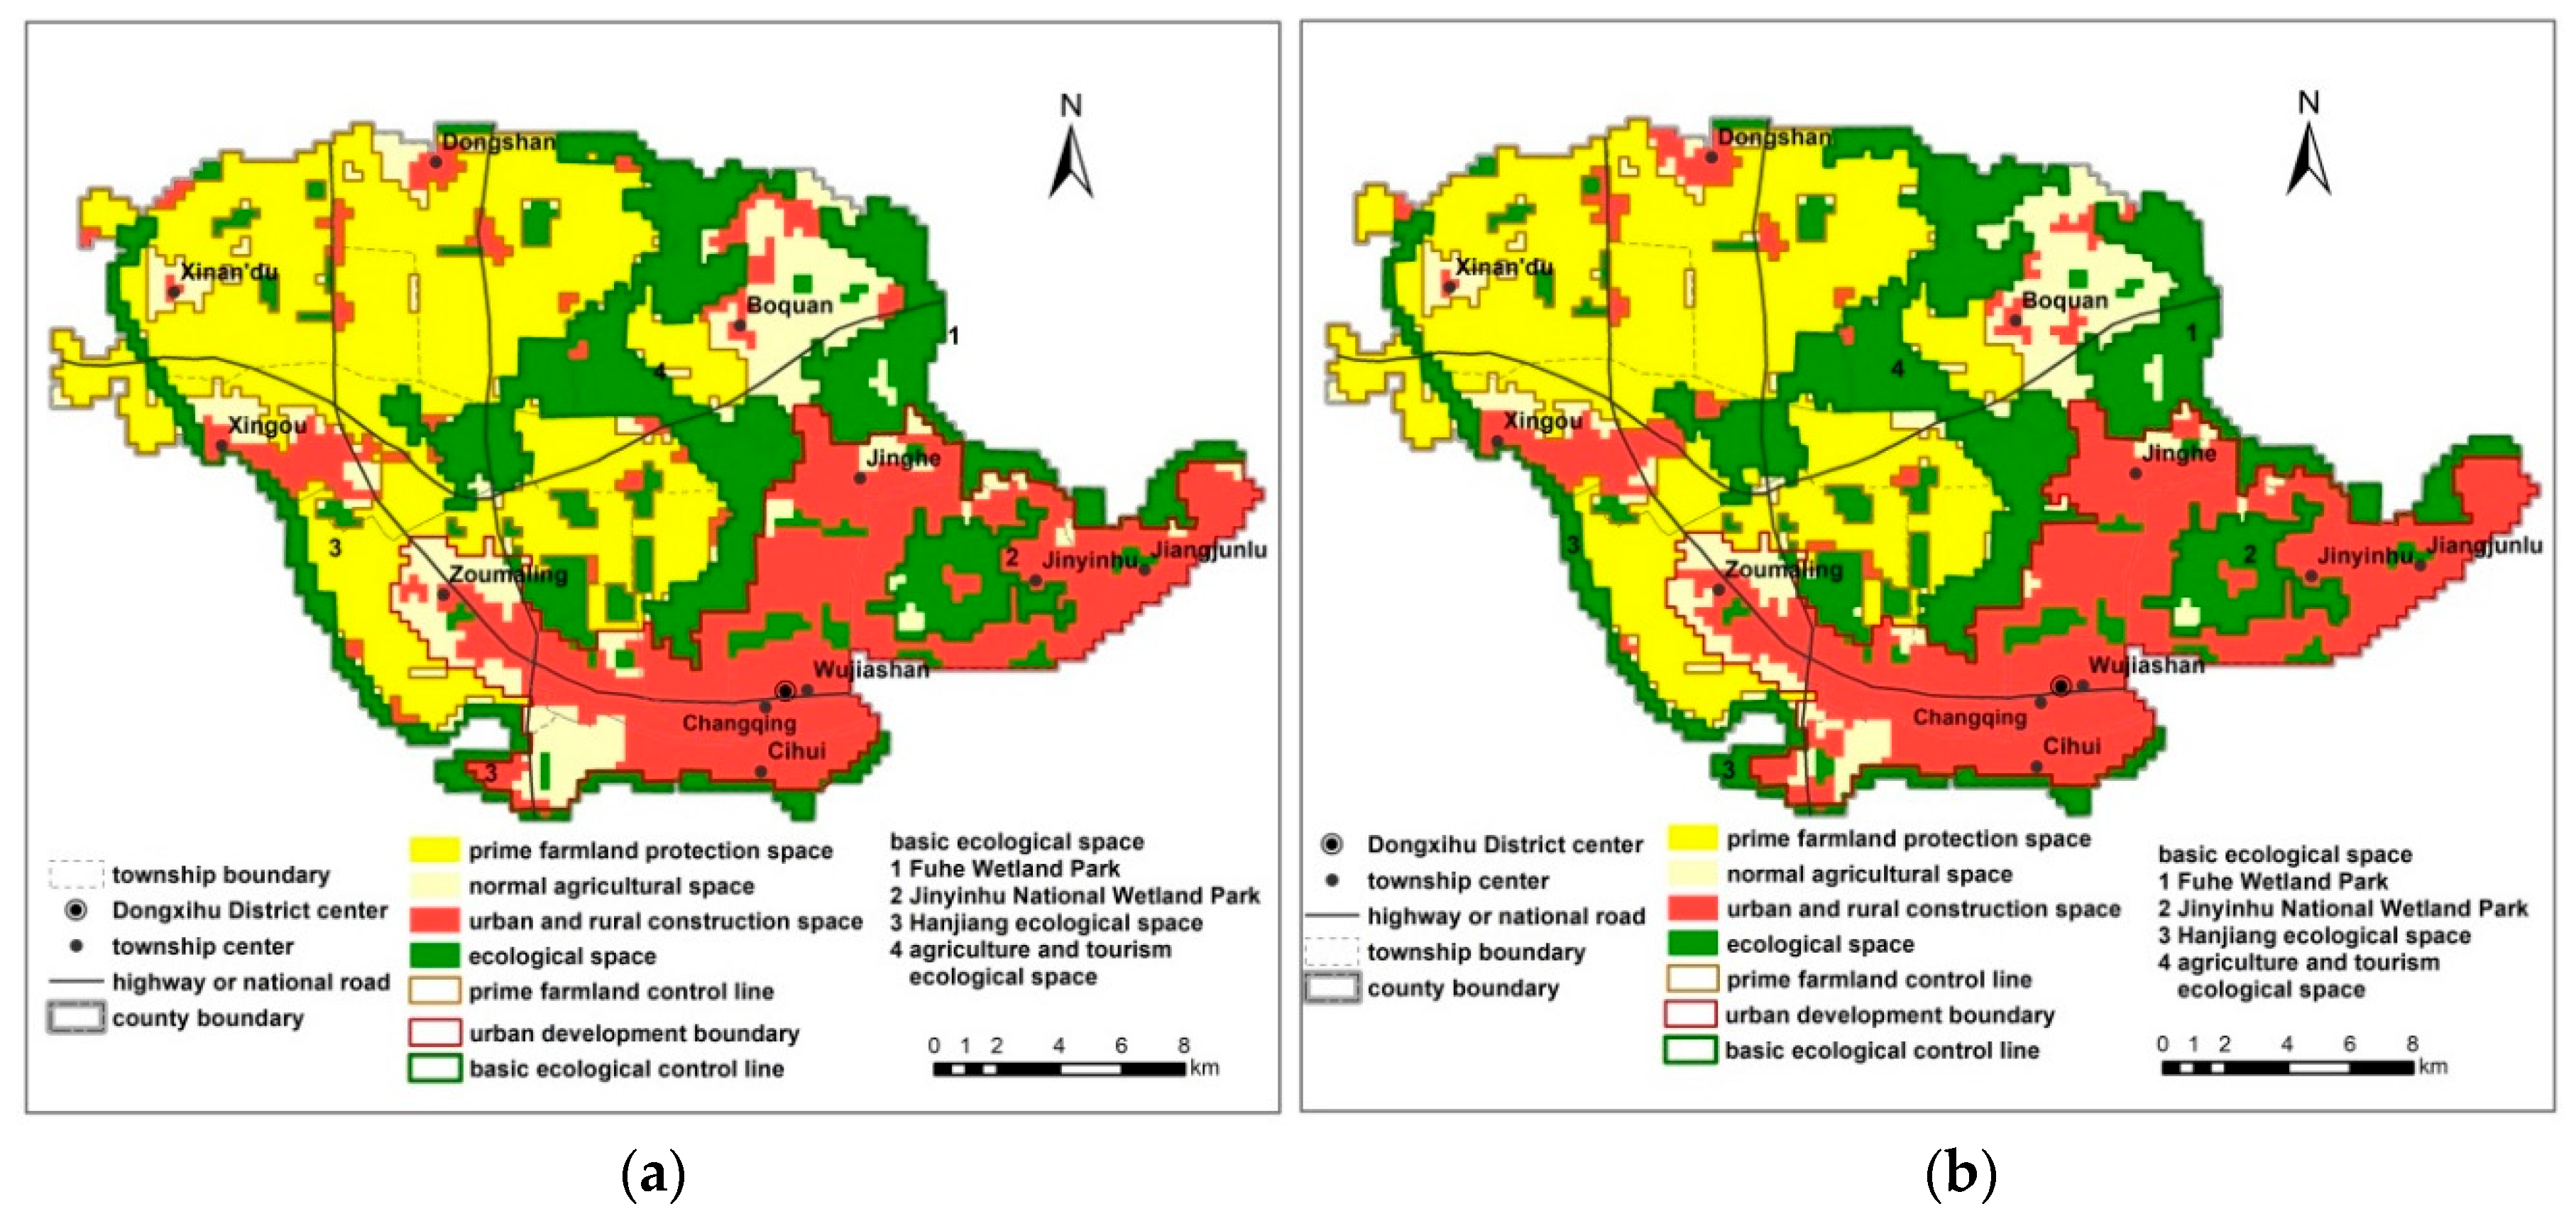
4.2.5. Apply Post-Processed Solutions to “Three-Space” and “Three-Line” Planning

Solution (a) and Solution (b) in Section 4.2.4 are used as examples to illustrate how the post-processed optimization solutions can be used for “three-space” and “three-line” planning. Solution (a) gave priority to agricultural activity while Solution (b) gave priority to construction activity. The two solutions are compared in Section 4.2.5 (2).
(1) Planning of the “Three-Space” and “Three-Line”
The “three-space” can be planned based on the land allocation solutions. The land units allocated for agriculture, construction, and conservation can be planned for the agricultural space, the urban and rural construction space, and the ecological space, respectively.
Then the basic ecological control line, the prime farmland control line, and the urban development boundary will be planned one by one.
First, the basic ecological control line protected four large ecological spaces that provide significant ecological service for the planning area, including Fuhe Wetland Park, Jingyinhu National Park, Hanjiang ecological space, as well as an agriculture and tourism ecological space that consists of the Boquan historical and tourism site and some waterbodies for developing freshwater aquaculture. The space inside the basic ecological control line needed to be strictly protected from construction activities.
Then, the prime farmland control line protected prime farmland from being used for construction activities. Agricultural land with large patch sizes, higher productivity, and well drainage and irrigation facilities are suggested to be planned as prime farmland [62,63]. In the land suitability classification map for agriculture (Figure 5a), the space in Class 5 was evaluated as most suitable for agriculture based on a comprehensive evaluation of physical, soil, facility, socio-economic, and location factors. The land suitability map (Figure 5a) was combined with the post-processed solutions (Figure 11a,b). The agricultural space in Class 5 and with large patch size was planned as prime farmland protection space. The remaining agricultural space was planned as normal agricultural space. The boundary of the prime farmland protection space was planned as the prime farmland control line.
Finally, the urban development boundary acted as the control boundary for urban sprawl in the planning term. There are a few widely accepted criteria for planning the urban development boundary: (a) Urban development boundary encourages compact urban development while prevents scattered or leapfrog urban development. (b) Urban sprawl should not encroach on the basic ecological space and the prime farmland protection space. (c) The space inside the urban development boundary should be larger than the planned urban construction space; some planners suggest that it be 1.15–1.2 times as large as the planned urban construction space [64,65]. Based on the above criteria, we overlapped the land suitability map for agriculture (Figure 5a) with the land suitability map for construction (Figure 5b). The intersections of Class 4–5 in Figure 5a and Class 1–3 in Figure 5b were extracted. Then, the intersection space that enclosed the largest and spatially contiguous construction space was identified, and its boundary was planned as the urban development boundary. As a result, the urban development space was 1.14 and 1.19 times as large as the planned urban construction space in Solution (a) and (b), respectively. In both solutions, the townships of Wujiashan, Cihui, Jinyinhu, Jiangjunlu, Jinghe, and Zoumaling were mainly planned for urban development. There was no prime farmland protection space inside the urban development boundary. Even though the Jingyihu National Park was inside the boundary, the basic ecological control line protected it from construction activities.
The planning maps generated based on Solution (a) and (b) are shown in Figure 12a,b respectively.
(2) Solution Comparison
When the two planning maps were compared, they showed a high level of similarity. The spatial distributions of the basic ecological control line, the prime farmland control line, and the urban development boundary were almost the same in the two solutions. First, in both solutions, the basic ecological control line enclosed four large ecological spaces. Second, the prime farmland protection space was mainly located in the townships of Dongshan, Xin’andu, Xingou, Zoumaling, and Boquan, while the agricultural space inside the urban growth boundary was planned as normal agricultural space. The agricultural space in the buffer zones between agricultural space and construction space was often planned as normal agricultural space. Third, the townships of Wujiashan, Cihui, Jinyinhu, Jiangjunlu, Jinghe, and Zoumaling were mainly planned for urban development. The prime farmland control line and the basic ecological control line were hard boundaries: agricultural and construction activities were forbidden inside the basic ecological control line; the land inside the prime farmland control line should have been guaranteed for agricultural activities; the land inside both boundaries were protected from urban development, and the two boundaries together served as the hard boundary for urban development.
The main difference between the two solutions is the size and spatial distribution of the planned space for urban and rural construction. The urban and rural construction space in Solution (a) (Figure 12a) was smaller than that in Solution (b) (Figure 12b), since in the spatial optimization procedure Solution (a) gave priority to agricultural activities while Solution (b) gave priority to construction activities. Many Chinese scholars suggest planning both hard and soft boundaries for urban growth to increase flexibility and predictability of planning [62,64,65,66]. Urban growth is encouraged inside the soft boundary, allowed but controlled between the soft and hard boundary, and forbidden outside the hard boundary. The urban development boundary is supposed to be the hard boundary, while the boundary of the planned urban construction space can act as the soft boundary. Solutions (a) and (b) provide soft boundaries for urban growth under different development scenarios.

5. Discussion and Conclusions

This article proposes an RP-MCE-SOP framework to support “three-space” and “three-line” planning at China’s county level. The framework followed the rational planning model and integrated multi-criteria evaluation (MCE) and spatial optimization (SOP) techniques. It included five steps of building the SOP model, land suitability evaluation with MCE, optimization problem solving, post-processing of land allocation solutions, and applying post-processed solutions to “three-space” and “three-line” planning. The framework was implemented in Dongxihu District of Wuhan City with the Boolean aggregation and AHP MCE techniques and a patch-based NSGA-II SOP algorithm as a case study.
The case study showed that the framework is feasible and useful for supporting decision making in county-level “three-space” and “three-line” planning. “Three-line” planning solutions set the hard boundaries for ecological resource protection, prime farmland preservation, and urban growth. “three-space” planning solutions protect ecologically sensitive spaces and agricultural land with large patch size and higher suitability, and allocate future construction mainly in the urban peripheral area or transportation convenient areas; meanwhile, they are useful for planning the soft boundaries for urban growth.
This article makes two main contributions: proposing an empirical framework that instructs the implementation of “three-space” and “three-line” planning at China’s county-level step by step; illustrating how MCE and SOP techniques can be used in the framework. The objective of the case study was to illustrate how the framework works, test its feasibility, and identify problems during its implementation, instead of generating planning alternatives that can be directly used in the study area. Some procedures in the case study are not illustrated in detail in this article, such as the implementation of Boolean aggregation and AHP for land suitability evaluation and the designation of the patch-based NSGA-II, since they have been well explained in our previous publications [28,29].
The limitations of this study and the directions for future research are discussed in the following paragraphs.
First, the framework is proposed for China’s county-level “three-space” and “three-line” planning based on the premise that the percentages of the three spaces have been set in province-level planning. This assumption has been made based on China’s hierarchical spatial planning system and the experiences gained from pilot spatial planning practices. The case study has proven the feasibility and efficacy of the framework in assisting decision making in county-level “three-space” and “three-line” planning. However, real-life planning is much more complicated than the five-step workflow of the framework and requires close collaboration among the local government, planning professionals, and the public. Applying the framework to generate land allocation solutions is not the end of the planning procedure. The local government and planning professionals need to evaluate whether the solutions are rational and fulfill the benefits of the public based on their understanding of local physical, socio-economic conditions and development strategies. If not, the rating, weighting, and classification systems in land suitability evaluations and the parameters in spatial optimization modeling require adjustment. The planning decision making procedure may need a few rounds of land suitability evaluation, spatial optimization modeling, and solution evaluations from planners. Moreover, because different counties in China show large differences for their physical, socio-economic conditions and development strategies, the appropriate criteria and parameters applied in the framework depend greatly on local contexts. However, it is necessary to establish such a framework that provides a scientific methodology, a technical guideline, and a rational workflow to assist local governments and planners with decision making.
Second, in the case study, the percentages of the three spaces have not been set by the higher-level government. We set such percentages by referring to the Land Use Planning of Wuhan City (2006–2020) [39], Land Use Planning Outline of Dongxihu District in Wuhan City (2006–2020) [40], and Urban Comprehensive Planning of Wuhan (2006–2020) [41], as well as consulting the governmental officials in the Department of Land, Resource and Planning of Dongxihu District. Instead of setting a fixed percentage, we set upper and lower limits for the percentage of each space by considering decision uncertainty and in order to improve planning flexibility. Moreover, since the above planning projects design land use plans in the study area until 2020, the proposed framework was applied for short-term “three-space” and “three-line” planning until 2020. When the planning term is extended, the percentages for the three spaces will be adjusted based on the local resource, socio-economic conditions, and development strategies. Theoretically, the framework will still work for long-term planning. However, if the framework is separately applied to short-term and long-term planning, there may be conflicts between short-term and long-term planning alternatives. How to modify the framework to better coordinate short-term and long-term planning is another issue requiring future research.
Another limitation is about the data applied in the case study. In China, much of the land use and socio-economic data are managed by governments and are not open to the public. Most data applied in this case study were open-source data with fair quality, such as the Global 30 land cover data, and the statistical socio-economic data. Data quality will impact accountability of the planning alternatives. The performance of the proposed framework needs to be further tested and evaluated in real-life “three-space” and “three-line” planning that involves both academia and the government who can provide more comprehensive and high-quality data.
Finally, both the Chinese government and the planning community have regarded “three-space” and “three-line” planning as an essential measure for city-level and county-level “multiple-plan integration”. However, the problem of multiple planning conflicts could not be solved by simply implementing “three-space” and “three-line” planning. Instead, a top-down reform of China’s spatial planning system is required. The National Spatial Planning Guideline was published in 2017, and many provinces have completed the spatial planning reform at the province level. City-level and county-level planning will be the focus of the next stage of reform. From our viewpoint, there are two critical issues as for the spatial planning reform at the city and county level. One is how to implement the “three-space” and “three-line” planning, which is the focus of this study; the other is how to develop special planning based on the “three-space” and “three-line” planning, which requires further study.

Author Contributions

Resources, Z.Z. and Y.W.; supervision, D.C.; writing—original draft, M.S.; writing—review and editing, D.C. and K.W.

Funding

This work was funded by the National Natural Science Foundation of China under the grant 71774066 and 71873054, and the China Postdoctoral Science Foundation under the grant 2018M642883, the Fundamental Research Funds for the Central Universities under the grant CCNU18XJ022, and the self-determined research funds of CCNU from the college’s basic research and operation of MOE under the grant of CCNU19TD004. The authors would like to thank all funders for their support.

Conflicts of Interest

The authors declare no conflict of interest.

References

  1. Liu, Y.; Wang, J. Theoretical analysis and technical methods of “multiple planning integration” in the rural to urban transition period in China. Prog. Geogr. 2016, 35, 529–536. (In Chinese) [Google Scholar]
  2. Xie, Y.; Wang, W. From “Multi-plan Coordination” to the Reform of the Spatial Planning System. Urban Plan. Forum 2015, 3, 15–22. (In Chinese) [Google Scholar]
  3. Zhang, Y.; Feng, G. Study on the Mechanism of “Multiple Plans Conflicts” and “Multiple Plans Integration” based on the Spatialtemporal Cone Theory. China Land Sci. 2017, 31, 4–11. (In Chinese) [Google Scholar]
  4. Huang, Z.; Wang, J. Proposal for coordinating and carrying forward the pilot project of “Multiple Planning Integration” in cities and counties. Land Resour. Inf. 2017, 5, 24–30. (In Chinese) [Google Scholar]
  5. The State Council of the People’s Republic of China. National Spatial Planning Guideline. 3 January 2017. Available online: http://landchina.mlr.gov.cn/tdgh1/201702/t20170205_6818302.htm (accessed on 3 January 2017).
  6. The State Council of the People’s Republic of China. Pilot Provincial Spatial Planning Guideline. Available online: http://www.rmlt.com.cn/2017/0110/455843.shtml (accessed on 27 December 2016).
  7. Coffman, M.; Umemoto, K. The triple-bottom-line: Framing of trade-offs in sustainability planning practice. Environ. Dev. Sustain. 2010, 12, 597–610. [Google Scholar] [CrossRef]
  8. Hacking, T.; Guthrie, P. A framework for clarifying the meaning of Triple Bottom-Line, Integrated, and Sustainability Assessment. Environ. Impact Assess. Rev. 2008, 28, 73–89. [Google Scholar] [CrossRef]
  9. Halpern, B.S.; Klein, C.J.; Brown, C.J.; Beger, M.; Grantham, H.S.; Mangubhai, S.; Ruckelshaus, M.; Tulloch, V.J.; Watts, M.; White, C.; et al. Achieving the triple bottom line in the face of inherent trade-offs among social equity, economic return, and conservation. Proc. Natl. Acad. Sci. USA 2013, 110, 6229–6234. [Google Scholar] [CrossRef] [Green Version]
  10. Wise, N. Outlining triple bottom line contexts in urban tourism regeneration. Cities 2016, 53, 30–34. [Google Scholar] [CrossRef]
  11. Bai, S. Exploration and Reflection on Spatial Management of Land Use Based on “Three-space” and “Three-line” Planning. Resour. Guide 2018, 2, 18–19. (In Chinese) [Google Scholar]
  12. Zhang, J.; Gao, Y.; Cai, Y.; Zhou, W.; Yuan, T. Spatial optimization on the municipal level based on “multiple planning integration”: A case study of Yantai City. Prog. Geogr. 2018, 37, 1045–1054. (In Chinese) [Google Scholar]
  13. Huang, Z.; Teng, F.; Wang, L. Suggestions on Further Promoting the Provincial Land Space Planning Pilot-Take Ningxia Land Space Planning Pilot as an Example. Natl. Resour. Econ. China 2019, 1, 20–24. (In Chinese) [Google Scholar]
  14. Zhu, D. Exploration on Spatial Planning System of Counties Domain with Multi-Planning United: A Case Study on Four-Plan—Coordination Practices in Dali. Modern Urban Res. 2016, 8, 38–46. (In Chinese) [Google Scholar]
  15. Li, X.; Ma, S. Software for intelligent identification of the “Three-space” and “Three-line”: Geographical Simulation and Optimization Systems. China Land. 2018, 3, 24–27. (In Chinese) [Google Scholar]
  16. The Planning Institution of China Center for Urban Development (PICCUD). Planning and spatial management strategy of “Three-space” and “Three-line.” 2018. Available online: http://www.ccud.org.cn/index.html (accessed on 4 June 2018).
  17. Li, T.; Liu, K. Research on Spatial Planning System Reform in Our Country: In the Case of the County’s Overall Planning. Urban Dev. Stud. 2016, 23, 16–22. (In Chinese) [Google Scholar]
  18. Lin, J.; Qiao, Y.; Wu, Z. Analysis of the “One Blueprint” of the “Multiple Plans Integration”: A Case Study of Huantai County, Shandong Province. Urban Dev. Stud. 2017, 24, 47–52. (In Chinese) [Google Scholar]
  19. Kaiser, E.J.; Godschalk, D.R.; Chapin, F.S. Urban Land Use Planning, 4th ed.; University of Illinois Press: Urbana, IL, USA, 1995. [Google Scholar]
  20. Food and Agriculture Organization of the United Nations. Guidelines for Land-Use Planning; Food and Agriculture Organization of the United Nations: Rome, Italy, 1993. [Google Scholar]
  21. Malczewski, J. GIS-based land-use suitability analysis: A critical overview. Prog. Plan. 2004, 62, 3–65. [Google Scholar] [CrossRef]
  22. Mosadeghi, R.; Warnken, J.; Tomlinson, R.; Mirfenderesk, H. Comparison of Fuzzy-AHP and AHP in a spatial multi-criteria decision making model for urban land-use planning. Comput. Environ. Urban Syst. 2015, 49, 54–65. [Google Scholar] [CrossRef] [Green Version]
  23. Saaty, T.L. Decision making with the analytic hierarchy process. Int. J. Serv. Sci. 2008, 1, 83–98. [Google Scholar] [CrossRef]
  24. Joerin, F. Using GIS and outranking multicriteria analysis for land-use. Int. J. Geogr. Inf. Sci. 2001, 15, 153–174. [Google Scholar] [CrossRef]
  25. Santé-Riveira, I.; Boullón-Magán, M.; Crecente-Maseda, R.; Miranda-Barrós, D. Algorithm based on simulated annealing for land-use allocation. Comput. Geosci. 2008, 34, 259–268. [Google Scholar] [CrossRef]
  26. Zhou, J.; Civco, D.L. Using Genetic Learning Neural Networks for Spatial Decision Making in GIS. Photogramm. Eng. Remote Sens. 1996, 62, 1287–1295. [Google Scholar]
  27. Aerts, J.; Heuvelink, G. Using simulated annealing for resource allocation. Int. J. Geogr. Inf. Sci. 2002, 16, 571–587. [Google Scholar] [CrossRef] [Green Version]
  28. Datta, D.; Deb, K.; Fonseca, C.M.; Lobo, F.G.; Condado, P.A.; Seixas, J. Multi-Objective Evolutionary Algorithm for Land-Use Management Problem. Int. J. Comput. Intell. Res. 2007, 3, 371–384. [Google Scholar]
  29. Duh, J.D.; Brown, D.G. Knowledge-informed Pareto simulated annealing for multi-objective spatial allocation. Comput. Environ. Urban Syst. 2007, 31, 253–281. [Google Scholar] [CrossRef]
  30. Murray, A.T.; Church, R.L. Heuristic solution approaches to operational forest planning problems. Oper. Res. Spektrum 1995, 17, 193–203. [Google Scholar] [CrossRef]
  31. Önal, H.; Briers, R.A. Designing a conservation reserve network with minimal fragmentation: A linear integer programming approach. Environ. Model. Assess. 2005, 10, 193–202. [Google Scholar] [CrossRef]
  32. Sahebgharani, A. Multi-objective land use optimization through parallel particle swarm algorithm: Case study Baboldasht district of Isfahan, Iran. J. Urban Environ. Eng. 2016, 10, 42–49. [Google Scholar] [CrossRef]
  33. Wu, X.; Murray, A.T.; Xiao, N. A multiobjective evolutionary algorithm for optimizing spatial contiguity in reserve network design. Landsc. Ecol. 2011, 26, 425–437. [Google Scholar] [CrossRef]
  34. Cao, K.; Huang, B.; Wang, S.; Lin, H. Sustainable land use optimization using Boundary-based Fast Genetic Algorithm. Comput. Environ. Urban Syst. 2012, 36, 257–269. [Google Scholar] [CrossRef]
  35. Liu, Y.; Peng, J.; Jiao, L.; Liu, Y. PSOLA: A heuristic land-use allocation model using patch-level operations and knowledge-informed rules. PLoS ONE 2016, 11, e0157728. [Google Scholar] [CrossRef]
  36. Masoomi, Z.; Mesgari, M.S.; Hamrah, M. Allocation of urban land uses by Multi-Objective Particle Swarm Optimization algorithm. Int. J. Geogr. Inf. Sci. 2013, 27, 542–566. [Google Scholar] [CrossRef]
  37. Liu, X.; Li, X.; Shi, X.; Huang, K.; Liu, Y. A multi-type ant colony optimization (MACO) method for optimal land use allocation in large areas. Int. J. Geogr. Inf. Sci. 2012, 26, 1325–1343. [Google Scholar] [CrossRef]
  38. Ministry of Land and Resources of the PRC. Guideline for the County-Level General Land Use Planning (TD/T 1024-2010); Ministry of Land and Resources of the PRC: Beijing, China, 2010.
  39. Wuhan Land Resources and Planning Bureau. Comprehensive Land Use Planning of Wuhan (2006–2020); Wuhan Land Resources and Planning Bureau: Wuhan, China, 2008.
  40. Wuhan Land Resources and Planning Bureau. Outline for Comprehensive Land Use Planning in Dongxihu District, Wuhan (2006–2020); Wuhan Land Resources and Planning Bureau: Wuhan, China, 2009.
  41. Wuhan Land Resources and Planning Bureau. Urban Comprehensive Planning of Wuhan (2010–2020); Wuhan Land Resources and Planning Bureau: Wuhan, China, 2010.
  42. De la Rosa, D.; Mayol, F.; Diaz-Pereira, E.; Fernandez, M.; de la Rosa, D. A land evaluation decision support system (MicroLEIS DSS) for agricultural soil protection. Environ. Model. Softw. 2004, 19, 929–942. [Google Scholar] [CrossRef]
  43. Ke, X.; Rong, G.; Han, B. Suitable Evaluation on Cultivated Land based on AHP and GIS in Hubei Province. Territ. Natl. Resour. Study 2011, 4, 35–38. (In Chinese) [Google Scholar]
  44. Office of National Soil Survey. Soils of China; China Agriculture Press: Beijing, China, 1998. [Google Scholar]
  45. USDA; SCS. National Agricultural Land Evaluation and Site Assessment Handbook; GPO: Washington, DC, USA, 1983.
  46. Zhao, H.; Zhang, F. Suitability Evaluation of Crop Land in Beijing by Means of Grid Data Integration. Chin. J. Soil Sci. 2013, 44, 1281–1286. (In Chinese) [Google Scholar]
  47. He, D.; Jin, F.; Zhou, J. Urban construction land suitability evaluation in resource-based cities: Taking the Grand Canal Ecologic and Economic Area as an example. Geogr. Res. 2011, 30, 655–666. (In Chinese) [Google Scholar]
  48. Li, C.; Xing, L.; Li, Y.; Feng, D. Land Development Suitability Evaluation Indicator System Study Based on ArcGIS. China Popul. Resour. Environ. 2014, 24, 175–178. (In Chinese) [Google Scholar]
  49. Ni, S.; Liu, Y. Suitability evaluation and sorted readjustment of rural residential areas. Territ. Natl. Resour. Study 2015, 3, 40–44. (In Chinese) [Google Scholar]
  50. Qi, Y.W.; Gu, C.L. Study on the methods and their application for the urban development spatial division: A case of Nanjing. Geogr. Res. 2010, 29, 2035–2044. (In Chinese) [Google Scholar]
  51. Shuang, W.; Hao, J.; Ai, D.; Huang, X.; Wang, Y.; Chuanmin, Z.; Chen, L. Suitability Evaluation, Subarea Control and Regulation of Rural Residential Land Based on AVC Theory. Soils 2014, 46, 126–133. (In Chinese) [Google Scholar]
  52. Zhang, X.; Fang, C.; Wang, Z.; Ma, H. Urban construction land suitability evaluation based on improved multi-criteria evaluation based on GIS (MCE-GIS): Case of New Hefei City, China. Chin. Geogr. Sci. 2013, 23, 740–753. (In Chinese) [Google Scholar] [CrossRef] [Green Version]
  53. Cui, Q.Y. Study on the Designating Scope of City Basic Ecological Control Line. J. EMCC 2012, 22, 23–26. (In Chinese) [Google Scholar]
  54. Ministry of Environmental Protection of the PRC. Technical Guideline for Delineating Source Water Protection Areas (HJ/T338-2007); Ministry of Environmental Protection of the PRC: Beijing, China, 2007.
  55. Ministry of Land and Resources of the PRC; Ministry of Water Resources of the PRC. National Land Subsidence Control Planning 2011–2020; Ministry of Land and Resources of the PRC; Ministry of Water Resources of the PRC: Beijing, China, 2012.
  56. Wang, G.; Wang, W.; Zhou, H. The Planning of Urban Fundamental Ecological Controlling Area: The Case of Guangzhou. Urban Plan. Forum 2014, 2, 73–79. (In Chinese) [Google Scholar]
  57. Wuhan Land Resources and Planning Bureau. Basic Ecological Control Line Planning of Wuhan (1:2000); Wuhan Land Resources and Planning Bureau: Wuhan, China, 2012.
  58. Jenks, G.F.; Caspall, F.C. Error on choroplethic maps: Definition, measurement, reduction. Ann. Assoc. Am. Geogr. 1971, 61, 217–244. [Google Scholar] [CrossRef]
  59. Song, M. A Framework with Improved Spatial Optimization Algorithms to Support China’s “Multi-Plan Integration” at the County Level; Queen’s University: Kingston, ON, Canada, 2018. [Google Scholar]
  60. Deb, K.; Pratab, S.; Agarwal, S.; Meyarivan, T. A Fast and Elitist Multiobjective Genetic Algorithm: NGSA-II. IEEE Trans. Evol. Comput. 2002, 6, 182–197. [Google Scholar] [CrossRef]
  61. Song, M.; Chen, D. An improved knowledge-informed NSGA-II for multi-objective land allocation (MOLA). Geo-Spat. Inf. Sci. 2018, in press. [Google Scholar] [CrossRef]
  62. Cheng, Y.; Liu, K.; Zhao, D.; Cheng, D. The Discussion of Questions Regarding Delimitation of Urban Development Boundary based on Multiple Plans Integration. Urban Dev. Stud. 2015, 22, 52–57. (In Chinese) [Google Scholar]
  63. Zhu, M.; Huang, H.; Shi, W.; Yan, B.; Wang, Z.; Liu, Y.; Zhang, Y. The Research of Prime Farmland Demarcation Based on Multi-planning-in-one: A Case Study of Yujiang County, Jiangxi Province. J. Nat. Resour. 2016, 31, 2111–2120. (In Chinese) [Google Scholar]
  64. Lin, J.; Qiao, Z.; Ye, Z. “Delimitation” and “Implementation” of Urban Growth Boundary: Analysis and Thoughts on the Practice in 14 Pilot Cities in China. Urban Plan. Forum 2017, 2, 37–43. (In Chinese) [Google Scholar]
  65. Zhao, Z.; Gong, R.; Zhang, J. A Comparative Study of China’s Urban Development Boundary Delimitation. Planners 2017, 33, 105–111. (In Chinese) [Google Scholar]
  66. Long, Y.; Han, H.; Lai, S.K.; Mao, Q. Urban growth boundaries of the Beijing Metropolitan Area: Comparison of simulation and artwork. Cities 2013, 31, 337–348. [Google Scholar] [CrossRef]
Figure 1. The rational planning with multi-criteria evaluation and spatial optimization (RP-MCE-SOP) framework for China’s county-level “three-space” and “three-line” planning.
Sustainability 11 02997 g001
Figure 2. Location of Dongxihu District of Wuhan City.
Sustainability 11 02997 g002
Figure 3. Physical, soil, and land use data in Dongxihu District of Wuhan City: (a) Digital elevation model (DEM), (b) water bodies, (c) soil productivity, and (d) current land use (2010).
Sustainability 11 02997 g003
Figure 4. Compact land allocation and scattered land allocation: (a) scattered allocation, (b) compact allocation, and (c) number of neighboring cells.
Sustainability 11 02997 g004
Figure 5. Land suitability classification: (a) land suitability classification for agriculture, (b) land suitability classification for construction, and (c) land suitability classification for conservation.
Sustainability 11 02997 g005
Figure 6. Edge_crossover in the patch-based Non-dominated Sorting Genetic Algorithm (NSGA-II) algorithm.
Sustainability 11 02997 g006
Figure 7. Patch_based_mutation in the patch-based Non-dominated Sorting Genetic Algorithm (NSGA-II) algorithm.
Sustainability 11 02997 g007
Figure 8. Constraint_edge_suitability_mutation in the patch-based Non-dominated Sorting Genetic Algorithm (NSGA-II) algorithm.
Sustainability 11 02997 g008
Figure 9. Mapping of selected solutions from spatial optimization results: (a) agriculture-oriented solution, (b) construction-oriented solution, (c) conservation-oriented solution, and (d) solution maximizing spatial compactness.
Sustainability 11 02997 g009
Figure 10. Two-step post-processing procedure.
Sustainability 11 02997 g010
Figure 11. Mapping of post-processed solutions: (a) agriculture-oriented solution, (b) construction-oriented solution, (c) conservation-oriented solution, and (d) solution maximizing spatial compactness.
Sustainability 11 02997 g011
Figure 12. “Three-space” and “three-line” planning map for Dongxihu District: (a) Solution giving priority to agriculture, and (b) Solution giving priority to construction.
Sustainability 11 02997 g012
Table 1. Multi-criteria evaluation (MCE) methods for land suitability evaluation.
Multi-Criteria Evaluation (MCE) MethodsMain CharacteristicsReferences
Boolean evaluationEach criterion is evaluated with binary values; multiple criteria are combined with AND/OR operation.[21]
Weighted linear combination (WLC)Each criterion is evaluated with continuous values; multiple criteria are combined by multiplying each criterion with a user-supplied weight.[21]
Analytical hierarchy analysis (AHP)The MCE problem is interpreted with a hierarchical structure; each criterion is assessed with its lower-level criteria; multiple criteria are pairwise compared to derive the priority scales based on expert’s knowledge.[22,23]
Outranking methods (OM)OMs build a series of pair-wise comparisons, analyze the degree to which one alternative outranks the other on the specified criteria.[24]
Ideal point analysis (IPA)IPA estimates the suitability level of a land unit for a single land use type based on its distance (deviation) from the ideal point.[25]
Artificial neural networks (ANN)ANNs simulate the way that the human brain works; it provides a mechanism of learning by examples and adapts to new conditions not necessarily based on a priori knowledge.[26]
Table 2. Data and data source for the case study.
DataSource
Statistical dataDongxihu Almanac (2010)
Physical geographical data:
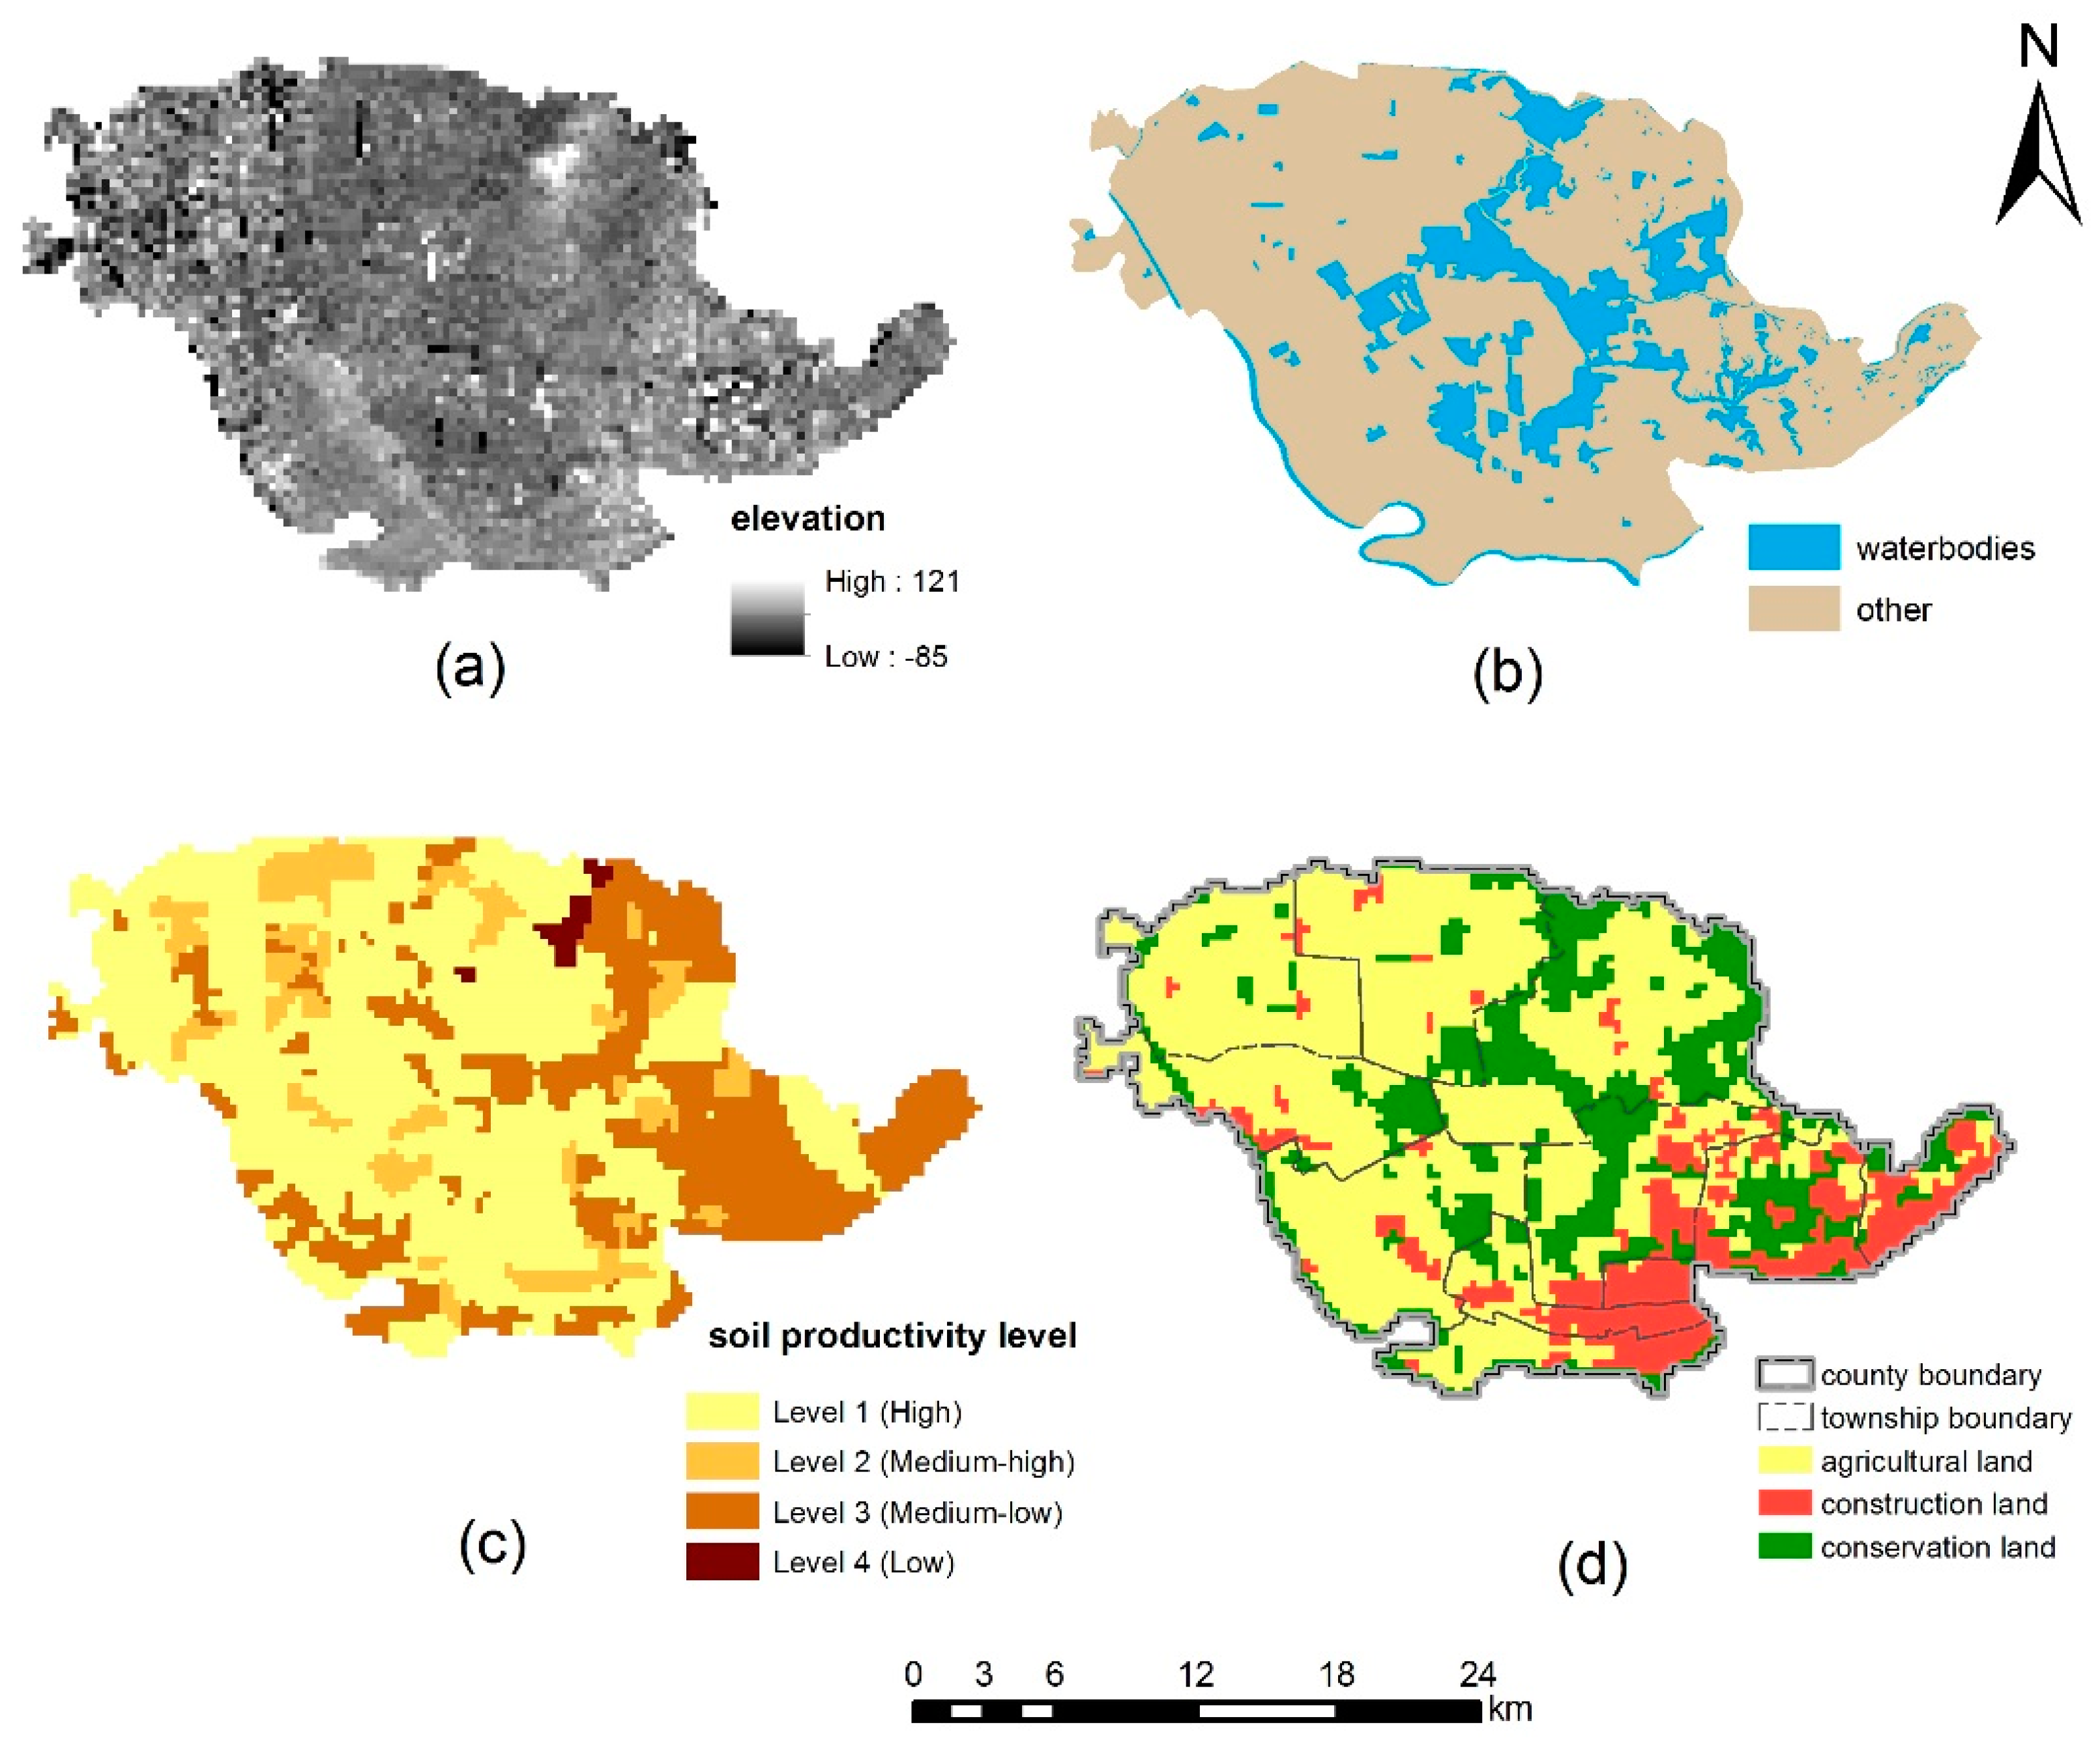
Digital elevation model (DEM) (Figure 3a), water bodies (Figure 3b)Data Center for Resources and Environmental Sciences, Chinese Academy of Sciences (RESDC)
Soil data (Figure 3c)Published documents of the Second National Soil Census
Land use/cover data:
GlobelLand30 land cover data (30 m resolution)National Geomatics Center of China
Land use map (1:10,000)Department of Land, Resource, and Planning of Dongxihu District
Table 3. Upper and lower limits for percentage/area/number of cells allocated for each land use.
Land Use TypeLower LimitUpper Limit
PercentageArea (Hectare)Number of CellsPercentageArea (Hectare)Number of Cells
Agriculture48.9%22,950255050.8%23,8232647
Construction27.0%12,654140629.0%13,6171513
Conservation25.5%11,979133129.8%13,9951555
Table 4. Criteria for evaluating land suitability for agriculture.
Criteria/FactorsReferences
Topographyelevation, slope, aspect[39,40,41,42,43,44,45,46]
Soil productivitysoil organic content, soil N content, active P (P2O5) content, active K (K2O) content, soil pH value, top soil depth, texture of soil
Land use/coverland use/cover type
Drainage and irrigation systemdrainage and irrigation system condition
Locationadjacent land use, distance to urbanized area (urban center/township center), distance to current construction land, distance to main road
Planning/policy compatibilityplanned use in urban and rural comprehensive planning, planned use in city-level land use planning, planned use in county-level land use planning
Table 5. Criteria for evaluating land suitability for construction.
Criteria/FactorsReferences
Physical factorsTopographical factors
elevation, slope, landform
[47,48,49,50,51,52]
Geological factors
subgrade bearing capacity, distance to areas prone to geological hazards
Hydrological factors
distance to river, lake, and reservoir
Socio-economic factorsPopulation
Population density
Location and transportation
distance to Wuhan central cities, distance to county urban center, distance to township center, distance to planned central villages, distance to highway entrance, distance to national/provincial/county road, distance to metro entrance
Economic conditions
GDP per capita, land output, fiscal revenue
Accessibility to public service facility
distance to (primary/secondary) school, distance to hospital/clinics
Land use
land use type, construction land percentage, settlement scale
Ecological factorsProtected areas
natural reserve zone, forest park, scenic site, historical site, wetland
Table 6. Criteria for evaluating land suitability for conservation.
CriteriaCriterion SpecificationReferences
Hydrologywater source protection area river, lake, and reservoir and their buffer zone1000 m upstream of the intakes, 300 m downstream of the intakes (including three water intakes: Xihu Water Plant, Baiheju Water Plant, Wushidun Water Plant)
Han River and its 300 m buffer, other rivers, lakes, and reservoirs and their 50 m buffer
[53,54,55,56,57]
Geologyareas prone to geological hazardshigh elevation area (>40 m) area with steep slopes (>16°)
Land cover/usewetland, waterbody, urban green space, forest, grassland
Other protected areasnatural conservation areas, historical sitesJinyinhu national wetland park, Fuhe wetland park
Boquan ecological tourism zone
Table 7. Selected solutions from spatial optimization results.
SolutionsOFVArea of Each Land Use (Hectare)
Objective 1Objective 2Objective 3Objective 4AgricultureConstructionConservation
a2056.58877.731257.004252.9023,81412,65413,140
b1984.00932.171290.004278.9822,95013,18513,473
c1953.69872.111353.004213.6722,95912,65413,995
d1980.02884.211311.004386.6720,25012,69913,959
Table 8. Area of each land use in the post-processed solutions.
SolutionsNumber of Land Units
AgricultureConstructionConservation
a23,49012,96013,158
b22,63513,48213,491
c22,69813,08613,824
d22,60813,09513,905

