Farmers’ Intention to Climate Change Adaptation in Agriculture in the Red River Delta Biosphere Reserve (Vietnam): A Combination of Structural Equation Modeling (SEM) and Protection Motivation Theory (PMT)


 , ,
, , 
Abstract
:1. Introduction
2. Methodology
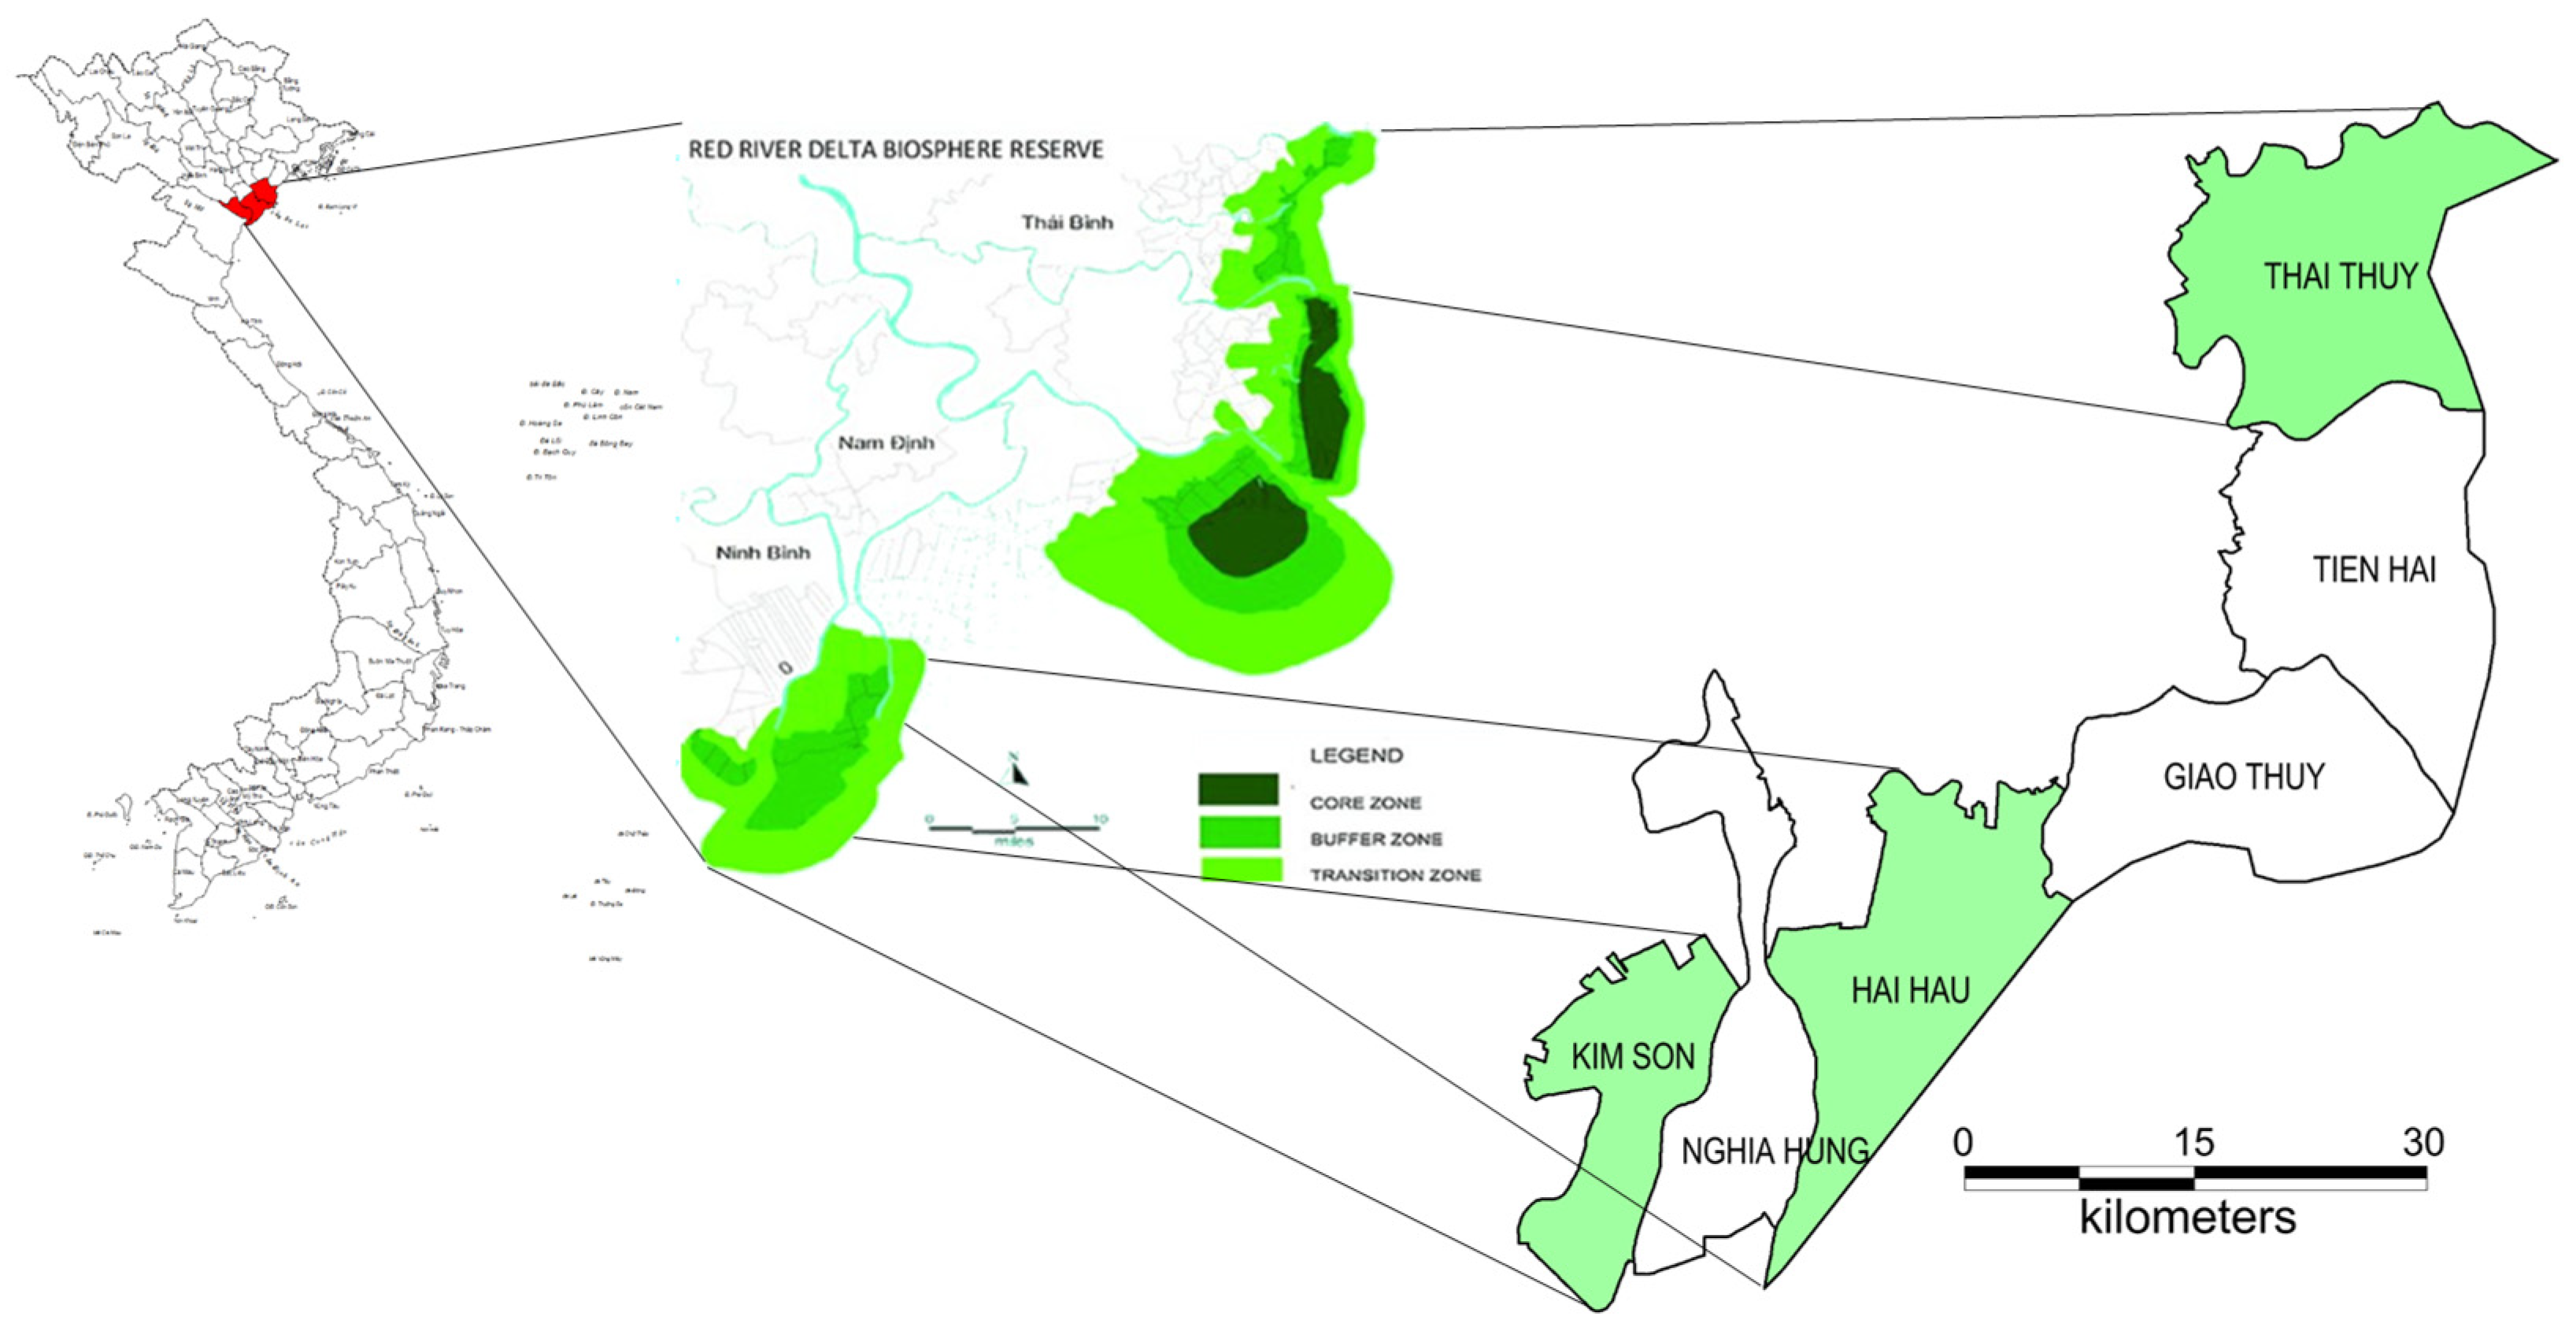
2.1. Study Area
- The Thai Thuy district is located in the North East of the Thai Binh province. The district has a coastline of 27 km. It covers an area of 26,844 hectares. The population is about 250,000. The average annual income per capita of 1550 $US is mainly based on agriculture, which is the main economic sector in the district (200 million $US in 2017) [33].
- The Hai Hau district covers 22,815 hectares. The district population is 260,000. Since 2011, the district has completed the policy of land consolidation, increasing the area per plot, creating favorable conditions for farmers, applying agricultural mechanization and restructuring the agricultural economy towards industrialization and modernization. Land consolidation reduced the number of plots to 1.9 per household. This allowed gathering 321 land areas of public lands, 405 production land areas ranging from 10 to 40 ha, and the formations of 7 agricultural zones. The average rice yield reaches 12.7 tons per hectare. ‘Gao tam Hai Hau’ is high-quality rice, which is grown over 7600 hectares, and provides a yield of about 43 $US per hectare. Shrimp and brackish water aquaculture ponds concentrate along the coast e.g., in Hai Chinh, Hai Trieu and Hai Dong. The average annual income per capita in the district is 1750 $US [34].
- Kim Son is the only coastal district of Ninh Binh province. It covers 21,571 hectares. In 2017, the district population totaled 173,041 inhabitants. The total value of the agricultural production is 74.82 million $US. The total annual rice yield is 95,000 tons an average 57.9 tons per hectare. The annual output of aquatic products is over 25,000 tons [35].
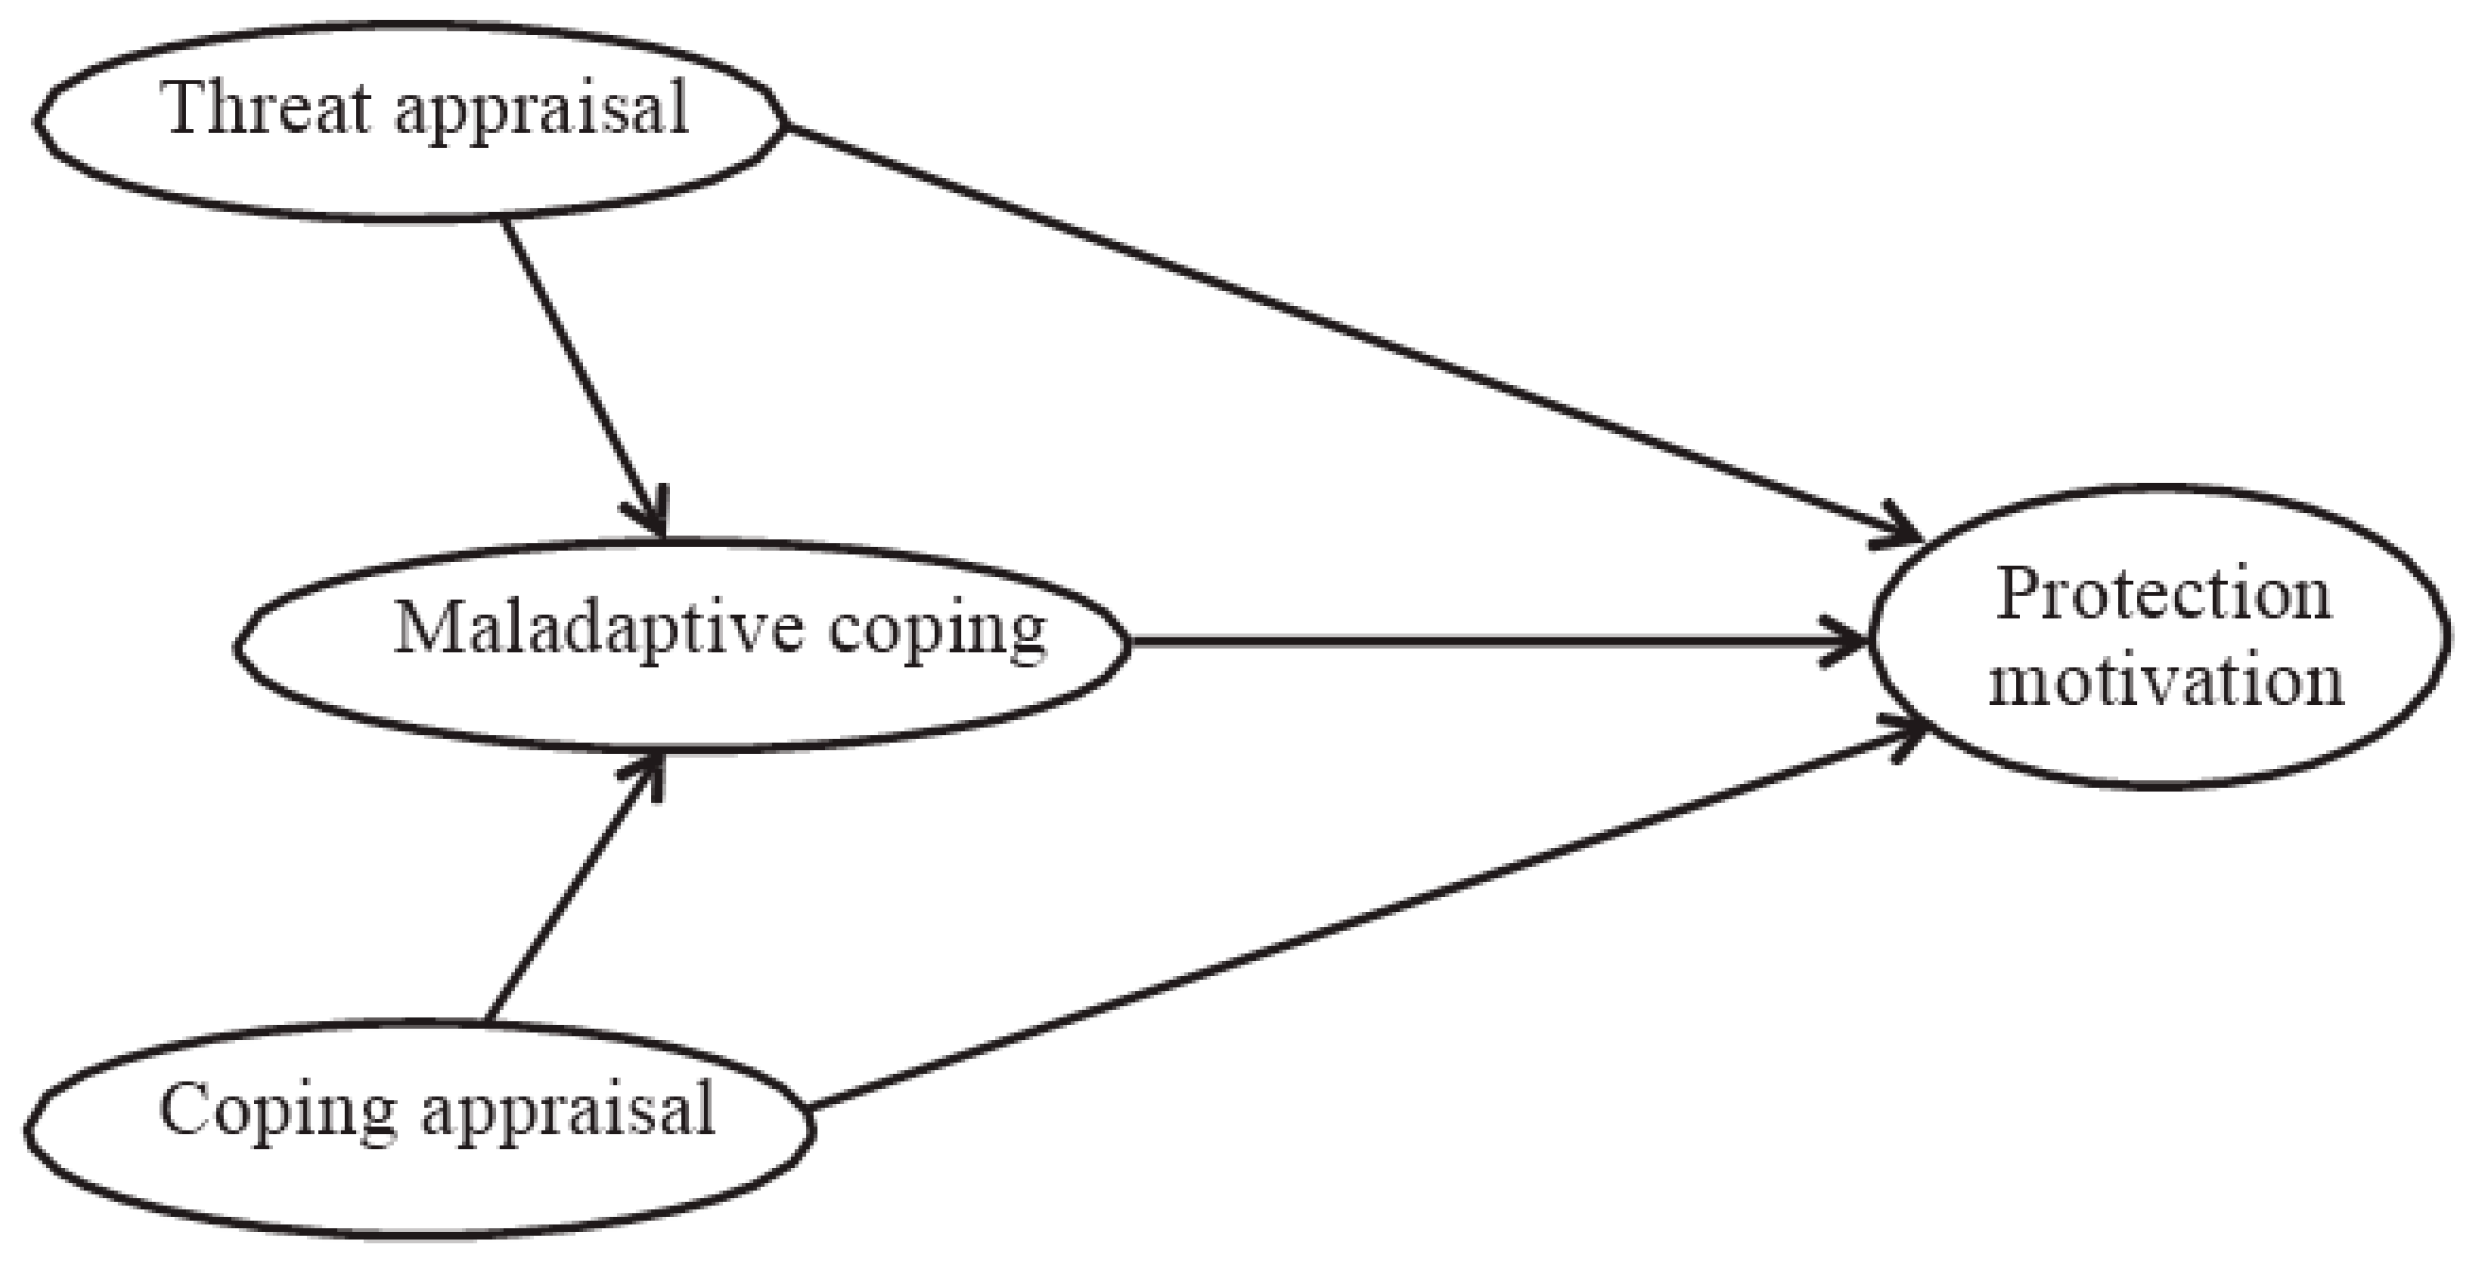
2.2. Protection Motivation Theory
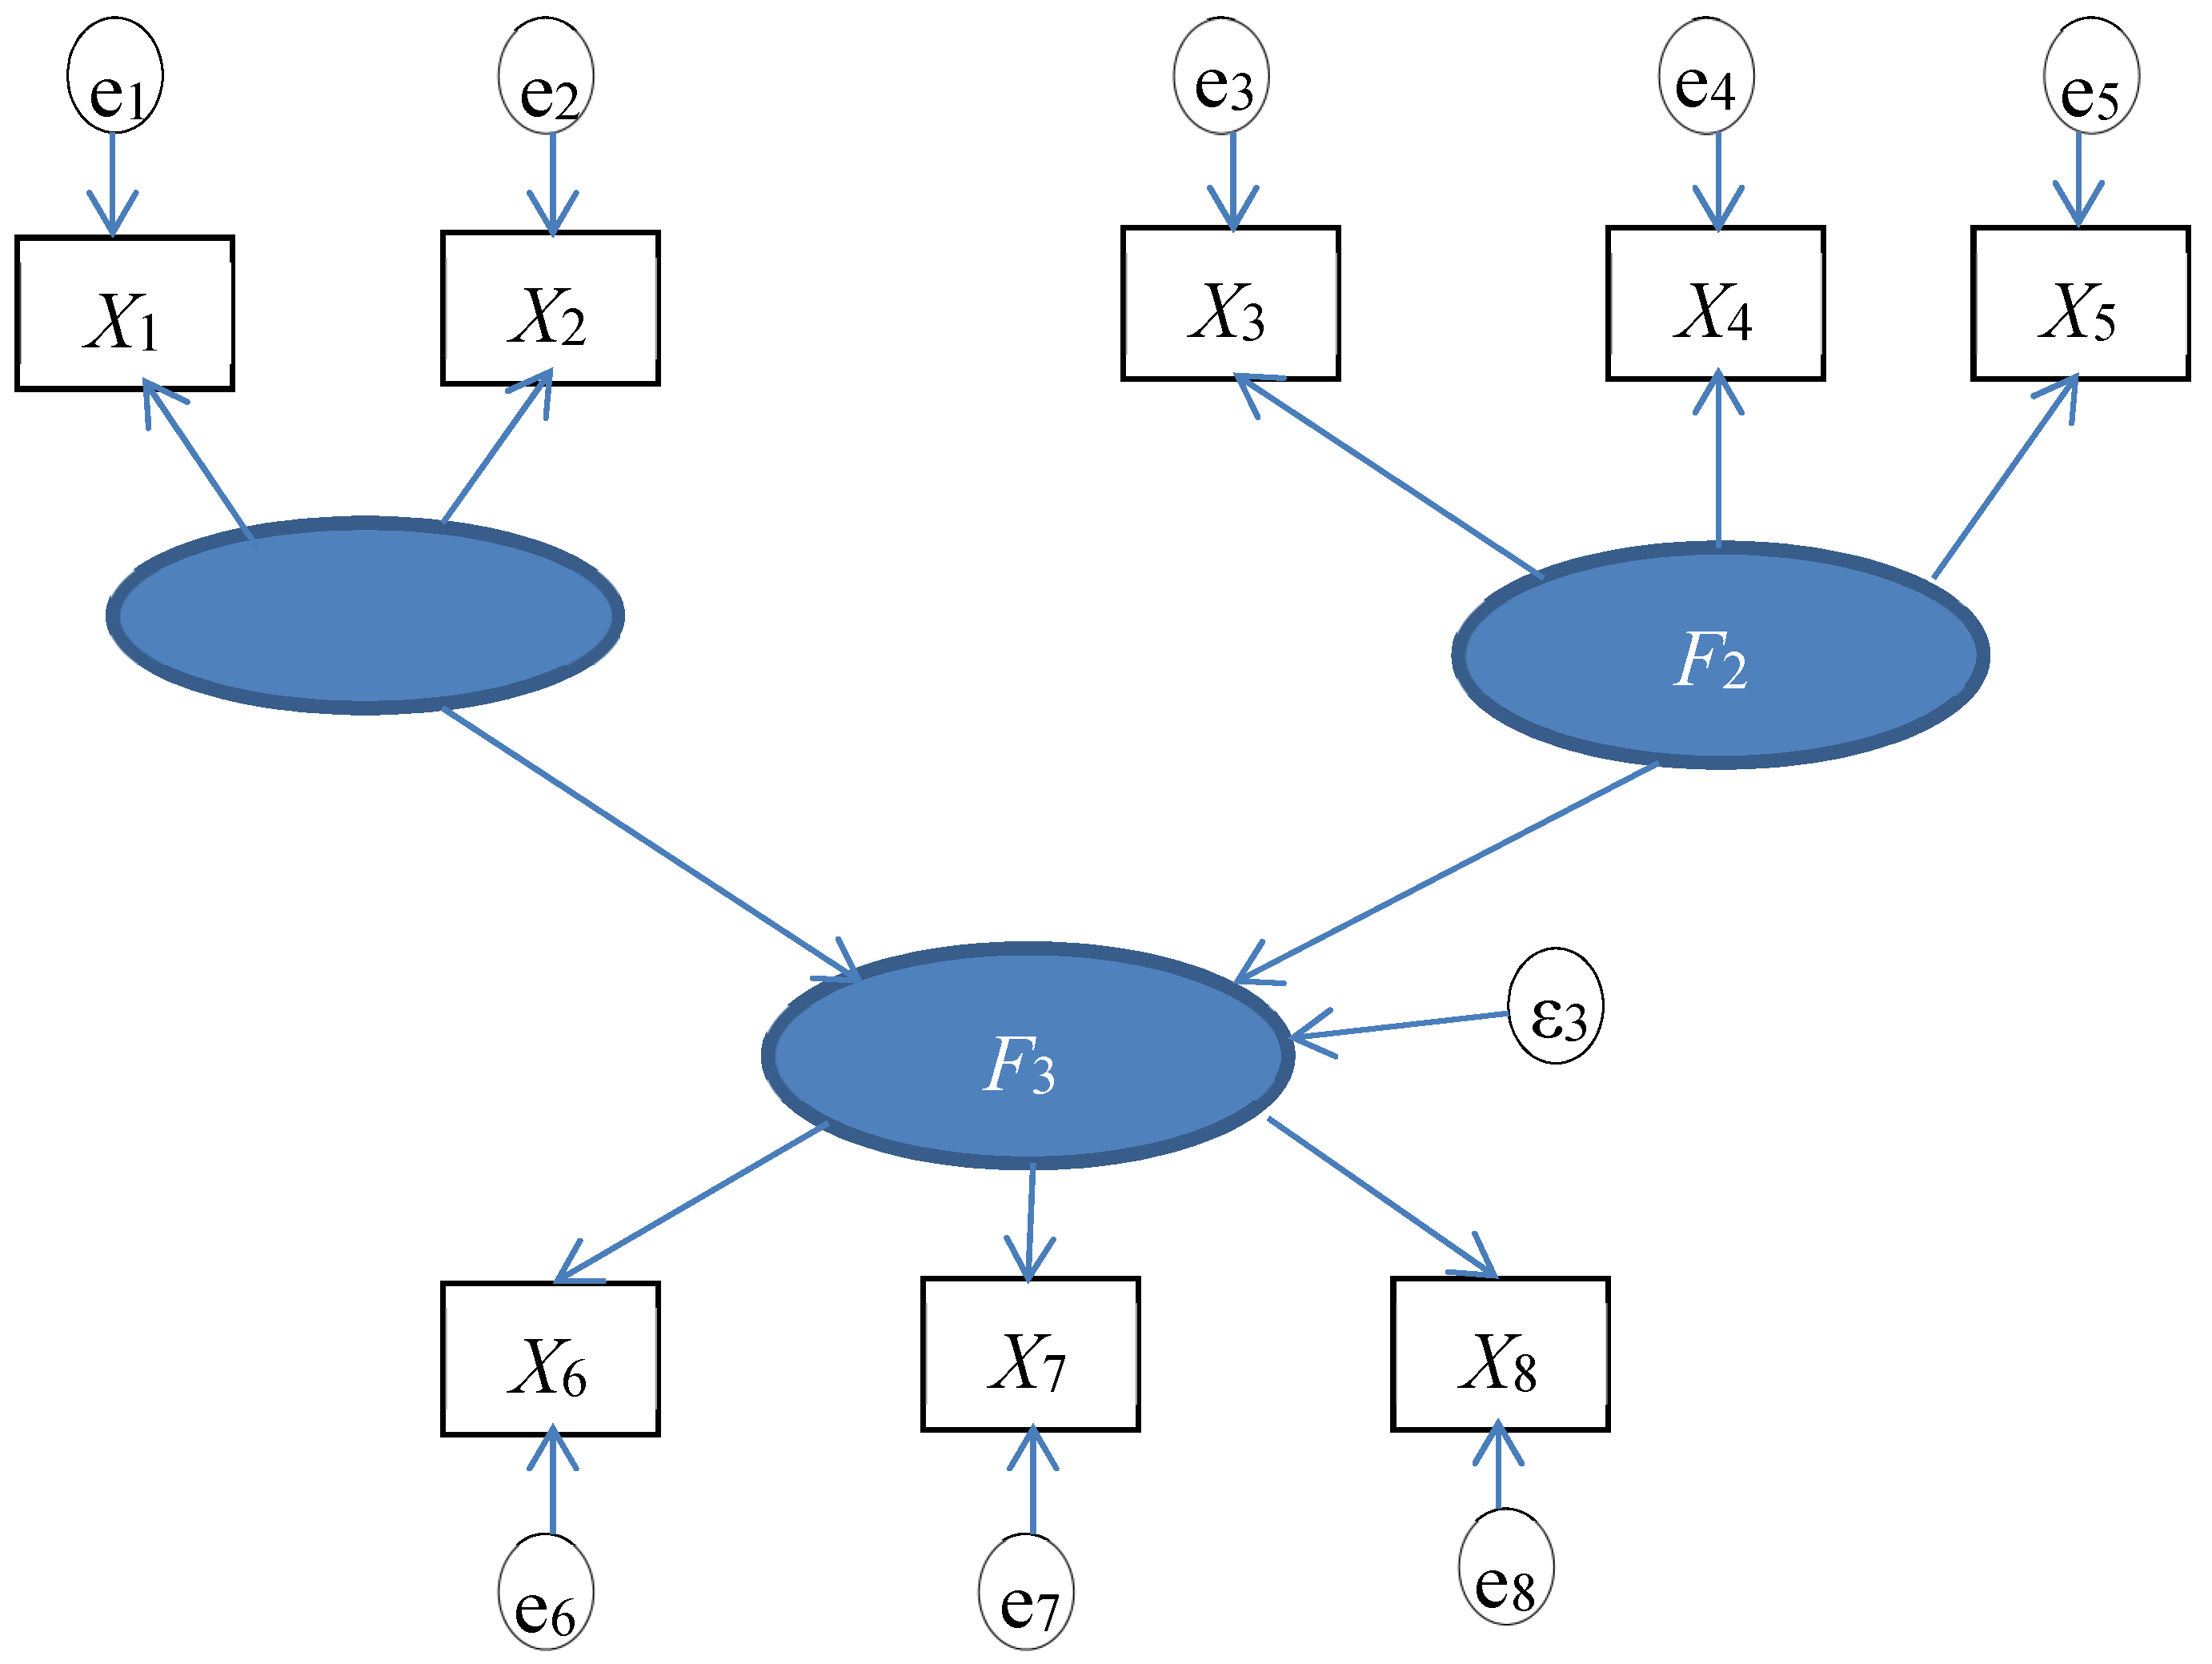
2.3. Structural Equation Modeling
2.3.1. Factor Analysis
2.3.2. Structural Modeling
2.3.3. Bootstrapping
3. Results
3.1. Reliability
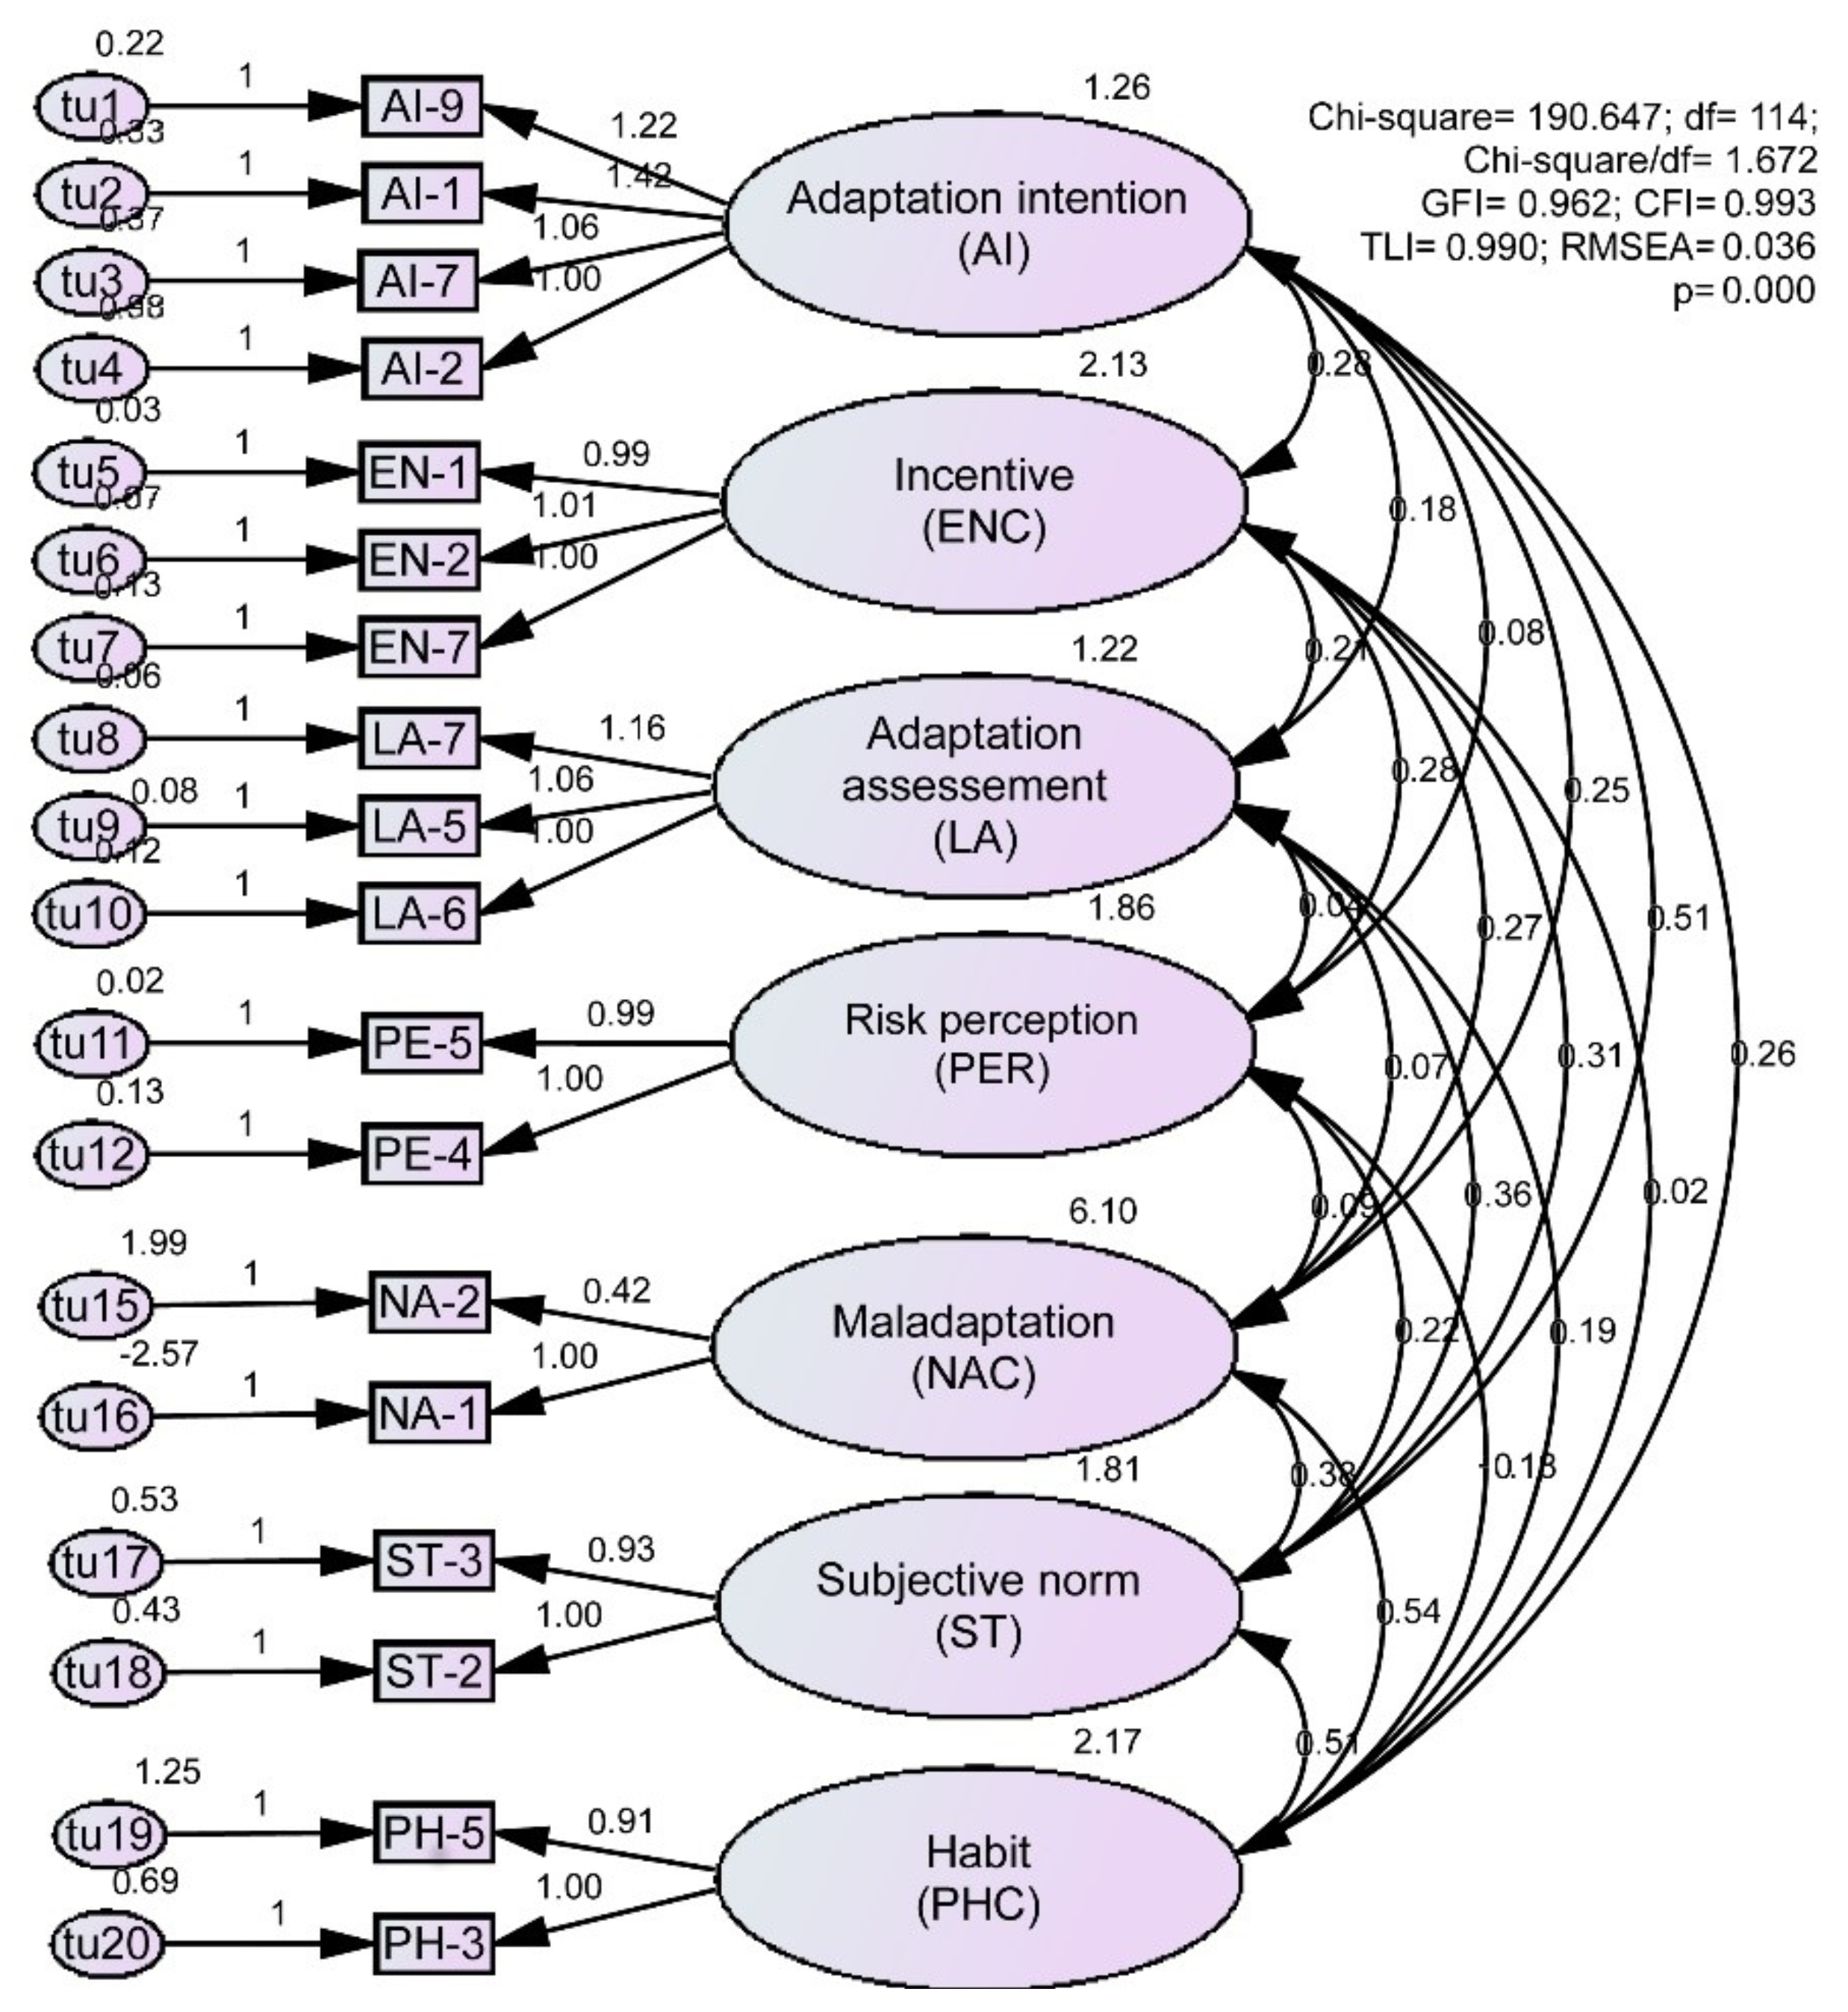
3.2. Factor Analysis
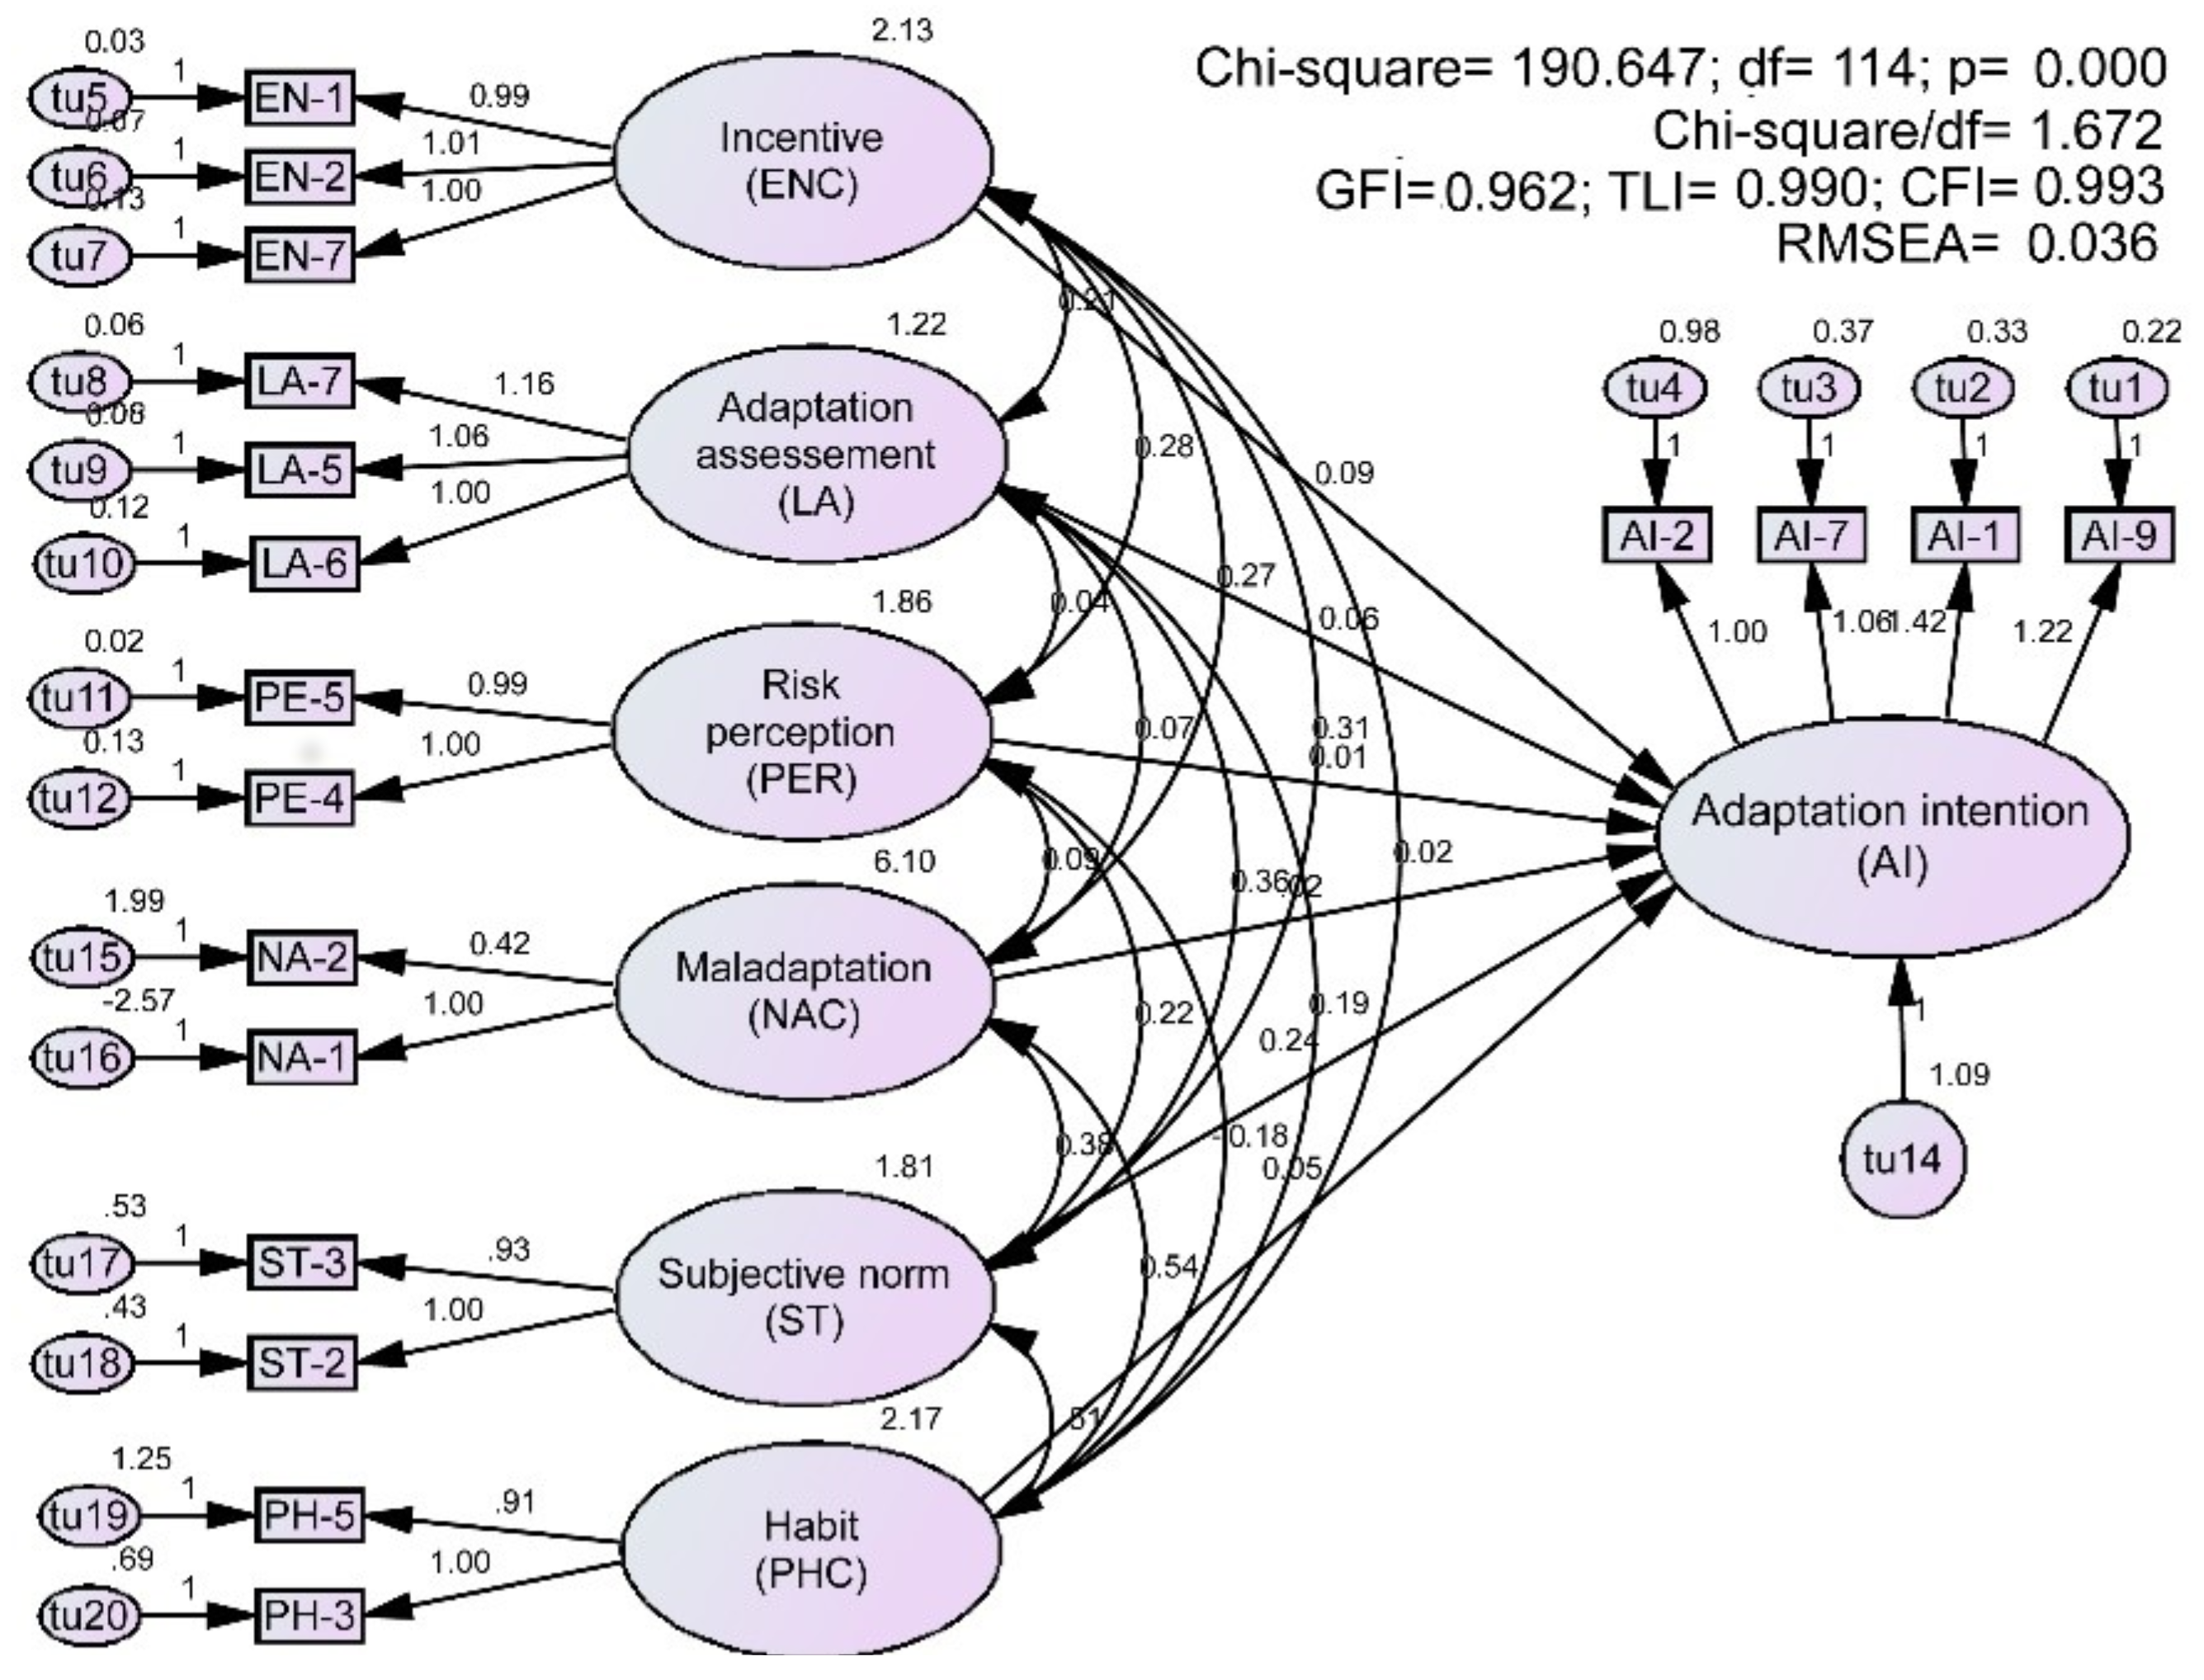
3.3. Structural Modelling
3.4. Bootstrapping
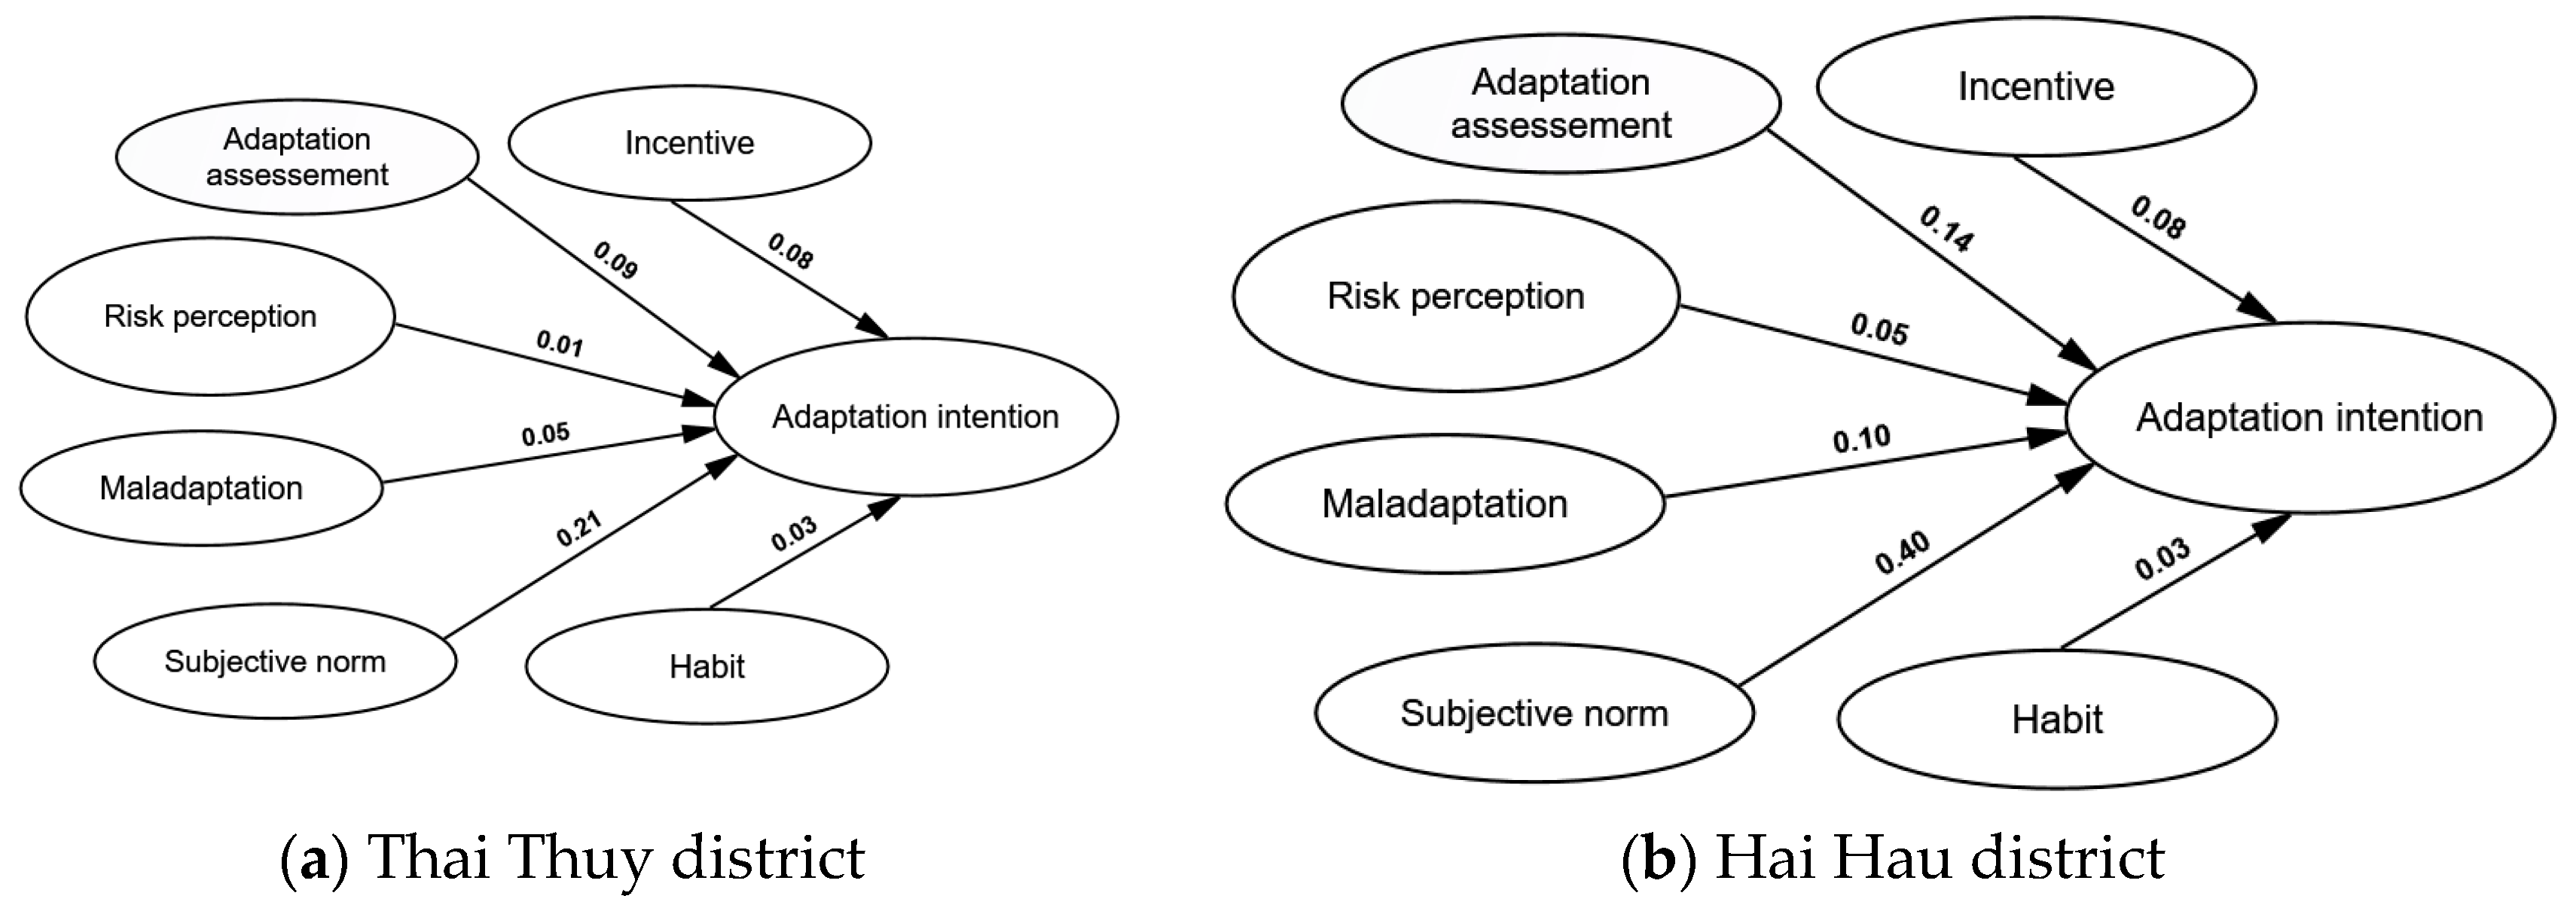
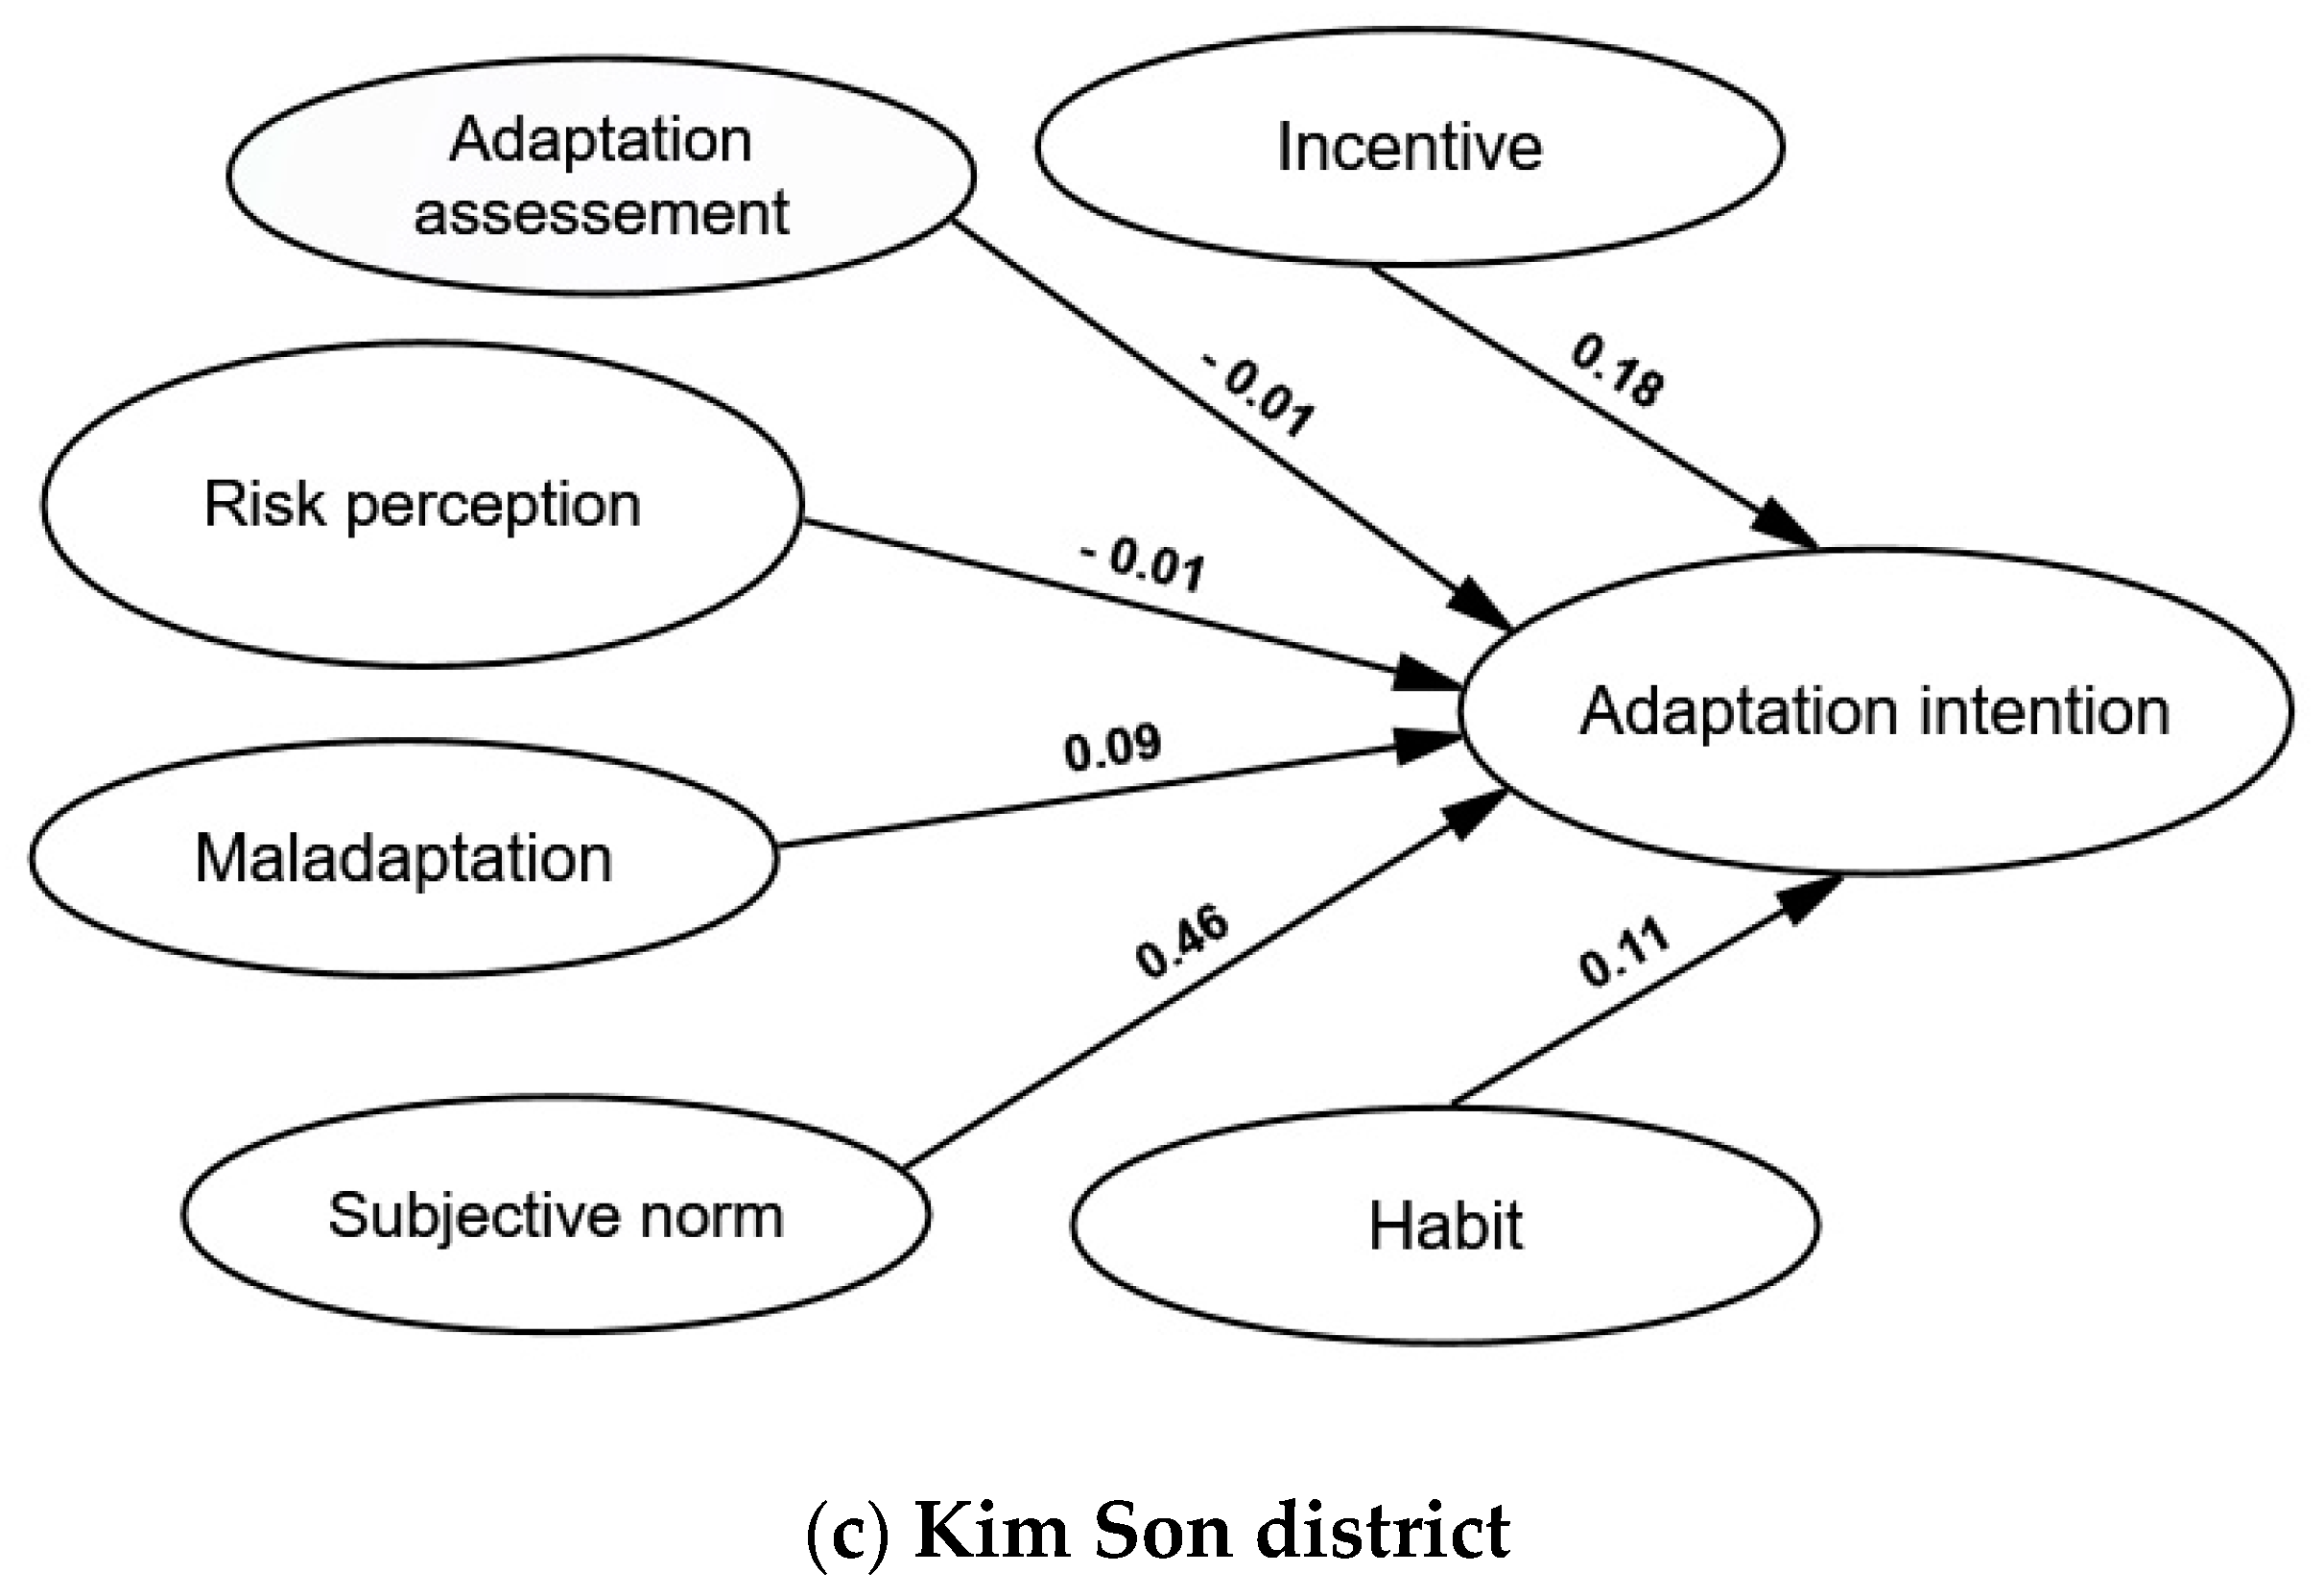
3.5. Multi-Group Structural Analysis
- The variability methods of the multi-regional analysis of the 3 selected districts are different: the models for Hai Hau and Thai Thuy have a positive impact, while the Kim Son district shows a negative impact.
- Comparing the Chi-square of the variability model with the Chi-square of the invariability model: Chi-square of the variability model is 458.239; the Chi-square of the invariant model is 476.764; p-value = 0.000343 (<0.05). This allows rejecting H0. Consequently, H1 is accepted, which indicates there is a difference between the Chi-square of the variability model and the results for the invariability model. This analysis shows a difference in Chi-square between the variability model and the invariability model. A difference among the correlation coefficients exists between the factors influencing ‘Adaptation Intention to Climate Change’, and the ‘Adaptation Intention to Climate Change’ among the selected districts.
4. Suggestions: Structural Model for Farmer’s Intention to Climate Change Adaptation in Agriculture
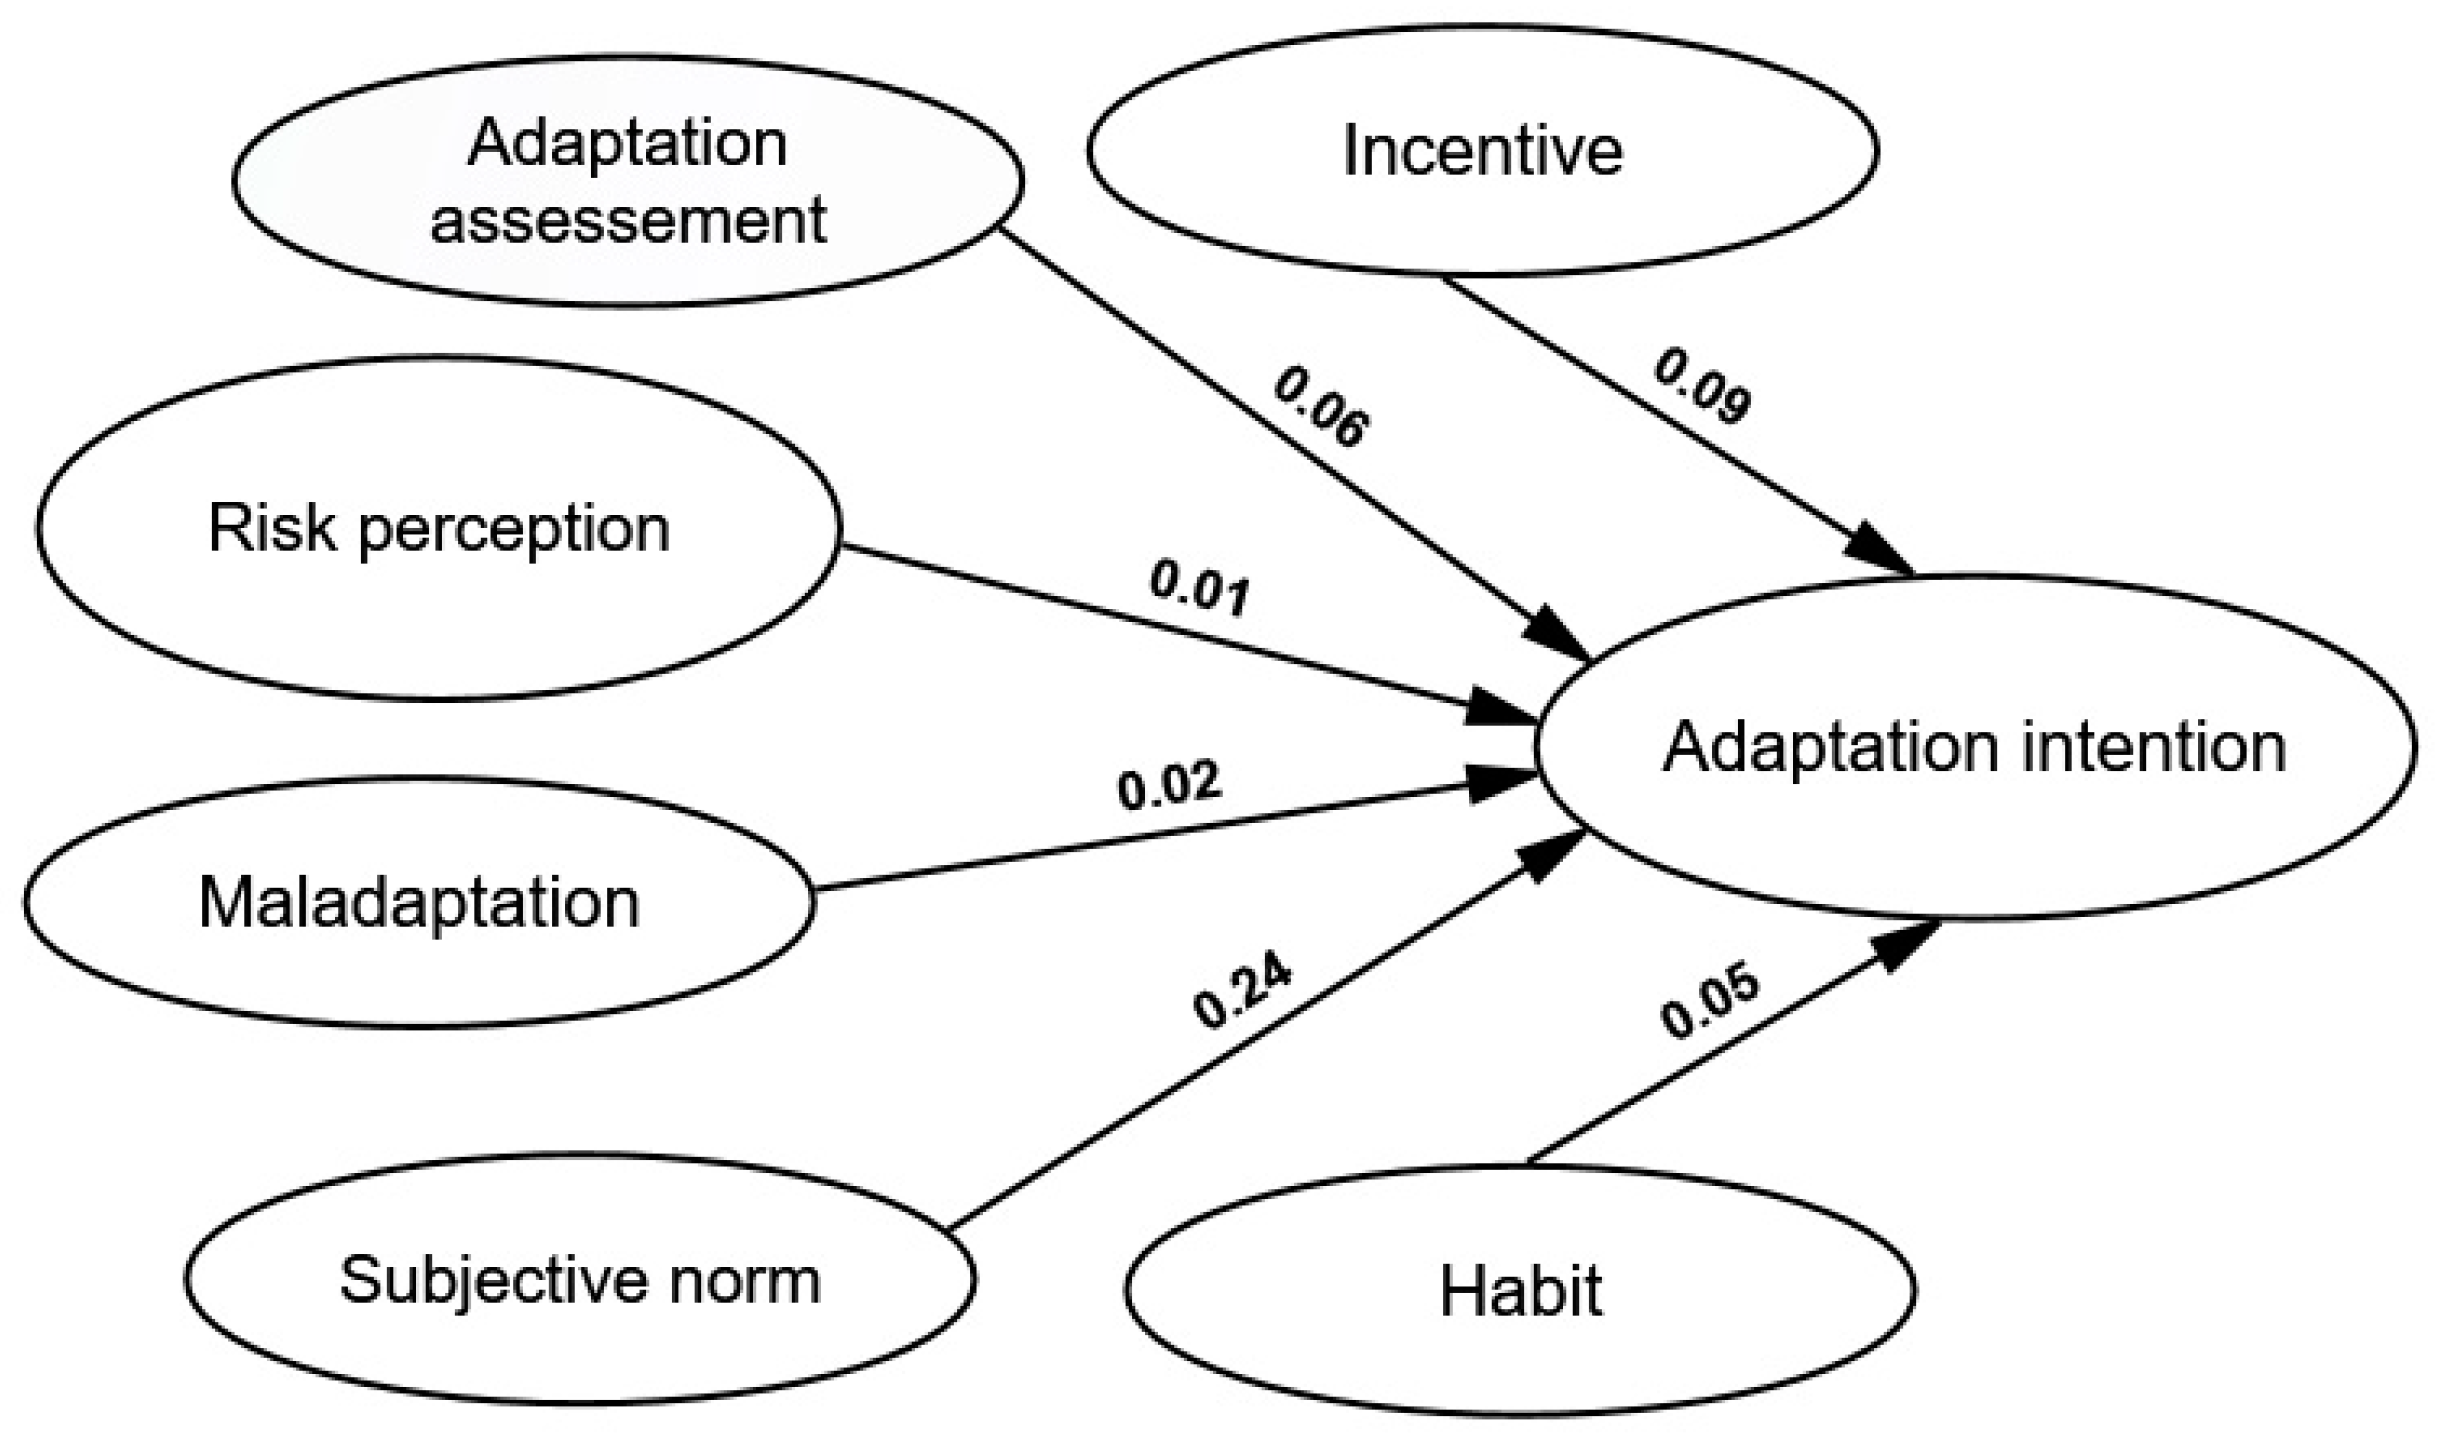
4.1. A Structural Model at Regional Level
4.2. Structural Models at Local Level
5. Conclusions
Author Contributions
Funding
Acknowledgments
Conflicts of Interest
References
- Zhao, Y.; Wang, C.; Wang, S.; Tibig, L.V. Impacts of present and future climate variability on agriculture and forestry in the humid and sub-humid tropics. Clim. Chang. 2005, 70, 73–116. [Google Scholar] [CrossRef]
- IPCC. Climate Change 2014 Synthesis Report; Core Writing Team, Pachauri, R.K., Meyer, L.A., Eds.; Contribution of Working Groups I, II and III to the Fifth Assessment Report of the Intergovernmental Panel on Climate Change; IPCC: Geneva, Switzerland, 2014; 151p. [Google Scholar]
- Pearson, D.; Newman, P. Climate security and a vulnerability model for conflict prevention: A systematic literature review focusing on African agriculture. Sustain. Earth 2019, 2, 2. [Google Scholar] [CrossRef]
- Reid, S.; Smit, B.; Caldwell, W.; Belliveau, S. Vulnerability and adaptation to climate risks in Ontario agriculture. Mitig. Adapt. Strateg. Glob. Chang. 2007, 12, 609–637. [Google Scholar] [CrossRef]
- Frank, E.; Eakin, H.; Lopez-Carr, D. Social identity, perception and motivation in adaptation to climate risk in the coffee sector of Chiapas, Mexico. Glob. Environ. Chang. 2011, 21, 66–76. [Google Scholar] [CrossRef]
- Shah, K.U.; Dulal, H.B.; Johnson, C.; Baptiste, A. Understanding livelihood vulnerability to climate change: Applying the livelihood vulnerability index in Trinidad and Tobago. Geoforum 2013, 47, 125–137. [Google Scholar] [CrossRef]
- Takahashi, B.; Burnham, M.; Terracina-Hartman, C.; Sopchak, A.R.; Selfa, T. Climate change perceptions of ny state farmers: The role of risk perceptions and adaptive capacity. Environ. Manag. 2016, 58, 946–957. [Google Scholar] [CrossRef]
- Douglass-Gallagher, E.; Stuart, D. Crop growers’ adaptive capacity to climate change: A situated study of agriculture in Arizona’s Verde Valley. Environ. Manag. 2019, 63, 94–109. [Google Scholar] [CrossRef]
- Gandure, S.; Walker, S.; Botha, J.J. Farmers’ perceptions of adaptation to climate change and water stress in a South African rural community. Environ. Dev. 2013, 5, 39–53. [Google Scholar] [CrossRef]
- Below, T.B.; Schmid, J.C.; Sieber, S. Farmers’ knowledge and perception of climatic risks and options for climate change adaptation: A case study from two Tanzanian villages. Reg. Environ. Chang. 2015, 15, 1169–1180. [Google Scholar] [CrossRef]
- Kibue, G.W.; Liu, X.; Zheng, J.; Zhang, X.; Pan, G.; Li, L.; Han, X. Farmers’ perceptions of climate variability and factors influencing adaptation: Evidence from Anhui and Jiangsu, China. Environ. Manag. 2016, 57, 976–986. [Google Scholar] [CrossRef]
- Carlos, S.M.; Cunha, D.A.; Pires, M.V.; Couto-Santos, F.R. Understanding farmers’ perceptions and adaptation to climate change: The case of Rio das Contas basin, Brazil. GeoJournal 2019, 1–17. [Google Scholar] [CrossRef]
- Ziervogel, G.; Johnston, P.; Matthew, M.; Mukheibir, P. Using climate information for supporting climate change adaptation in water resource management in South Africa. Clim. Chang. 2010, 103, 537–554. [Google Scholar] [CrossRef]
- Alauddin, M.; Sarkerb, M.A.R. Climate change and farm-level adaptation decisions and strategies in drought-prone and groundwater-depleted areas of Bangladesh: An empirical investigation. Ecol. Econ. 2014, 106, 204–213. [Google Scholar] [CrossRef]
- Partey, S.T.; Dakorah, A.D.; Zougmoré, R.B.; Ouédraogo, M.; Nyasimi, M.; Nikoi, G.K.; Huyer, S. Gender and climate risk management: Evidence of climate information use in Ghana. Clim. Chang. 2018, 1–15. [Google Scholar] [CrossRef]
- Bahinipati, C.S.; Venkatachalamb, L. What drives farmers to adopt farm-level adaptation practices to climate extremes: Empirical evidence from Odisha, India. Disaster Risk Reduct. 2015, 14, 347–356. [Google Scholar] [CrossRef]
- Truelove, H.B.; Carrico, A.R.; Thabrew, L. A socio-psychological model for analyzing climate change adaptation: A case study of Sri Lankan paddy farmers. Glob. Environ. Chang. 2015, 31, 85–97. [Google Scholar] [CrossRef]
- Arunrat, N.; Wang, C.; Pumijumnong, N.; Sereenonchai, S.; Cai, W. Farmers’ intention and decision to adapt to climate change: A case study in the Yom and Nan basins, Phichit province of Thailand. Clean. Prod. 2017, 143, 672–685. [Google Scholar] [CrossRef]
- Makuvaro, V.; Walker, S.; Masere, T.P.; Dimes, J. Smallholder farmer perceived effects of climate change on agricultural productivity and adaptation strategies. Arid Environ. 2018, 152, 75–82. [Google Scholar] [CrossRef]
- Tripathi, A.; Mishra, A.K. Knowledge and passive adaptation to climate change: An example from Indian farmers. Clim. Risk Manag. 2017, 16, 195–207. [Google Scholar] [CrossRef]
- Li, S.; Juhász-Horváth, L.; Harrison, P.A.; Pintér, L.; Rounsevell, M.D.A. Relating farmer’s perceptions of climate change risk to adaptation behaviour in Hungary. Environ. Manag. 2017, 185, 21–30. [Google Scholar] [CrossRef]
- Santibánez-Andrade, G.; Castillo-Argüero, S.; Vega-Pena, E.V.; Lindig-Cisneros, R.; Zavala-Hurtado, J.A. Structural equation modeling as a tool to develop conservation strategies using environmental indicators: The case of the forests of the Magdalena river basin in Mexico City. Ecol. Indic. 2015, 54, 124–136. [Google Scholar] [CrossRef]
- Islam, M.M.; Barnes, A.; Toma, L. An investigation into climate change scepticism among farmers. Environ. Psychol. 2013, 34, 137–150. [Google Scholar] [CrossRef]
- Far, S.T.; Rezaei-Moghaddam, K. Determinants of Iranian agricultural consultants’ intentions toward precision agriculture: Integrating innovativeness to the technology acceptance model. Saudi Soc. Agric. Sci. 2017, 16, 280–286. [Google Scholar]
- Wang, J.; Tao, J.; Yang, C.; Chu, M.; Lam, H. A general framework incorporating knowledge, risk perception and practices to eliminate pesticide residues in food: A Structural Equation Modelling analysis based on survey data of 986 Chinese farmers. Food Control 2017, 80, 143–150. [Google Scholar] [CrossRef]
- Jack, C.; Hotchkiss, E.; Sargison, N.D.; Toma, L.; Milne, C.; Bartley, D.J. A quantitative analysis of attitudes and behaviours concerning sustainable parasite control practices from Scottish sheep farmers. Prev. Vet. Med. 2017, 139, 134–145. [Google Scholar] [CrossRef]
- Dang, H.L.; Li, E.; Nuberg, I.; Bruwer, J. Understanding farmers’ adaptation intention to climate change: A structural equation modelling study in the Mekong Delta, Vietnam. Environ. Sci. Policy 2014, 41, 11–22. [Google Scholar] [CrossRef]
- IPCC. Climate Change 2007: Impacts, Adaptation, and Vulnerability; Parry, M.L., Canziani, O.F., Palutikof, J.P., van der Linden, P.J., Hanson, C.E., Eds.; Contribution of Working Group II to the Fourth Assessment Report of the Intergovernmental Panel on Climate Change; Cambridge University Press: Cambridge, UK, 2007; 976p. [Google Scholar]
- Dasgupta, S.; Lapla, B.; Murray, S.; Wheeler, D. Sea-Level Rise and Storm Surges: A Comparative Analysis of Impacts in Developing Countries; World Bank Policy Research Working Paper (42), WPS4901; World Bank: Washington, DC, USA, 2009; 41p. [Google Scholar]
- Le, T.H.; Nguyen, A.T.; Tran, A.T.; Dao, D.C.; Luu, T.A.; Hoang, L.T.T.; Nguyen, M.H.; Tran, Q.B.; Le, V.H.; Uong, D.K.; et al. Impacts of climate change on agro-ecological landscapes in the coastal area of the Thai Binh province (Vietnam) using the Delphi technique. Clim. Chang. Strateg. Manag. 2015, 7, 222–239. [Google Scholar]
- MONRE (Ministry of Natural Resources and Environment), UNDP. Build Ability to Recover: Adaptation Strategies for Livelihoods in Coastal Area That Is Most at Risk Due to the Impact of Climate Change in Central Vietnam; Report of Research Project Poverty and Environment; NARENCA Publisher: Hanoi, Vienam, 2010. (In Vietnamese)
- MONRE (Vietnamese Ministry of Natural Resources and Environment). Climate Change and Sea Level Rise Scenarios for Vietnam; NARENCA Publisher: Hanoi, Vietnam, 2016; 170p.
- TBG (Thai Binh Provincial Government). Socio-Economic Development Report for Thai Binh Province in 2017; Annual Official Report; Thai Binh Provincial Government: Thai Binh, Vietnam, 2018; 39p. (In Vietnamese)
- NDG (Nam Dinh Provincial Government). Socio-Economic Development Report for Nam Dinh Province in 2017; Annual Official Report; Nam Dinh Provincial Government: Nam Dinh, Vietnam, 2018; 83p. (In Vietnamese)
- NBG (Ninh Binh Provincial Government). Socio-Economic Development Report for Ninh Binh Province in 2017; Annual Official Report; Ninh Binh Provincial Government: Ninh Binh, Vietnam, 2018; 62p. (In Vietnamese)
- Floyd, D.L.; Prentice-Dunn, S.; Rogers, R.W. A meta-analysis of research on protection motivation theory. Appl. Soc. Psychol. 2000, 30, 407–429. [Google Scholar] [CrossRef]
- Cismaru, M.; Lavack, A.M.; Hadjistavropoulos, H.; Dorsch, K.D. Understanding health behavior: An integrated model for social marketers. Soc. Mark. Q. 2008, 14, 2–32. [Google Scholar] [CrossRef]
- Grothmann, T.; Patt, A. Adaptive capacity and human cognition: The process of individual adaptation to climate change. Glob. Environ. Chang. 2005, 15, 199–213. [Google Scholar] [CrossRef]
- Osberghaus, D.; Finkel, E.; Pohl, M. Individual Adaptation to Climate Change: The Role of Information and Perceived Risk. ZEW—Centre for European Economic Research Discussion Paper, No. 10-061. 2010. Available online: https://ssrn.com/abstract=1674840 (accessed on 22 May 2019).
- Dang, H.L.; Li, E.; Bruwer, J.; Nuberg, I. Farmers’ perception of climate variability and barriers to adaptation: Lessons learned from an exploratory study in Vietnam. Mitigation Adapt. Strategy Glob. Chang. 2014, 19, 531–548. [Google Scholar] [CrossRef]
- Milne, S.; Sheeran, P.; Orbell, S. Prediction and Intervention in Health-Related Behavior: A Meta-Analytic Review of Protection Motivation Theory. Appl. Soc. Psychol. 2000, 30, 106–143. [Google Scholar] [CrossRef]
- Dang, L.H.; Li, E.; Bruwer, J. Understanding climate change adaptive behaviour of farmers: An integrated conceptual framework. Clim. Chang. Impacts Responses 2012, 3, 255–272. [Google Scholar] [CrossRef]
- Bowen, N.K.; Guo, S. Structural Equation Modeling. Pocket Guides to Social Work Research Methods; Oxford University Press: Oxford, UK, 2012; 217p. [Google Scholar]
- Westland, J.C. Structural Equation Models: From Paths to Networks; Springer International Publishing Switzerland: Cham, Switzerland, 2015; 175p. [Google Scholar]
- Kline, R.B. Principles and Practice of Structural Equation Modeling, 4th ed.; Guilford Publications: New York, NY, USA, 2015; 534p. [Google Scholar]
- Below, T.B.; Mutabazi, K.D.; Kirschke, D.; Franke, C.; Sieber, S.; Siebert, R.; Tscherning, K. Can farmers’ adaptation to climate change be explained by socio-economic household level variables? Glob. Environ. Chang. 2012, 22, 223–235. [Google Scholar] [CrossRef]
- Efron, B.; Tibshirani, R.J. An Introduction to the Bootstrap; Monographs on Statistics and Applied Probability 57; Chapman & Hall/CRC: London, UK, 1993. [Google Scholar]
- Comoé, H.; Siegrist, M. Relevant drivers of farmers’ decision behavior regarding their adaptation to climate change: A case study of two regions in Côte d’Ivoire. Mitig. Adapt. Strategy Glob. Chang. 2015, 20, 179–199. [Google Scholar] [CrossRef]
- Greaves, M.; Zibarras, L.D.; Stride, C. Using the theory of planned behavior to explore environmental behavioral intentions in the workplace. Environ. Psychol. 2013, 34, 109–120. [Google Scholar] [CrossRef]
- Hassan, R.; Nhemachena, C. Determinants of African farmers’ strategies for adapting to climate change: Multinomial choice analysis. Afr. J. Agric. Resour. Econ. 2008, 2, 83–104. [Google Scholar]
- Zamasiya, B.; Nyikahadzoi, K.; Mukamuri, B.B. Factors influencing smallholder farmers’ behavioural intention towards adaptation to climate change in transitional climatic zones: A case study of Hwedza District in Zimbabwe. Environ. Manag. 2017, 198, 233–239. [Google Scholar] [CrossRef]
- Trinh, T.Q.; Rañola, R.F.; Camacho, L.D.; Simelton, E. Determinants of farmers’ adaptation to climate change in agricultural production in the central region of Vietnam. Land Use Policy 2018, 70, 224–231. [Google Scholar] [CrossRef]


| Construct | Selected Items | Measurement |
|---|---|---|
| Risk perception (PE) |
| 1–7 Likert scales (Perceived probability) |
| Belief (BN) |
| 1–7 Likert scales (disagree-agree) |
| Habit (PH) |
| 1–7 Likert scales (disagree-agree) |
| Maladaptation (NA) |
| 1–7 Likert scales (disagree-agree) |
| Subjective norm (ST) |
| 1–7 Likert scales (disagree-agree) |
| Adaptation assessment (LA) |
| 1–7 Likert scales (Ineffective-effective) |
| Adaptation intention (AI) |
| 1–7 Likert scales (not at all—very large extent) |
| Construct | Range of Item Total Correlation | Range of Cronbach’s Alpha for Item | Cronbach’s Alpha for Construct |
|---|---|---|---|
| Risk perception (PE) | [0.500, 0.642] | [0.587, 0.704] | 0.708 |
| Belief (BN) | [0.433, 0.571] | [0.622, 0.646] | 0.651 |
| Maladaptation | [0.536, 0.611] | [0.604, 0.663] | 0.738 |
| Habits | [0.339, 0.535] | [0.627, 0.672] | 0.692 |
| Subjective norm (ST) | [0.358, 0.757] | [0.634, 0.753] | 0.791 |
| Adaptation Assessment (LA) | [0.429, 0.585] | [0.638, 0.643] | 0.663 |
| Incentive (EN) | [0.429, 0.742] | [0.686, 0.765] | 0.767 |
| Discouragement (DI) | [0.484, 0.674] | [0.625, 0.746] | 0.978 |
| Adaptation Intention (AI) | [0.388, 0.759] | [0.596, 0.680] | 0.943 |
| Rotated Factor | Variable | Factor Loading Coefficients | Rotated Factor | Variable | Factor Loading Coefficients |
|---|---|---|---|---|---|
| Risk perception (PE) | PE-5 PE-4 | 0.980 0.980 | Adaptation Assessment (LA) | LA-7 | 0.977 |
| LA-5 | 0.974 | ||||
| LA-6 | 0.955 | ||||
| Maladaptation (LA) | NA-2 NA-1 | 0.892 0.886 | Incentive (EN) | EN-1 | 0.991 |
| EN-2 | 0.985 | ||||
| EN-7 | 0.974 | ||||
| Habits (PH) | PH-5 PH-3 | 0.837 0.806 | Discouragement (DI) | DI-3 | 0.979 |
| DI-1 | 0.977 | ||||
| Subjective norm (ST) | ST-3 ST-2 | 0.916 0.844 | Adaptation Intention (AI) | AI-9 | 0.968 |
| AI-1 | 0.941 | ||||
| AI-7 | 0.877 | ||||
| AI-2 | 0.739 |
| Dimensional Impact | Estimation | S.E. | C.R. | p | ||
|---|---|---|---|---|---|---|
| AI | ← | EN | 0.276 | 0.075 | 3.666 | *** |
| AI | ← | LA | 0.183 | 0.057 | 3.210 | 0.001 |
| AI | ← | PE | 0.081 | 0.069 | 1.166 | 0.024 |
| AI | ← | NA | 0.254 | 0.089 | 2.839 | 0.005 |
| AI | ← | ST | 0.511 | 0.079 | 6.439 | *** |
| AI | ← | PH | 0.259 | 0.084 | 3.075 | 0.002 |
| Bootstrap 800 | Bootstrap 1200 | ||||||||||||||
|---|---|---|---|---|---|---|---|---|---|---|---|---|---|---|---|
| Parameter | SE | Mean | Bias | SE-Bias | CR | Parameter | SE | Mean | Bias | SE-Bias | CR | ||||
| AI | ← | EN | 0.032 | 0.087 | 0.000 | 0.001 | 0.000 | AI | ← | EN | 0.032 | 0.086 | 0.000 | 0.001 | 0.000 |
| AI | ← | LA | 0.042 | 0.058 | 0.003 | 0.002 | 1.500 | AI | ← | LA | 0.042 | 0.058 | 0.002 | 0.001 | 2.000 |
| AI | ← | PE | 0.04 | 0.005 | 0.000 | 0.001 | 0.000 | AI | ← | PE | 0.040 | 0.004 | −0.001 | 0.001 | −1.000 |
| AI | ← | NA | 0.024 | 0.020 | 0.003 | 0.002 | 1.500 | AI | ← | NA | 0.025 | 0.020 | 0.003 | 0.002 | 1.500 |
| AI | ← | ST | 0.053 | 0.238 | 0.001 | 0.002 | 0.500 | AI | ← | ST | 0.052 | 0.237 | 0.001 | 0.002 | 0.500 |
| AI | ← | PH | 0.049 | 0.058 | 0.003 | 0.002 | 1.500 | AI | ← | PH | 0.048 | 0.058 | 0.003 | 0.002 | 1.500 |
© 2019 by the authors. Licensee MDPI, Basel, Switzerland. This article is an open access article distributed under the terms and conditions of the Creative Commons Attribution (CC BY) license (http://creativecommons.org/licenses/by/4.0/).
Share and Cite
Luu, T.A.; Nguyen, A.T.; Trinh, Q.A.; Pham, V.T.; Le, B.B.; Nguyen, D.T.; Hoang, Q.N.; Pham, H.T.T.; Nguyen, T.K.; Luu, V.N.; et al. Farmers’ Intention to Climate Change Adaptation in Agriculture in the Red River Delta Biosphere Reserve (Vietnam): A Combination of Structural Equation Modeling (SEM) and Protection Motivation Theory (PMT). Sustainability 2019, 11, 2993. https://doi.org/10.3390/su11102993
Luu TA, Nguyen AT, Trinh QA, Pham VT, Le BB, Nguyen DT, Hoang QN, Pham HTT, Nguyen TK, Luu VN, et al. Farmers’ Intention to Climate Change Adaptation in Agriculture in the Red River Delta Biosphere Reserve (Vietnam): A Combination of Structural Equation Modeling (SEM) and Protection Motivation Theory (PMT). Sustainability. 2019; 11(10):2993. https://doi.org/10.3390/su11102993
Chicago/Turabian StyleLuu, The Anh, An Thinh Nguyen, Quoc Anh Trinh, Van Tuan Pham, Ba Bien Le, Duc Thanh Nguyen, Quoc Nam Hoang, Ha T.T. Pham, The Kien Nguyen, Van Nang Luu, and et al. 2019. "Farmers’ Intention to Climate Change Adaptation in Agriculture in the Red River Delta Biosphere Reserve (Vietnam): A Combination of Structural Equation Modeling (SEM) and Protection Motivation Theory (PMT)" Sustainability 11, no. 10: 2993. https://doi.org/10.3390/su11102993
APA StyleLuu, T. A., Nguyen, A. T., Trinh, Q. A., Pham, V. T., Le, B. B., Nguyen, D. T., Hoang, Q. N., Pham, H. T. T., Nguyen, T. K., Luu, V. N., & Hens, L. (2019). Farmers’ Intention to Climate Change Adaptation in Agriculture in the Red River Delta Biosphere Reserve (Vietnam): A Combination of Structural Equation Modeling (SEM) and Protection Motivation Theory (PMT). Sustainability, 11(10), 2993. https://doi.org/10.3390/su11102993