Article

Assessing the Health Vulnerability Caused by Climate and Air Pollution in Korea Using the Fuzzy TOPSIS

1
Korea Environment Institute; 370 Sicheong-daero, Sejong 30147, Korea
2
Department of Urban Planning and Engineering, Pusan National University; 2 Busandaehak-ro 63beongil, Busan 46241, Korea
3
Institute of Environmental Medicine, Seoul National University Medical Research Center; 103 Daehak-ro, Jongno-gu, Seoul 03080, Korea
*
Author to whom correspondence should be addressed.
Sustainability 2019, 11(10), 2894; https://doi.org/10.3390/su11102894
Submission received: 12 February 2019 / Revised: 10 May 2019 / Accepted: 17 May 2019 / Published: 21 May 2019
(This article belongs to the Section Sustainable Urban and Rural Development)

Abstract

:
The effects of climate change and air pollution on health have become major topics of discussion and conducting an assessment on the vulnerabilities of climate change is essential to providing a solution for it. This study assesses human vulnerability to the health effects of climate change and ozone. We classified 27 detailed vulnerability indicators into eight categories and assessed the vulnerability of 249 jurisdictions in South Korea by applying the Fuzzy Technique for Order Preference by Similarity to Ideal Situation method. The results indicated that metropolitan and major urban areas were more vulnerable than other areas. Furthermore, factors such as air pollution, meteorological conditions, a vulnerable environment, the distribution of disease, health/medical capacities, and air pollution control had a significant impact on vulnerability. A validity analysis was on the vulnerability assessment results and the number of new patients diagnosed with diseases associated with the cardiovascular system; the results indicated a 66.9% correlation, signifying a considerably high validity. The proposed method for assessing vulnerabilities in terms of the health effects of air pollution is objective and based on data; thus, it is expected to present a high degree of applicability. The results can also be a critical foundation upon which to establish health policies.

1. Introduction

Climate change is progressing rapidly on a global scale because of increases in greenhouse gas emissions caused by human activities. According to the fifth assessment report from the Intergovernmental Panel on Climate Change (IPCC), the standard greenhouse gas emissions scenario, i.e., the Representative Concentration Pathway (RCP), indicates that the average global temperature will rise 4.8 ℃ before the end of the 21st century [1]. For South Korea in particular, the scenario forecasts a rise of 5.6 ℃ for the corresponding period. It also predicts that negative effects of climate change, including rising sea levels, increased droughts and floods, decreased crop yields, and increased heat waves are expected to occur [1].
The changes in temperature and humidity caused by climate change will have a particularly significant impact on the formation of air pollutants. Increased urban temperatures cause changes in the atmospheric circulation system, change the chemical components of the near surface atmosphere, and affects the influx of sunlight; the latter causes the formation of photochemical smog and distributes air pollutants as a result of the reduced air circulation [2,3,4]. In other words, changes to regional meteorological conditions caused by climate change affect the occurrence, transport, dispersion, and deposition of air pollutants [2,3,4]. Such increases in the concentration of air pollutants can increase the mortality rate, affect the occurrence of respiratory and cardiovascular diseases, and exacerbate existing conditions such as lung diseases [5,6,7,8].
Recently, the severity of such climate change and air pollution issues has been recognized and interest has been focused on assessing vulnerability as a prerequisite for providing countermeasures to these issues [9]. To prepare countermeasures to climate change, a regional vulnerability assessment is required to establish a list of priorities for minimizing the adverse effects of climate change [10]. In other words, since the effects and dangers of climate change vary by geographic location, it is therefore important to assess the vulnerabilities to climate change on a regional basis and strengthen the appropriate adaptive capacity for the given region.
Vulnerability assessments for climate change are generally divided into the top-down approach, which is a quantitative method based on global-scale data, and the bottom-up approach, which based on regional-scale assessments using tools such as indicators to consider possible policy applications [11]. The bottom-up approach has been used more frequently to assess vulnerability to climate change on a local or national scale as it can reflect regional characteristics and utilize an indicator method with potential for application in policy. However, although the usefulness of the indicator method has been acknowledged, there has also been criticism towards the approach, particularly in Europe [12,13] regarding the lack of a mathematical basis to integrate the indicators; critics argue for the introduction of a new method that considers the uncertainties of climate change. This study thus attempts to resolve the uncertainty and ambiguity of the indicator method by adopting the Fuzzy Technique for Order of Preference by Similarity to Ideal Solution (TOPSIS) method to assess human health vulnerabilities from air pollution, particularly increased ozone concentrations, as climate change intensifies.
This study has two main aims. The first is to conduct a vulnerability assessment of the health effects caused by climate change, particularly increased ozone concentrations, by applying the Fuzzy TOPSIS method to data from 249 jurisdictions in South Korea. The second aim is to verify the validity of results from this vulnerability assessment with a correlation analysis of the results of the vulnerability assessment and the occurrence rate of new patients diagnosed with cardiovascular-related diseases.

2. Materials and Methods

2.1. Study Area

This study was conducted in South Korea in 2010 and categorized the administrative districts in the country into 249 local jurisdictions, i.e., Si-Gun-Gu, which corresponds to city-county-district, respectively, located within 16 provincial areas, i.e., Si-Do, which correspond to provinces-metropolitan/special cities, respectively (Figure 1). South Korea has a land area of 101,144 km2, and the seven major cities account for 4471 km2, i.e., 4.42% of the total. As of 2010, the total population of South Korea was 47,990,761, with 46.1%, i.e., 22,116,465, of the total population residing in seven major cities. Major industrial, cultural, and educational facilities are concentrated within these cities, causing an increase in population density and giving rise to various environmental problems.

2.2. Research Method

Vulnerability to climate change is the degree to which various systems are susceptible to, and unable to cope with, the adverse impacts of climate change. Vulnerability is a function of the degree that a system is exposed to climate change, the sensitivity of the system, and its adaptive capacity [14].
The Fourth Assessment Report of the IPCC, published in 2007, indicated that climate change poses a direct or mediating/regulating effect on health through factors such as environmental and social conditions and health systems. The indicators used in this study were determined by categorizing the variables into climatic exposure, sensitivity, and adaptive capacity based on IPCC concepts [14].
Exposure is the leading category that represents the impact of climate change and air pollution and for which meteorological and air pollution factors were considered the indicators. Sensitivity indicates the degree of the impact caused by climatic exposure, and includes vulnerable groups, environments, and the distribution of diseases as sub-sectors. Adaptive capacity is a social and economic category and was defined as the factor that can reduce the impact of climate change; socio-economic, health/medical capacities, and air pollution control factors were sub-sectors. The data for the detailed variables of the eight specific sectors were for 2010.
This study used the Fuzzy TOPSIS model to assess health vulnerabilities caused by climate change and increased ozone pollution. This is a multiple-criteria decision-making method that selects an alternative that is the shortest distance from the positive ideal solution and the longest distance from the negative ideal solution. In our model, we derived a relatively objective weight and value for each indicator based on the Fuzzy TOPSIS concept, although the basic weights were obtained from a survey of 20 public health experts. This was an attempt to resolve the uncertainty and ambiguity of the indicator method and subjectivity of expert opinion.
The process of assessing vulnerabilities by applying the Fuzzy TOPSIS model consists of six steps. Step 1 was to determine the method for calculating the weights to select indicators and weights. In Step 2, data standardization is conducted because each variable would have had different units of measurement, and in Step 3, the input data and weights are converted into triangular fuzzy numbers (TFNs). In Step 4, the TFNs of the different matrices are normalized; in Step 5, their vulnerabilities are calculated using Fuzzy TOPSIS. Finally, in Step 6, the preference order of the vulnerability assessment results is ranked. The details of each step are as follows.
Step 1 is selecting the indicators and weights. The indicators for assessing health vulnerabilities caused by climate change and increased ozone concentrations were selected by researching previous studies from South Korea and worldwide and by surveying subject matter experts to reflect the situation in South Korea. The latter, which was conducted with experts on climate change, air pollution, and health effects in South Korea, took the form of a Delphi survey to ensure a logical selection of vulnerability indicators under the assumption that the expert predictions regarding issues in such specialized areas would be more accurate than those of non-experts, the Delphi survey is a useful decision-making tool to achieve a consensus among experts. In this study, the survey was given to 20 subject matter experts and the indicators were determined.
The budget allocation process (BAP) was used to select the weights of the climatic exposure, sensitivity, and adaptive capacity factors and the weights of the sub-indicators. BAP is a method for determining a weighted value by conducting a survey with experts on each priority indicator. In other words, the indicators were divided into factors and detailed indicators, and a survey was conducted to ensure that the sum of each factor was 100. For the weight calculation, the results of the survey conducted with the 20 experts were summed and averaged to calculate the weight for each indicator.
Step 2, the process of data standardization, prevents extreme values from distorting entire variables and partially helps with overcome quality issues in the collected data [15]. Standardization methods include re-scaling, ranking, and Z-scores [16]; this study used a re-scaling method to standardize the entire range of data to fit a value between 0–1, as shown in Equation (1):
I q c = x q c m i n c ~ x q m a x c ~ x q m i n c ~ x q
where x q c is the value of the indicator q of area c , m i n c ~ x q signifies the minimum value among the values in the entire area C ˜ of indicator q , and m a x c ~ x q signifies the maximum value of those in the entire area C ˜ of indicator q . This re-scaling stabilizes individual differences in indicator values within the range of the corresponding indicator and thus prevents the distortion that occurs when the difference in the value is not large [15].
Step 3 is applying a triangular fuzzy function. There are various different fuzzy numbers, but a TFN is expressed in three points and is thus useful for presenting and processing data in the fuzzy environment. It is also easier to analyze [17,18,19].
The membership function A is μ A : x 0 , 1 , and when a X b and b X c it can be expressed as a < b < c , as in (a,b,c). Parameter b represents the modes, the value of membership function μ A x , and a and c signify the lower and upper limits of the measurable area, respectively (Figure 2) [20].
A = x a b a   a x b ,     c x c b   b x c
Step 4 is the normalization of the TFN. To apply a TFN to TOPSIS, the values of each variable must be normalized in relation to each other [21]. The normalized fuzzy matrix R ˜ signifies the normalized TFN r ˜ i indicates each Si-Gun-Gu area, and j indicates the number of each variable. B   and C   are the sets of the benefit and the cost criterion, respectively.
R ˜ = [ r i j ˜ ] m × n ,   i   = 1 ,   2 ,   , m j   = 1 ,   2 ,   ,   n
C j * = max i   C i j ,     i f   j B
r i j ˜ = a i j c j * ,   b i j c j * ,   c i j c j * ,   i f   j B
a j * = min i   a i j ,     i f   j C
r i j ˜ = a j * c i j ,   a j * b i j ,   a j * a i j ,   i f   j C
The normalized fuzzy decision matrix V ˜ , in which each criterion is given different weights, can be expressed as shown in Equation (8):
V ˜ = [ v i j ˜ ] m × n i   = 1 ,   2 ,   ,   m j   = 1 ,   2 ,   ,   n
Step 5 is the Fuzzy TOPSIS process. The TFN normalized according to the weighted normalized fuzzy decision matrix V ˜ i.e., the Fuzzy Positive Ideal Solution (FPIS) and the Fuzzy Negative Ideal Solution (FNIS), are defined as given in Equation (9) [21]:
A + = v 1 + ˜ , v 2 + ˜ , , v n + ˜ A = v 1 ˜ , v 2 ˜ , , v n ˜
The distance between each Si-Gun-Gu i and A + (FPIS) and A (FNIS) can be calculated using Equation (10). The distances d i + and d i of each Si-Gun-Gu i can be derived using Equations (11) and (12). d i + indicates the distance of each alternative (target area) A i from A + (FPIS) and d i indicates the distance of each alternative A i from A (FNIS).
d m ˜ , n ˜ = 1 3 [ ( m 1 n 1 ) 2 + ( m 2 n 2 ) 2 + m 3 n 3 ) 2
d i + = j = 1 n d r i j ˜ , v j + ˜
d i = j = 1 n d r i j ˜ , v j ˜
This process is the defuzzification method in Fuzzy TOPSIS and produces a quantifiable result in crisp logic, given fuzzy sets, and corresponding membership degrees.
Finally, Step 6 determines the rank preference order. The relative proximity coefficients of each alternative C + can be derived using Equation (13). Here, the first order signifies the most vulnerable areas and a greater C + value signifies the least vulnerable areas.
C i + = d i d i + + d i
Therefore, the preference order for all regions can be ranked using proximity coefficients, and the most vulnerable or non-vulnerable areas can be selected.

3. Results

3.1. Selecting Indicators for the Vulnerability Assessment of the Health Effects of Climate Change and Air Pollution

As noted in Section 2, the initial indicators for assessing the vulnerabilities to human health caused by climate change and increased ozone concentrations were chosen based on a conceptual model in this study and surveying experts; the final indicators were then selected through an analysis of the availability and quality of the data and by their validity.
The 8 sectors and 27 detailed indicators used in the model for assessing the health vulnerabilities caused by climate change and increased ozone are as shown in Table 1.
There are two factors in the exposure category: meteorology and air pollution. The former indicates the annual average daily maximum temperature and rainfall level and were calculated using automatic weather station data from the Korea Meteorological Administration (KMA). The air pollution factor was set using detailed ozone concentration indicators, which are the focus of this study; the data was from the National Institute of Environmental Research (NIER).
The sensitivity category includes three factors: a vulnerable group, vulnerable environment, and disease distribution. The vulnerable group was determined using variables such as the percentages of the population aged 65 or older and 13 or younger, elderly people living alone, disabled individuals, and basic livelihood security recipients. The last group consists of low-income earners who receive support from the South Korean national basic livelihood security system because it is difficult for their families to support them. The system helps these individuals maintain a basic standard of living. All these values were calculated using data from the Statistics Korea.
The vulnerable environment factor includes the percentage of road area, number of facilities emitting pollutants to the air, and the number of registered vehicles. The road area was processed by calculating the percentage of area categorized as “road,” of the total land available for use. The number of facilities emitting pollutants to the air was provided by the Ministry of the Environment and the number of registered vehicles was extracted from data provided by the Statistics Korea.
Disease distribution was derived by calculating the number of patients hospitalized with respiratory-related diseases and the number of deaths related to cardiovascular disease. South Korea provides a national health insurance system in which 98% of the total current population is registered, and the National Health Insurance Corporation (NHIC) holds all data related to the use of national medical facilities. Furthermore, South Korean citizens are obligated by law to report all deaths and the Korea National Statistical Office collects data on the deceased.
Lastly, the adaptive capacity category also includes three factors: socio-economic capacity, health/medical capacity, and air pollution control. Gross regional domestic product, financial independence rate, unemployment rate, and the level of education were used to determine the socio-economic factors, and of these, the level of education was derived by calculating the percentage of the population whose final level had been specialized college or higher. The per capita health care spending for residents, per capita number of doctors, per capita number of emergency medical service facilities, and per capita public health center staff were the indicators used for the health/medical capacity factor. Finally, per capita environmental budget for residents, the measured air quality notification system, per capita government officials working on environmental regulations, and the percentage of green areas were the air indicators used to determine the pollution control factor. Of these, the outdoor air pollution billboard installed at the Si-Gun-Gu levels were used to process the variables for the air pollution notification system and data on the number of government officials in the environmental sector were provided by Ministry of the Interior.

3.2. Basic Statistics and Weights in Assessing the Health Vulnerabilities Caused by Climate Change and Ozone

The basic statistics on the detailed indicators of the eight factors used in the Fuzzy TOPSIS model applied in this study is as shown in Table 2.
Among the meteorological factors, the annual average daily maximum temperature was 34.29 ℃. Among the air pollution factors, the annual average ozone concentrations during summer were 22.47 ppb. The ozone concentration exceeded 60 ppb for 8 h on 29.44 days, on average, and on 3.66 days it exceeded 100 ppb for 1 h. Furthermore in areas that which on which the ozone concentration exceeded 60 ppb for 8 h, on average, the former lasted for a minimum of 2 days and the latter lasted a maximum of 113 days, thereby indicating a significantly large difference in the ozone concentration according to the area.
For the vulnerable group indicators, the average percentages for the population aged 65 or over, 13 or younger, elderly people living alone, and basic livelihood security recipients were 16.78%, 13.41%, 3.57%, and 3.82%, respectively. South Korea has a rapidly aging population, and the percentage of the total population aged 65 or older in the Si-Gun-Gu divisions varied from 4.33–39.43%, with the non-urban areas showing a higher percentage of elderly residents compared to urban areas.
In terms of the vulnerable environment factors, there were certain areas of industrial complexes in which there were as many as 1,750 pollution-emitting facilities although there were only 169.19 such industrial complexes on average; this indicates a significant difference in environmental vulnerability factors by area.
In terms of the distribution of diseases, the number of patients hospitalized with respiratory-related diseases and deaths from cardiovascular disease per 100,000 individuals were 102,702 and 225, respectively.
Among the socio-economic capacity factors, the average unemployment rate was 4.66%. For the health/medical capacity factors, there were 2.25 doctors per capita and 1.65 emergency medical service facilities per capita by Si-Gun-Gu divisions. The per capita environmental budget for residents, which is a detailed indicator in the air pollution control sector, was KRW 523,818.49 on average and an average of 43.45% of Si-Gun-Gu areas in South Korea were categorized as green areas.
To determine the weights of these indicators, a Delphi survey was conducted with experts using the BAP method. The results of the survey indicated that the weights by factors should be as follows: 0.16 for meteorological factor, 0.19 for the air pollution factor, 0.13 for vulnerable groups, 0.12 for vulnerable environments, 0.12 for disease distribution, 0.10 for socio-economic capacity, 0.07 for health/medical capacity, and 0.11 for air pollution control. More detailed results are as shown in Table 2.

3.3. Assessing the Heath Vulnerability Caused by Climate Change and Air Pollution Using the Fuzzy TOPSIS

This study used the re-scaling method to standardize the data to values between 0–1 to conduct the Fuzzy TOPSIS analysis. The TFN was calculated for each indicator using the standardized data and a fuzzy triangular matrix was derived for the 27 detailed indicators of the eight factors.
The weight of the detailed indicators derived through the BAP was multiplied by the fuzzy triangular matrix. Each detailed indicator was then summed again by the value of the eight factors, and the TFN was normalized using the weighted spread benefit criteria (in which higher measured values are preferred) and cost criteria (in which lower measured values are preferred). The meteorological and air pollution factors and vulnerable group and disease distribution data were normalized using the former, whereas the socio-economic capacity, health/medical capacity, and air pollution control factors were normalized using the latter. The data normalized by each factor was then multiplied by the weighted value of the eight factors to derive the weighted fuzzy matrix.
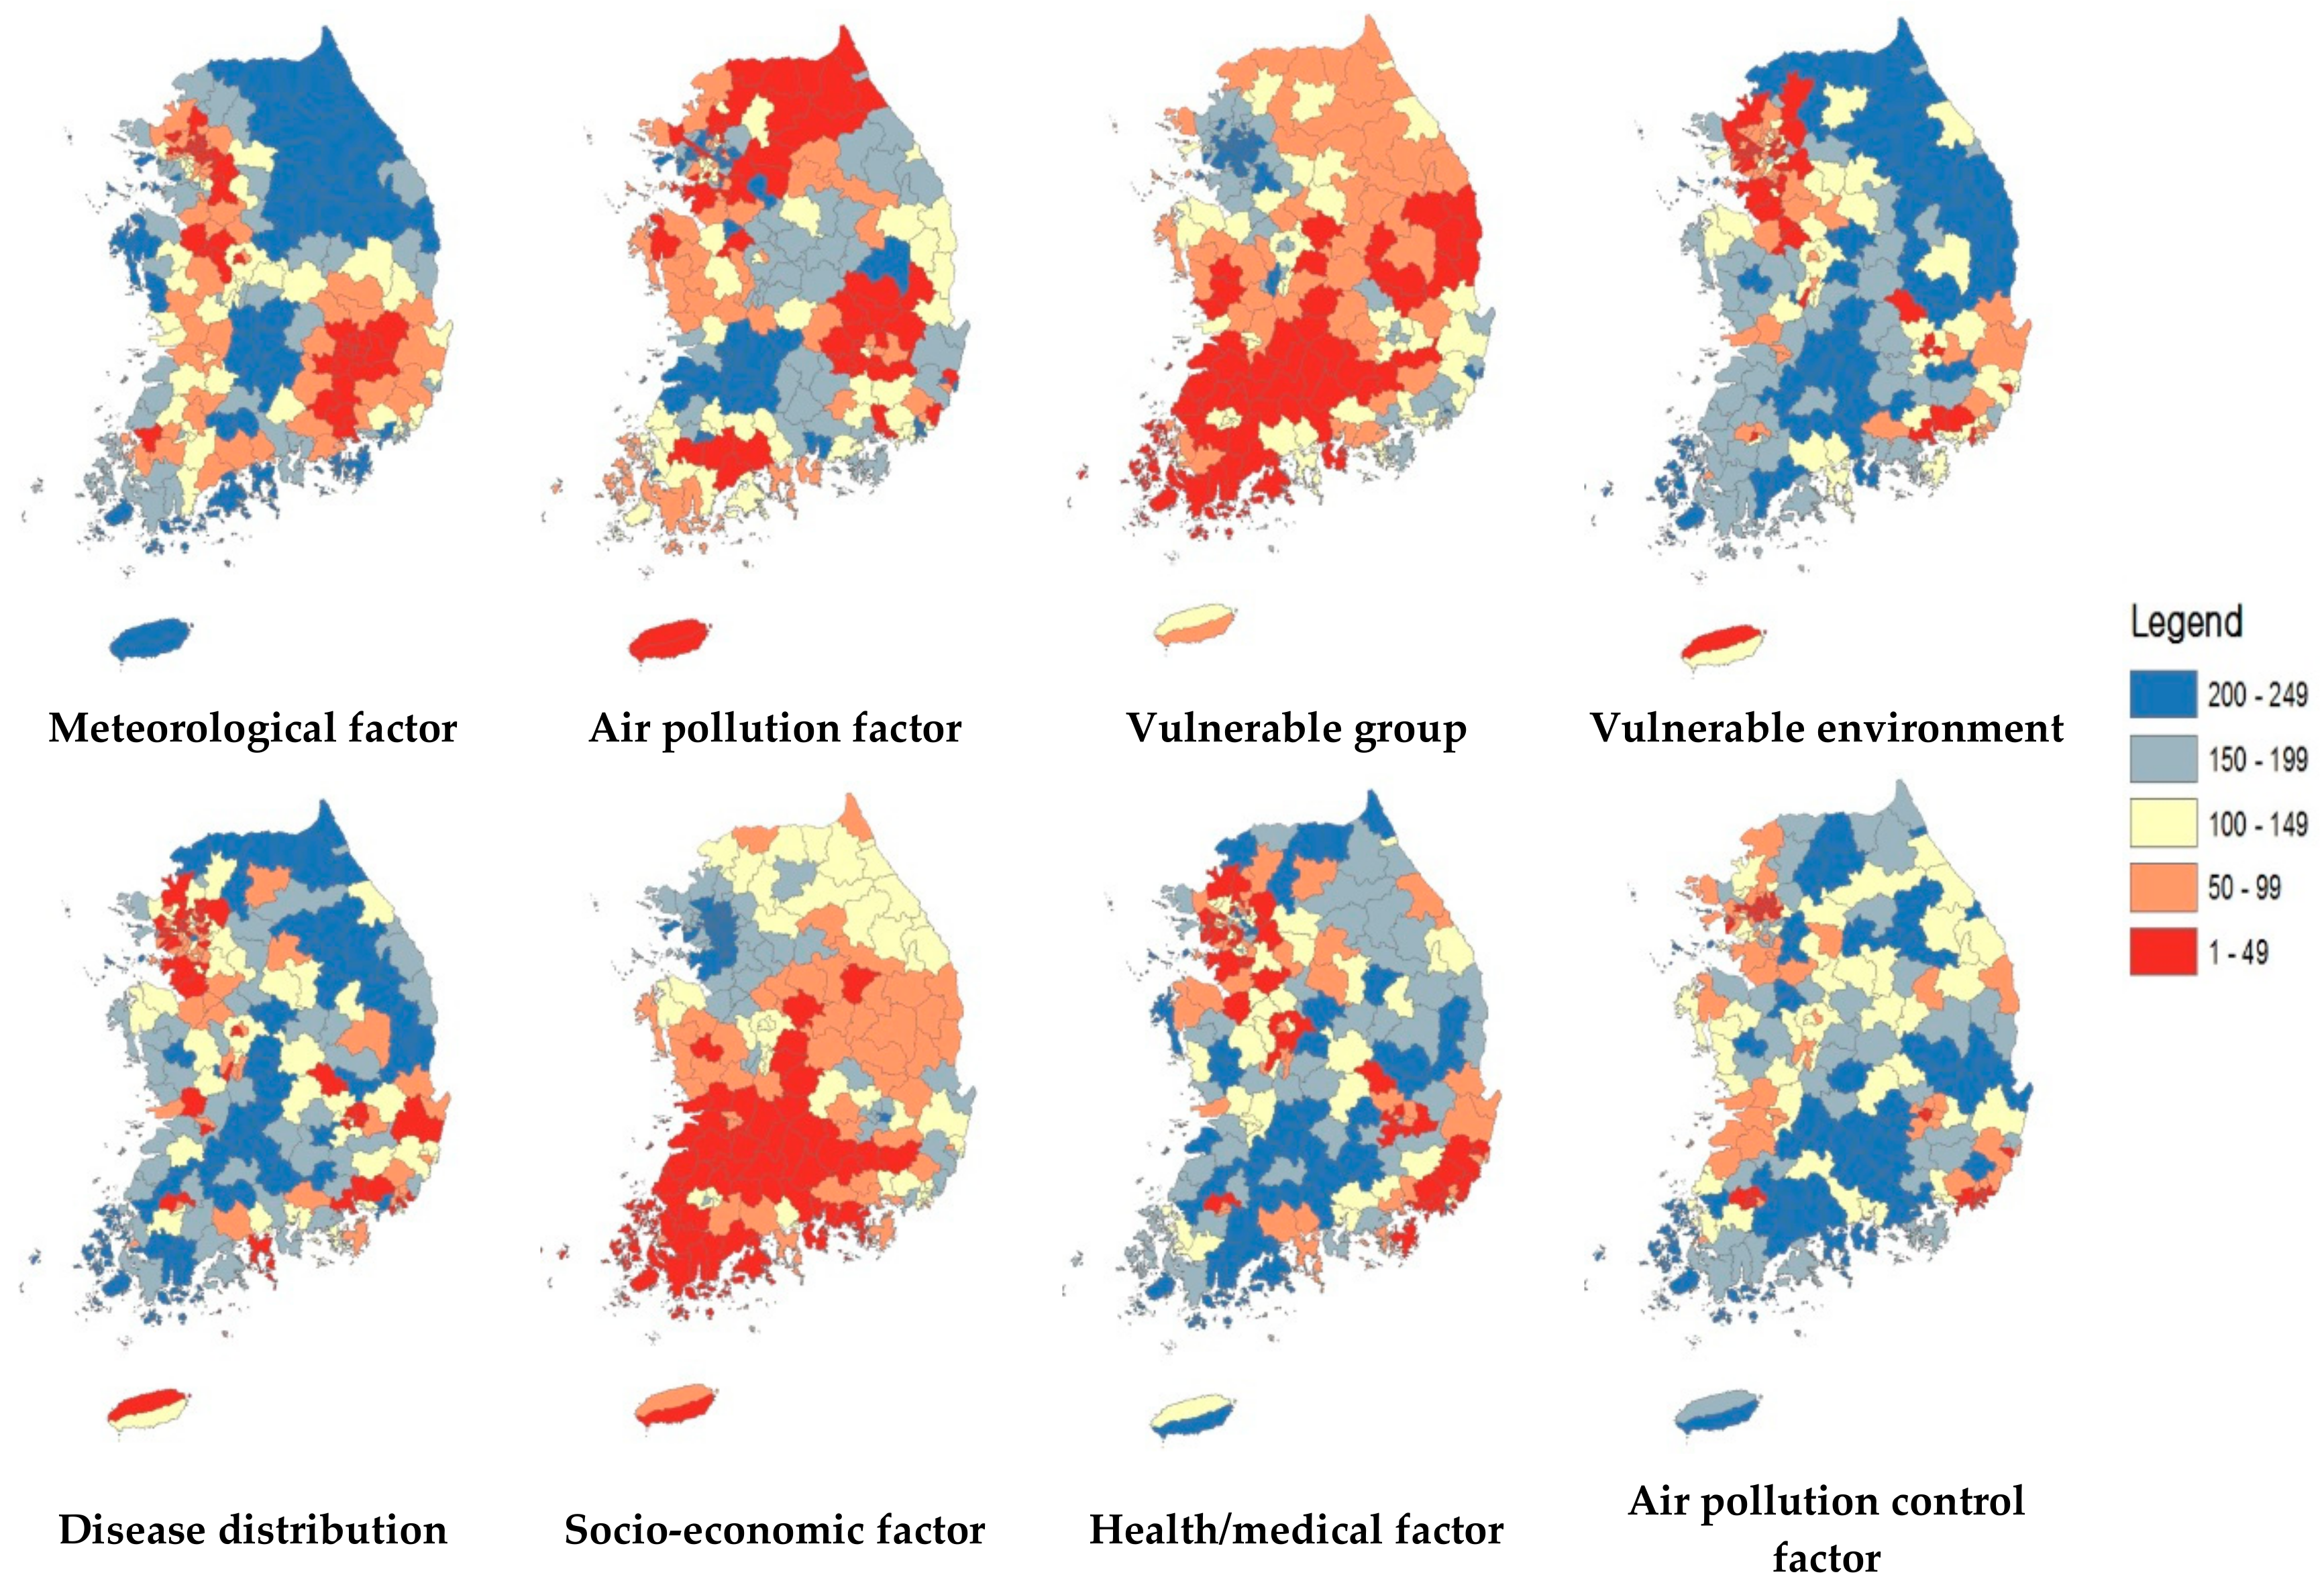
The positive and negative ideal solutions for each sector were derived for the 249 Si-Gun-Gu area, along with the corresponding relative similarity, to calculate the results of the assessing the impact of high ozone concentration on human health vulnerability in these regions. The results of these calculations and the distribution of each factor were mapped in ArcGIS 9.3 and shown in Figure 3.
As shown in Figure 3, the meteorological factor shows that the Seoul Metropolitan area and the southeastern region (i.e., Gyeongsang Province) were more vulnerable than other areas. Furthermore, with regard to the air pollution factor, there was a high degree of vulnerability in the northern and southeastern regions (i.e., Gyeonggi Province, Gangwon Province, the inland areas of North Gyeongsang Province, and the inland areas of South Jeolla Province). The southwestern regions (i.e., Jeolla Province) were shown to be vulnerable in terms of vulnerable groups and socio-economic capacity. The seven major cities, i.e., the Capital Metropolitan Area including Seoul, Daejeon, Daegu, Gwangju, Busan, and Usan, showed a high degree of vulnerability in terms of the vulnerable environment sector.
Furthermore, the seven major cities, i.e., Seoul, along with Daejeon, Daegu, Gwangju, Busan, and Ulsan, also showed a high degree of vulnerability in terms of disease distribution and the vulnerable environment factor. The health/medical capacity and air pollution control factors also showed a high degree of vulnerability centering on the seven major cities; it is thought that population size has a significant effect on this result.
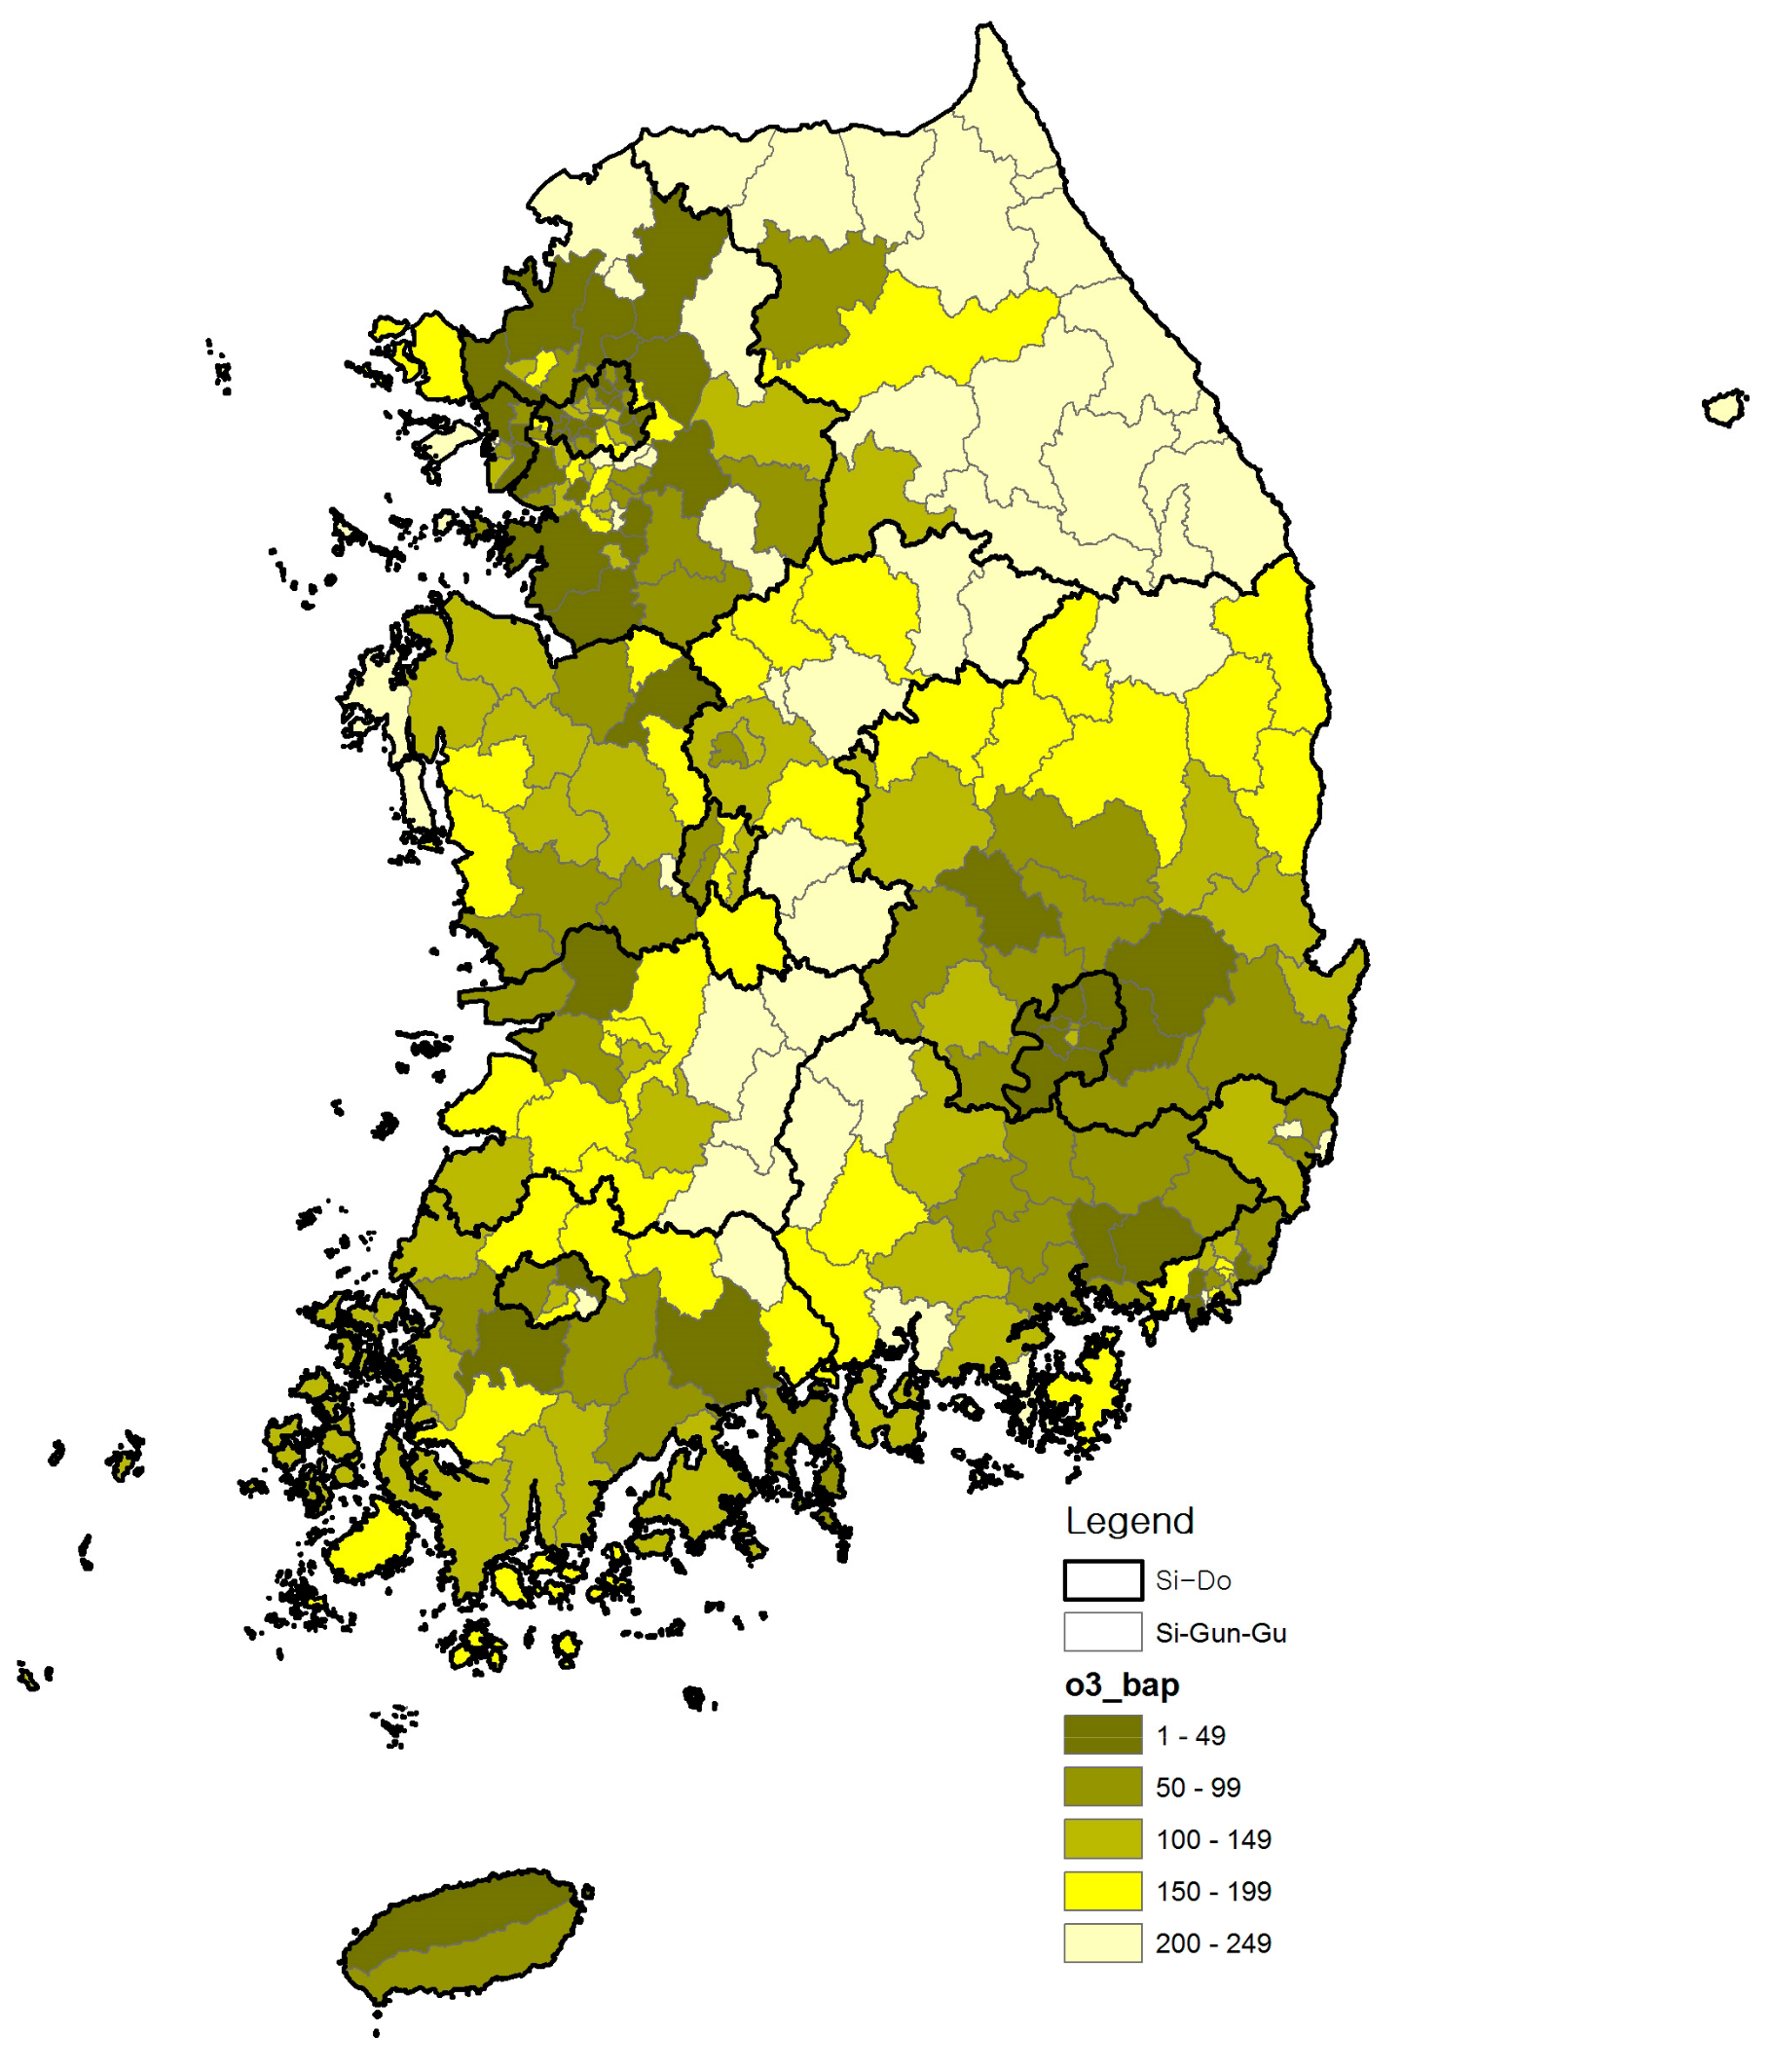
Our results also indicate that a higher degree of vulnerability is shown when the exposure and sensitivity increase, whereas a decrease in adaptive capacity results in a higher degree of vulnerability. Figure 4 presents the results of the overall vulnerability calculated in this study. The health of those in the Seoul Metropolitan Area and the southeastern region are more vulnerable than that of residents of other areas. Hwaseong-si, Gangseo-gu, and Songpa-gu in the Seoul Metropolitan area, and Gimhae-si in Gyeongsan Province, in particular, were shown to be the most vulnerable local jurisdictions.
The assessment methodology employed in this study makes it possible and easy to compare zones by indicators. Figure 5 compares the differences between Area A (Hwaseong-si), i.e., the area with the highest degree of vulnerability, and Area B (Sokcho-si), i.e., the area with the lowest degree of vulnerability, using detailed indicators to identify features. The result indicates that Area A showed higher values for all indicators, excluding vulnerable groups and that the difference was significant. Examining the vulnerable environment factor in particular, as it was indicated as the most vulnerable factor, shows that the number of registered vehicles and facilities emitting pollution to the air are significantly higher in Area A than in Area B.

3.4. Verifying the Validity of the Results

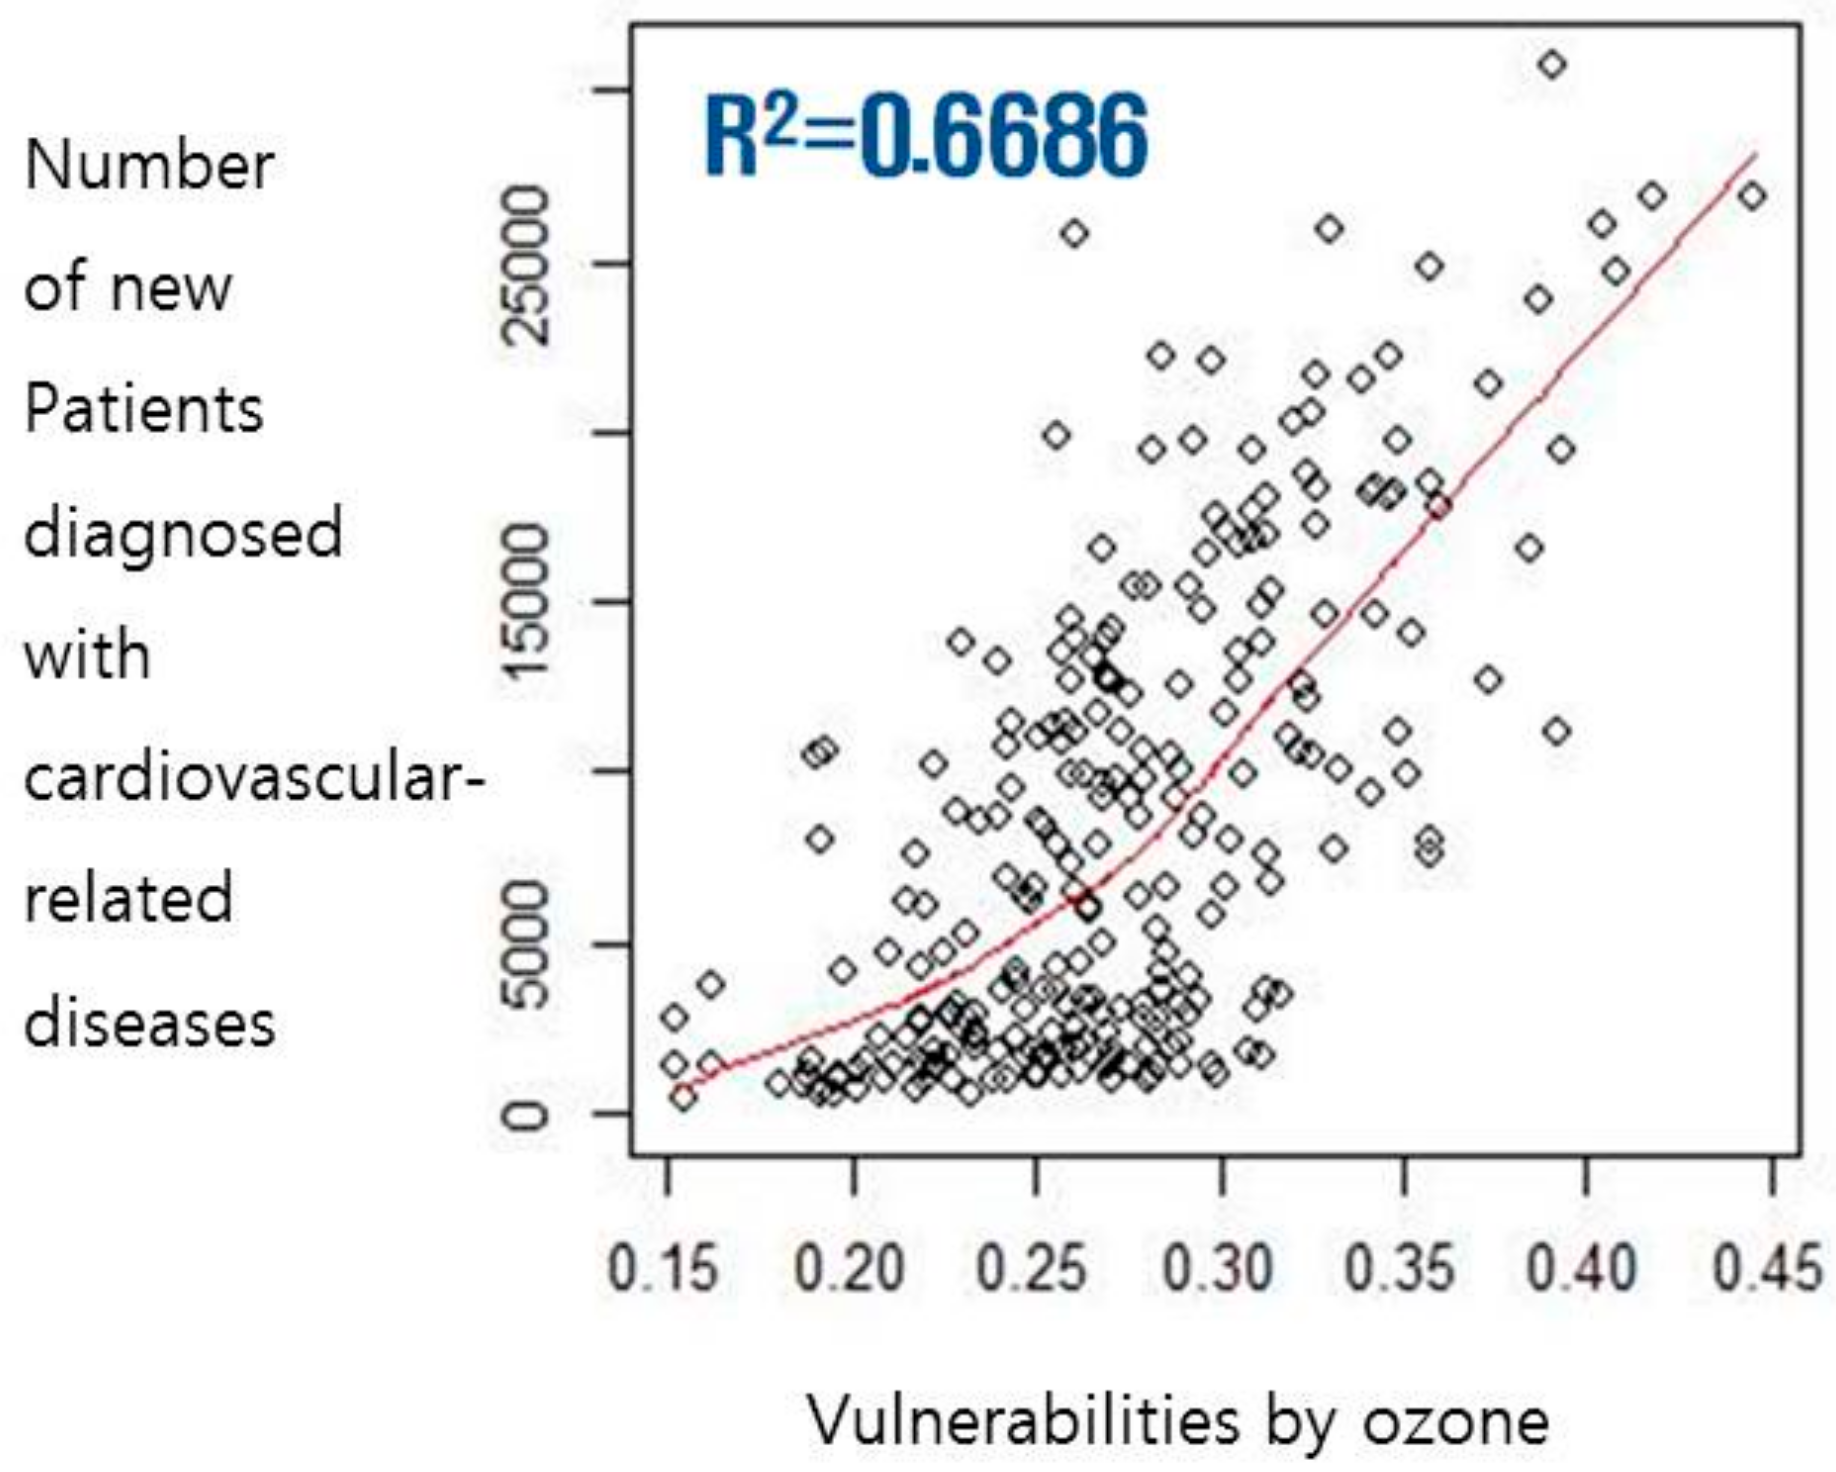
While research on assessing the existing vulnerabilities caused by climate change is in progress, there is a lack of studies that verify the validity of their results. In this study, a correlation analysis was conducted on the results of the vulnerability assessment and the number of new patients diagnosed with cardiovascular-related diseases to ensure the validity of the former with regard to vulnerabilities to human health as caused by climate change and increased ozone concentrations.
Figure 6 shows the results of the correlation analysis, which show indicated a correlation coefficient of 0.6686. This signifies a high correlation between the two values.

4. Discussion

There has recently been an emphasis on the need to research the health effects of climate change so that this data could be utilized to establish health policies [20,30]. The significance of this study comes from its focus on the health effects of air pollution in the midst of intensifying climate change.
This study also improved the methodology for calculating health vulnerabilities using the Fuzzy TOPSIS model. The vulnerability assessment methods used to standardize and integrate indicators are critical. Previous studies used mainly the Z-score and max-min values to standardize data sets and methods such as calculating indicator weights simply by summing them or using an analytical hierarchy process to integrate them [31]. However, the climate change-related causal relationships between the natural and social systems and those between each component are highly complex, and ensuring that data reflects the characteristics of each system well is a difficult process. Therefore, there are many uncertainties inherent in selecting indicators to assess vulnerabilities to climate change [32,33,34]. Furthermore, the weights of the indicators can differ based on the expert using the indicators. Therefore, a scientific approach is needed to determine weights [35]. There has recently been criticism, in Europe, of the lack of a mathematical basis for integrating the indicators although the usefulness of the indicator method has been acknowledged; therefore, the use of the fuzzy model has been proposed as an improvement for the process [12,13]. For example, Lissner et al. [12] used the fuzzy model to conduct a vulnerability assessment of the heat island effect in German municipalities and in South Korea, while Kang et al. [36] used the model to analyze the flood vulnerability of urban areas.
However, the simple fuzzy model still lacks a scientific basis for determining weights. To address this disadvantage, the Fuzzy TOPSIS model was proposed as a multiple-criteria decision-making (MCDM) method and the fuzzy method was proposed as a new way of assessing vulnerability [37]. As mentioned in Section 2, Fuzzy TOPSIS is an MCDM method that selects the alternative with the shortest distance from the positive ideal solution and the longest distance from the negative ideal solution.
Previous studies using this model included an evaluation of a transportation system [38] and vulnerability assessments of social infrastructure [39], of waste treatment facilities [40], for earthquakes [41], and for floods [20,21], thereby proving the validity of the method as a research tool. This study is the first to apply the method to assess the human health vulnerabilities of climate change and air pollution. The method determined the weights of vulnerability indicators by combining data sets from the TOPSIS concept based on fuzzy data. The use of the Fuzzy TOPSIS method addresses the limits such as uncertainty and incomplete data and expert evaluation that exist in current vulnerability assessment methods and has thereby made progress in improving the performance of the method.
In many previous vulnerability assessment results, only the vulnerability indicators were shown in a diagram of results; their level of representativeness or validity was not presented. To address this issue, this study compared the relationship between the assessment results and the number of new patients diagnosed with cardiovascular-related diseases, which are known to be a result of adverse health effects caused by increased ozone concentrations. The analysis had a correlation of over 66.9%, thus indicating the validity of the assessment result and the method used to obtain it. Even though correlation analysis was not a perfect validity or sensitivity test, it demonstrated that the proposed methodology is relatively well suited as a vulnerability assessment tool to use as a basis for policy development and making priority decisions on resource distribution.
However, further research is needed to include a more diverse range of relevant diseases related to health vulnerability for the validity test and employ advanced statistical or quantitative methods to test the validity of vulnerability assessments.
To strengthen climate change countermeasures, South Korea enacted “the Basic Act on Low Carbon Green Growth,” and subsequently constructs a national climate change adaptation strategy every five years. A detailed plan for implementing climate change adaptation measures at the central, state, and local government levels is then established. In other words, the local government is the basic unit at which environmental and climate change adaptation policies are established; furthermore, the importance of local governments as entities that implement policies is also emphasized.

5. Conclusions

The increase in ozone concentrations caused by climate change, and its subsequent adverse health effects, has emerged as a problem that requires a response at both the national and local scales. To assess the vulnerability of human health to the increased ozone concentration, 27 detailed vulnerability indicators in eight factors were selected for this study, after which the human health vulnerability in 249 local jurisdictions in South Korea was evaluated using the Fuzzy TOPSIS method.
This study found that the effect of climate change and increased ozone concentrations on health vulnerabilities differed by local area, and the degree of influence caused by particular indicators varied as well. The metropolitan areas, including Seoul and major urban areas such as Daejeon, Daegu, Gwangju, Busan, and Ulsan were more vulnerable than other areas. The results also indicated that factors such as air pollution, meteorological factors, vulnerable environments, the distribution of disease, health/medical capacity factors, and air pollution control had a significant impact on vulnerability.
Therefore, the result of vulnerability assessments using Fuzzy TOPSIS can be used to compare vulnerability assessments from different regions and each detailed indicator and also to identify the factors that affect regional vulnerabilities. The latter can then be used as a foundation for providing climate change adaptation measures that address needs particular to vulnerable areas. This process, and the evidence-based public health policy establishment process emphasized by Hess et al. [30] should be a focus by local governments.
A validity analysis conducted between the results of the vulnerability assessment and the number of new patients diagnosed with cardiovascular-related diseases indicated a correlation of 66.9%, signifying a considerably high rate of validity for the results.
This study is significant because it is the first to apply the Fuzzy TOPSIS model to assess vulnerabilities using subjective and ambiguous environmental health sector data. It also employed a validity test that showed a considerably good validity rate for the results. Overall, the proposed method for assessing vulnerabilities with regard to the health effects of air pollution is an objective assessment based on data; thus, it is expected to have a high degree of practical applicability.
Although this study provides a greater understanding of health vulnerabilities, it does have some limitations. Firstly, we tried to overcome the limitations in assigning weights to vulnerability assessment indicators; most previous studies gave each indicator equal or subjective weights, with the latter derived from expert opinion. In this study, we made the experts’ opinions more objective using the Fuzzy TOPSIS concept. Nonetheless, expert opinions can misunderstand the truth and the process could ignore extreme values or minority opinions. Thus, further research is needed to determine other extended quantitative and qualitative methodologies to solve these problems. Second, we employed the re-scaling method for the data standardization, which is the most commonly used. However, this method has a disadvantage which can be affected by outliers. In further studies, a variety of standardization methods are needed to be employed and compared. Furthermore, although we focused on climate change, we could not include future predictions in our assessment; next steps can include adding future climate change scenarios to the process for a better assessment.

Author Contributions

H.-J.B. designed the research and drafted the manuscript. J.E.K. provided extensive revisions on the manuscript. Y.-R.L. analyzed data and drafted the manuscript.

Funding

This research was partially supported by Korea Ministry of Environment (MOE) as the Graduate School specialized in Climate Change and was partially supported by the National Strategic Project-Fine particle of the National Research Foundation of Korea(NRF) funded by the Ministry of Science and ICT(MSIT), the Ministry of Environment(ME), and the Ministry of Health and Welfare(MOHW) [#2018M3D8A1065815].

Conflicts of Interest

The authors declare no conflict of interest.

References

  1. Intergovernmental Panel on Climate Change (IPCC). Climate Change 2014: Impacts, Adaptation, and Vulnerability; Cambridge University Press: Cambridge, UK, 2014. [Google Scholar]
  2. Ebb, K.L.; McGregor, G. Climate change, tropospheric ozone and particulate matter and health impacts. Environ. Health Perspect. 2008, 116, 1449–1455. [Google Scholar] [CrossRef]
  3. De Sario, M.; Katsouyanni, K.; Michelozzi, P. Climate change, extreme weather events, air pollution and respiratory health in Europe. Eur. Respir. J. 2013, 42, 826–843. [Google Scholar] [CrossRef] [PubMed] [Green Version]
  4. Fiore, A.M.; Naik, V.; Leibensperger, E.M. Air quality and climate connections. J. Air Waste Manag. Assoc. 2015, 65, 645–685. [Google Scholar] [CrossRef] [PubMed]
  5. Bell, M.L.; Dominici, F.; Samet, J.M. A meta-analysis of time-series studies of ozone and mortality with comparison to the National Morbidity, Mortality, and Air Pollution Study. Epidemiology 2005, 16, 436–445. [Google Scholar] [CrossRef] [PubMed]
  6. Bell, M.L.; Dominici, F. Effect modification by community characteristics on the short-term effects of ozone exposure and mortality in 98 US communities. Am. J. Epidemiol. 2008, 167, 986–997. [Google Scholar] [PubMed]
  7. Atkinson, R.W.; Yu, D.; Armstrong, B.G.; Pattenden, S.; Wilkinson, P.; Doherty, R.M.; Heal, M.R.; Anderson, H.R. Concentration-response function for ozone and daily mortality: results from five urban and five rural U.K. populations. Environ. Health Perspect. 2012, 120, 1411–1417. [Google Scholar] [CrossRef] [PubMed]
  8. Malig, B.J.; Pearson, D.L.; Chang, Y.B.; Broadwin, R.; Basu, R.; Green, R.S.; Ostro, B. A Time-Stratified Case-Crossover Study of Ambient Ozone Exposure and Emergency Department Visits for Specific Respiratory Diagnoses in California (2005–2008). Environ. Health Perspect. 2016, 124, 745–753. [Google Scholar] [CrossRef]
  9. Houghton, A.; English, P. An approach to developing local climate change environmental public health indicators, vulnerability assessments, and projections of future impacts. J. Environ. Public Health 2014, 2014, 1–7. [Google Scholar] [CrossRef]
  10. United Nations Development Programme (UNDP). Adaptation Policy Frameworks for Climate Change: Developing Strategies, Policies and Measures; Cambridge University Press: Cambridge, UK, 2005. [Google Scholar]
  11. Dessai, S.; Hulme, M. Does climate adaptation policy need probabilities? Clim. Policy 2004, 4, 2–22. [Google Scholar] [CrossRef]
  12. Lissner, T.K.; Holsten, A.; Walther, C.; Kropp, J.P. Toward sectoral and standardised vulnerability assessments: The example of heatwave impacts on human health. Clim. Chang. 2012, 112, 687–708. [Google Scholar] [CrossRef]
  13. The European Topic Centre on Air and Climate Change. Urban Regions: Vulnerabilities, Vulnerability Assessments by Indicators and Adaptation Options for Climate Change Impacts-Scoping Study. ETA/ACC Technical Paper. 2010. Available online: https://acm.eionet.europa.eu/reports/docs/ETCACC_TP_2010_12_Urban_CC_Vuln_Adapt.pdf (accessed on 21 May 2019).
  14. IPCC. Climate Change 2007: The Physical Science Basis; Solomon, S., Ed.; IPCC: Geneva, Switzerland, 2007. [Google Scholar]
  15. Jeon, M.Y.; Lee, H.L.; Yu, J.H. Standardization and Aggregation Method of Construction Project Performance Indicator Using Fuzzy Inference. J. Archit. Inst. Korea Struct. Constr. 2010, 26, 21–30. [Google Scholar]
  16. Lee, J.B.; Lee, H.J.; Moon, K.J.; Hong, S.C.; Kim, D.R.; Song, C.K.; Hong, Y.D. Vulnerability Assessment of Human Health Sector due to Climate Change: Focus on Ozone. J. Korean Soc. Atmos. Environ. 2012, 28, 22–38. [Google Scholar] [CrossRef]
  17. Torlak, G.; Sevkli, M.; Sanal, M.; Zaim, S. Analyzing business competition by using fuzzy TOPSIS method: An example of Turkish domestic airline industry. Expert Syst. Appl. 2011, 38, 3396–3406. [Google Scholar] [CrossRef]
  18. Jun, K.S.; Chung, E.S.; Kim, Y.G.; Kim, Y. A fuzzy multicriteria approach to flood risk vulnerability in South Korea by considering climate change impacts. Expert Syst. Appl. 2012, 40, 1003–1013. [Google Scholar] [CrossRef]
  19. Yazdani-Chamzini, A.; Yakhchali, S.H. Tunnel Boring Machine (TBM) selection using fuzzy multicriteria decision making methods. Tunnel. Undergr. Space Technol. 2012, 30, 194–204. [Google Scholar] [CrossRef]
  20. Lee, G.; Jun, K.S.; Chung, E.S. Integrated multi-criteria flood vulnerability approach using Fuzzy TOPSIS and Delphi technique. Nat. Hazards Earth Syst. Sci. 2013, 13, 1293–1312. [Google Scholar] [CrossRef]
  21. Kim, Y.K.; Chung, E.S.; Lee, K.S. Fuzzy TOPSIS Approach to Flood Vulnerability Assessment in Korea. J. Korea Water Resour. Assoc. 2012, 45, 901–913. [Google Scholar] [CrossRef] [Green Version]
  22. Shin, H.; Lee, S. Development of a climate change vulnerability index on the health care sector. J. Environ. Policy 2014, 13, 69–93. [Google Scholar]
  23. Kim, D.W.; Deo, R.C.; Lee, J.S.; Yeom, J.M. Mapping heatwave vulnerability in Korea. Nat. Hazards 2017, 89, 35–55. [Google Scholar] [CrossRef]
  24. Zhu, Q.; Liu, T.; Lin, H.; Xiao, J.; Luo, Y.; Zeng, W.; Zeng, S.; Wei, Y.; Chu, C.; Baum, S.; Du, Y.; Ma, W. The spatial distribution of health vulnerability to heatwaves in Guangdong Province, China. Glob. Health Action 2014, 7, 1–10. [Google Scholar] [CrossRef]
  25. Romero-Lankao, P. Urban Vulnerability and Adaptation to the Health Impacts of Air Pollution and Climate Extremes in Latin American Cities. Res. Urban Sociol. 2012, 12, 247–275. [Google Scholar]
  26. Manangan, A.; Uejio, C.; Saha, S.; Schramm, P.; Marinucci, G.; Brown, C.; Luber, G. Assessing health vulnerability to climate change: A guide for health departments. Climate and health technical report series. Centers for disease control and prevention. 2014. Available online: https://www.cdc.gov/climateandhealth/pubs/AssessingHealthVulnerabilitytoClimateChange.pdf (accessed on 21 May 2019).
  27. Reid, C.E.; O’Neill, M.S.; Gronlund, C.J.; Brines, S.J.; Diez-Roux, A.V.; Brown, D.G.; Schwartz, J.D. Mapping community determinants of heat vulnerability. Environ. Health Perspect. 2009, 117, 1730–1736. [Google Scholar] [CrossRef]
  28. Kim, Y.R. Seoul Detailed Action Plans for Adaptation Measures to Climate Change; Seoul Metropolitan Government: Seoul, Korea, 2012; 158p.
  29. Cooley, H.; Moore, E.; Heberger, M.; Allen, L. Social Vulnerability to Climate Change in California; California Energy Commission: California, CA, USA, 2012.
  30. Hess, J.J.; Eidson, M.; Tlumak, J.E.; Raab, K.K.; Luber, G. An evidence-based public health approach to climate change adaptation. Environ. Health Perspect. 2014, 122, 1177–1186. [Google Scholar] [CrossRef]
  31. Shin, H.S. Assessment of Climate Change Vulnerability in Health; Korea Institute for Health and Social Affairs: Seoul, Korea, 2011. [Google Scholar]
  32. Jones, R.N. Managing uncertainty in climate change projections: Issues for impact analysis. Clim. Chang. 2000, 45, 403–419. [Google Scholar] [CrossRef]
  33. Webster, M.; Forest, C.; Reilly, J.; Babiker, M.; Kicklighter, D.; Mayer, M.; Prinn, R.; Srofim, M.; Sokolov, A.; Wang, C. Uncertainty analysis of climate change and policy response. Clim. Chang. 2003, 61, 295–320. [Google Scholar] [CrossRef]
  34. Patt, A.; Klein, R.J.T.; Vega-Leinert, A. Taking the uncertainty in climate-change vulnerability assessment seriously. C. R. Geosci. 2005, 337, 411–424. [Google Scholar] [CrossRef]
  35. Son, M.W. Development of Flood Vulnerability Index Considering Climate Change. J. Korea Water Resour. Assoc. 2011, 44, 231–248. [Google Scholar] [CrossRef]
  36. Kang, J.E. Green Infrastructure Strategy for Unban Climate Adaptation; Korea Environment Institute: Seoul, Korea, 2012. [Google Scholar]
  37. Hwang, C.L.; Yoon, K. Multiple Attribute Decision Making an Introduction; Sage: Thousand Oaks, CA, USA, 1981; pp. 38–45. [Google Scholar]
  38. Awasthi, A.; Chauhan, S.S.; Omrani, H. Application of Fuzzy TOPSIS in evaluating sustainable transportation systems. Expert Syst. Appl. 2011, 38, 12270–12280. [Google Scholar] [CrossRef]
  39. Yazdani, M.; Alidoosti, A.; Basiri, M.H. Risk analysis for critical infrastructures using fuzzy topsis. J. Manag. Res. 2012, 4, 1–19. [Google Scholar] [CrossRef]
  40. Gumus, A.T. Evaluation of hazardous waste transportation firms by using a two step fuzzy-AHP and TOPSIS methodology. Expert Syst. Appl. 2009, 36, 4067–4074. [Google Scholar] [CrossRef]
  41. Farajzadeh, M.; Ahadnezhad, M.; Amini, J. The vulnerability assessment of urban housing in earthquake against (A case study: 9th district of Tehran municipality). Urban-Reg. Stud. Res. J. 2011, 3, 19–36. [Google Scholar]
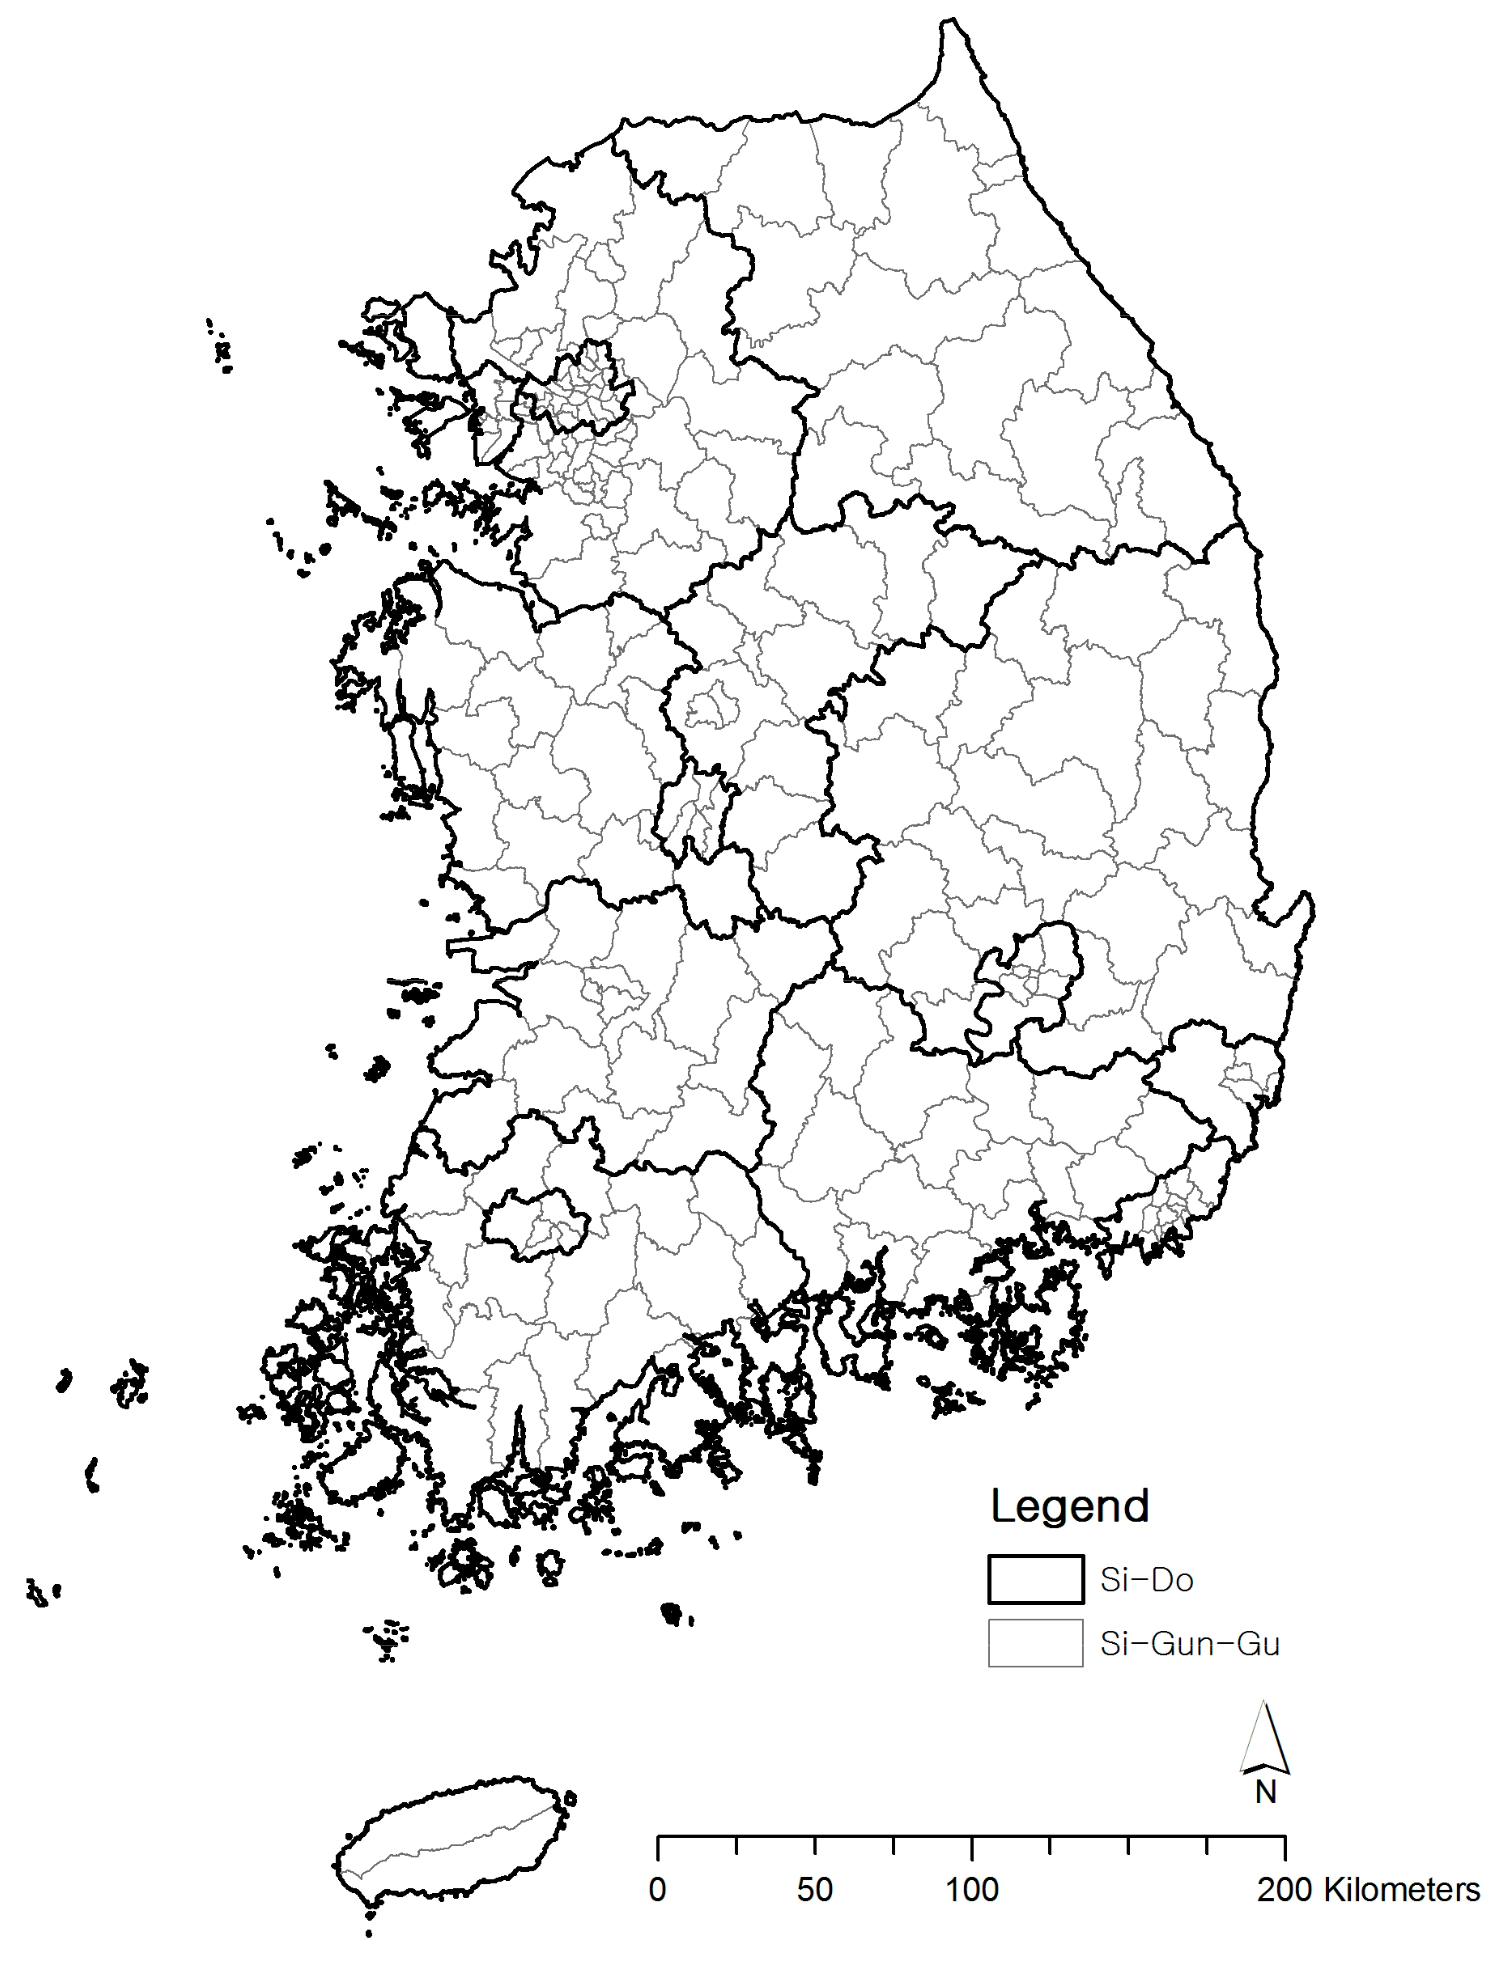
Figure 1. Map of the study area.
Sustainability 11 02894 g001
Figure 2. Triangular fuzzy number.
Sustainability 11 02894 g002
Figure 3. Assessment result of each factor in human health vulnerability to increases in ozone concentration due to climate change.
Sustainability 11 02894 g003
Figure 4. Overall result of a vulnerability assessment on the health effects of climate change and increased ozone concentrations.
Sustainability 11 02894 g004
Figure 5. Comparison of factors in the most and least vulnerable areas to ozone.
Sustainability 11 02894 g005
Figure 6. Correlation between the results of the assessment to vulnerabilities from cardiovascular-related diseases and increased ozone concentrations.
Sustainability 11 02894 g006
Table 1. Indicators for calculating human health vulnerability in relation to climate change and increased ozone concentrations.
CategorySectorIndicatorsData SourceReference
ExposureMeteorological factorAnnual average daily maximum temperature (°C)KMA[22,23]
Amount of total rainfall (mm)KMA[22]
Air pollution factorNumber of days on which the average ozone concentration exceeded 60 ppb for 8 hNIER[22]
Number of days on which the ozone concentration exceeded 100 ppbNIER[16]
Annual average summer ozone concentrations (ppb)NIER[22]
SensitivityVulnerable groupPercentage of the population aged 65 or older (%)KOSIS[24,25]
Percentage of the population aged 13 or younger (%)KOSIS[24]
Percentage of the elderly people living alone (%)KOSIS[26,27]
Percentage of national basic living security recipients (%)KOSIS[22]
Percentage of disabled individuals (%)KOSIS[22]
Vulnerable environmentPercentage of road area (%)MOLIT[22]
Number of facilities emitting pollutants to the airMOE[28]
Number of registered vehicles KOSIS[29]
Disease distributionNumber of patients hospitalized with respiratory-related diseasesNHIC[22,25]
Number of deaths related to cardiovascular disease KOSIS[22,25]
Adaptive capacitySocio-economic capacity factorGross regional domestic product (KRW million)KOSIS[24]
Financial independence rateMOI[22]
Unemployment rate (%)KOSIS[22]
Level of education (%)KOSIS[27]
Health/medical capacity factorHealth care spending on residents per capita MOI[22]
Number of doctors per capitaKOSIS[22]
Number of emergency medical service facilities per capitaKOSIS[22,26]
Public health center staff per capitaKOSIS[22]
Air pollution control factorEnvironmental budget for residents per capitaMOI[16]
Air quality notification systemMOE[16]
Government officials working on environmental regulations per capitaMOI[16]
Percentage of green area (%)NIER[22]
Table 2. The basic statistics of vulnerability assessment indicators and the weights for the budget allocation process (BAP) per indicator.
FactorsPercentilesMeanStd. DeviationBAP Weight
Min.25Median75Max.
Meteorological factorAnnual average daily maximum temperature (℃)31.0234.0634.3634.7535.6534.290.730.67
Rainfall (mm)868.001274.501,484.001,670.002,820.001,486.65306.260.33
Air pollution factorNumber of days that the ozone concentration on average exceeded 60 ppb for 8 h2.0020.0029.5038.50113.0029.4413.860.36
Number of days the ozone concentration exceeded 100 ppb0.001.003.445.1219.003.663.020.40
Annual average summer ozone concentrations (ppb)14.8020.4322.7324.4537.7622.473.190.24
Vulnerable groupPopulation aged 65 or older (%)4.339.2612.9023.5939.4316.789.340.27
Population aged 13 or younger (%)6.5010.9913.3715.4922.9013.412.980.19
Population of elderly people living alone (%)0.601.472.545.2510.903.572.620.25
Population of Basic livelihood security recipients (%)0.602.113.725.2110.403.821.930.16
Population of disabled individuals (%)2.504.385.648.2511.606.292.230.13
Vulnerable environmentRoad area (%)0.692.313.508.6126.185.764.790.30
Number of facilities emitting pollution to the air0.0031.5072.00177.001750.00169.19257.290.36
Number of registered vehicles 4,44425,05867,518111,842302,77975,45256,8130.34
Disease distributionNumber of patients hospitalized with respiratory-related diseases2,535.0023,703.0081,141.00162,470.50349,590.00102,701.5787,632.590.53
Deaths related to cardiovascular disease14.00132.50208.00298.00577.00224.39120.430.47
Socio-economic capacity factorGross regional domestic product (KRW million)181,7231,224,2452,799,8578,413,718271,649,35731,234,90280,600,0000.25
Financial independence rate8.6015.7024.4041.7082.9030.2017.720.20
Unemployment rate (%)2.603.804.805.306.304.660.990.29
Level of education (%)8.1517.0724.9031.5661.8525.2910.520.26
Health/medical capacity factorPer capita health care spending for residents12,297.0022,864.8743,299.7087,876.01416,957.006,5297.606,0825.070.30
Number of doctors per capita0.701.491.762.3421.082.251.970.22
Number of emergency medical service facilities per capita0.091.331.551.876.461.650.640.27
Public health center staff per capita0.792.394.597.7086.606.738.120.21
Air pollution control factorPer capita environmental budget for residents16,904.0068,588.44473,709.82806,141.642,089,568.00523,818.49441,869.860.23
Air quality notification system1.001.001.001.004.001.310.720.29
Per capita government officials in environmental regulation 0.250.651.121.281.730.970.460.18
Percentage of green areas (%)0.1530.3246.5258.9377.5943.4517.650.30