Article

Sustainable Emerging Country Agro-Food Supply Chains: Fresh Vegetable Price Formation Mechanisms in Rural China

1
International College of Business & Technology, Tianjin University of Technology, No 391 Binshuixi Road, Xiqing District, Tianjin 300384, China
2
School of Business and Economics, Thompson Rivers University, BC V2C 0C8, Canada
*
Author to whom correspondence should be addressed.
Sustainability 2019, 11(10), 2814; https://doi.org/10.3390/su11102814
Submission received: 5 December 2018 / Revised: 14 May 2019 / Accepted: 15 May 2019 / Published: 17 May 2019
(This article belongs to the Special Issue More Food or Better Distribution)

Abstract

:
Price formation mechanisms along the supply chain determine the economic viability of effective agro-food supply chains in emerging countries with small-scale subsistence-based agricultural activities. This study offers an analysis of the price formation mechanism along the Chinese fresh vegetable supply chain. It analyzes the features of market transactions in the upstream and downstream greenhouse cucumber supply chain, and presents an elastic model of pricing in the fresh and raw vegetable market in China. Based on the daily procurement price data of 78 cases in Lingyuan (Liaoning Province, China), and the wholesale price of 78 cases in Xinfadi (Beijing, China), the Augmented Dickey Fuller (ADF) unit root test, co-integration test, and Granger test were applied to reveal the relationship between the prices. Findings indicate that the price of fresh and raw vegetables is formed at the wholesale market, where after it cascades from wholesalers to direct buyers (primary merchants) and farmers, and is passed on to retailers and consumers, where the final market price is formed. Farmers exhibit bounded rationality decision-making, that is, they can only passively accept price fluctuations. Buyers (primary merchants, wholesalers’ agents, and retailers) at each level extract fixed rewards, while making no additional contribution to the price fluctuations along the chain. The wholesalers enjoy an oligopolistic competition market and can better take advantage of the asymmetric information to accommodate market demand.

1. Introduction

Small-scale subsistence agriculture is predominant in emerging countries such as China. Food production and distribution are considered an important strategic issue for any government. Stability in food production and smooth distribution to end consumers contribute to social cohesion and the welfare of both producers and consumers. Given that food price volatility in world markets has been increasing since the food crisis of 2007/2008, the price formation process of agro-produce is important for policy orientation, economic sustainability, and improvement of the sector [1,2]. Degree of power concentration and food price transmissions among the actors in the food value chain contribute greatly to the smooth functioning of the food value chain. In the 1980s, China introduced reforms in the rural distribution system and relaxed controls over the prices of most agricultural products. Some specialized markets, which are engaged in the distribution of agricultural products, have gradually been established. This, in turn, has spurred the development of agricultural production and distribution.
Vegetables, as crops with short production cycles and relatively high economic benefits, have been planted by large numbers of farmers, leading to unprecedented production capacity in the vegetable sector. From 1978 to 2016, China’s total area of vegetable production increased from 3.331 million hectares to 223.2828 million hectares. In 2016, the total vegetable output reached 7.98 billion tons, with China being the world’s largest vegetable producing and consuming country [3]. Rapid economic rise and increasing health consciousness among the people will further accelerate the consumption of fresh vegetables. Despite the importance of the fresh vegetable market sector, and the many studies on food supply chains, no significant study has addressed the fresh vegetable supply chain and how the price formation process takes place and how much market power is retained by different actors along the supply chain. Price transmission can take place in different directions and in different magnitudes depending on the type of commodity, space and chain stages [4]. Understanding the peculiarities in the price transmissions processes and directions can contribute to designing public and private price risk management measures specific to the commodity, space and chain stage.
In the “13th Five-Year” period, structural supply side reform is the main agricultural development policy trend in China. The agriculture sector will be continuously optimized with a focus on market orientation, and the increase in the supply of green and high-quality agricultural products is expected to continue. The structural contradiction between the supply and demand of agricultural products needs to be relieved. The vegetable price formation mechanism is an important aspect of agricultural product supplies, and the study thereof is of great significance to the optimization of the structure of agricultural production.
An important number of actors are involved in the vegetable supply chain; they impact many employment and social considerations [5]. Fresh and raw vegetables consist of vegetables that are not processed, but simply packed, transported, and distributed to retail outlets—essentially in their original forms. In the supply chain of fresh and raw vegetables, all of the nodes and links (apart from the production behavior of farmers) are governed by sales behavior.
Generally, the supply of agricultural products, and their production and consumption in particular, are fragmented in time and space [6]. In addition, agricultural products have smaller supply and demand elasticity. In recent years, China’s agricultural products have experienced large price fluctuations [6]. Notably, fresh and raw vegetables produced in greenhouses are normally characterized by off-season availability, perishability, high price fluctuations, and short production cycles. As a result, the large and ordered fluctuations of market prices are of great significance and, therefore, this paper focuses on the price formation process of fresh and raw vegetable supply. The analysis focuses on the various links of circulation. It examines the elasticity model of the price transmission of the fresh vegetable supply chain, and develops a powerful explanation for the price formation mechanism of fresh vegetables.
An analysis of price transmission in supply chains is important because imperfect price transmission can be a result of market power [7]. An in-depth analysis can reveal the contributions of each of the nodes and links in the supply chain to price fluctuations, and the need for the adjustment of producers and other agents along the chain. Improving our understanding of the price formation process will contribute to the overall development of this sector, which largely depends on the price transmissions and spillover along the supply chain and how it affects both the farmer-producers and end consumers. Furthermore, the study can facilitate effective policy formulation and provide insights to benefit the economic sustainability of production and supply of vegetables in emerging markets such as China [8]. Improved understanding of the vegetable supply chain actors—both downstream and upstream—price formation mechanisms, and degree of price transmission and market concentration will enable policy makers and managers to formulate strategies that can create a sustainable vegetable supply chain. Efficient production, distribution and pricing can be a win-win situation for all the parties involved and reduce waste along the value chain and contribute to the social, economic and ecological development (i.e., sustainability).
This paper proceeds with a review of the literature (Section 2), after which it analyzes the market characteristics of each link in the supply chain, sums up the elastic model of the price transmission of fresh vegetables in China’s greenhouse, and provides an analysis framework for the price formation mechanism of fresh vegetables along the supply chain (Section 3). Then, it carries out an empirical test of the price of different nodes (Section 4). Results are summarized and conclusions are provided in Section 5.

2. Literature Review

The mechanism of price formation of fresh vegetables has been an important topic for supply chain researchers, practitioners, and policy makers. According to Beckert [9], price formation has three approaches: the network approach, the institutional approach, and the cultural approach. According to Bakucs, Fałkowski, and Fertő [10], whether the price transmission is symmetric or asymmetric depends on the market structure. In places where the market structure is fragmented, has higher government support, and where there are more restrictive regulations on price controls in the retail sector, asymmetric price transmission takes place. On the other hand, more restrictive entry barriers in the retail sector and the relative importance of the sector tend to promote symmetric producers-retail price transmission [10]. There are three main explanations for the price formation mechanism of fresh vegetables. The first view is that the formation of fresh vegetable prices is determined by supply and demand [11]. A decrease in supply or demand will result in the fluctuation of the vegetable price. The stable growth of the production volume is a prerequisite and basis for the stability of fresh vegetables [12,13,14]. Cutts and Kibsten [15] studied the south African agro-food marketing supply chain and found that when the market was concentrated at a certain stage/level, asymmetric price transmission took place, except when the retail product was perishable and could not be stored for a long time. Price transmission depends also on the degree of value-adding (processing, packaging and distribution) of the agro-food products beyond the farm gate and commodity market [15]. Some scholars have used the VAR and VECH models to conduct empirical analysis of the formation of vegetable prices, and postulated that there is a transmission mechanism between production and retail price [16,17,18]. The second view is that the cost of production is the main factor in fresh vegetables price formation. The changes in labor and cultivation cost, as part of production cost, will affect the price of fresh vegetables [19]. However, some authors do not support this view, and use the inter-provincial panel data PAVR model to prove that the cost of vegetable production has a weak impact on the formation of vegetable prices [20]. The third perspective is that distribution and other factors are important in the price formation mechanisms of fresh vegetables. Through a study of the transmission of fresh vegetable prices in 17 American cities, Ward [21] showed that the decline of vegetable prices is faster than the rise of prices by vegetable price transmission from the upstream wholesale price to the downstream retail price [22]. Through many links, the vegetable price increases more than tenfold from the field to the table, especially in the “last kilometer” [23].
The supply chain represents the upstream and downstream interrelated organizational network [24] that provides products and services to the final customers. The fresh vegetable supply chain integrates the merchants, producers (farmers), distributors, retailers, and end users into a complete structural model. The time series of agricultural product prices is reflected by a typical nonlinear system [25,26], and there is a stable and short-term dynamic relationship [27] between the upper and lower-level prices. There are asymmetric relations in the upper and mid-level supply chain, such as the conduction degree, the middle and downstream conduction degree, the time lag, and the direction [28].
Some scholars have conducted empirical studies on price formation mechanisms at different levels of the supply chain, and found asymmetric characteristics of price transmissions in the supply chain [29,30]. Market power concentration, whether in the farm stage, retail stage or the wholesale stage, influence the degree of price transmission and the low impact of changes in farm prices on the end consumer markets [31]. In the fresh vegetable supply chain, the high distribution cost and information asymmetry affect the cooperative relationship between the vegetable wholesalers and retailers, thus affecting the formation of the vegetable price [32].
With respect to dynamic pricing, researchers have mainly studied the dynamic optimal pricing strategy of fresh agricultural products. Its influencing factors include the anticipation of price reduction, freshness, sensory quality, ordering mode on the shelf, logistics environment, and others. However, few studies have been conducted to date on the pricing mechanism of fresh vegetables from a supply chain perspective [33]. In summary, existing research on fresh vegetable supply chains is focused on the wholesale and retail market [33], transportation and distribution links [34], and household behavior selection [35]. The fresh vegetable supply chain is an important entry point to study the formation of fresh vegetable prices. All supply chain links affect supply chain cost and price formation. Price transmission between farm and retail levels is also affected by both short-run and long-run asymmetries [36]. The research results are used to provide a framework for analyzing the price formation mechanism of fresh vegetables, based on the supply chain perspective in the Chinese market. Public policy, markets and civil society play important roles in the governance of sustainable agro-food systems at local and territorial level [37].

3. Research Method

This study employed the Augmented Dickey Fuller (ADF) unit root test, the co-integration test, and the Granger test to daily price data to reveal the relationship between the acquisition price in Lingyuan, in Liaoning Province, and the wholesale price in Xinfadi, Beijing.

3.1. The Price Conduction Model of the Fresh and Raw Vegetable Supply Chain

3.1.1. The Price Conduction Model of the Upstream Supply Chain

The households of vegetable-producing farmers form the starting point in the supply chain. Primary merchants procure products directly from the producers, and then sell them to secondary buyers—the agents of the wholesalers. The secondary buyers have fixed places of business, personnel, and labor. They hold stable wholesale channels, and form a bridge between the producer and the national wholesale market networks. In general, farmers, primary merchants, and secondary merchants reside in the same region, are closely linked to each other, and can be considered as the upstream supply chain of fresh and raw vegetables. Figure 1 depicts the tree-like structure of the upstream supply chain.
In this framework, a typical procurement (acquisition) model of the upstream supply chain of fresh and raw vegetables can be summarized as follows:
(1)
Wholesalers inform secondary merchants regarding the demand quantity. The secondary merchants inform the primary merchants to buy vegetables. However, the task of each primary merchant is different, depending on demand. For example, if the wholesalers have a high demand and time pressures, they will try to seek other buyers, in addition to their own designated buyers;
(2)
The first-level merchants will deliver the vegetables to the warehouses of secondary merchants on completion of procurement. The secondary merchants will do the sorting and packaging and sell the vegetables to wholesalers, who will in turn transport and sell the vegetables. The wholesalers also set the selling price and the price offered to secondary merchants. The price is usually the same across a single region;
(3)
Wholesalers pay the secondary merchants, who in turn pay the primary merchants; the latter in turn pay the producers; and
(4)
The transaction ends.
The price of each acquisition in the supply chain depends on the price that is set by the wholesalers, which is in turn based on the supply and demand in the market, considering factors such as earlier price impact. The profits distributed to first and secondary merchants are rigid. Profit is distributed such that both primary and secondary merchants will get a relatively fixed share, with the only difference being the size of the transactions. For example, for a given transaction, the first merchant may get 0.05 Yuan per kilogram from their secondary merchants, and the secondary merchants may earn 0.02 Yuan per kilogram from the wholesalers.
The behavior of the farmers, primary merchants, and secondary merchants (wholesalers’ agents) belongs to an infinitely repeated game. A “fraud” would reduce the credibility of primary or secondary merchants, and farmers will no longer supply vegetables to them. Under the constraints of the industry norms, the primary and secondary merchants earn their share by credit, and do not risk increasing or decreasing the price at will. The farmers are at the lowest end of the upstream price chain. Compared to primary and secondary merchants, farmers have less awareness of selection and cooperation along the supply chain in choosing the quantity and/or price. In addition, given that fresh and raw vegetables are difficult to preserve, the farmers cannot influence the price and quantity of supply and demand in the short term, and can only passively tolerate changes in costs and benefits.

3.1.2. The Price Conduction Model of the Downstream Supply Chain

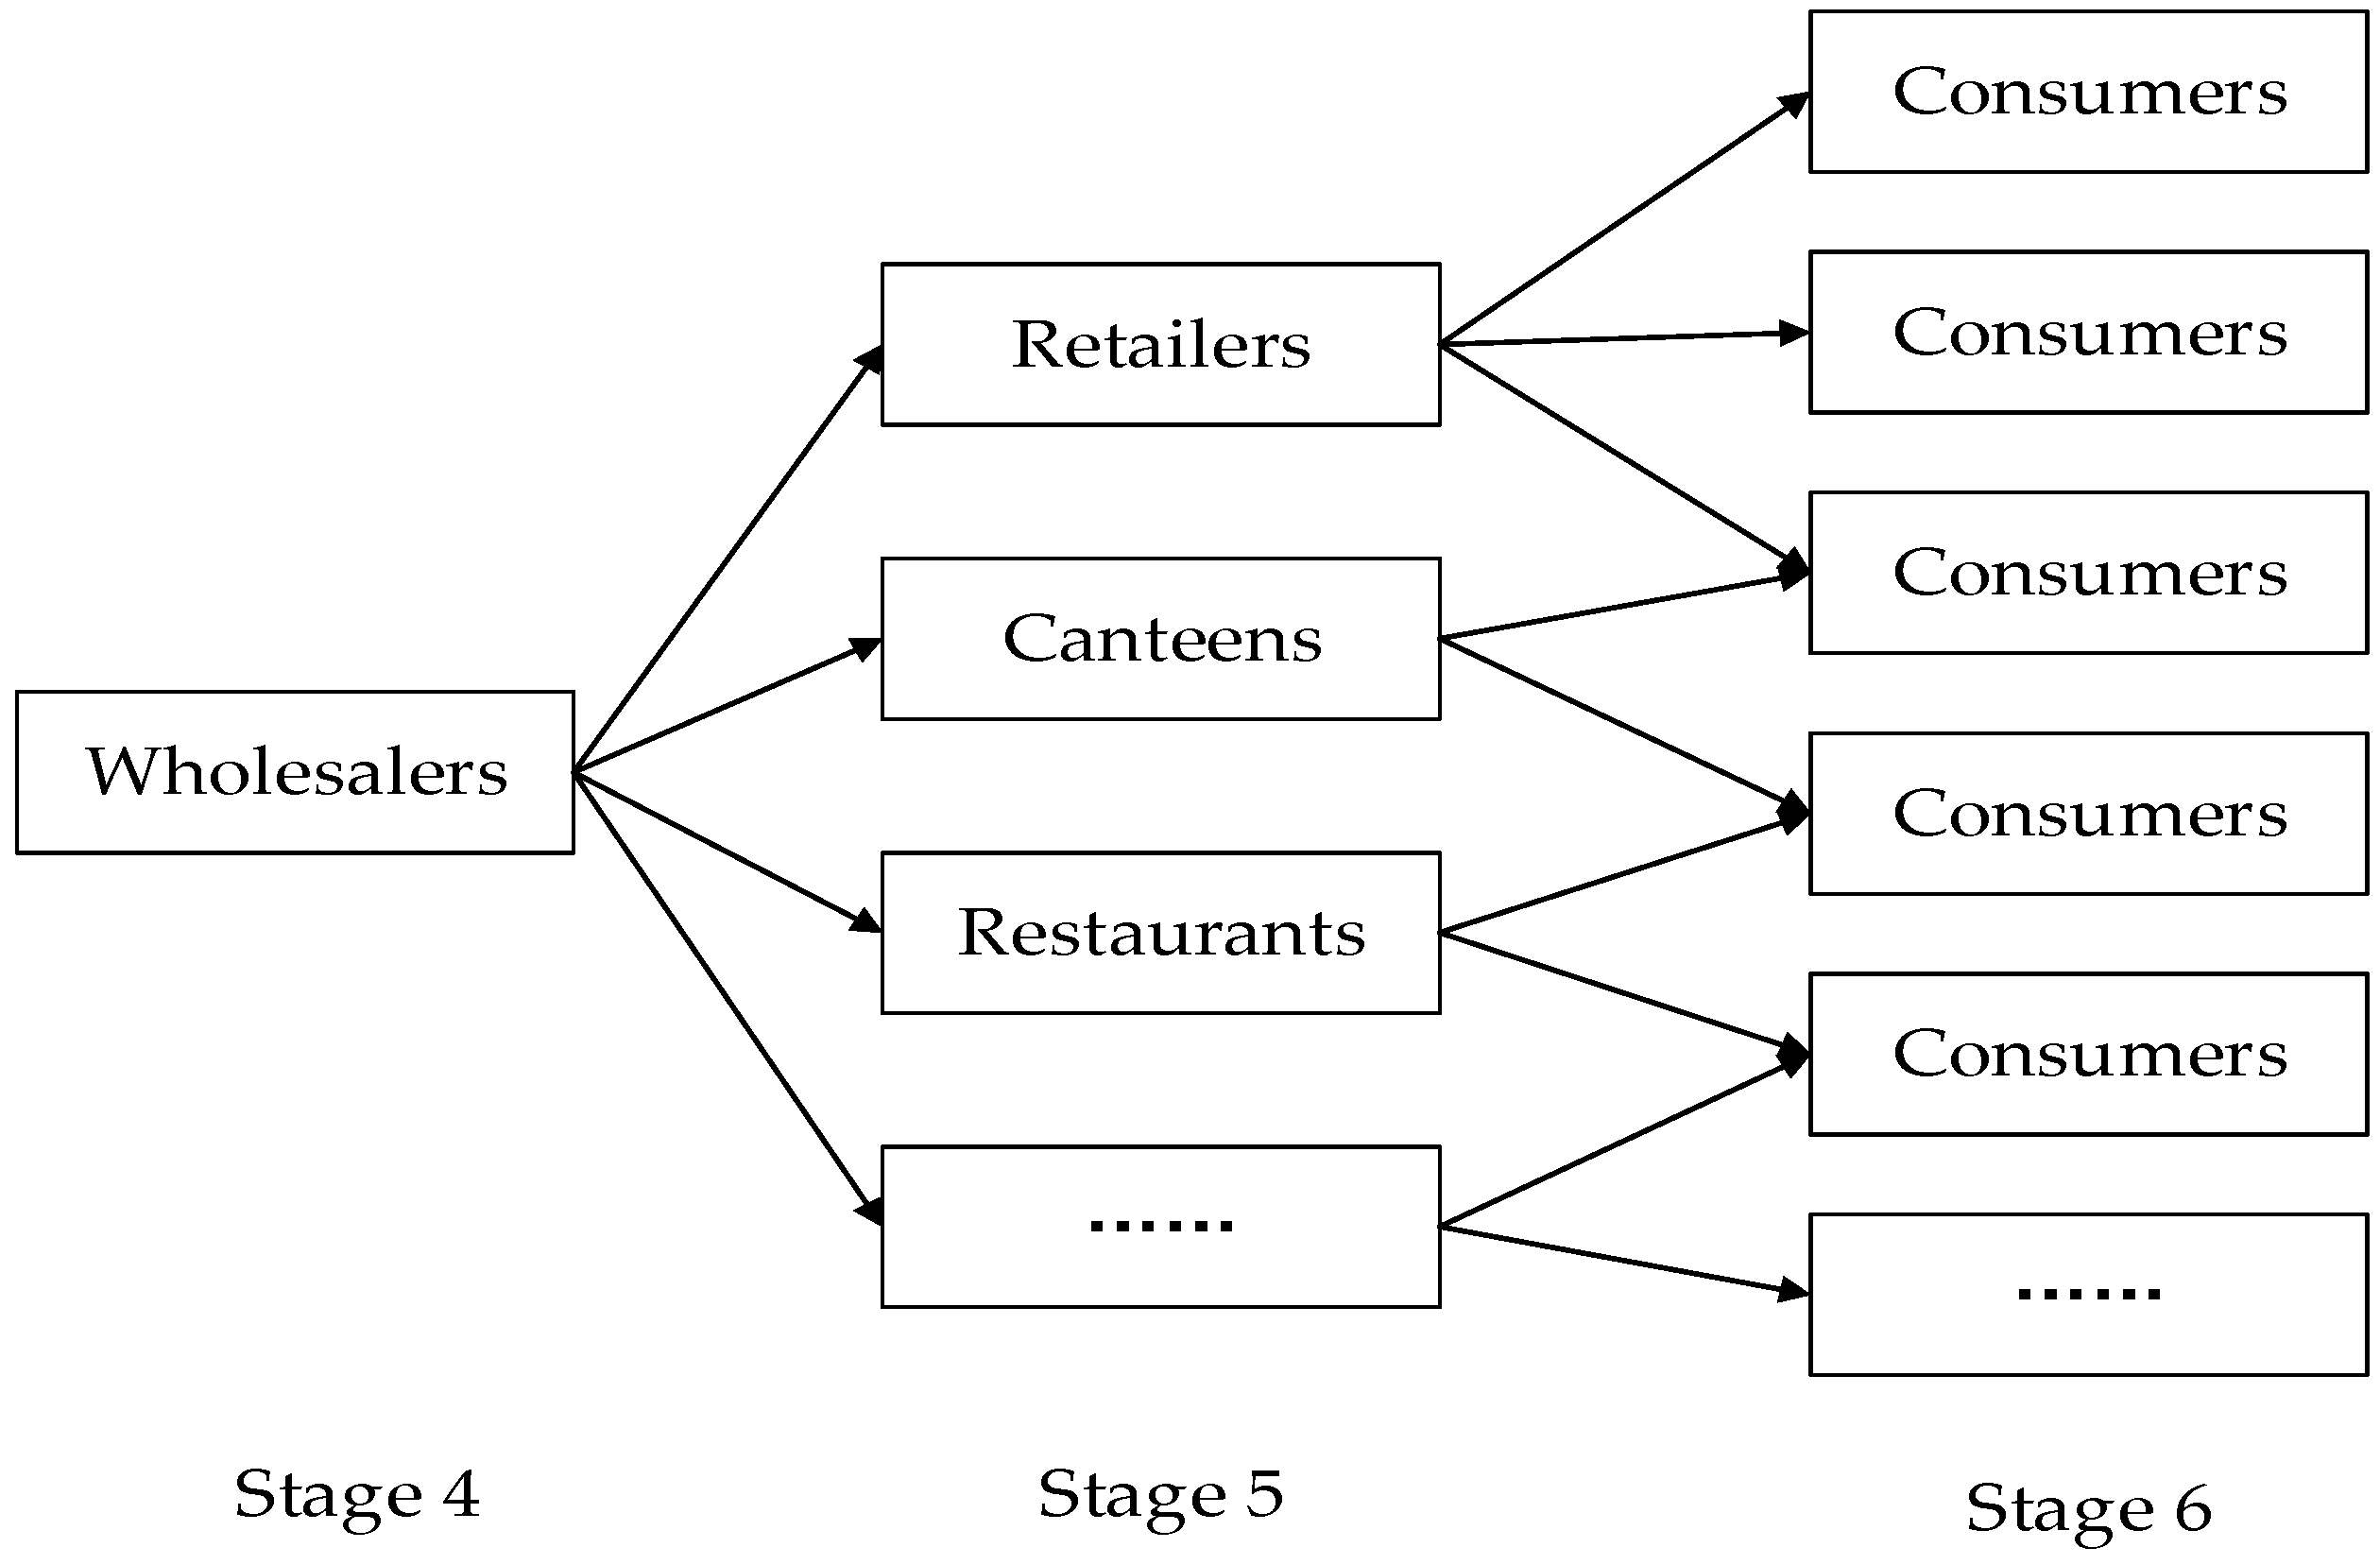
From the wholesale process, the supply chain enters the downstream link, that is modelled by the price conduction and distribution model (Figure 2):
Wholesalers are the core link in the whole supply chain; they are the sources of price formation, and of the acquisition of suppliers, which essentially takes place from different buyers (first and second level) and retailers. They are faced with a flexible market and enjoy the benefits of asymmetrical information, which is close to monopoly competition and an oligopoly market. In addition to competing by means of pricing, wholesalers also obtain higher profits through collusion. The constantly changing market renders their profit margins heavily dependent on their grasp of market information and their ability to mobilize market resources.
In the price chain, the wholesalers obtain changing shares of the profit. They have flexible profit margins. The difference between the price that the wholesalers pay to the secondary merchants and the price that they receive from their customers represents their gross profit. Wholesalers have almost no fixed costs. Except for the variable cost of fixed amounts, the profit per kilogram has significant elasticity. Unlike the profit model of the upstream merchants, factors such as asymmetrical supply and demand information, well-developed logistical networks, years of experience, and close connections motivate wholesalers to influence prices and practice speculation. Wholesalers are not simple price takers, but participants in price formation, and can employ a variety of competitive strategies to influence demand and supply, as well as prices.

3.2. Elastic Model of Supply Chain Price Conduction of Fresh and Raw Vegetables

3.2.1. Elastic Model of Price Conduction

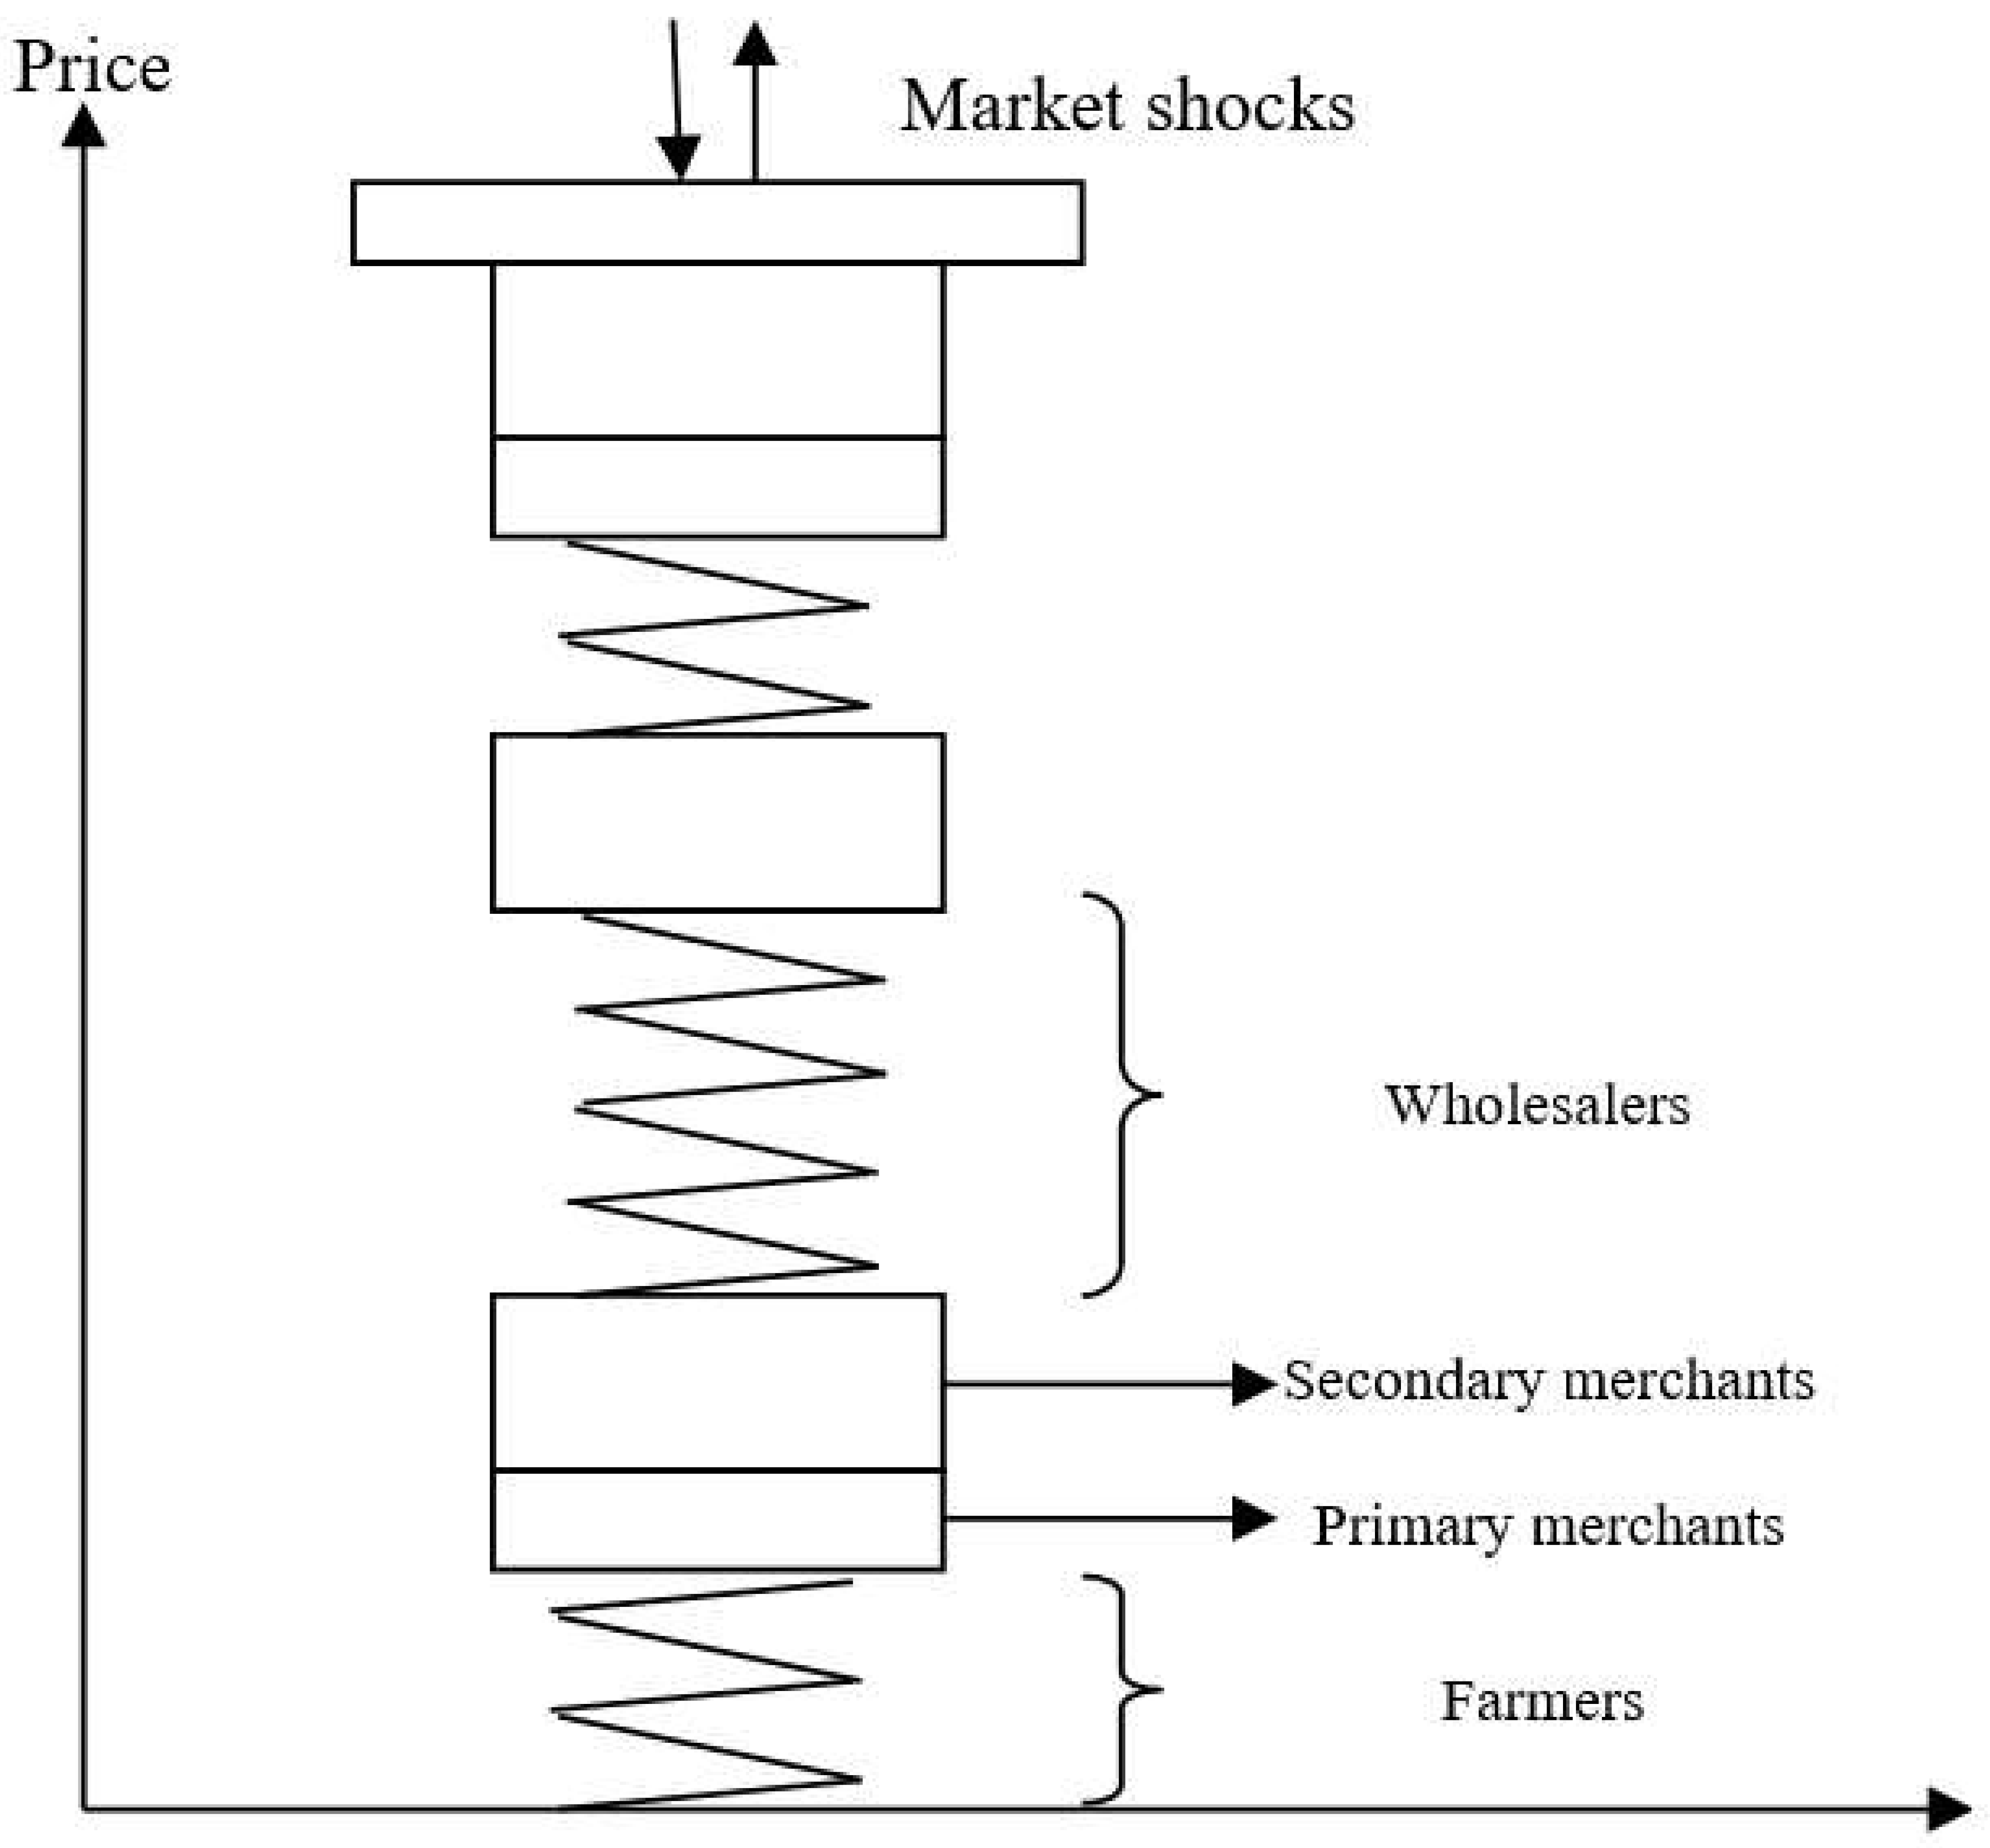
The elastic model of price conduction is shown in Figure 3. The vertical axis represents price, and the price range of each part represents the price distribution in a single transaction, regardless of cost. On some nodes, the price per unit is fixed and the participant will make a profit or loss according to the market situation on the other nodes. Over the long term, the market can maintain a relatively fixed rate of profit, but the price is flexible in the short term. According to the two different risk/profit-making models, the price distribution can be divided into two parts: a rigid and an elastic part. Rectangles represent the rigid part of the price distribution. As Figure 3 depicts, the prices received by upstream merchants belong to the rigid part, while the springs represent the elastic portion of the price distribution model. Here, the prices received by the farmers and wholesalers are elastic.

3.2.2. Generalized Correction of the Model

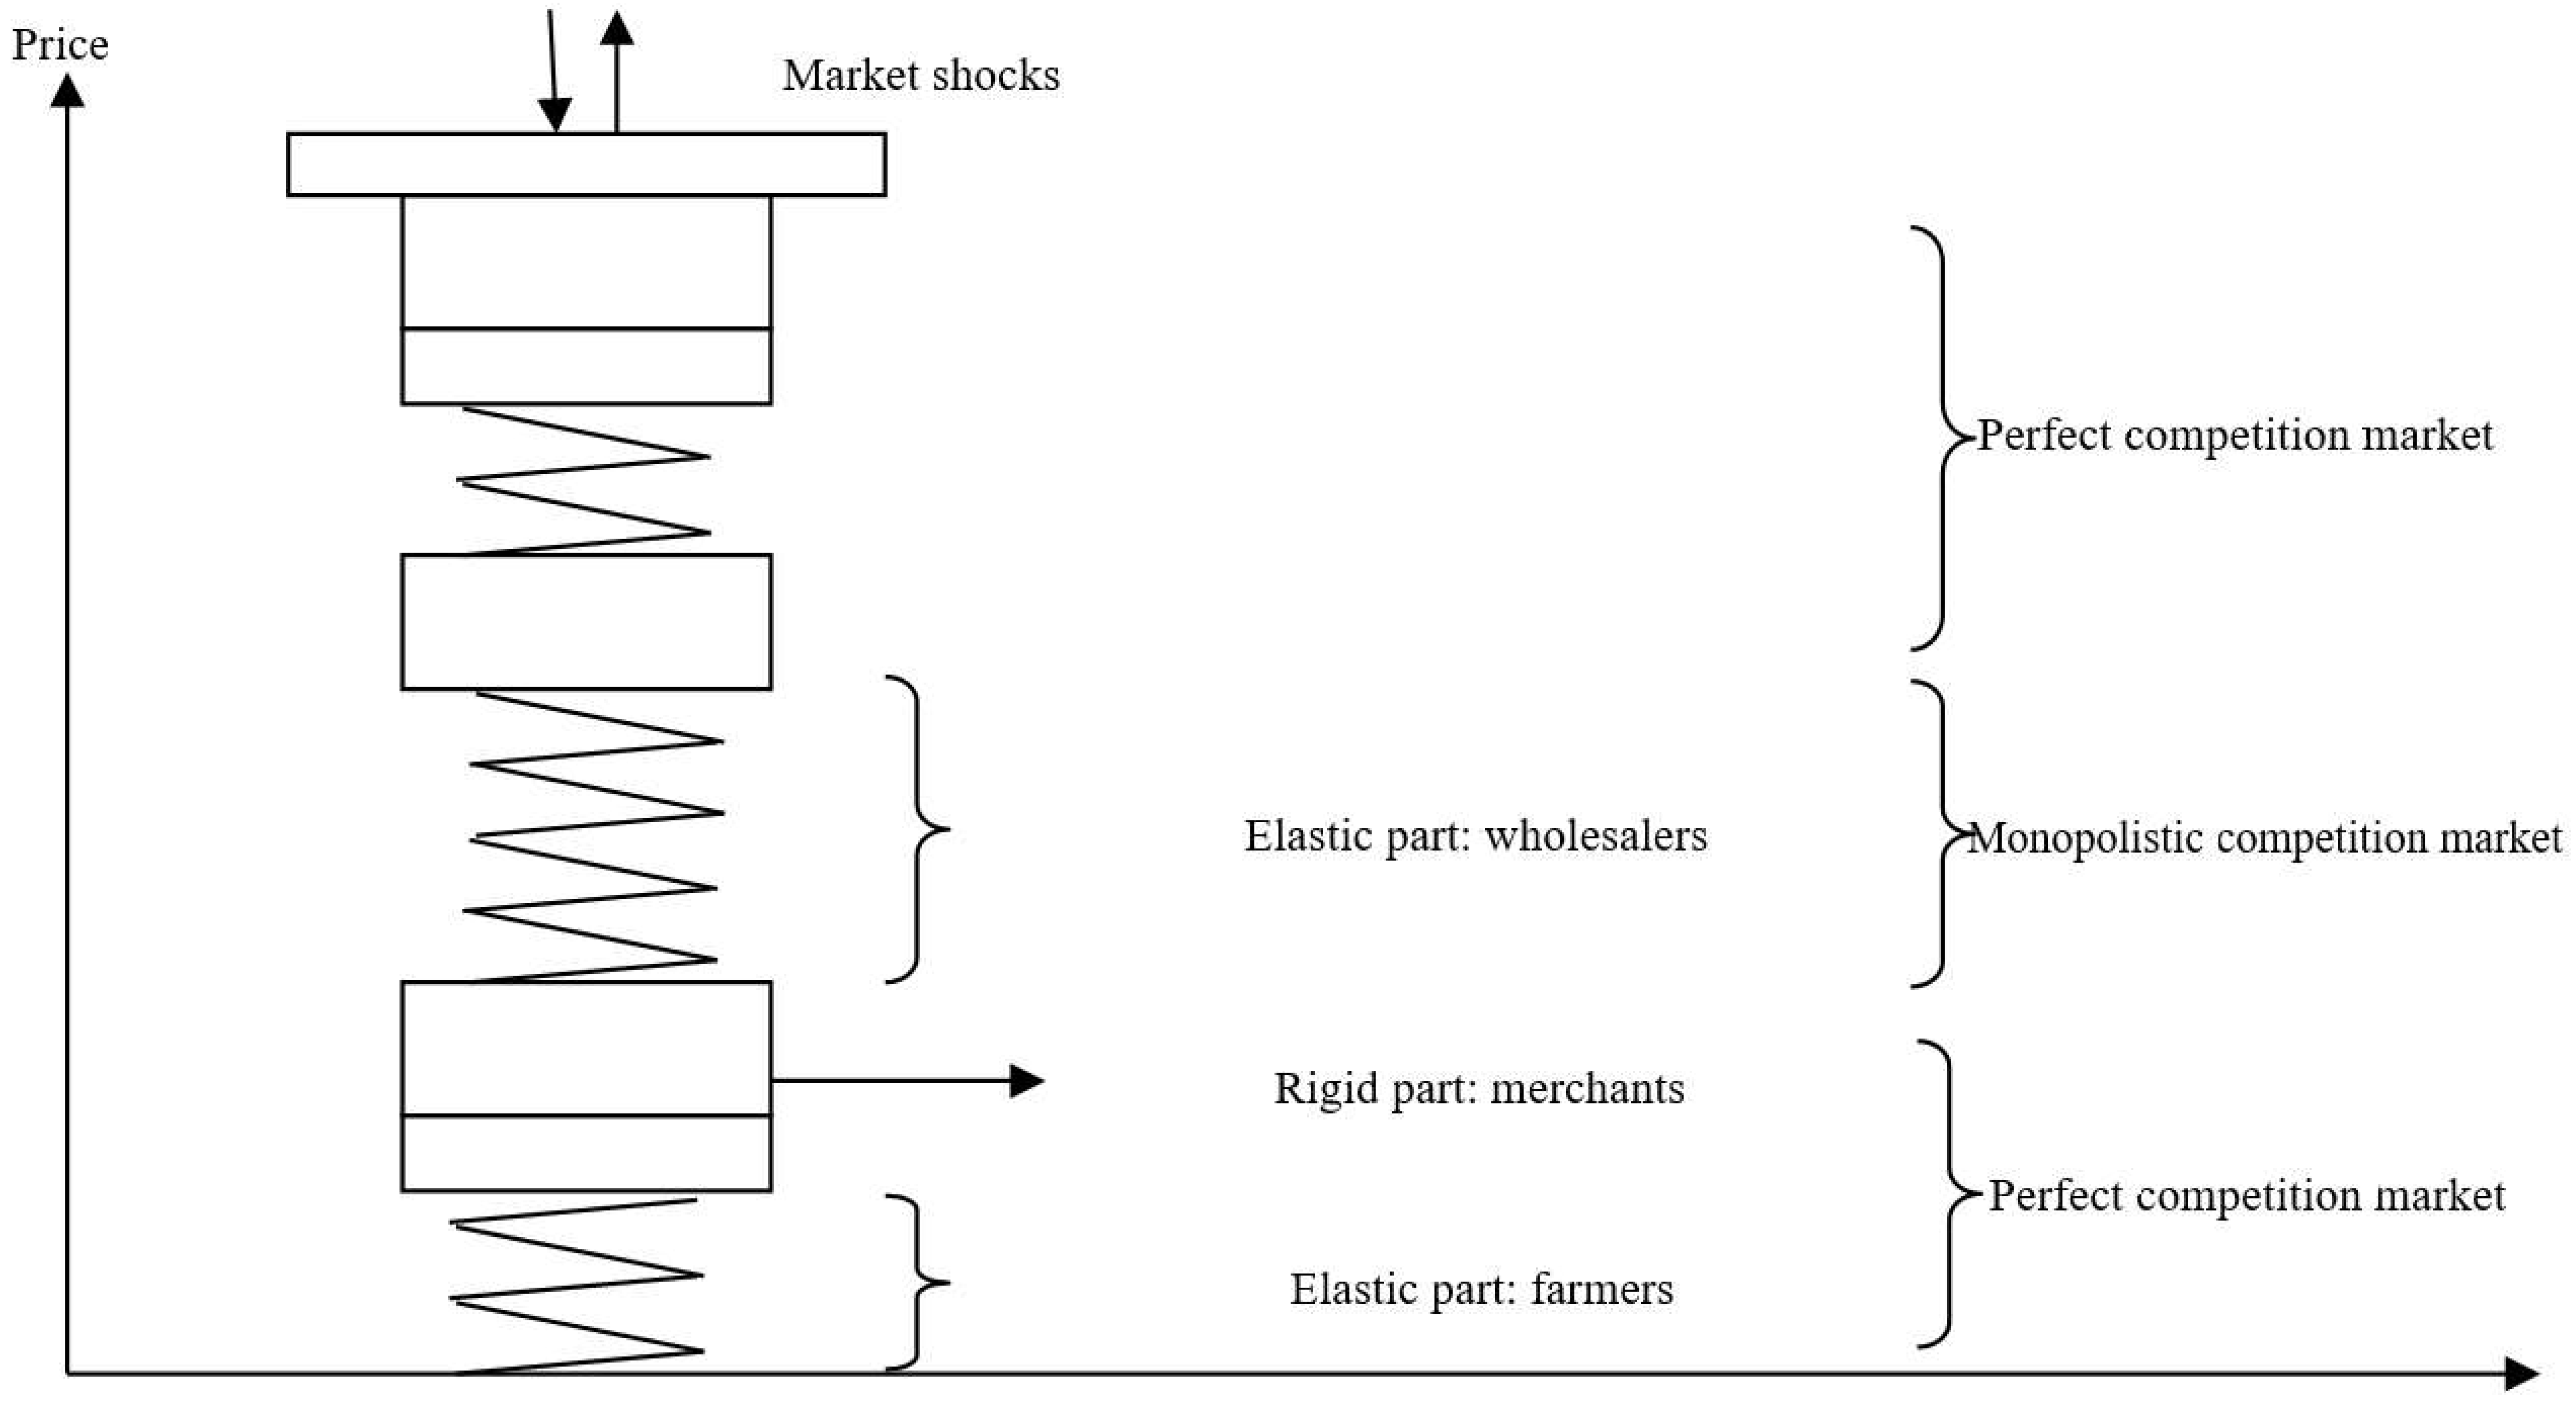
The corrected elastic model of price conduction retains the elastic and rigid parts (Figure 4).
The elastic part of the price is expressed by fold lines, which are composed of two elements: the height (h) and the elastic coefficient (k). The height represents the price range, an important factor for determining revenues. Here, it should be noted that the factors that determine height vary at different nodes in the chain. The factors that affect farmers’ h are not the same as those affecting wholesalers’ h. Although the market determines both, the farmers’ h is determined by the price conduction of supply and demand for the whole supply chain. The wholesalers’ h, for example, is determined by factors such as capital turnover, risk preference, the ability to acquire information, financial strength, and others. The elastic coefficient represents the variation in h during price fluctuations when faced with the same market shocks. The larger the elastic coefficient is, the smaller the variation of h is, and vice versa. The elastic coefficient k is determined by the ability to respond to market shocks from the corresponding subject in the elastic range.
The rigid part of the price is represented by rectangles. It is only composed of height, and stands apart from the elastic portions of price in the supply chain. Here, each participant extracts a fixed amount of commission from the price distribution, according to certain standards.
The curve of Figure 4 indicates the number of participants in different links of the supply chain, with its corresponding market on the right. The farmers and merchants in the upstream supply chain, and the consumers at the end of the supply chain, can be in a perfect competitive market. In the middle of the supply chain, the initiative of participants is more obvious, and closely resembles a monopolistic market.
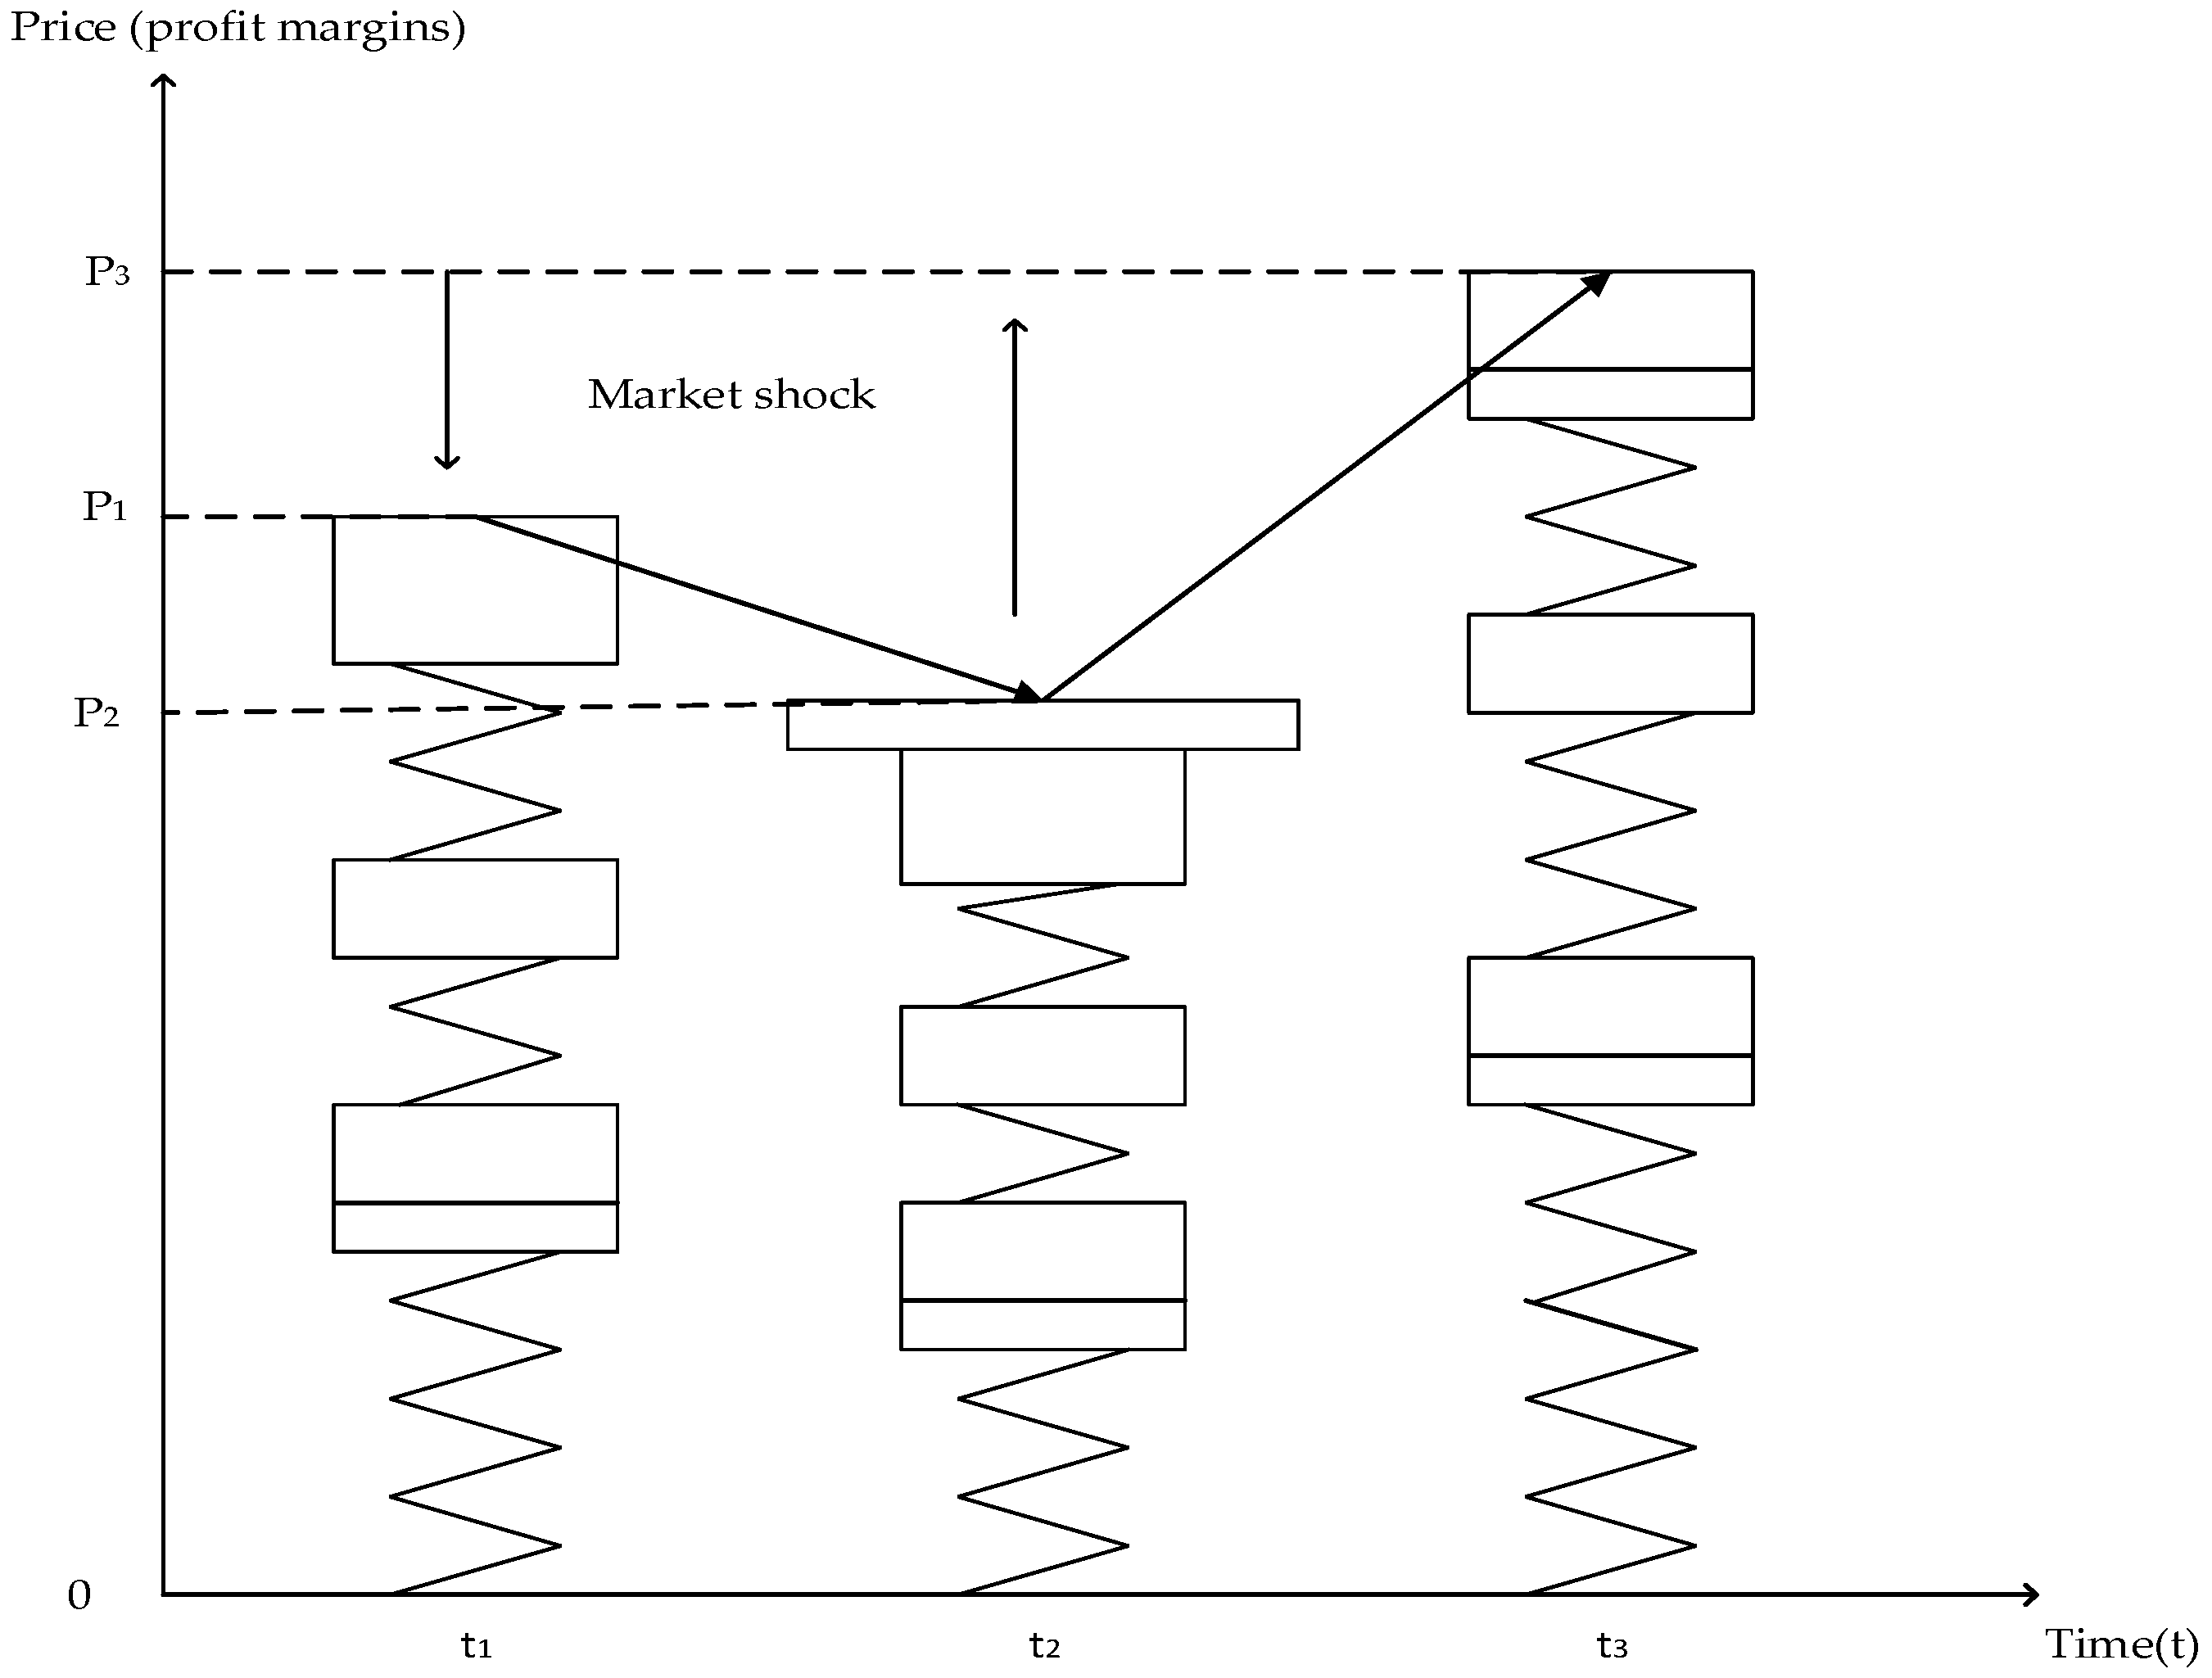
Figure 5 depicts the distribution of price fluctuations over time in the event of a market shock. The price at each node fluctuates with changes in market supply and/or demand. The difference in height between the different periods on the same node represents the change in profit. Of particular importance is the fact that the height of the rigid parts remains unchanged, while the elastic part depicts the changes in price levels.

4. Empirical Analysis

4.1. Descriptive Analysis of Data

This study used the daily cucumber price data (pricely) from Lingyuan and the cucumber wholesale price data (pricebj) from Xinfadi; both of these are nodes on the same cucumber supply chain. The upstream procurement prices and the wholesale prices are for the same batch and the same grade of cucumbers, from 13 October 2017 to 30 December 2017. EViews 6.0 was used to analyze the relationship between the upstream procurement price and the wholesale price of cucumbers in the same supply chain. The Table 1 presents the descriptive statistics of the vegetable supply chain.
The correlation coefficient between the upstream procurement price and the wholesale price of cucumbers is 0.9082, which reflects a strong correlation between the two prices; that is, the upstream procurement price is associated with and follows the same direction as the wholesale price. The standard deviation coefficient was used to measure the relative changes of the observed indicators, and the mean and standard deviation of the two prices are presented in Table 2.
The standard deviation coefficient, also known as the coefficient of variation, is the so-called dispersion coefficient, which is an index that is used to study the stability of a variable. The standard deviation coefficient (V sigma) is obtained from the standard deviation (U). For the indices used in this study, the standard deviation coefficient is more suitable to reflect the stability of the variable than the standard deviation. The smaller the standard deviation coefficient, the higher the overall stability and the smaller the change range. Table 2 shows that the standard deviation coefficient of the procurement price is 0.319, which is higher than the 0.309 of the wholesale price, indicating that the wholesale price is more stable and that the procurement price follows the wholesale price’s direction.

4.2. Stationarity Test

As Table 3 illustrates, this study conducted an ADF unit root test for the two variables, including intercept and trend.
It can be seen that the hypothesis of the existence of the unit root cannot be rejected at the 10% significance level based on the two variables of price, while the null hypothesis is rejected at the 1% significance level. As a result, the original variables are integrated of order 1. The results confirm the existence of asymmetry in the supply chain. As the prices are integrated of order one I (1), this means that an I (1) variable can have a linear trend but not a quadratic trend. The findings reiterate that the procurement price follows the wholesale price, and that the relationship is linear and stable.

4.3. Co-Integration Test

The time series of procurement price and wholesale price are integrated of order 1; therefore, the co-integration test is carried out by the two-step Engel-Granger method. The first step is to estimate the regression model:
Pricelyit = a0 + a1pricebjit + uit
The sample regression model and the residual series are obtained, and the ADF unit root test is performed on the residual. The results are shown in Table 4.
Results show that the residuals are I (0) so we reject the null and accept that variables are co-integrated. The residual error is a stationary series; hence, there exists a long-term equilibrium relationship between the variables. This implies that there is a stable price formation mechanism along the supply chain.

4.4. Value at Risk (VAR) and the Determination of Lag Order

The two price series are co-integrated and non-stationary. Vector error correction (VEC) is a VAR model with co-integrated constraint (a long-term stable relationship); therefore, it is often used for modeling of co-integrated and non-stationary time series. It can reflect the long-term static relations and the short-term dynamic relations between variable series. Before establishing VEC, the lag orders should be determined, based on five kinds of criteria (Table 5). According to the test result, the lag order is 3.

4.5. Granger Causality Analysis

The Granger causality test is a statistical hypothesis test for determining whether one time series is useful in forecasting another. The Table 6 presents the Granger causality analysis of cucumber purchase and wholesale prices.
As the above table illustrates, the cucumber procurement prices in Lingyuan are the Granger cause of buying prices at the 10% significance level, and the cucumber wholesale prices in Xinfadi are the Granger cause of buying prices in Lingyuan at the 1% significance level. In other words, the cucumber procurement prices in Lingyuan can be caused by the wholesale prices in Xinfadi. It further proves that the price is formed at the wholesale node of the process, and then transferred to upstream and downstream nodes to form the price chain. In addition, it indicates that the wholesalers have certain tendencies, namely to actively react to market forces.

5. Discussions on Findings

Efficiency and fairness of agro-food supply chains are essential for gaining the benefits from trade liberalization, particularly in the rural areas of emerging countries. This study facilitated an improved understanding of pricing mechanisms, and of the efficiency of the fresh vegetable supply chain in rural China. Access to information on how the price formation process is distributed vertically within the supply chain is essential for designing an economically sustainable fresh vegetable supply chain, in order to maximize social welfare and improve the competitiveness of the agro-food sector.
The fluctuations of commodity prices in the agro-food sector will not only influence the behaviors of agricultural producers, but also involves the income distribution and end-consumer benefits of the entire agro-food supply chain [38]. Cucumber prices are formed throughout the national wholesale distribution chain. The vegetable wholesale market is at the intersection of supply and demand, where large wholesalers are more capable of taking advantage of asymmetric information to adjust to the supply and demand of the market, and thus make profits. Hence, there is a shift in price risk from farmers to wholesalers—a finding that corresponds with Bunte [39,40]. The price cascades back from wholesalers to upstream merchants and farmers, and is passed down to retailers and consumers, where the final market price is formed. Corresponding value appropriation, or floating prices, is extracted for different processes as the price is transferred to upstream and downstream nodes. The findings imply that the market power remains with the wholesalers, and that the impact of the low price on the final consumer food prices changes at the farm level, and vice versa. These findings are partially similar to the findings of Blažková and Syrovátka (2013) [41]. Findings also show that the fresh vegetable market is relatively stable, which corresponds to the study of Guillen and Franquesa (2015) [31].
In general, farmers’ decision-making reflects bounded rationality. Consequently, they will often make choices depending on experience, habits, and customs [42]. Due to a lack of history and a culture of organized cooperation, farmers only passively accept the ups and downs of prices. The farmers can organize horizontally and vertically to make their voices heard and to avoid the collapse of cooperation and situations that reflect the prisoner’s dilemma where cooperation between the parties is more beneficial for them than using opportunistic behavior with each other.
The upstream merchants constitute the middle link between farmers and wholesalers. They extract fixed rewards, while making no additional contribution to the price fluctuations along the price chain. There is little cooperation among the merchants. Their only means of improving their competitiveness is by extending their working time, increasing labor intensity, or making more personal connections. The merchants play an important role in the supply chain, and have the natural advantage of local information. In the game between farmers and merchants, they can basically comply with each other’s market norms, thus guaranteeing smooth operation of the upstream supply chain.
An essential difference exists between wholesalers and merchants: they are faced with a flexible (especially vegetables) market, with a high degree of information asymmetry, close to the monopolistic competition market. They compete by means of price, and tend to win higher profits through collusion. The rapidly changing market results therein that the profit margins of wholesalers depend heavily on the grasp of market information and the ability to mobilize market resources. Despite great risks, wholesalers can obtain good profits. The author believes that this follows the market operating mechanism, and it is out of reality if the average return rates of different processes are the same.

6. Conclusions

The vegetable supply chain’s market power is concentrated with the wholesalers. The latter’s prices transmit both to the upstream (producers) and the downstream (consumers). The findings show that price is somehow dependent on the fact that wholesalers and farmers/producers do not have access to adequate market information. By educating the farmers, equipping them with information and communications technology, and linking them up with the downstream market, the price formation mechanism can further be improved to enable farmers to be strong price negotiators for their produces. To increase vegetable market competitiveness, and improve the bargaining power of farmers and the welfare of end consumers, public and private actors can collaborate and develop policy frameworks. They can encourage farmers to form cooperative associations and/or strategic alliances, and to develop inter-professional organizations among the different actors of the value chain stages. Coopetition among the producers and sharing information and market trends among the actors of vegetable supply chain can improve the degree and speed of price transmission along the supply chain and create a sustainable value chain both for producers, wholesalers and end consumers.
Overall, an improved understanding of the transactions of vegetables along the supply chain can improve the chain’s economic viability, reduce the bullwhip effect [43], and make the supply chain more sustainable. Despite the small sample size employed in this study, farmers and wholesalers can use this improved understanding in deciding on the price of fresh vegetables. Our study shows that price transmission in vegetable supply chain is asymmetric. Agro-food supply chain, in general, is highly focused on retail markets and exercise important price pressure on upstream producers. In our study, we found that market power was concentrated with the wholesalers. Public policy on market structure reforms and producer’s awareness and formation of cooperative associations can create a context of promoting fair pricing and symmetric price transmissions. This can create a sustainable agro-food supply chain.
Future studies can take a larger sample and compare two regions, in order to determine if the same findings hold in multiple regional markets and can be generalizable on a wider scale. Future studies can also focus on speed of price transmission and price volatility in the perishable food value chains versus non-perishable food value chains.

Author Contributions

Introduction, Literature review Data, Formal analysis, Y.C.; Introduction, Literature review, Conclusion, Methodology, M.M.

Funding

Funded by National Philosophy and Social Sciences Research Program—A Research on the Disposal of Bad Debts and the Security of Financial System. Host: Wang Jingbin. Project Number: 16BJL024.

Conflicts of Interest

The authors declare no conflict of interest.

References

  1. Assefa, T.T.; Meuwissen, M.P.M.; Oude Lansink, A.G.J.M. Literature Review on Price Volatility Transmission in Food Supply Chains, the Role of Contextual Factors and the CAP’s Market Measures; ULYSSES Project, EU 7th Framework Programme, Project 312182 KBBE. 2012.1. 4-05; ULYSSES: Wageningen, The Netherlands, 2013; pp. 1–30. [Google Scholar]
  2. Schnepf, R. Farm-to-Food Price Dynamics; Congressional Research Service Report, 40621; Congressional Research Service: Washington, DC, USA, 2013. Available online: www.crs.gov (accessed on 2 May 2019).
  3. People’s Republic of China, Ministry of Agriculture. China Agricultural Statistics. 2017. Available online: http://www.moa.gov.cn (accessed on 2 May 2019).
  4. Vavra, P.; Goodwin, B.K. Analysis of Price Transmission Along the Food Chain; OECD Food, Agriculture and Fisheries Paper No. 3.; OECD Publishing: Paris, France, 2005. [Google Scholar]
  5. Best, S.; Mamic, I. Global Agri-Food Chains: Employment and Social Issues in Fresh Fruit and Vegetables; (No. 994299953402676); International Labour Organization: Geneva, Switzerland, 2008. [Google Scholar] [CrossRef]
  6. He, L.Y.; Chen, S.P. Multifractal detrended cross-correlation analysis of agricultural futures markets. Chaos Solitons Fractals 2011, 44, 355–361. [Google Scholar] [CrossRef]
  7. Réquillart, V.; Simioni, M.; Varela Irimia, X.L. Imperfect competition in the fresh tomato industry. In Proceedings of the 12th Congress of the European Association of Agricultural Economists—EAAE 2008, Ghent, Belgium, 26–29 August 2008. [Google Scholar]
  8. Liu, T.L.; Wang, Y.Q. Analysis of vegetable supply chain and price fluctuation. China Logist. Purch. 2011, 2011, 52–53. [Google Scholar]
  9. Xu, S. Construction of China agriculture monitoring and early-warning system (CAMES). In Proceedings of the 2013 World Agricultural Outlook Conference; Springer-Verlag: Berlin/Heidelberg, Germany, 2014; pp. 1–13. [Google Scholar]
  10. Bakucs, Z.; Fałkowski, J.; Fertő, I. Does market structure influence price transmission in the agro-food sector? A meta-analysis perspective. J. Agric. Econ. 2014, 65, 1–25. [Google Scholar] [CrossRef]
  11. Beckert, J. Where do prices come from? Sociological approaches to price formation. Socio-Econ. Rev. 2011, 9, 757–786. [Google Scholar] [CrossRef] [Green Version]
  12. Xu, L.; Zhang, Q.; Xu, S. Analysis of price rise in vegetables in China since 2009. Food Nutr. 2012, 18, 39–44. [Google Scholar]
  13. Xiao, X.; Li, C. The price characteristics, problems and solutions of vegetables in China. Res. Agric. Mod. 2016, 37, 948–955. [Google Scholar]
  14. Ling, L. Study on Fluctuation Characteristics and Conduction Mechanism of Vegetable Price in China. Ph.D. Thesis, Shandong Agricultural University, Taian, China, 2017. [Google Scholar]
  15. Cutts, M.; Kirsten, J. Asymmetric price transmission and market concentration: An investigation into four South African agro-food industries. S. Afr. J. Econ. 2006, 74, 323–333. [Google Scholar] [CrossRef]
  16. Beatty, T.; Snyder, S. Regional fresh fruit and vegetable price indices using supermarket scanner data. In Proceedings of the Aaea & Waea Joint Meeting, San Francisco, CA, USA, 26–28 July 2015; Agricultural and Applied Economics Association: Milwaukee, WI, USA; Western Agricultural Economics Association: Milwaukee, WI, USA, 2015. [Google Scholar]
  17. Song, C.; Xu, J.; Zhang, S. Research on vegetable price fluctuation and vertical transmission mechanism—Based on the analysis of VAR and VECH models. J. Agrotech. Econ. 2013, 2013, 10–21. [Google Scholar]
  18. Busse, S.; Brümmer, B.; Ihle, R. Price formation in the German biodiesel supply chain: A Markov-switching vector error-correction modeling approach. Agric. Econ. 2012, 43, 545–560. [Google Scholar] [CrossRef]
  19. Xie, H.; Wang, B. An empirical analysis of the impact of agricultural product price fluctuations on China’s grain yield. Sustainability 2017, 9, 906. [Google Scholar] [CrossRef]
  20. Shi-hong, Z. Analysis on the cause of rising and fluctuating of vegetable prices. Enterp. Econ. 2012, 31, 100–103. [Google Scholar]
  21. Luo, C.; Zhao Wang, Z.; Zhai, Q. Vegetable price fluctuation and its endogenous factors—An empirical analysis based on PVAR model. J. Agrotech. Econ. 2013, 2013, 22–30. [Google Scholar]
  22. Ward, R.W. Asymmetry in retail, wholesale, and shipping point pricing for fresh vegetables. Am. J. Agric. Econ. 1982, 64, 205–212. [Google Scholar] [CrossRef]
  23. Li, S. The internal causes and Countermeasures of vegetables selling cheap and expensive. Theory Reform 2014, 2011, 84–86. [Google Scholar]
  24. Downey, W.D. The challenge of food and agri products supply chains. In Proceedings of the 2nd International Conference on Chain Management in Agri and Food Business, WAU Department of Management Studies, Wageningen, The Netherlands, 24–27 March 1996. [Google Scholar]
  25. Li, Z.; Xu, S.; Cui, L.; Zhang, J. Prediction research based on dynamic chaotic neural network—Taking potato time series price as an example. Syst. Eng. Theory Pract. 2015, 35, 2083–2091. [Google Scholar]
  26. Xu, S.; Li, Z.; Cui, L.; Dong, X.; Kong, F.; Li, G. Price transmission in China’s swine industry with an application of MCM. J. Integr. Agric. 2012, 11, 2097–2106. [Google Scholar] [CrossRef]
  27. Gu, G.; Fang, C. Research on domestic transmission path and asymmetry of agricultural product price fluctuation. J. Agrotech. Econ. 2011, 2011, 12–20. [Google Scholar]
  28. Willett, L.S.; Hansmire, M.R.; Bernard, J.C. Asymmetric price response behavior of Red Delicious apples. Agribusiness 1997, 13, 649–658. [Google Scholar] [CrossRef]
  29. Ben-Kaabia, M.; Gil, J.M. Asymmetric price transmission in the Spanish lamb sector. Eur. Rev. Agric. Econ. 2007, 34, 53–80. [Google Scholar] [CrossRef] [Green Version]
  30. Meyer, J.; von Cramon-Taubadel, S. Asymmetric price transmission, a survey. J. Agric. Econ. 2004, 55, 581–611. [Google Scholar] [CrossRef]
  31. Blažková, I.; Syrovátka, P. Price formation and transmission along the food commodity chain. Acta Univ. Agric. Silvic. Mendel. Brun. 2013, 60, 31–36. [Google Scholar] [CrossRef]
  32. Edet, G.E.; Akpan, S.B.; Patrick, I.M.V. Assessment of price transmission and market integration of pawpaw and leafy telfairia in Akwa Ibom State, Nigeria. Am. J. Exp. Agric. 2014, 4, 1367–1384. [Google Scholar] [CrossRef]
  33. Qi, C.; Fu, M. Research on the influence factors of fresh agricultural products pricing. Price Theory Pract. 2016, 2016, 109–112. [Google Scholar]
  34. Zhao, A.; Zhao, Y.; Wang, C. Research on vegetable price change and transmission mechanism between wholesale and retail markets. Chin. Agric. Sci. Bull. 2011, 2011, 253–260. [Google Scholar]
  35. Zheng, Y. Measurement and upgrading strategies of fresh vegetables circulation efficiency based on Industrial Chain Perspective. Agric. Econ. 2017, 2017, 139–140. [Google Scholar]
  36. Fałkowski, J. Price transmission and market power in a transition context: Evidence from the Polish fluid milk sector. Post-Communist Econ. 2010, 22, 513–529. [Google Scholar] [CrossRef]
  37. Renting, H.; Wiskerke, J.S.C. New Emerging Roles for Public Institutions and Civil Society in the Promotion of Sustainable Local Agro-Food Systems. 2010. Available online: https://library.wur.nl/WebQuery/wurpubs/fulltext/146104 (accessed on 4 May 2019).
  38. Zhou, H. An Analysis on Optional Behaviors and Causal Factors of Vegetable Households’ Selling Pattern. Master’s Thesis, Nanjing Agricultural University, Nanjing, China, 2007. [Google Scholar]
  39. Cao, Y. Study on the fluctuation of terminal price in the value chain of agricultural industry. Stat. Decis. 2015, 7, 88–91. [Google Scholar]
  40. Cao, Y.; Zhao, L. The influence of agricultural product price fluctuation on Farmers’ income. Spec. Zone Econ. 2014, 3, 156–157. [Google Scholar]
  41. Bunte, F. Pricing and performance in agri-food supply chains. In Quantifying the Agri-Food Supply Chain; Ondersteijn, C.J.M., Wijnands, J.H.M., Huirne, R.B.M., van Kooten, O., Eds.; Springer: Dordrecht, The Netherlands, 2006; pp. 37–45. [Google Scholar]
  42. Guillen, J.; Franquesa, R. Price transmission and volatility along the Spanish fresh fish market chain. New Medit 2015, 14, 4–11. [Google Scholar]
  43. Chopra, S.; Meindl, P. Supply Chain Management: Strategy, Planning & Operation, 6th ed.; Pearson Publications: New York, NY, USA, 2018. [Google Scholar]
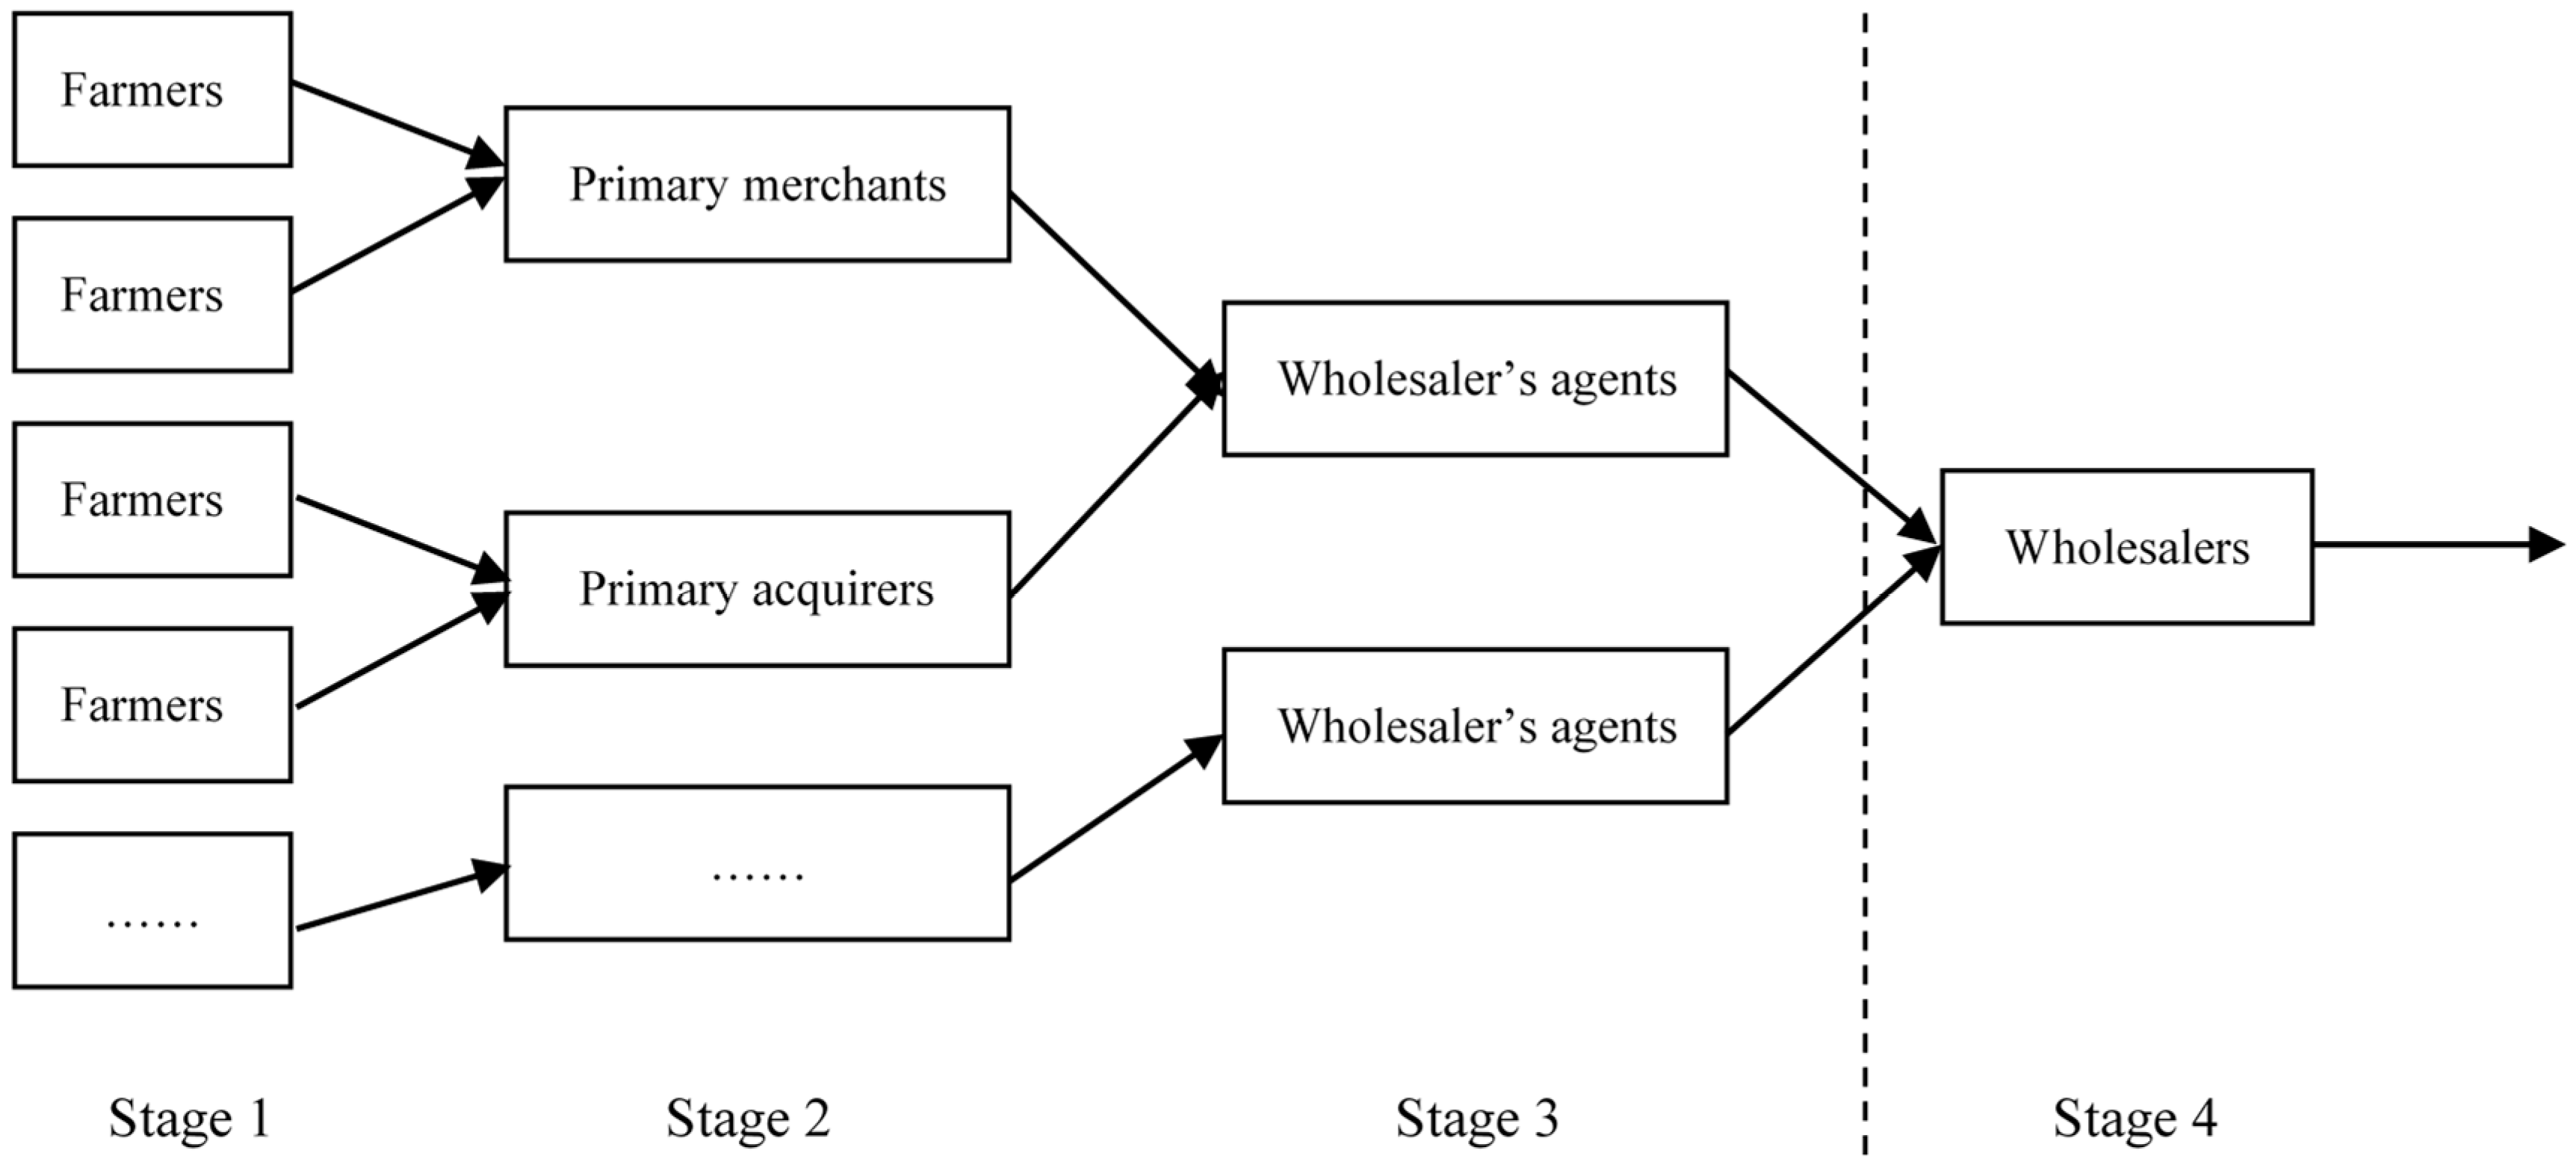
Figure 1. The price conduction model of the upstream supply chain.
Sustainability 11 02814 g001
Figure 2. The price conduction model of the downstream supply chain.
Sustainability 11 02814 g002
Figure 3. Elastic model of price conduction.
Sustainability 11 02814 g003
Figure 4. The corrected elastic model of price conduction.
Sustainability 11 02814 g004
Figure 5. Price fluctuations caused by market shock.
Sustainability 11 02814 g005
Table 1. Variable description.
VariableNameMeanStandard DeviationMinimumMaximumSample Size
Procurement pricePricely2.6220.8371.744.8278
Wholesale pricePricebj3.0270.93425.2578
Table 2. Standard deviation coefficients of cucumber buying and wholesale price.
VariableMeanStandard DeviationStandard Deviation Coefficient
Procurement price2.6220.8370.319
Wholesale price3.0270.9340.309
Table 3. ADF unit root test of time series of upstream procurement and wholesale price.
Variable Horizontal Variable First order Difference Result
ADF t * ADF t ***
Pricebj−1.5209−4.0817−6.7064−4.0833I (1)
Pricely−2.5455−4.0817−9.6573−4.0834I (1)
*** indicates t values at the 1% significance level; * indicates t values at the 10% significance level.
Table 4. Residual test of the ADF unit root.
Variable ADF t *** Result
pricebj−5.5217 −4.0850 I (0)
*** Indicates t values at the 1% significance level.
Table 5. Lag order test.
Lag LogL LR FPE AIC SC HQ
0 −128.0675 NA 0.115278 3.515338 3.577610 3.540179
1 8.747078 262.5361 0.003183 −0.074245 0.112571 * 0.000278 *
2 10.81702 3.860168 0.003355 −0.022082 0.289278 0.102124
3 18.48179 13.87944 * 0.003040 * −0.121129 * 0.314775 0.052758
4 20.02998 2.719789 0.003253 −0.054864 0.505584 0.168705
* Indicates lag order selected by the criterion.
Table 6. Granger causality analysis of cucumber purchase and wholesale prices.
Null Hypothesis F-Statistic Probability
PRICELY does not Granger Cause PRICEBJ 2.14345 0.1028
PRICEBJ does not Granger Cause PRICELY 5.17398 0.0028