Abstract
Flow control devices have been introduced in the wind energy sector to improve the aerodynamic behavior of the wind turbine blades (WTBs). Among these flow control devices, Gurney flaps (GFs) have been the focus of innovative research, due to their good characteristics which enhance the lift force that causes the rotation of the wind turbine rotor. The lift force increment introduced by GFs depends on the physical characteristics of the device and the angle of attack (AoA) of the incoming wind. Hence, despite a careful and detailed design, the real performance of the GFs is conditioned by an external factor, the wind. In this paper, an active operation of GFs is proposed in order to optimize their performance. The objective of the active Gurney flap (AGF) flow control technique is to enhance the aerodynamic adaption capability of the wind turbine and, thus, achieve an optimal operation in response to fast variations in the incoming wind. In order to facilitate the management of the information used by the AGF strategy, the aerodynamic data calculated by computational fluid dynamics (CFD) are stored in an artificial neural network (ANN). Blade element momentum (BEM) based calculations have been performed to analyze the aerodynamic behavior of the WTBs with the proposed AGF strategy and calculate the corresponding operation of the wind turbine. Real wind speed values from a meteorological station in Salt Lake City, Utah, USA, have been used for the steady BEM calculations. The obtained results show a considerable improvement in the performance of the wind turbine, in the form of an enhanced generated energy output value and a reduced bending moment at the root of the WTB.
1. Introduction
Renewable energy generation systems have emerged as a necessity in the current energy production and distribution infrastructure, in which fossil fuel-based sources are still the major energy suppliers. Nevertheless, the fast development, integration, and performance improvement of sustainable energy sources has become a priority, as a consequence of the limited lifetime of fossil fuels and their notorious adverse effects to the environment. According to Rosales-Asensio et al. [], the renewable energy generation in Spain raised from 10.4% of the total national energy generation in 2007 to a 17% in 2015.
The sustainable energy source with the largest production these days is wind energy. Rosales-Asensio et al. [] stated that more than the 40% of the energy produced in Denmark during the year 2015 had its origin in wind energy generation systems. The numerous industrial companies devoted to the design, manufacturing, and installation of wind turbines around the world have contributed to the expansion and efficiency increase of this technology.
Despite the high industrial maturity degree achieved by wind energy technology nowadays, a considerable amount of effort and resources are directed to the improvement of the mechanical, electrical, and aerodynamic performance of the actual wind turbines. A longer lifetime of the mechanical components and the increment of the efficiency and the quality of the generated energy are some examples of this investigation work. Li et al. [] presented a modified analysis procedure to evaluate the extreme response of an offshore wind turbine during its entire lifetime, with an increased accuracy. Yaw angle control of a wind turbine based on reinforcement learning (RL) was developed by Saenz-Aguirre et al. []. The result of the automatic learning process of the proposed RL algorithm is an optimal yaw operation of the wind turbine, which is translated to an increase in its efficiency and lifetime. Astolfi et al. [] and Terzi et al. [] presented in their works different solutions oriented to improve the performance of a wind turbine and enhance its power curve. Furthermore, Astolfi et al. [,] carried out an experimental validation of the real performance and the effect of the previously introduced power curve upgrade solutions. Additional numerical and experimental methods for the assessment of the power curve upgrade of a wind turbine can be found in [,,].
Regarding the optimization of the aerodynamic performance of the wind turbine blades (WTBs), control solutions based on flow control devices have been widely studied in the literature. Holst et al. [] analyzed in their work the effectiveness of Gurney flaps (GFs) to optimize the aerodynamics of wind turbines. Terzi et al. [] and Hwangbo et al. [] presented an upgrade of the power curve of a wind turbine with the utilization of vortex generators (VGs). Fernandez-Gamiz et al. [] studied the influence of passive flow control devices, GFs, and vortex generators (VGs) on the annual energy production (AEP) of the NREL 5-MW reference wind turbine, introduced by Jonkman et al. []. The most common classification system for flow control devices is based on their operating principle and external energy consumption. While active flow control devices need an external energy source to sustain their dynamic operation, passive flow control devices do not rely on an external energy source and their operation is static. A review of a wide range of flow control devices, including passive and active solutions, is presented in [,].
Different improvement and adaption prospects to optimize the performance of existing passive flow control devices have been proposed in the literature. Fernandez-Gamiz et al. [] presented a procedure for the computational modelling of GFs and microtabs (MTs) in an airfoil, with the objective of analyzing their effect on the aerodynamic behavior of the airfoil and the operation of a wind turbine. Martinez-Filgueira et al. [] carried out in their work a detailed parametrical investigation of low profile VGs, and the trajectory and size of the generated air vortex that produces the delayed separation of the boundary layer in an aerodynamic surface. Aramendia et al. [] presented a parametrical analysis of the influence of the length of the GF in the aerodynamic behavior of a DU91W(2)250 airfoil, which is widely used in the design of WTBs. Passive flow control devices have also been studied for the aerodynamic performance enhancement of helicopters. Pastrikakis et al. [] presented an analysis of the aerodynamic behavior of helicopter rotors at low and high rotational speeds, with the implementation of GFs.
GFs belong to the group of passive flow control devices, i.e., their operation is static and not dynamically actuated. As stated by Saenz-Aguirre et al. [], a GF is a passive flow control device composed of a small vane which is placed perpendicular to the surface of the upper/lower side of the airfoil in which it is located and close to its trailing edge. The length of the GFs is usually within 1% and 3% of the chord length of the airfoil. An adequate design of a GF and its implementation in a WTB leads to an increase in the lift coefficient, and thus, the lift force that causes the rotation of the wind turbine. As a result, the power the wind turbine extracts from the wind and the efficiency of the system are incremented. Many research works have been devoted to the optimization of the geometry, length, and position of the GFs in an airfoil. The works of Chow et al. [] and van Dam et al. [] presented an analysis of the effect of GFs with different shapes on the aerodynamic performance of WTBs. The dependence between the distinctive parameters of the GFs and the airfoil on which they are placed has also been studied in the literature. A detailed study of the performance of different shape GFs placed on various airfoils was carried out by Jeffrey et al. [] and Wang et al. []. An enhancement in the lift force and the velocity of the WTBs with the application of GFs in NACA0012 and NACA0015 airfoils was presented by Shukla et al. [].
The parametric analysis carried out by Aramendia et al. [] showed that the aerodynamic performance of WTBs with GFs placed on their surface depends not only on the length of the flow control device but also on the angle of attack (AoA) of the incoming wind. Usually, the orientation of the WTBs to the incoming wind in order to operate with the optimal AoA is achieved with the pitch system of the wind turbine. A detailed explanation on the adaption of the pitch angle to its optimal value was presented in the work of Luo et al. []. Even if the response of the pitch system is fast compared to the other mechanical actuator in a wind turbine (the yaw system), the inertia of the WTBs avoids a response fast enough to properly face the very short-term variations in the incoming wind. As a result, during the response of the pitch system, the pitch angle of the WTBs is not set to its optimal value, and the performance of the wind turbine is not optimized.
In the field of active flow control, research has been mainly focused on the active operation of flow control devices to achieve a WTB load reduction. In this context, some papers about the dynamic operation of passive flow control devices have been found in the literature. Blaylock et al. [] presented a comparative study between the performance of electromechanically actuated MTs and pneumatically actuated jets to reduce loads in WTBs. Tsai et al. [] proposed in their work actively deployed MTs actuated via a four-bar link mechanism, which is more robust than a simply linear actuator. Gomez-Gonzalez et al. [] presented an active operation of the trailing flaps of a WTB for the reduction of loads in the wind turbine. The work of Woodgate et al. [] presented a computational fluid dynamics (CFD) based simulation method for rotating GFs in helicopter rotors.
In this paper, a new approach to the utilization of GFs in wind energy systems is introduced. In the proposed control strategy, GFs are converted into active flow control devices by means of an actuated system that adapts the length of the GF to the AoA of the incoming wind. The very fast response of the proposed flow control technique, from now on referred as the active Gurney flap (AGF) strategy, allows an adaption of the GF length while the pitch system is responding, and thus, optimizes the operation of the wind turbine. The power generated by the wind turbine is increased as a result of the utilization of the AGF strategy. Furthermore, a reduction in the bending moment at the root of the WTBs, and consequently the mechanical loads in the WTBs, is achieved with the proposed technique.
In the designed AGF strategy, a GF database based on an artificial neural network (ANN) has been developed. The GF database contains the data obtained by CFD that relates the aerodynamic performance of a GF for different AoAs and GF lengths. The modeling of the GF Database has been carried out with an ANN in order to avoid quantification problems, guarantee an accurate modeling of non-linear surfaces, ensure access to the data, and guarantee the possibility of increasing the size of the database with the introduction of new data. A multilayer perceptron with back propagation (MLP-BP) was trained and validated for this analysis. In order to analyze the effect of the proposed AGF flow control technique on the operation of the wind turbine and evaluate its performance, blade element momentum (BEM) based calculations have been carried out, as introduced in the work of Fernandez-Gamiz et al. [].
Real wind data of a wind farm in Salt Lake City, Utah, USA, have been used for the analysis in this paper. The real wind speed measurements present a time interval of 1 s and have been performed by an ultrasonic anemometer. The wind data measurements cover a period of time of 3 months, i.e., 92 days. The objective is the evaluation of the performance of a real wind turbine with the introduction of the AGF strategy to improve the fast-dynamic response of the turbine. The turbine selected for the analysis is the NREL 5-MW reference wind turbine, developed by Jonkman et al. []. Experimental data based on wind tunnel tests of the selected wind turbine given by Timmer et al. [] have been considered in the current analysis work. These experimental data present corrections based on the wake blockage effect, which is important for the validation of wind tunnel experiments. Detailed information on this effect is presented in [,].
The document is structured as follows: The location of the ultrasonic anemometer and the values of the real wind speed profile used in the analysis are presented in Section 2. Section 3 exposes the theoretical basis of the effect of GFs on the performance of a wind turbine and the development of a GF database based on an ANN. The improvement and modifications introduced to the BEM algorithm are presented in Section 4. Finally, Section 5 and Section 6 correspond to the obtained results and the conclusions, respectively.
2. Wind Speed Characterization
Real wind speed data, corresponding to wind speed measurements of a meteorological station in Salt Lake City, Utah, USA, have been used in the analysis carried out in this paper. This dataset [] contains one second values for variables measured by seven stations located in Salt Lake City. Wind speeds were recorded at rates faster than 1 Hz from ultrasonic anemometers, and have been averaged to 1 s. Additionally, there are also radiation and soil variables. The data was collected from 10 November 2010 to 2 February 2011 and have been used in several publications, mainly related to the meteorological study of the cold-air pool that fills the Salt Lake City Valley [,,]. The exact location of the meteorological station (situated at a height of 10 m) is given by the following coordinates: −112.0621°, 40.5938°.
The wind speed sensors of the meteorological station were ultrasonic anemometers. Li et al. [] presented three main wind measurement devices (mechanical anemometers, thermal anemometers, and ultrasonic anemometers) and introduced the ultrasonic instruments as the most reliable ones, due to the absence of rotating parts, the wide measurement range, and the low maintenance cost. According to Zhou et al. [], the operating principle of ultrasonic anemometers is the measurement of the time needed by an ultrasonic signal to cover the distance between an emitter and a receptor. The wind speed is calculated based on this time measurement.
The period between every wind speed sample of the analyzed wind speed data was 1 s. It must be noted that wind speed measurements with this period are not easy to have access to and are adequate for the evaluation of the AGF flow control strategy introduced in this paper, since they make it possible to perform a detailed examination of the operation of the wind turbine under very fast changes in wind speed. In fact, wind speed values are usually given in 10 min average values and an analysis of the response of the wind turbine to fast changes is not possible.
The meteorological station from which wind data measurements were collected was located in a flat terrain, with no obstacles to disturb the flow of the wind. Consequently, the logarithmic law was used to extrapolate the measured data to the hub height of 90 m of the NREL 5-MW wind turbine that has been considered for the analysis carried out in this paper. The obtained wind speed profile is illustrated in Figure 1.
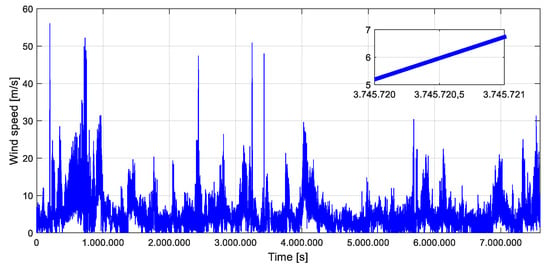
Figure 1.
Wind speed profile measured every 1 s in Salt Lake City, Utah, USA.
The profile represented in Figure 1 shows important wind speed variations. For instance, a 2 m/s wind variation in a time span of 1 s can be observed in the zoomed box included in Figure 1. Furthermore, it can be seen that remarkably big wind speed peak values have been measured. This means that the system will have to face very fast changes in its operating point, which is a suitable scenario to analyze the effect of the AGF flow control strategy introduced in this paper to optimize the fast dynamics of the wind turbine.
In order to model the probabilistic distribution of the wind data measured in Salt Lake City, the Weibull distribution of the wind speed profile has been calculated, and is illustrated in Figure 2.
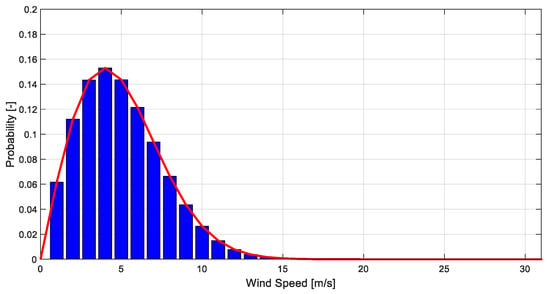
Figure 2.
Weibull distribution of the wind speed profile measured every 1 s in Salt Lake City, Utah, USA.
The shape and form parameters of the probabilistic distribution represented in Figure 2. are and , respectively. The calculation of the Weibull distribution of the real wind speed measurements is of great importance, since it will enable the calculation of the energy the wind turbine will produce during the time interval in which the wind speed values have been collected.
3. Artificial Neural Network-Based Gurney Flap Database
A GF is a passive flow control device designed to modify the air flow around the WTB and thus improve its aerodynamic behavior and maximize the power generated by the wind turbine. The effect of GFs on the aerodynamic performance of the WTBs and the operation of the wind turbines has been widely studied in the literature. Storms et al. [] presented a study in which the lift coefficient of the WTB was increased by 13% with the utilization of GFs. Saenz-Aguirre et al. [] presented increments of 2.43% and 3.85% in the AEP of the NREL 5-MW reference wind turbine, with the utilization of a passive flow control device based solution (GFs and VGs) and considering the real wind speed profiles of the years 2015 and 2016 in Hywind Pilot Park, on the coast of Scotland. The principal characteristics of the NREL 5-MW reference wind turbine are listed in Table 1.

Table 1.
Principal characteristics of the NREL 5-MW reference wind turbine.
If the effect of the GFs on the aerodynamic performance of the WTBs, characterized by the lift and drag forces, is studied in detail, it is to be observed that this effect depends on the physical length of the passive flow control device, i.e., GF length (defined in % of the chord length of the airfoil in which it is located), and the AoA (°) of the incoming wind. A detailed parametric study of the effect of the GF on the lift and drag coefficients of a DU91W(2)250 airfoil was presented in the work of Aramendia et al. []. As can be observed in Table 2, the airfoil DU91W(2)250 corresponds to Stations 8 and 9 of the WTBs of the NREL 5-MW reference wind turbine.

Table 2.
Distribution of the airfoils in the wind turbine blades (WTBs) of the NREL 5-MW reference wind turbine [].
In the analysis carried out in this paper, an ANN has been trained to store the data corresponding to the effect of the GFs in the lift and drag coefficients of the DU91W(2)250 airfoil. These data were previously calculated via computational simulations by Aramendia et al. []. The Reynolds number of the simulations was set to 2 × 10⁶ and the 3D effects behind the GFs were not been taken into account, i.e., 2D simulations were conducted. The ANN was conceived to serve as a database to its posterior access during the operation of the AGF flow control strategy. The DU91W(2)250 airfoil was present in two different stations of the NREL 5-MW reference wind turbine, located at 28.15 m and 32.25 m of the root of the WTB, respectively. Many advantages are associated with the utilization of an ANN as a database to store CFD data. First, a correct training process of the ANN enables the accurate modeling of highly non-linear shapes of the input data and storage of this as a continuous function. In contrast, traditional look-up tables would require a very large amount of data and considerably long arrays to present a result similar to that of the ANN. As a result, the management of data is considerably reduced during operation. In addition, the use of an ANN allows the performance of continuous training processes of the neural network with data measured during operation and automatic learning from real measured data. Finally, the use of ANN as a database allows simple access to the data stored in it.
The selected topology for the ANN designed was an MLP-BP with two inputs (the AoA (°) and the GF length (%)) and two outputs (the lift coefficient CL (-)and the lift-to-drag ratio CL/ CD (-)), as shown in Figure 3.

Figure 3.
Artificial neural network (ANN) based Gurney flaps (GF) database.
The MLP-BP neural network designed to store the CFD data necessary for the AGF flow control strategy presented three different neuron layers: one input layer with two neurons, one hidden layer consisting of 20 neurons, and one output layer with two neurons. The training of the MLP-BP was carried out with a dataset of 390 tuples obtained by CFD simulations, as seen in Figure 4. A total of 195 of the data tuples selected for the training process of the ANN corresponded to data that modeled the effect of different GFs on the lift coefficient CL (-) of the airfoil, and 195 corresponded to data that modeled the effect of different GFs on the lift-to-drag ratio CL/CD (-). The distribution of the data for the training process of the MLP-BP was configured to 90% of the data for the training, 5% for the validation, and 5% for the test. The gradient descent was selected as the learning algorithm of the ANN, and the initial learning ratio µ of the training process was defined as 10−25.
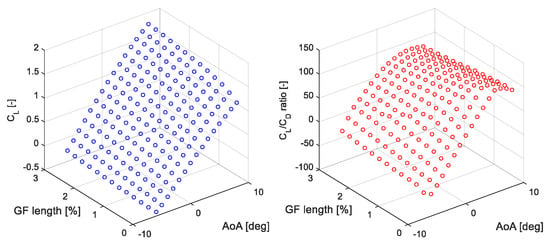
Figure 4.
Training input data of the multilayer perceptron with back propagation (MLP-BP).
The training process of the ANN was completed with a correlation coefficient of 0.99984 in the test. In the same way, a value of 0.172 was obtained for the mean squared error (MSE) associated with the performance of the MLP-BP neural network training process. Both values are preliminary indicators of a correct training process and show the accuracy of the ANN for storing the data corresponding to the CFD simulations. The output signals of the MLP-BP neural network are represented in Figure 5.
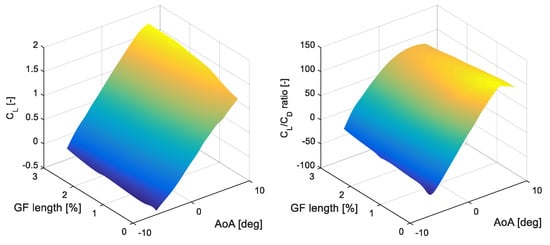
Figure 5.
Output of the MLP-BP.
In order to evaluate the reliability of the ANN for use as the GF database during the operation of the AGF control strategy, a comparison between the input CFD data and the output data of the ANN for different values of the AoA (°) are presented in Figure 6 and Figure 7. The diagrams of Figure 6 correspond to the lift coefficient CL (-) and diagrams of Figure 7 correspond to the lift-to-drag ratio CL/CD (-).
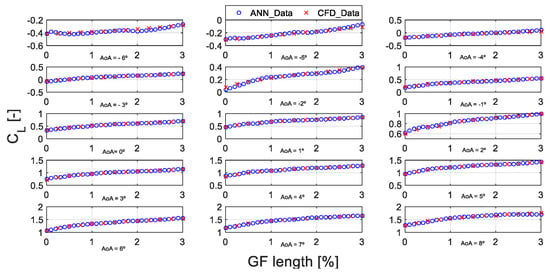
Figure 6.
Comparison between the computational fluid dynamics (CFD) and the ANN lift coefficient CL (-) data. Angle of attack (AoA) = −6:1:8.
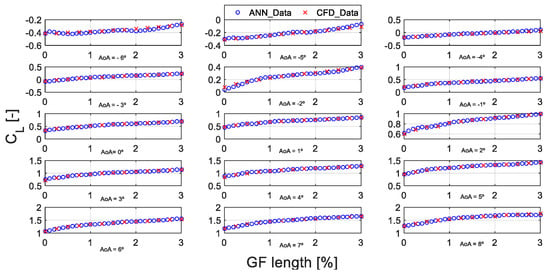
Figure 7.
Comparison between the CFD and the ANN lift-to-drag ratio CL/CD (-) data. AoA = −6:1:8.
4. Blade Element Momentum Improvement
BEM is a computationally economical algorithm to evaluate the aerodynamic performance of a wind turbine and calculate its power output, as introduced in the work of Fernandez-Gamiz et al. []. The BEM code developed by Fernandez-Gamiz et al. [] is based on the iterative numerical equations, the Prandtl’s tip loss correction factor, and the Glauert correction presented by Hansen et al. []. This code has been taken as the basis for the development of the improved BEM algorithm proposed in this paper.
In contrast to the conventional approach to GF-based flow control strategies, in which the length of the GFs is constant, the AGF flow control technique introduced in this paper proposes a dynamic actuation of the GFs placed on the surface of the WTBs in order to adapt to the fast-varying incoming wind characteristics and achieve an optimal operation of the system. A double objective is pursued with the application of the AGF strategy in the control system of a wind turbine. On the one hand, the efficiency of a wind turbine when the power is lower than its rated value is dependent on the AoA of the incoming wind. The pitch system of the wind turbine is responsible for adapting this value to its optimal value. Nevertheless, some factors, such as the variation of the incoming wind angle or a wind gust that needs to be alleviated, can cause a deviation from the optimal AoA. Consequently, during the time response of the pitch system, the efficiency of the operation of the wind turbine is considerably reduced. The AGF control strategy proposed in the present paper has been considered to respond to these variations and optimize the operation of the turbine while the response of the pitch system settles. On the other hand, if static GFs are placed on the WTBs, adaption to variations in the AoA of the incoming wind is not possible, and the bending moment and the mechanical loads in the WTBs can be increased without an improvement in the lift force due to the increment of the drag force. In the same way, the actuation of some control strategies implemented in a wind turbine, such as the individual pitch controller, or the variation in the optimal pitch angle of the WTBs due to the tolerances in its manufacturing process, could cause the passive flow control devices to operate at a non-optimal point. The AGF control strategy has been designed to overcome this problem by optimizing the aerodynamic forces in the WTBs.
With the objective of adapting the BEM algorithm to the AGF flow control technique introduced in this paper, various changes have been introduced in the code. A pipeline of the operating principle of the BEM algorithm in the stations corresponding to the DU91W(2)250 airfoil developed for the present analysis is shown in Figure 8.
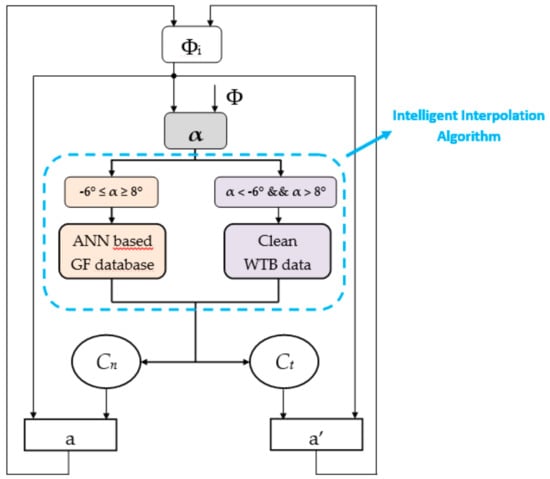
Figure 8.
Pipeline of the improved blade element momentum (BEM) algorithm in the stations corresponding to the DU91W(2)250 airfoil.
Figure 8 shows the development (remarked with a dashed blue line) introduced to the BEM algorithm presented by Fernandiz-Gamiz et al. []. This development affects the source of the lift coefficient CL (-) and the drag coefficient CD (-) values related to the DU91W(2)250 airfoils of the WTB. After the calculation of the AoA, if this value is between the range in which the GF affects the aerodynamic performance of the WTB, i.e., , access to the ANN-based GF database is performed, and the values of the optimal aerodynamic coefficients are captured. Nevertheless, if the value of the AoA is outside the range , the aerodynamic coefficient values of a clean WTB are considered.
When the ANN-based GF database was accessed, in order to optimize the aerodynamic performance of the WTB, a maximum search algorithm was executed to find the value of the GF length (%) that maximizes the value of the lift-to-drag ratio CL/CD (-). Once the optimal value of the GF length (%) was found, the correspondent values of the optimal lift coefficient CL (-) and the optimal drag coefficient CD (-) were extracted. A pseudocode of the maximum search algorithm developed to find the optimal value of the GF length (%) and extract the correspondent aerodynamic coefficients is presented in Figure 9.
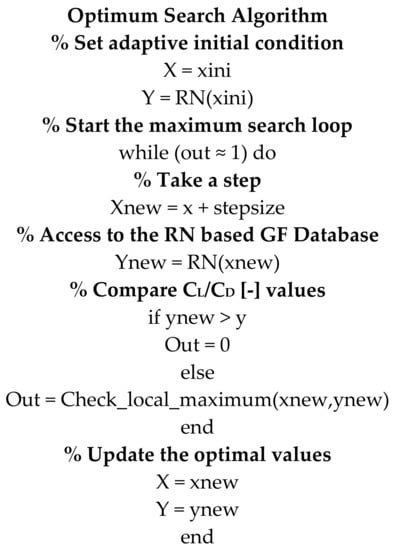
Figure 9.
Pseudocode of the maximum search algorithm.
Since the maximum search algorithm of the AGF flow control strategy is considered to be executed in real time and the fast dynamics of the incoming wind demand a reasonably quick response of the control strategy, one important aspect of it is to guarantee a low convergence time to ensure an adequate performance of the AGF strategy. In order to guarantee a fast convergence time of the maximum search algorithm, an adaptive approach to the initial values of the algorithm was proposed in the present paper. The initial value of the maximum search algorithm was adapted depending on the value of the AoA. In this way, the time necessary to reach the optimum value of the lift-to-drag ratio CL/ CD (-) was considerably reduced. Furthermore, in order to avoid the system getting stuck in a local optimum, a function to evaluate the surroundings of the potential maximum was included.
The best and the worst case of the convergence time needed by the maximum search algorithm run in the commercial Software Matlab in a PC is presented in Table 3. As can be observed in the values presented in this table, the worst case is reasonable in comparison to the 1 s period of the input wind speed values. Moreover, these values are considered to be smaller when the execution is performed in a real-time processor devoted to the control of the wind turbine.

Table 3.
Performance analysis of the maximum search algorithm.
A graphical illustration of the performance of the maximum search algorithm for both the cases presented in Table 3 is shown in Figure 10 and Figure 11.
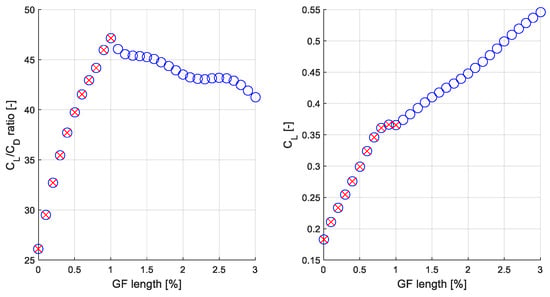
Figure 10.
Maximum CL/CD (-) search algorithm for AoA = −1°. ANN values in blue circles. Maximum search algorithm steps in red crosses.
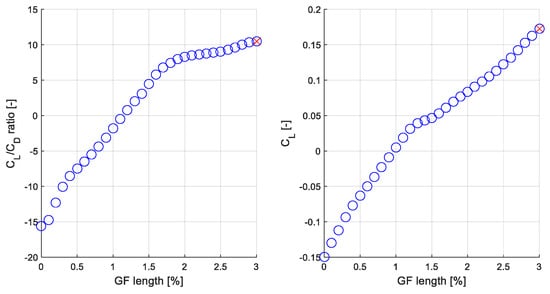
Figure 11.
Maximum CL/ CD (-) search algorithm for AoA = −3.5°. ANN values in blue circles. Maximum search algorithm steps in red crosses.
The results represented in Figure 10 and Figure 11 confirm the adequate performance of the maximum search algorithm developed for the AGF flow control strategy introduced in this paper. As already explained, in order to optimize the aerodynamic performance of the WTBs the AGF flow control strategy selects the GF length (%) that maximizes the value of the lift-to-drag ratio CL/CD (-). This value is not necessarily the one that maximizes the value of the lift coefficient CL (-), as can be observed in Figure 10. The convergence time values presented in Table 3 ensure a reasonable response time of the algorithm and prove its real-time applicability in the control system of a wind turbine. If the results illustrated in Figure 10 and Figure 11 are analyzed, it is to be noted that the adaptive initial condition technique designed for the maximum search algorithm plays an important role in the reduction of the execution time needed to find the value of the ratio CL/CD (-).
5. Results and Discussion
As explained in the introduction, flow control devices are designed and implemented in WTBs to improve their aerodynamic performance. The effect of implementing flow control devices in a WTB is usually the enhancement of the lift force that causes the rotation of the wind turbine rotor. As a result, the operation and efficiency of the wind turbine is improved. It must be noted that if an inadequate design of the GF is accomplished, the drag force in WTB can be incremented.
The AGF flow control strategy introduced in this paper tried to overcome the problems related to the static nature of the GF technology and improve the operation of the wind turbine by achieving a fast response of the wind turbine (<1 s), that allows for adaption to externally-forced quick variations in the operating point of the system. As a result, an optimized operation and increased efficiency of the wind turbine in comparison to passive flow control device technology are achieved.
Two explicit exponents of the operation efficiency of the wind turbine are the power coefficient CP (-) and the power curve of the turbine. The power curve represents the power the wind turbine generates for a determined value of a wind speed in the range inside the cut-in wind speed and the cut-out wind speed (see Figure 12b). The operation of the wind turbine can be divided into two zones: the partial power zone, in which the system is designed to maximize the power generated according to the power absorbed from the wind, and the full power zone, in which the system absorbs more power from the wind than it is designed to generate, and an optimization is no longer needed. The power coefficient CP (-) is a great indicator of the efficiency of the wind turbine, since it indicates the relationship between the power generated by the system and the power absorbed from the wind in the partial power zone, where an optimal operation of the wind turbine is desired.
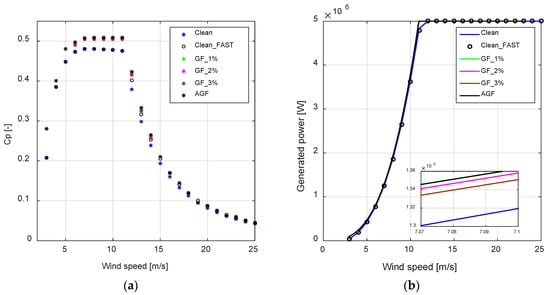
Figure 12.
(a) Power coefficient Cp (-) and (b) power curve comparison for different GF-based flow control solutions.
Aerodynamically steady BEM calculations were performed to analyze the effect of the AGF flow control technique on the aerodynamic behavior of the WTBs, and hence on the operation of the wind turbine. The power coefficient CP (-) (in Figure 12a) and the power curve (in Figure 12b) have been represented to show the results of the BEM calculations.
As can be observed from the diagrams in Figure 12, in comparison to the case of clean WTB (without GFs), the power coefficient CP (-) and the power curve of the wind turbine are improved with the implementation of the GFs. Furthermore, it can be noted that the performance of the passive GF is further improved with the application of the AGF control strategy, achieving an upgraded power coefficient CP (-) and power curve. Finally, the high correspondence between the power coefficient CP (-) and power curves of the case with clean WTBs calculated with BEM and the aeroelastic code FAST v7 must be noted []. This correspondence enables the validation of the use of BEM calculations to model the results of the steady operation of a wind turbine without the use of an aeroelastic code.
After the calculation of the power curve related to each one of the analyzed flow control scenarios, the energy generation of the wind turbine during the time for which the real wind data series have been measured was accomplished. The objective was to numerically evaluate the enhanced performance of the wind turbine with the application of the AGF strategy. To that end, the Weibull distribution of the real wind speed data of Salt Lake City, Utah, USA [], calculated in Section 2 of this document, and the power curve of each one of the analyzed scenarios were used to compute the energy generated by the turbine during the analyzed time interval, according to the work of Schramm et al. [].
The value of the energy generated by the wind turbine and the mean values of the bending moments for each one of the analyzed scenarios are listed in Table 4.

Table 4.
Generated energy and bending moment comparison.
According to the results of the steady BEM calculations presented in Table 4, all the analyzed flow control technologies were observed to increase the energy generation of the 5-MW reference wind turbine with the real wind speed measurements obtained from the meteorological station in Salt Lake City, Utah, USA. If the results of the generated energy are analyzed in detail, it can be observed that the AGF method overcomes the enhancement achieved by the flow control cases corresponding to passive GFs. The best case corresponds to the AGF control strategy implemented in the DU91W(2)25 airfoils of the WTBs of the NREL 5-MW reference wind turbine. The generated energy improvement achieved with a static GF with a length of 1% of the chord of the corresponding airfoil is very close to the one achieved by the AGF strategy. This negligible energy gain is associated with the steady calculations of the BEM analysis in this paper and it is expected to grow bigger with an unsteady analysis of the wind turbine, in which the transient conditions are considered. Nevertheless, the bending moment at the root of the WTB was considerably reduced with the implementation of the AGF strategy.
In fact, another important concept that can be observed in the results presented in Table 4 is that the increase in the energy generated by the system is achieved at the cost of an increment of the bending moment in WTBs. The increased bending moment will generate bigger mechanical loads in the elements of the turbine. If the results of the bending moment are observed in detail it can be noted that the AGF control strategy introduced in this paper presents the slightest bending moment increase in comparison with the clean WTB. Among the static GFs, the bending moment is increased with the utilization of bigger GFs.
6. Conclusions
In the current work, a novel flow control strategy referred as AGF was proposed to improve the performance of the wind turbines in cases of fast variations of the operating point caused by fast variations in the incoming wind. Conventionally, the adaption of wind turbine blades to the incoming wind is achieved with the pitch angle control of the WTBs. Nevertheless, even if the dynamics of the pitch actuator are fast in comparison to the other mechanical actuator of a wind turbine (the yaw actuator), wind speed variations could be too fast to get a response. In order to overcome that problem and adapt the operation of the wind turbine while the response of the pitch system settles, an AGF control strategy based on GFs dynamically actuated by means of pneumatic mechanisms was proposed.
In order to simulate the effect of the AGF control strategy on the operation of a wind turbine, the BEM algorithm was extended to include the effect of the dynamically actuated GFs. The database to store the information related to the GFs was implemented in an MLP-BP neural network that enabled an accurate model of irregular surfaces, on-line updates of the information, and easy access to the stored data. Additionally, an online maximum search algorithm was designed to perform a real-time search of the GF length (%) that maximizes the lift-to-drag ratio CL/CD (-), which optimizes the power the wind turbine absorbs from the incoming wind.
The results obtained, based on steady calculations of the BEM analysis, show an important enhancement of the energy produced by the wind turbine with the application of the AGF strategy. The AGF strategy introduced in this paper overcomes the value of the energy the system produces in comparison to clean WTBs or with the application of passive GFs. Furthermore, the increment of the bending moment at the root of the WTBs with the application of the AGF strategy is considerably reduced in comparison to the application of passive GFs. According to the obtained results, the AGF strategy is considered an adequate control technique to improve the efficiency of wind turbines by optimizing their operation while the pitch system responds to fast input wind gusts. Furthermore, these results, based on steady calculations of the power output of the wind turbine, are considered to be enhanced with the application of the proposed AGF flow control technique during an unsteady analysis of the operation of the turbine, in which the transient periods are not neglected. This further enhancement of the power output during unsteady simulations is considered to be subject to the time scale of the simulation and the correct integration of the AGF strategy in the control system of the wind turbine.
In conclusion, with the implementation of the AGF flow control strategy, the dependence between the aerodynamic performance of the WTBs and the characteristics of the incoming wind (speed (m/s) and AoA (°)) is minimized, since the system is capable of adapting to the external changing scenarios. On the contrary, the performance of a wind turbine with passive GFs will be dependent on the characteristics of the incoming wind, since the system cannot adapt to different scenarios. As a result, the risk of an inadequate aerodynamic performance is structurally minimized with the application of the AGF flow control technique.
Author Contributions
A.S.-A. has developed the Software, the Validation steps and the Original Writing Draft; U.G.-F. and E.Z. have developed the Conceptualization, the Formal Analysis and the Supervision; A.U. and J.M.-R. have collaborated on the Writing-Review & Editing and the Experimental Data Acquisition & Treatment.
Funding
This research was financed by the Government of the Basque Country through the ELKARTEK program and by EHU 12/26 research program of the University of the Basque Country UPV/EHU
Acknowledgments
The authors are grateful to the Foundation VITAL Fundazioa.
Conflicts of Interest
The authors declare no conflict of interest.
Acronyms and Symbols
The following acronyms and symbols are used in this manuscript:
| WTB | Wind turbine blade |
| GF | Gurney flap |
| VG | Vortex generator |
| MT | Microtab |
| AGF | Active Gurney flap |
| AoA | Angle of attack |
| ANN | Artificial neural network |
| BEM | Blade element momentum |
| CFD | Computational fluid dynamics |
| AEP | Annual energy production |
| RL | Reinforcement learning |
| MLP-BP | Multilayer perceptron with back propagation |
| CL | Lift coefficient |
| CD | Drag coefficient |
| CP | Power coefficient |
| Local angle of attack | |
| Flow angle | |
| Ct | Tangential load coefficient |
| Cn | Normal load coefficient |
| a | Axial induction factor |
| a′ | Normal induction factor |
References
- Rosales-Asensio, E.; Borge-Diez, D.; Blanes-Peiro, J.; Perez-Hoyos, A.; Comenar-Santos, A. Review of wind energy technology and associated market and economic conditions in Spain. Renew. Sustain. Energy Rev. 2019, 101, 415–427. [Google Scholar] [CrossRef]
- Li, L.; Yuan, Z.; Gao, Y.; Zhang, X.; Tezdogan, T. Investigation on long-term extreme response of an integrated offshore renewable energy device with a modified environmental contour method. Renew. Energy 2019, 132, 33–42. [Google Scholar] [CrossRef]
- Saenz-Aguirre, A.; Zulueta, E.; Fernandez-Gamiz, U.; Lozano, J.; Lopez-Guede, J.M. Artificial neural network based reinforcement learning for wind turbine yaw control. Energies 2018, 12, 436. [Google Scholar] [CrossRef]
- Astolfi, D.; Castellani, F.; Terzi, L. Wind turbine power curve upgrades. Energies 2018, 11, 1300. [Google Scholar] [CrossRef]
- Terzi, L.; Lombardi, A.; Castellani, F.; Astolfi, D. Innovative methods for wind turbine power curve upgrade assessment. J. Phys. Conf. Ser. 2018, 1102, 012036. [Google Scholar] [CrossRef]
- Astolfi, D.; Castellani, F.; Fravolini, M.; Cascianelli, S.; Terzi, L. Computing the real impact of wind turbine power curve upgrades: a scada-based multivariate linear method and a vortex generator test case. Preprints 2018, 2018060082. [Google Scholar]
- Astolfi, D.; Castellani, F.; Fravolini, M.; Cascianelli, S.; Terzi, L. Precision computation of wind turbine power upgrades: A SCADA-based multivariate linear method and a vortex generator and control optimization test case. J. Energy Resour. Technol. 2019, 141. [Google Scholar] [CrossRef]
- Astolfi, D.; Castellani, F.; Terzi, L. A SCADA data mining method for precision assessment of performance enhancement from aerodynamic optimization of wind turbine blades. J. Phys. Conf. Ser. IOP Pub. 2018, 1037, 032001. [Google Scholar] [CrossRef]
- Astolfi, D.; Castellani, F.; Berno, F.; Terzi, L. Numerical and experimental methods for the assessment of wind turbine control upgrades. Appl. Sci. 2018, 8, 2639. [Google Scholar] [CrossRef]
- Lee, G.; Ding, Y.; Xie, L.; Genton, M.G. A kernel plus method for quantifying wind turbine performance upgrades. Wind Energy 2015, 18, 1207–1219. [Google Scholar] [CrossRef]
- Holst, D.; Bach, A.B.; Nayeri, C.N.; Paschereit, C.O.; Pechlivanoglou, G. Wake analysis of a finite width gurney flap. J. Eng. Gas Turbines Power-Trans. ASME 2016, 138, 062602. [Google Scholar] [CrossRef]
- Hwangbo, H.; Ding, Y.; Eisele, O.; Weinzierl, G.; Lang, U.; Pechlivanoglou, G. Quantifying the effect of vortex generator installation on wind power production: An academia-industry case study. Renew. Energy 2017, 113, 1589–1597. [Google Scholar] [CrossRef]
- Fernandez-Gamiz, U.; Zulueta, E.; Boyano, A.; Ansoategui, I.; Uriarte, I. Five megawatt wind turbine power output improvements by passive flow control devices. Energies 2017, 10, 742. [Google Scholar] [CrossRef]
- Jonkman, J.M.; Butterfield, S.; Musial, W.; Scott, G. Definition of a 5MW Reference Wind Turbine for Offshore System Development; National Renewable Energy Laboratory (NREL): Lakewood, CO, USA, 2009.
- Aramendia-Iradi, I.; Fernandez-Gamiz, U.; Sancho-Saiz, J.; Zulueta-Guerrero, E. State of the art of active and passive flow control devices for wind turbines. DYNA 2016, 91, 512–516. [Google Scholar]
- Aramendia, I.; Fernandez-Gamiz, U.; Ramos-Hernanz, J.; Sancho, J.; Lopez-Guede, J.; Zulueta, E. Flow control devices for wind turbines. In Energy Harvesting and Energy Efficiency: Technology, Methods, and Applications; Bizon, N., Mahdavi Tabatabaei, N., Blaabjerg, F., Kurt, E., Eds.; Springer International Publishing: Cham, Switzerland, 2017; pp. 629–655. [Google Scholar]
- Fernandez-Gamiz, U.; Gomez-Marmol, M.; Chacon-Rebollo, T. Computational modeling of gurney flaps and microtabs by pod method. Energies 2018, 11, 2091. [Google Scholar] [CrossRef]
- Martinez-Filgueira, P.; Fernandez-Gamiz, U.; Zulueta, E.; Errasti, I.; Fernandez-Gauna, B. Parametric study of low-profile vortex generators. Int. J. Hydrog. Energy 2017, 42, 17700–17712. [Google Scholar] [CrossRef]
- Aramendia, I.; Fernandez-Gamiz, U.; Zulueta, E.; Saenz-Aguirre, A.; Teso, D. Parametric study of a gurney flap implementation in a du91w(2)250 airfoil. Energies 2019, 12, 294. [Google Scholar] [CrossRef]
- Pastrikakis, V.A.; Steijl, R.; Barakos, G.N. Effect of active Gurney flaps on overall helicopter flight envelope. Aeronaut. J. 2016, 120, 1230–1261. [Google Scholar] [CrossRef]
- Saenz-Aguirre, A.; Fernandez-Resines, S.; Aramendia, I.; Fernandez-Gamiz, U.; Zulueta, E.; Lopez-Guede, J.M.; Sancho, J. 5-MW wind turbine annual energy production improvement by flow control devices. Proceedings 2018, 2, 1452. [Google Scholar] [CrossRef]
- Chow, R.; van Dam, C.P. On the temporal response of active load control devices. Wind Energy 2010, 13, 135–149. [Google Scholar] [CrossRef]
- Van Dam, C.P.; Chow, R.; Zayas, J.R.; Berg, D.A. Computational investigations of small deploying tabs and flaps for aerodynamic load control. In Journal of Physics Conference Series: The Science of Making Torque from Wind; IOP Publishing: Bristol, UK, 2007; p. 75. [Google Scholar]
- Jeffrey, D.; Zhang, X.; Hurst, D.W. Aerodynamics of Gurney flaps on a single-element high-lift wing. J. Aircr. 2000, 37, 295–301. [Google Scholar] [CrossRef]
- Wang, J.J.; Li, Y.C.; Choi, K. Gurney flap—Lift enhancement, mechanisms and applications. Prog. Aerosp. Sci. 2008, 44, 22–47. [Google Scholar] [CrossRef]
- Shukla, V.; Kaviti, A.K. Performance evaluation of profile modifications on straight-bladed vertical axis wind turbine by energy and Spalart Allmaras models. Energy 2017, 126, 766–795. [Google Scholar] [CrossRef]
- Luo, H.; Hu, Z.; Zhang, H.; Chen, H. Coordinated active power control strategy for deloaded wind turbines to improve regulation performance in AGC. IEEE Trans. Power Syst. 2019, 34, 98–108. [Google Scholar] [CrossRef]
- Blaylock, M.; Chow, R.; Cooperman, A.; van Dam, C.P. Comparison of pneumatic jets and tabs for Active Aerodynamic Load Control. Wind Energy 2014, 17, 1365–1384. [Google Scholar] [CrossRef]
- Tsai, K.; Pan, C.; Cooperman, A.M.; Johnson, S.J.; van Dam, C.P. An innovative design of a microtab deployment mechanism for active aerodynamic load control. Energies 2015, 8, 5885–5897. [Google Scholar] [CrossRef]
- Gomez Gonzalez, A.; Enevoldsen, P.B.; Akay, B.; Barlas, T.K.; Fischer, A.; Aa Madsen, H. Experimental and numerical validation of active flaps for wind turbine blades. J. Phys. Conf. Ser. 2018, 1037, 022039. [Google Scholar] [CrossRef]
- Woodgate, M.A.; Pastrikakis, V.A.; Barakos, G.N. Rotor computations with active gurney flaps. In Advances in Fluid-Structure Interaction. Notes on Numerical Fluid Mechanics and Multidisciplinary Design; Braza, M., Bottaro, A., Thompson, M., Eds.; Springer: Cham, Switzerland, 2016; Volume 133. [Google Scholar]
- Timmer, W.; van Rooij, R. Summary of the Delft University wind turbine dedicated airfoils. J. Sol. Energy Eng. Trans. Asme 2003, 125, 488–496. [Google Scholar] [CrossRef]
- Usman, M.; Hanif, A.; Kim, I.; Jung, H. Experimental validation of a novel piezoelectric energy harvesting system employing wake galloping phenomenon for a broad wind spectrum. Energy 2018, 153, 882–889. [Google Scholar] [CrossRef]
- Parkinson, G.V.; Cook, N.J. Blockage tolerance of a boundary-layer wind tunnel. J. Wind Eng. Ind. Aerodyn. 1992, 42, 873–884. [Google Scholar] [CrossRef]
- UCAR/NCAR—Earth Observing Laboratory. 2013. Available online: https://doi.org/10.5065/D6QV3JRP (accessed on 15 July 2018).
- Young, J.S. Investigation of Wintertime Cold-Air Pools and Aerosol Layers in the Salt Lake Valley Using a Lidar Ceilometer; The University of Utah: Salt Lake City, UT, USA, 2013. [Google Scholar]
- Foster, C.S. Simulation of a Cold-Air Pool in Utah’s Salt Lake Valley; The University of Utah: Salt Lake City, UT, USA, 2015. [Google Scholar]
- Lareau, N.P.; Horel, J.D. Dynamically induced displacements of a persistent cold-air pool. Bound. Layer Metereol. 2015, 154, 291–316. [Google Scholar] [CrossRef]
- Li, X.; Zhu, G.; Gao, W.; Sun, H.; Liu, G.; Wu, Y.; Shi, Y. A novel ultrasonic array signal processing scheme for wind measurement. ISA Trans. 2018, 81, 259–269. [Google Scholar] [CrossRef] [PubMed]
- Zhou, X.; Yang, Q.; Zhen, X.; Li, Y.; Hao, G.; Shen, H.; Gao, T.; Sun, Y.; Zheng, N. Recovery of the three-dimensional wind and sonic temperature data from a physically deformed sonic anemometer. Atmos. Measur. Tech. 2018, 11, 5981–6002. [Google Scholar] [CrossRef]
- Storms, B.L.; Jang, C.S. Lift enhancement of an airfoil using a gurney flap and vortex generators. J. Aircr. 1994, 31, 542–547. [Google Scholar] [CrossRef]
- Hansen, M.O.L.; Sorensen, J.N.; Voutsinas, S.; Sorensen, N.; Madsen, H.A. State of the art in wind turbine aerodynamics and aeroelasticity. Prog. Aerosp. Sci. 2006, 42, 285–330. [Google Scholar] [CrossRef]
- NREL NWTC FAST Version 7. Available online: https://nwtc.nrel.gov/FAST7/ (accessed on 21 October 2018).
- Schramm, M.; Rahimi, H.; Stoevesandt, B.; Tangager, K. The influence of eroded blades on wind turbine performance using numerical simulations. Energies 2017, 10, 1420. [Google Scholar] [CrossRef]
© 2019 by the authors. Licensee MDPI, Basel, Switzerland. This article is an open access article distributed under the terms and conditions of the Creative Commons Attribution (CC BY) license (http://creativecommons.org/licenses/by/4.0/).