Exploring the Spatial Pattern and Influencing Factors of Land Carrying Capacity in Wuhan


Abstract
:1. Introduction
2. Data and Methodologies
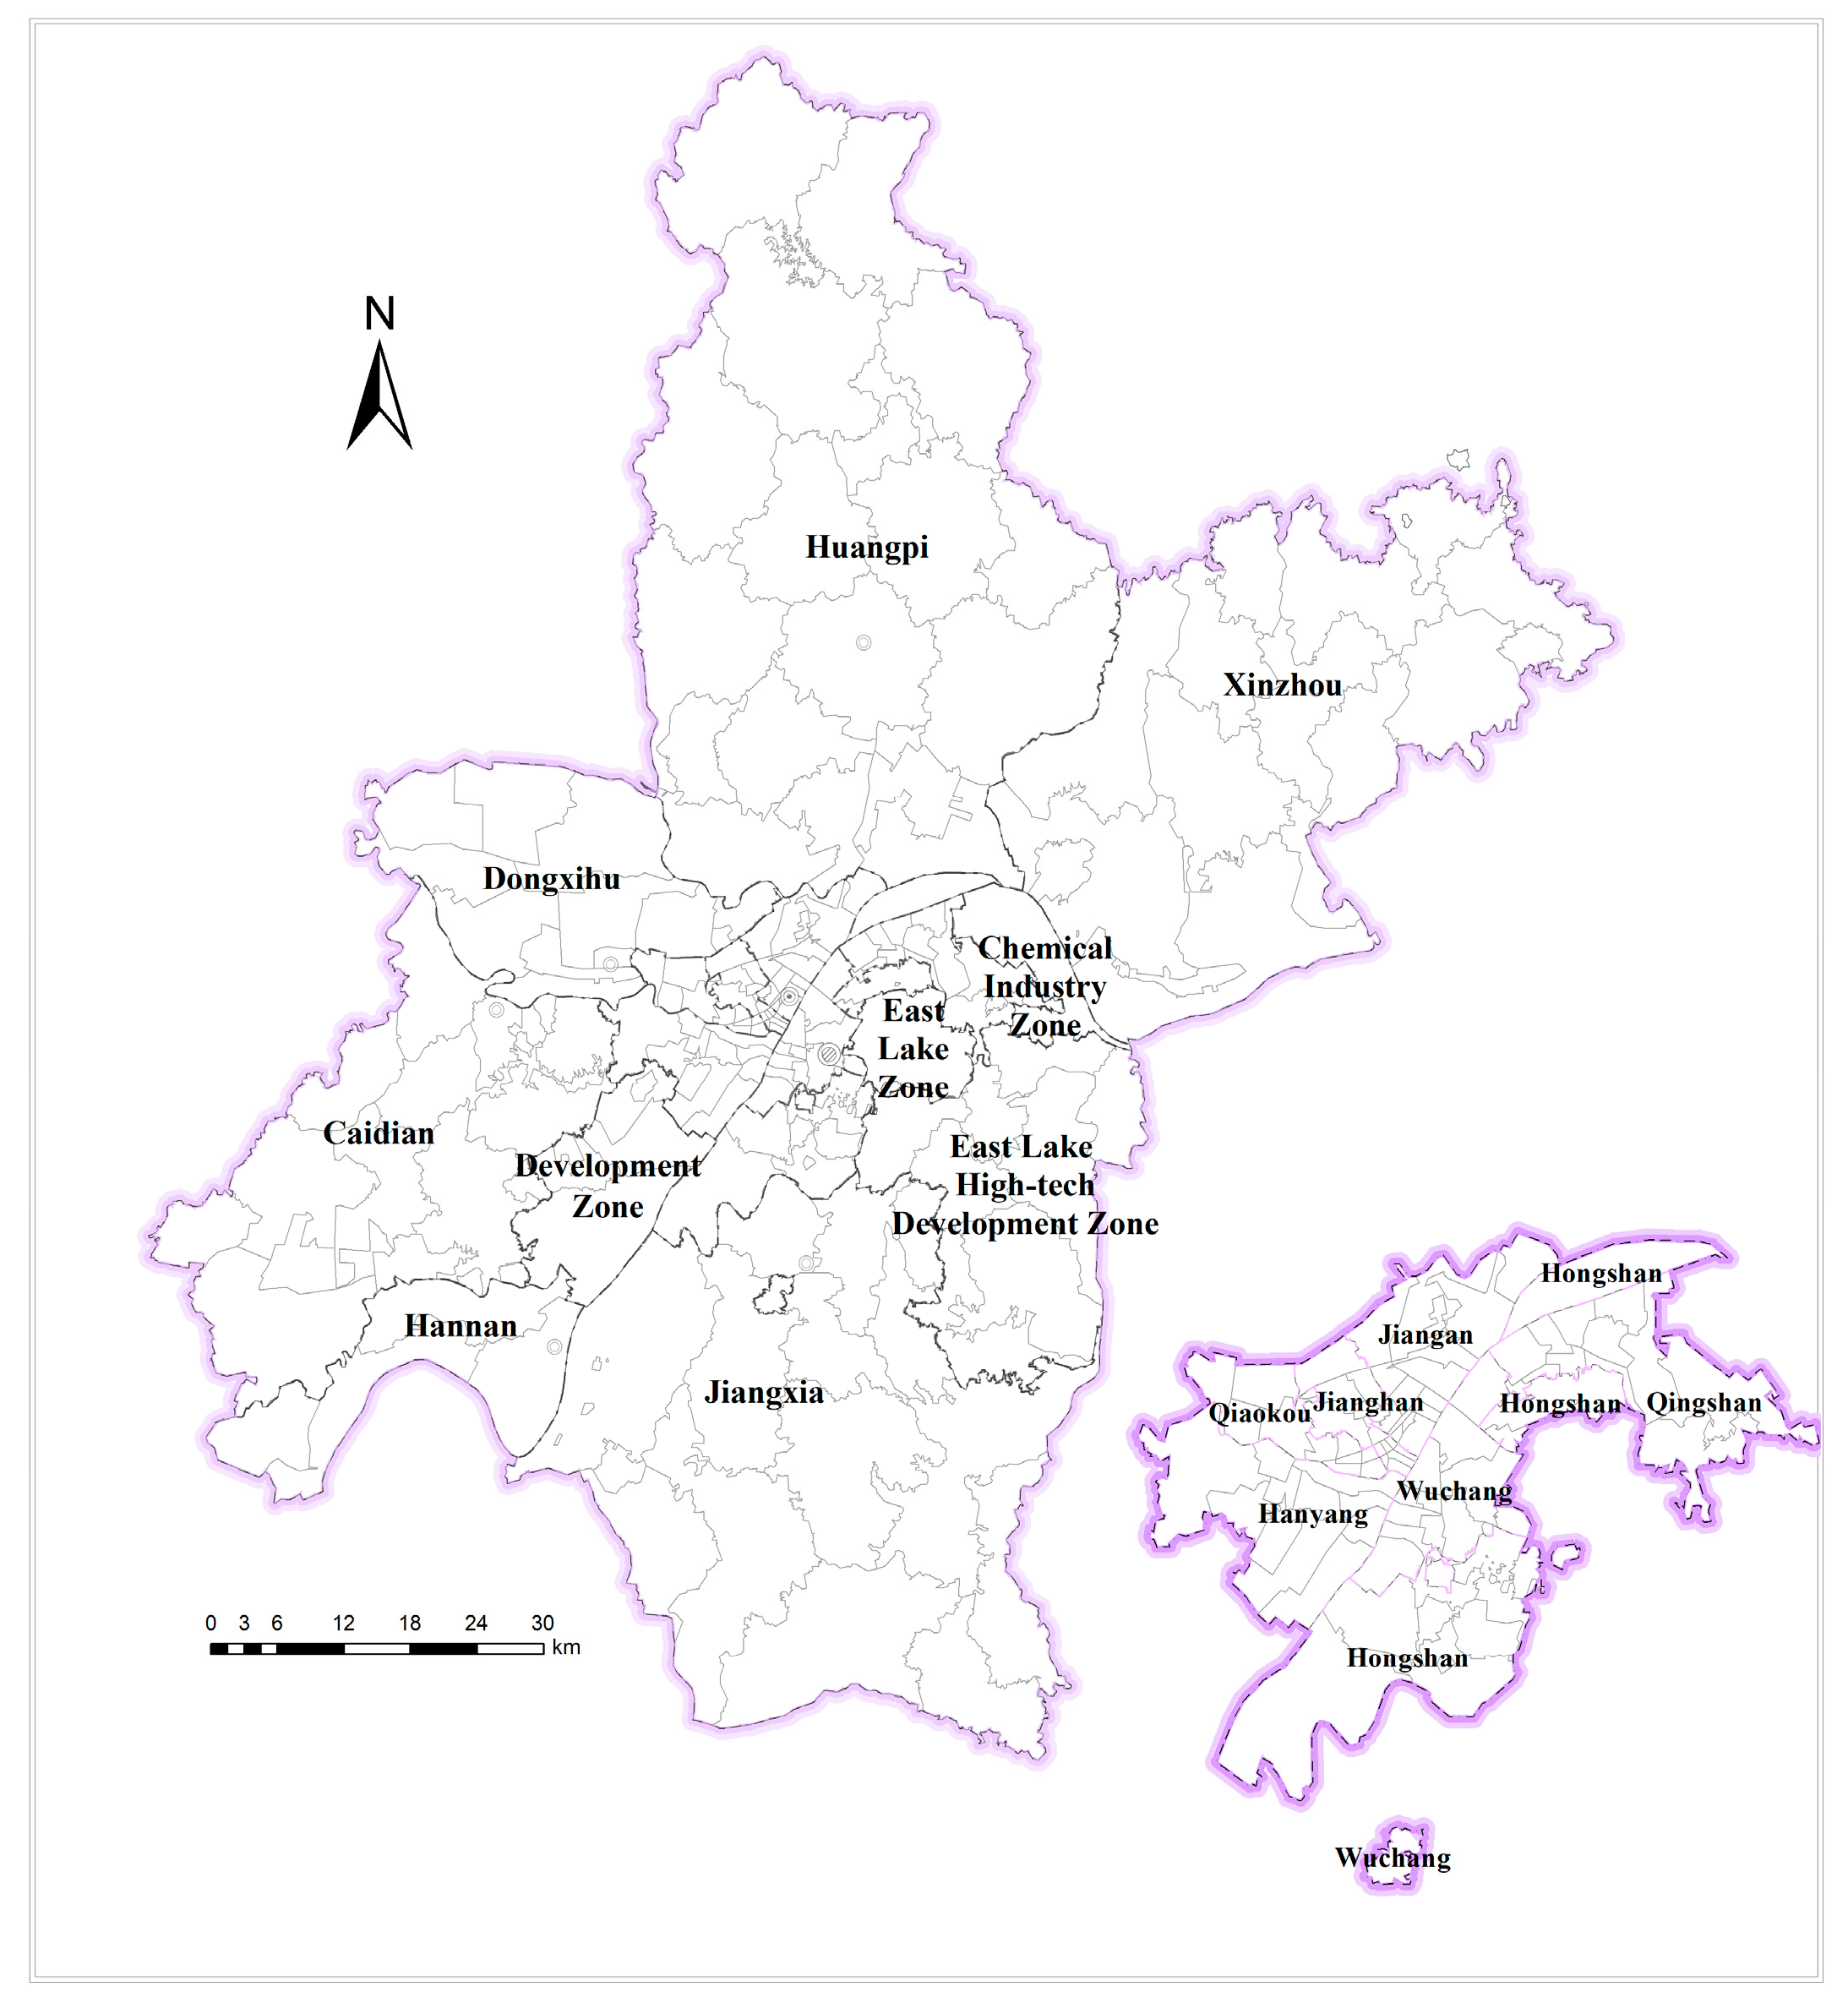
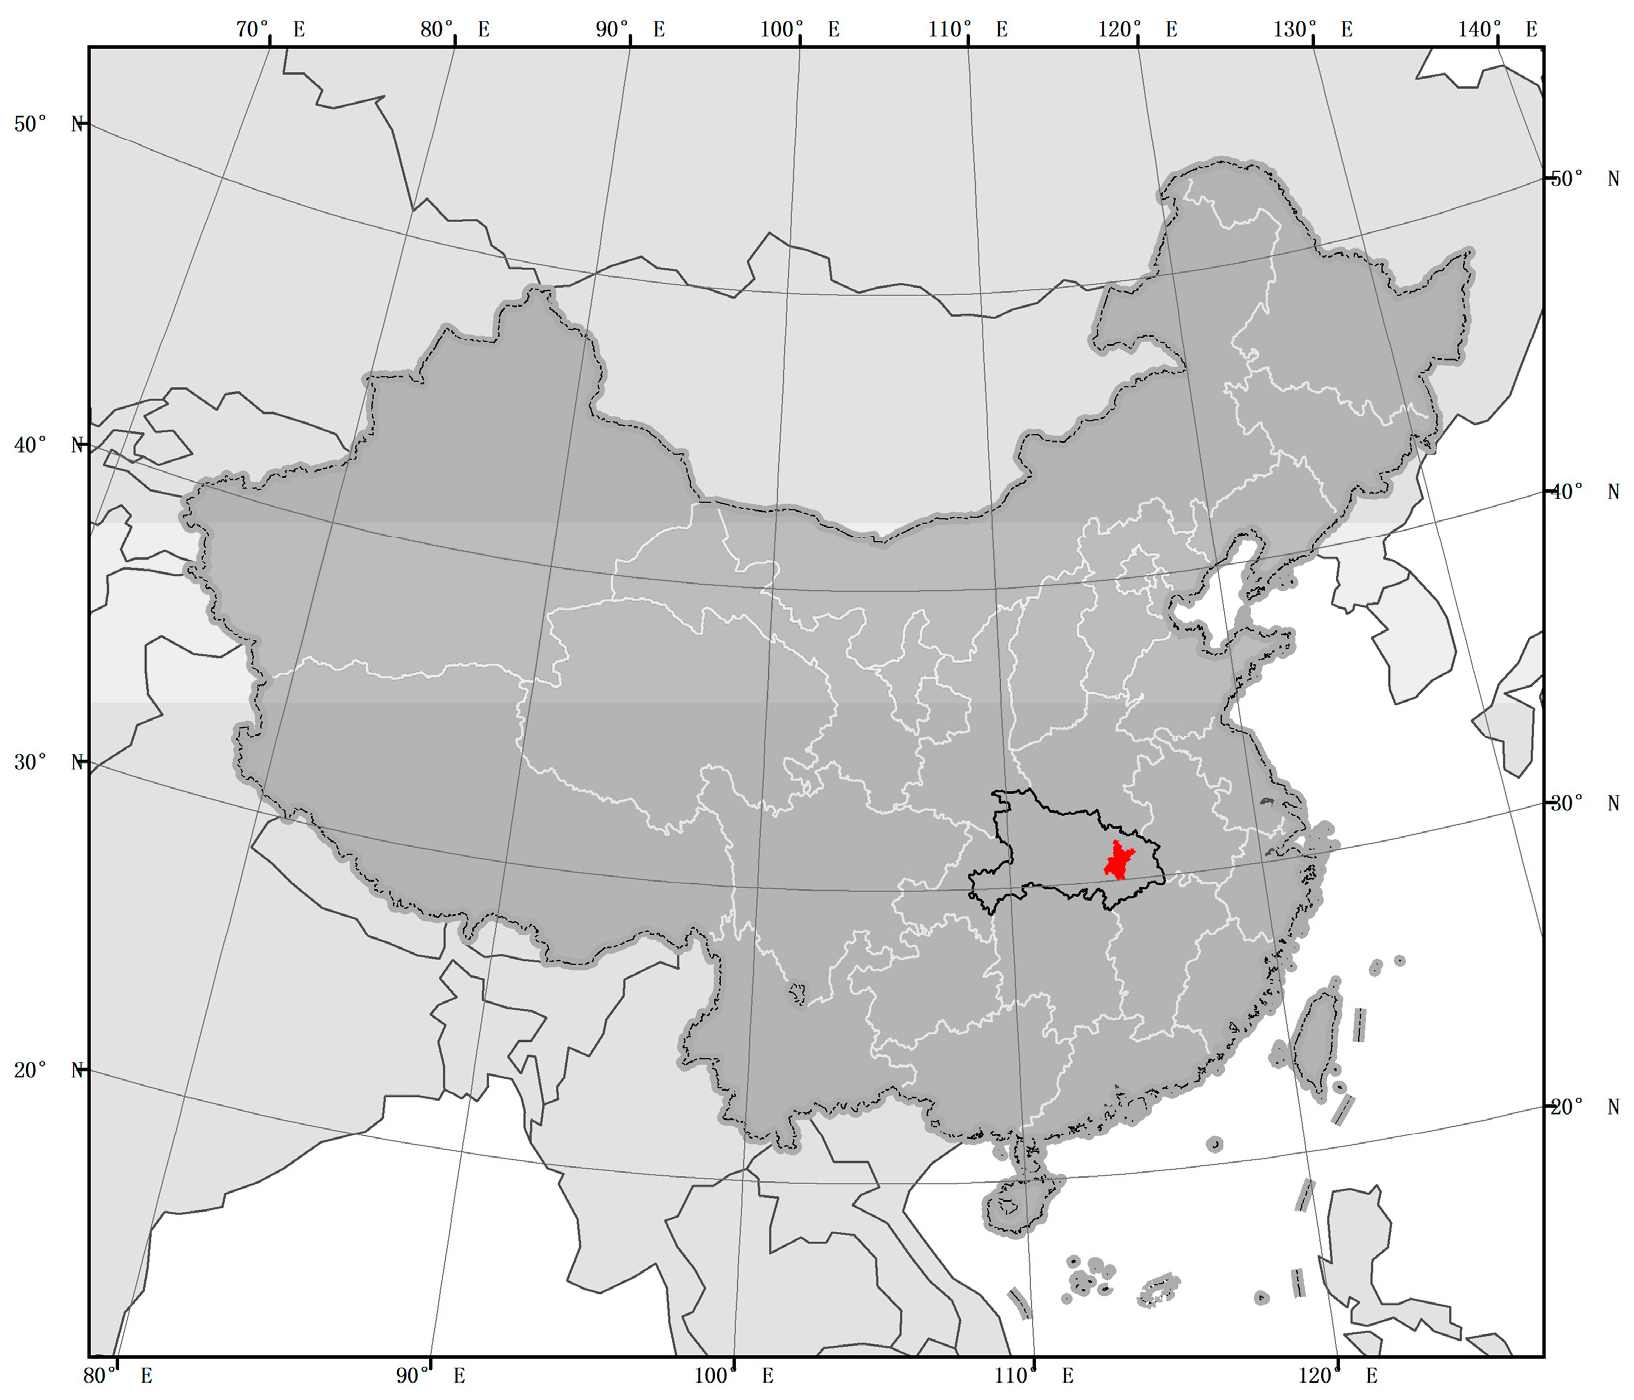
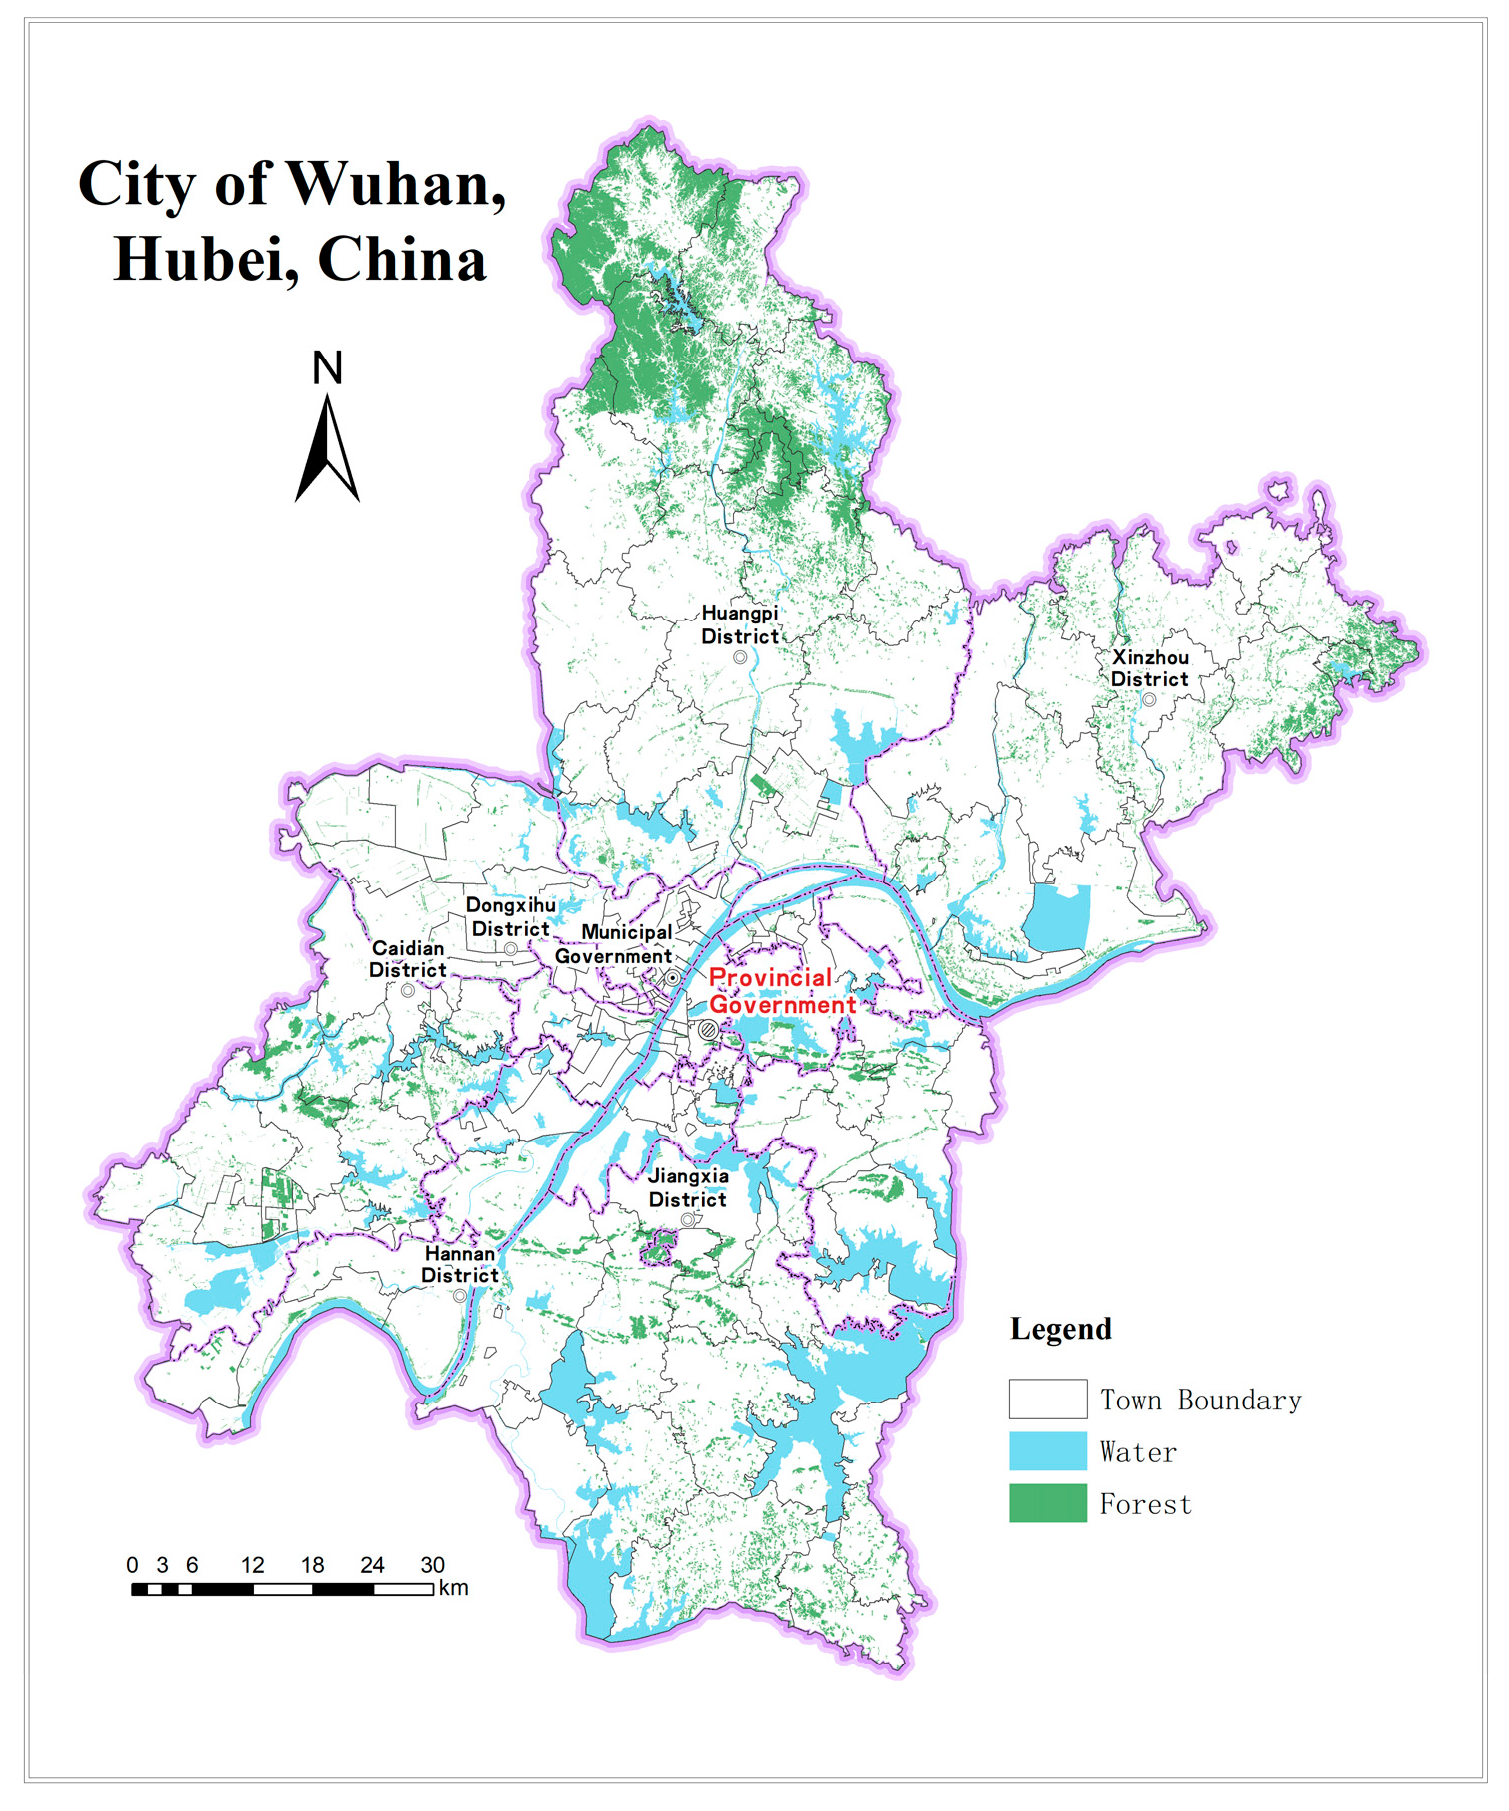
2.1. Study Area
2.2. Data Geo-Processing and Influencing Factors
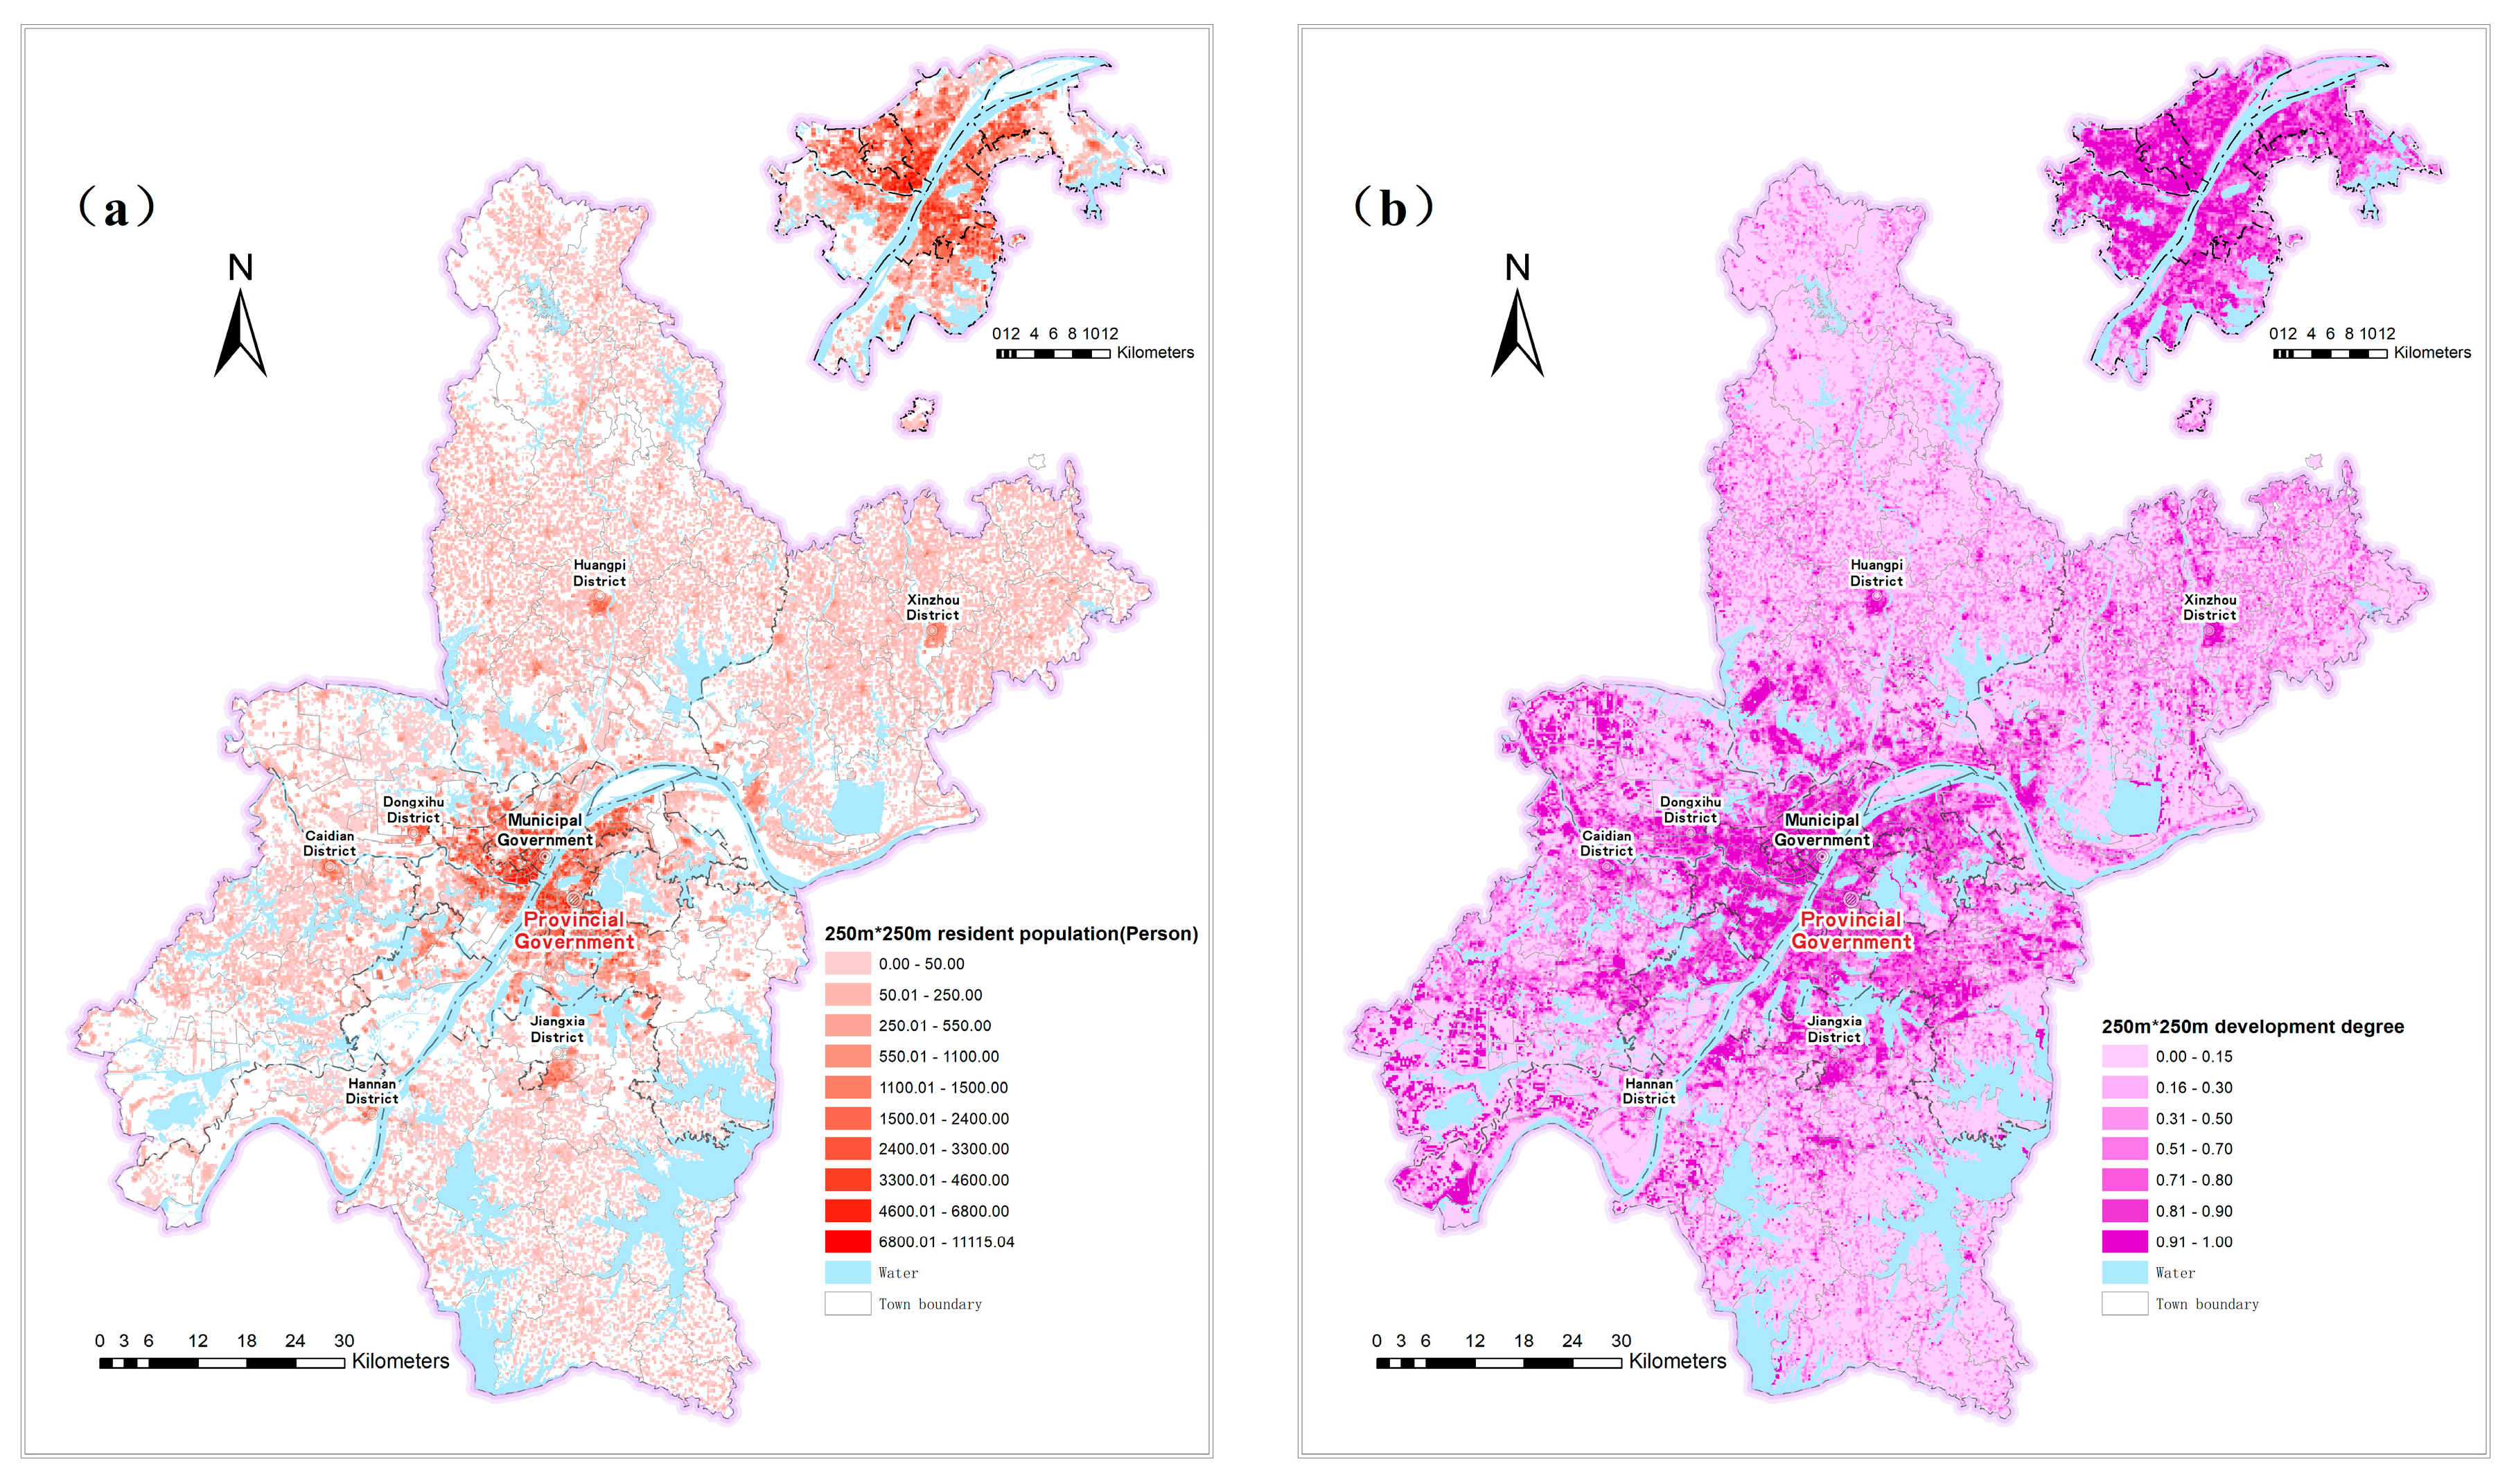
2.2.1. Data Geo-Processing
2.2.2. Influencing Factors
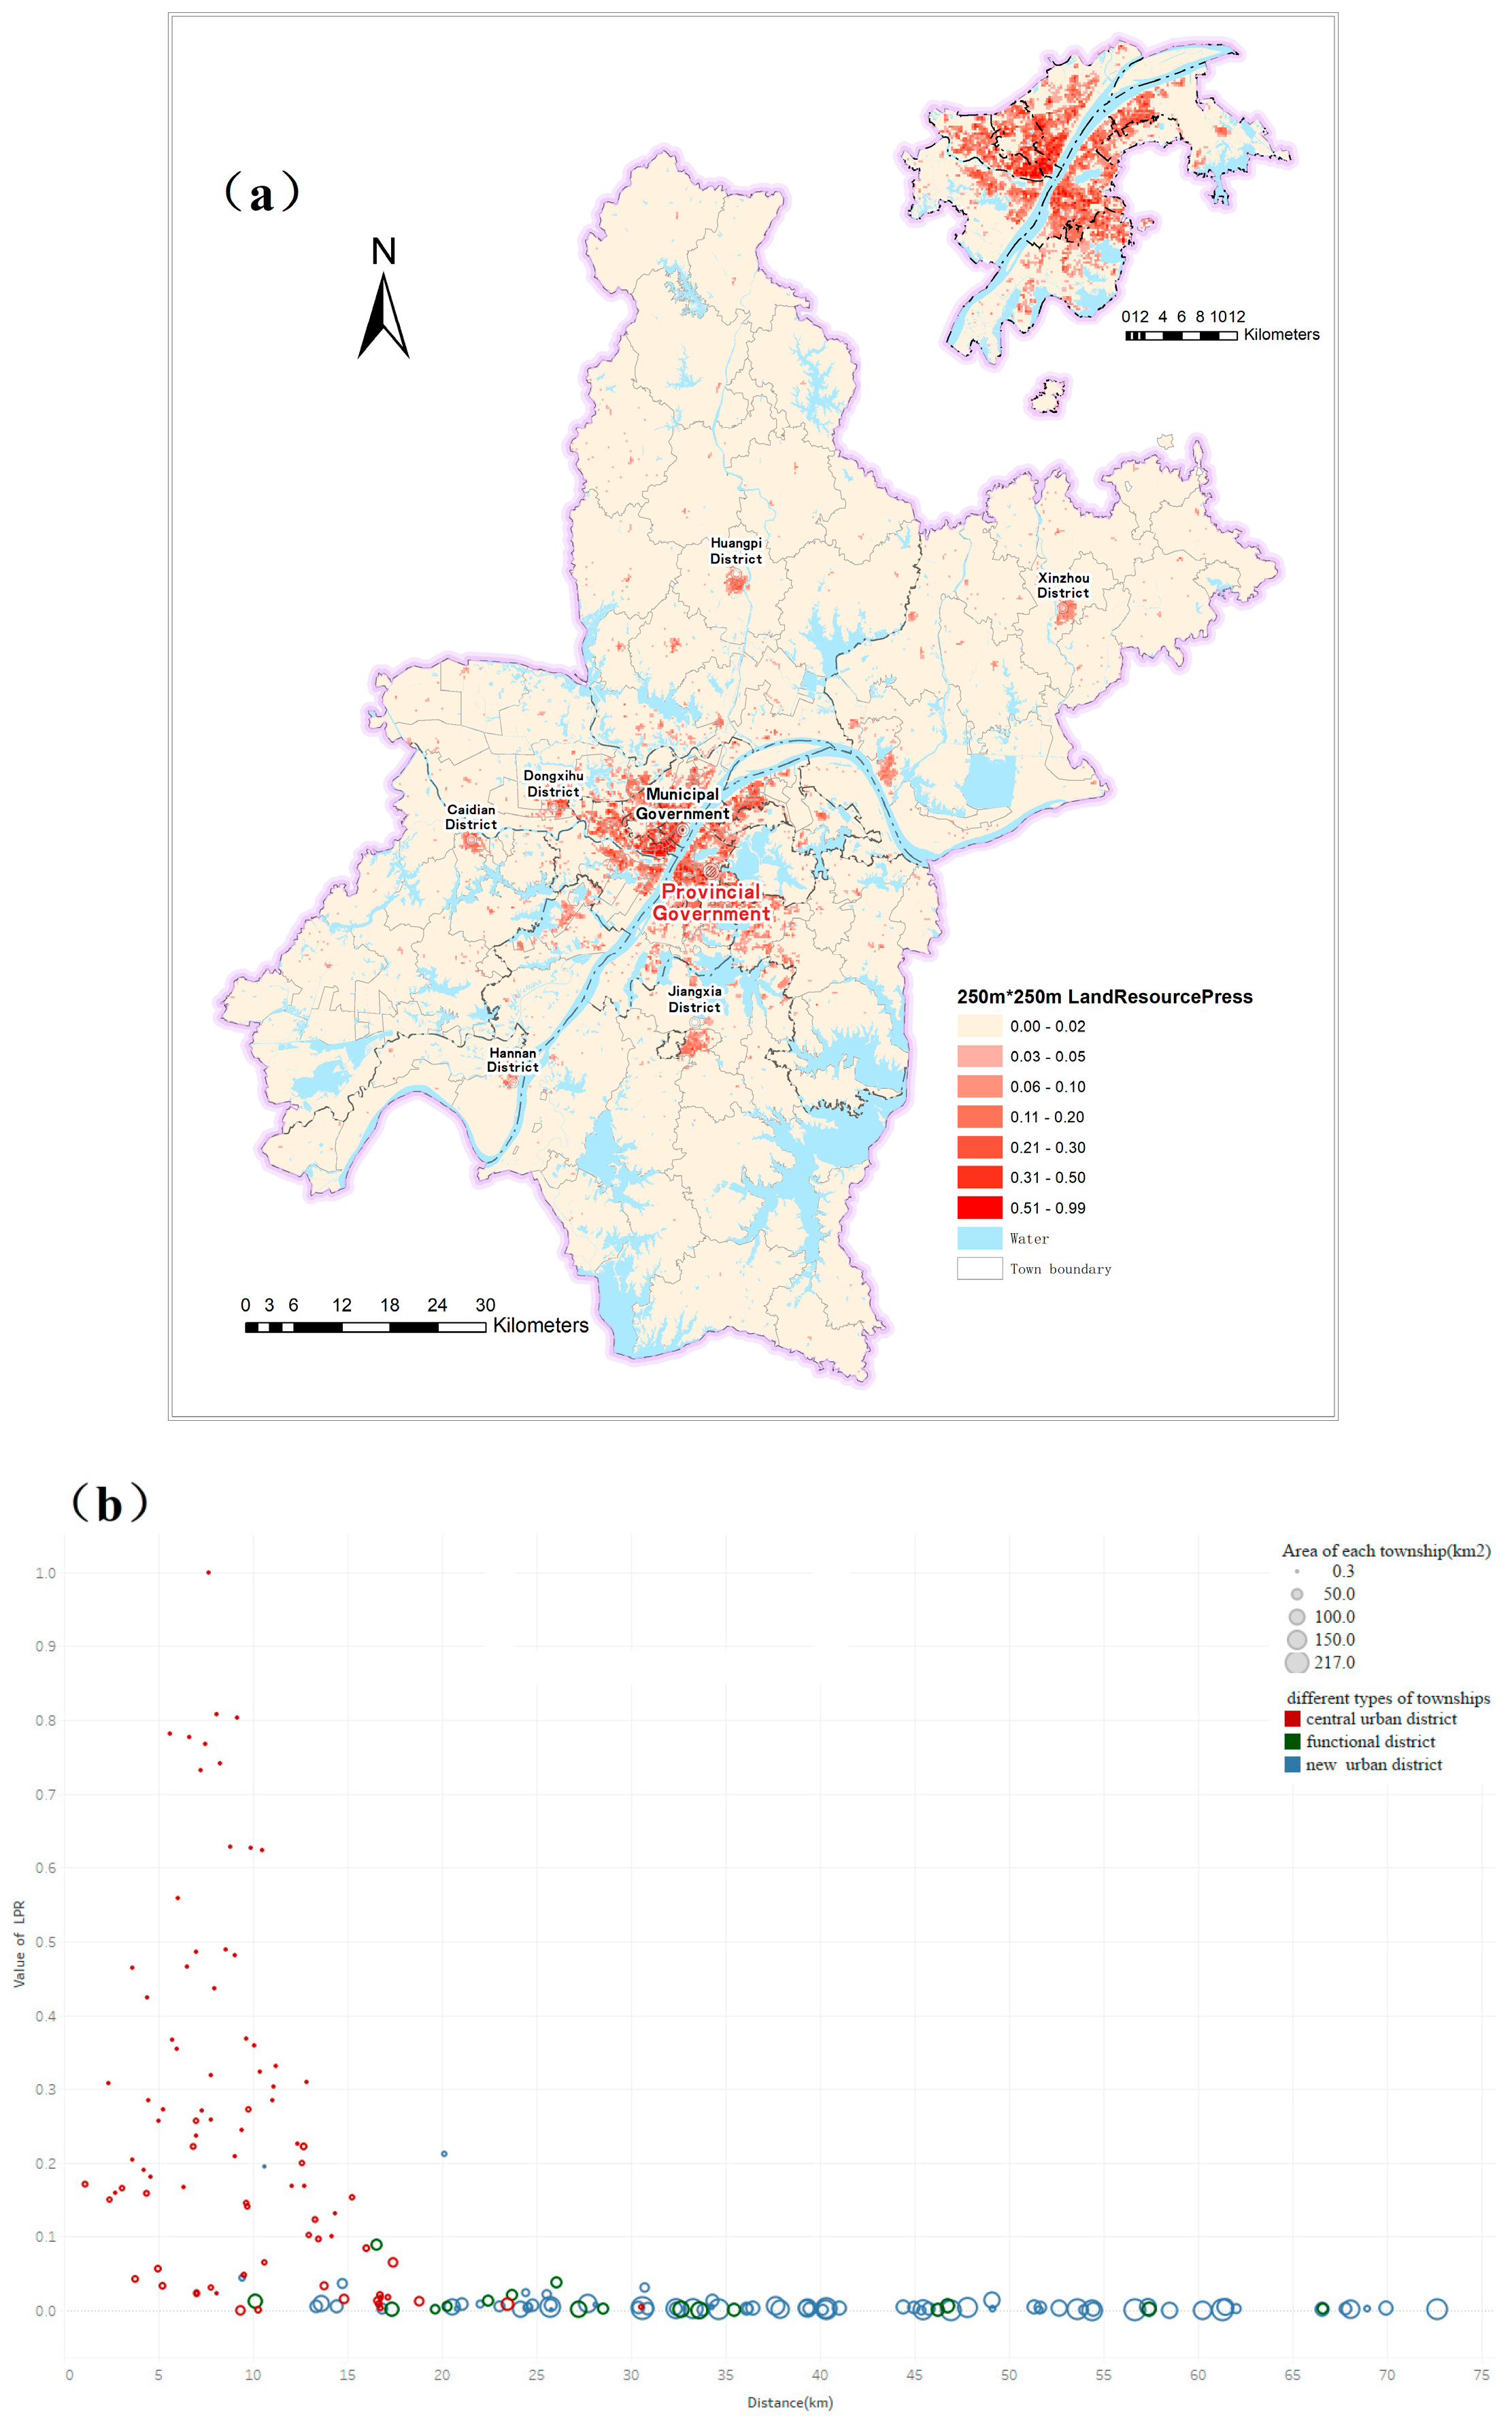
2.3. Land Resource Pressure Index
2.4. Geographically Weighted Models
2.4.1. GW Summary Statistics
2.4.2. Geographically Weighted Regression
3. Results and Discussion
3.1. Spatial Pattern of the Land Resource Pressure
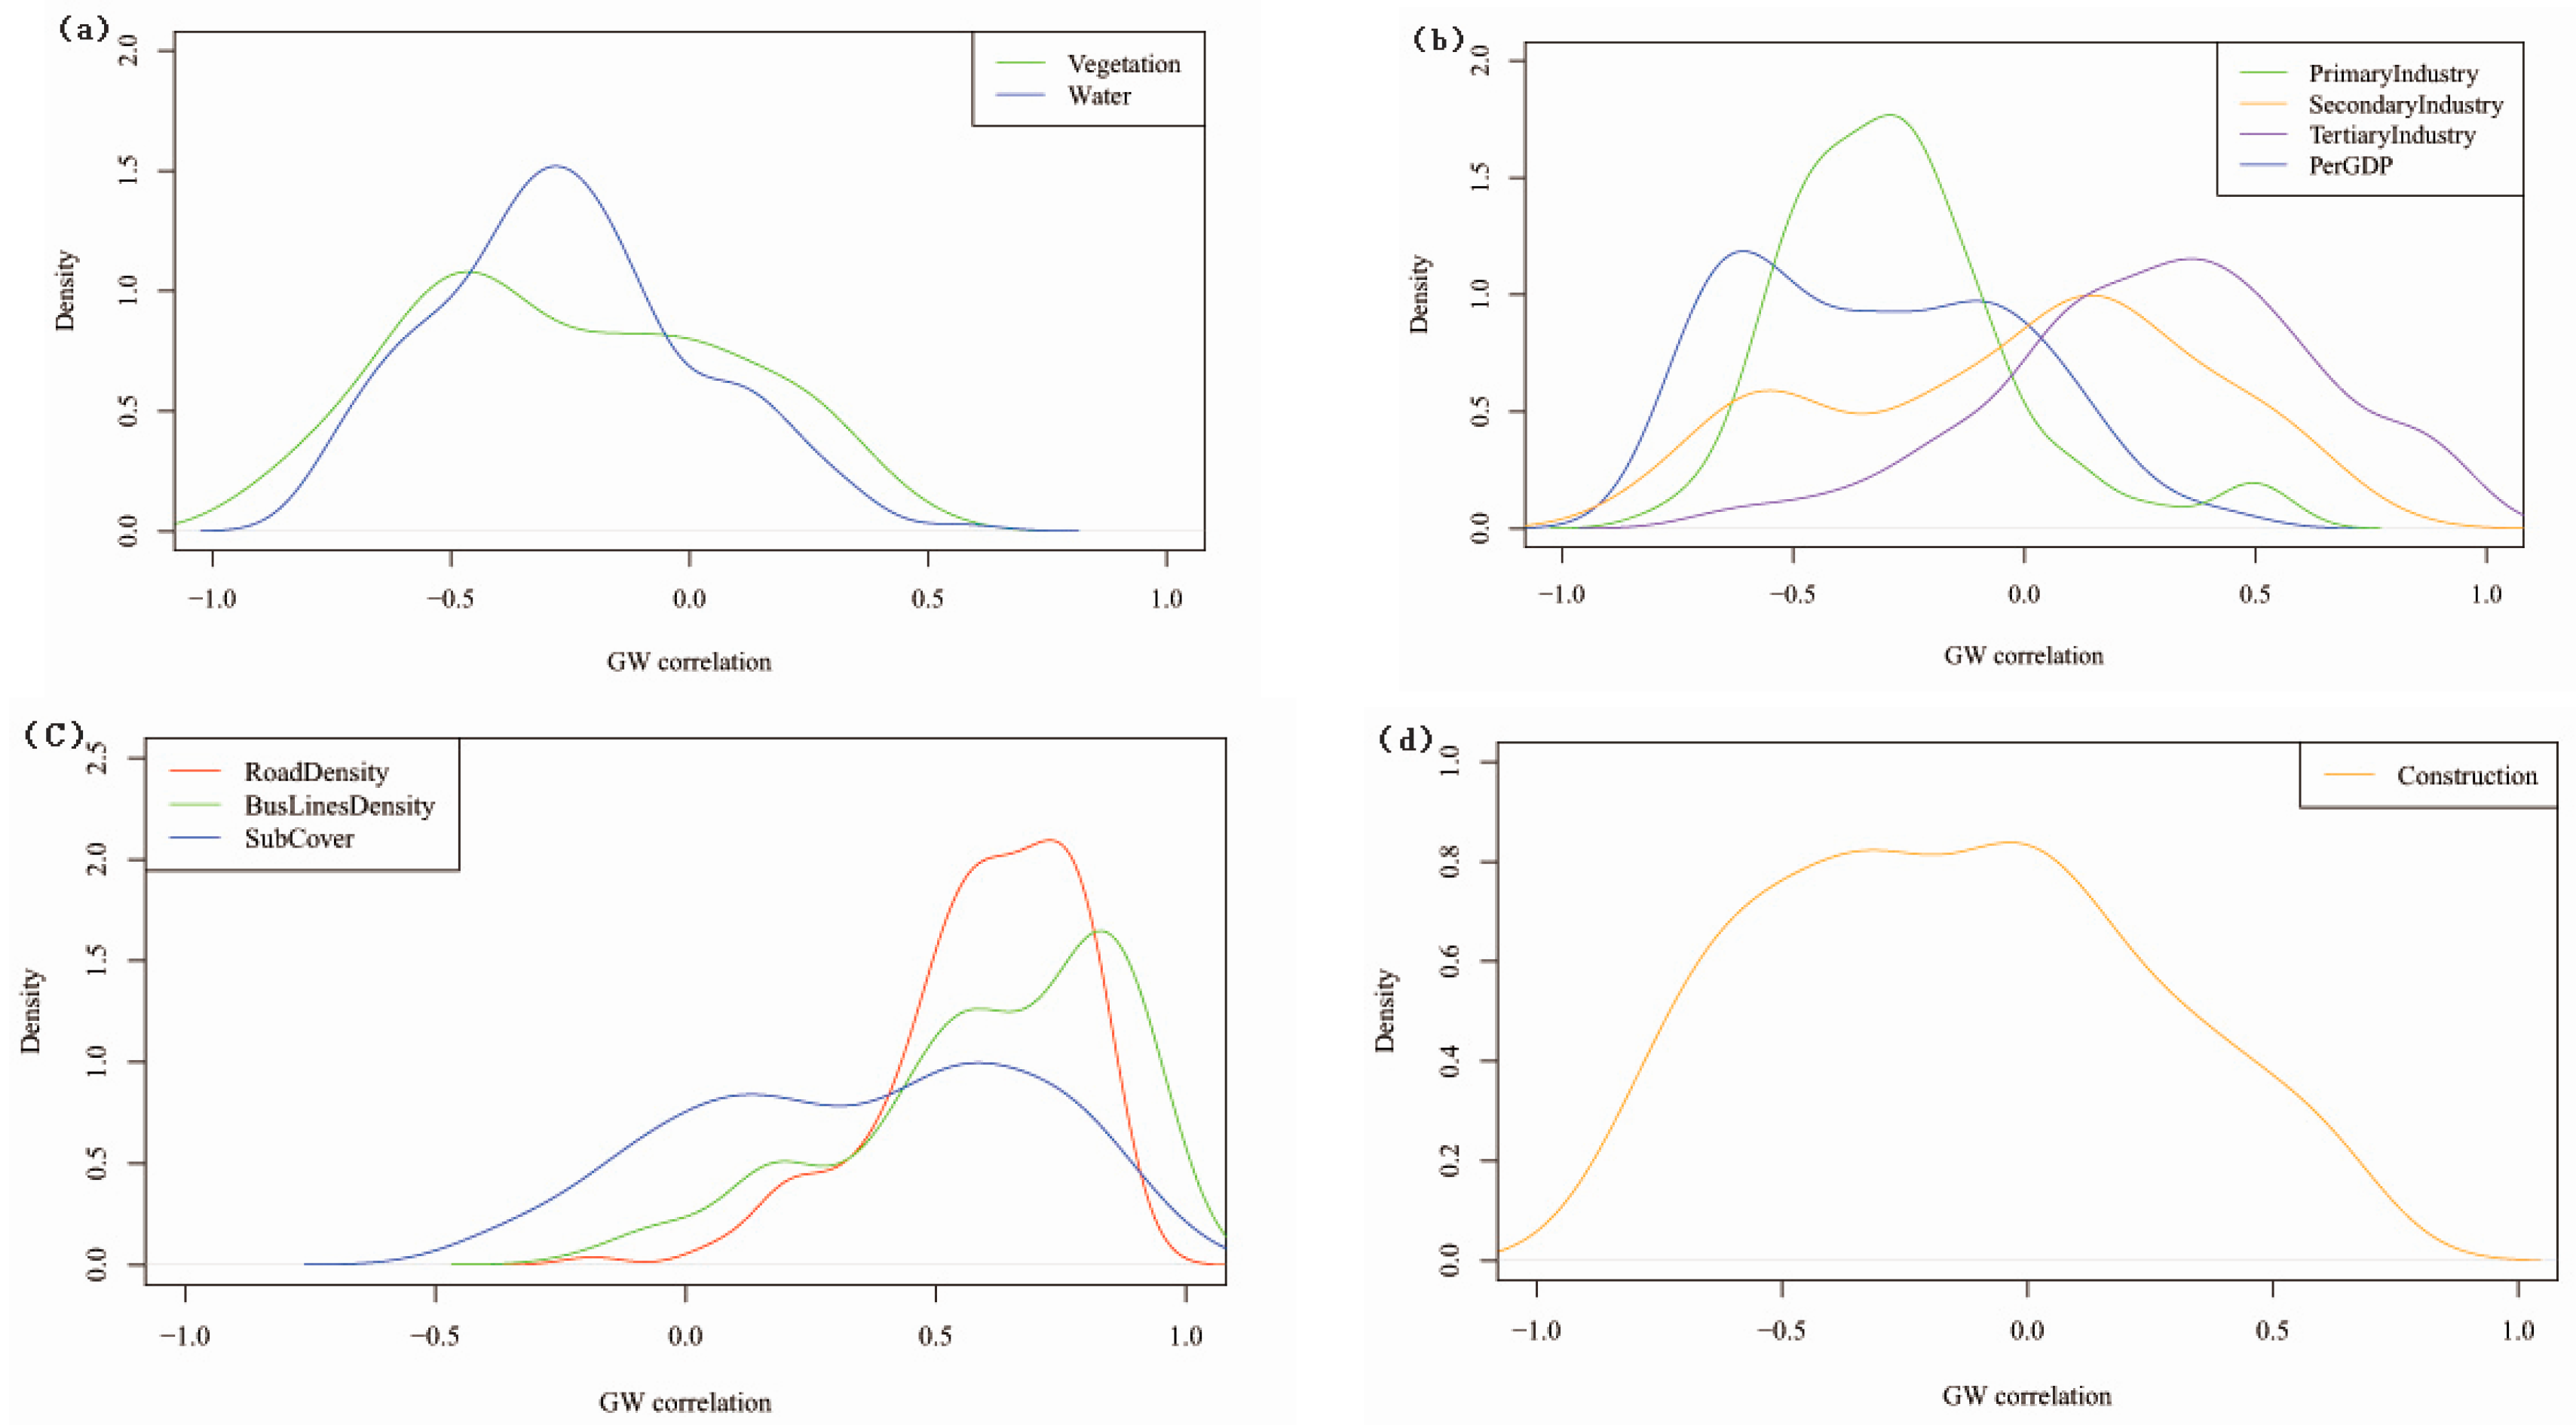
3.2. GW Correlation Coefficients
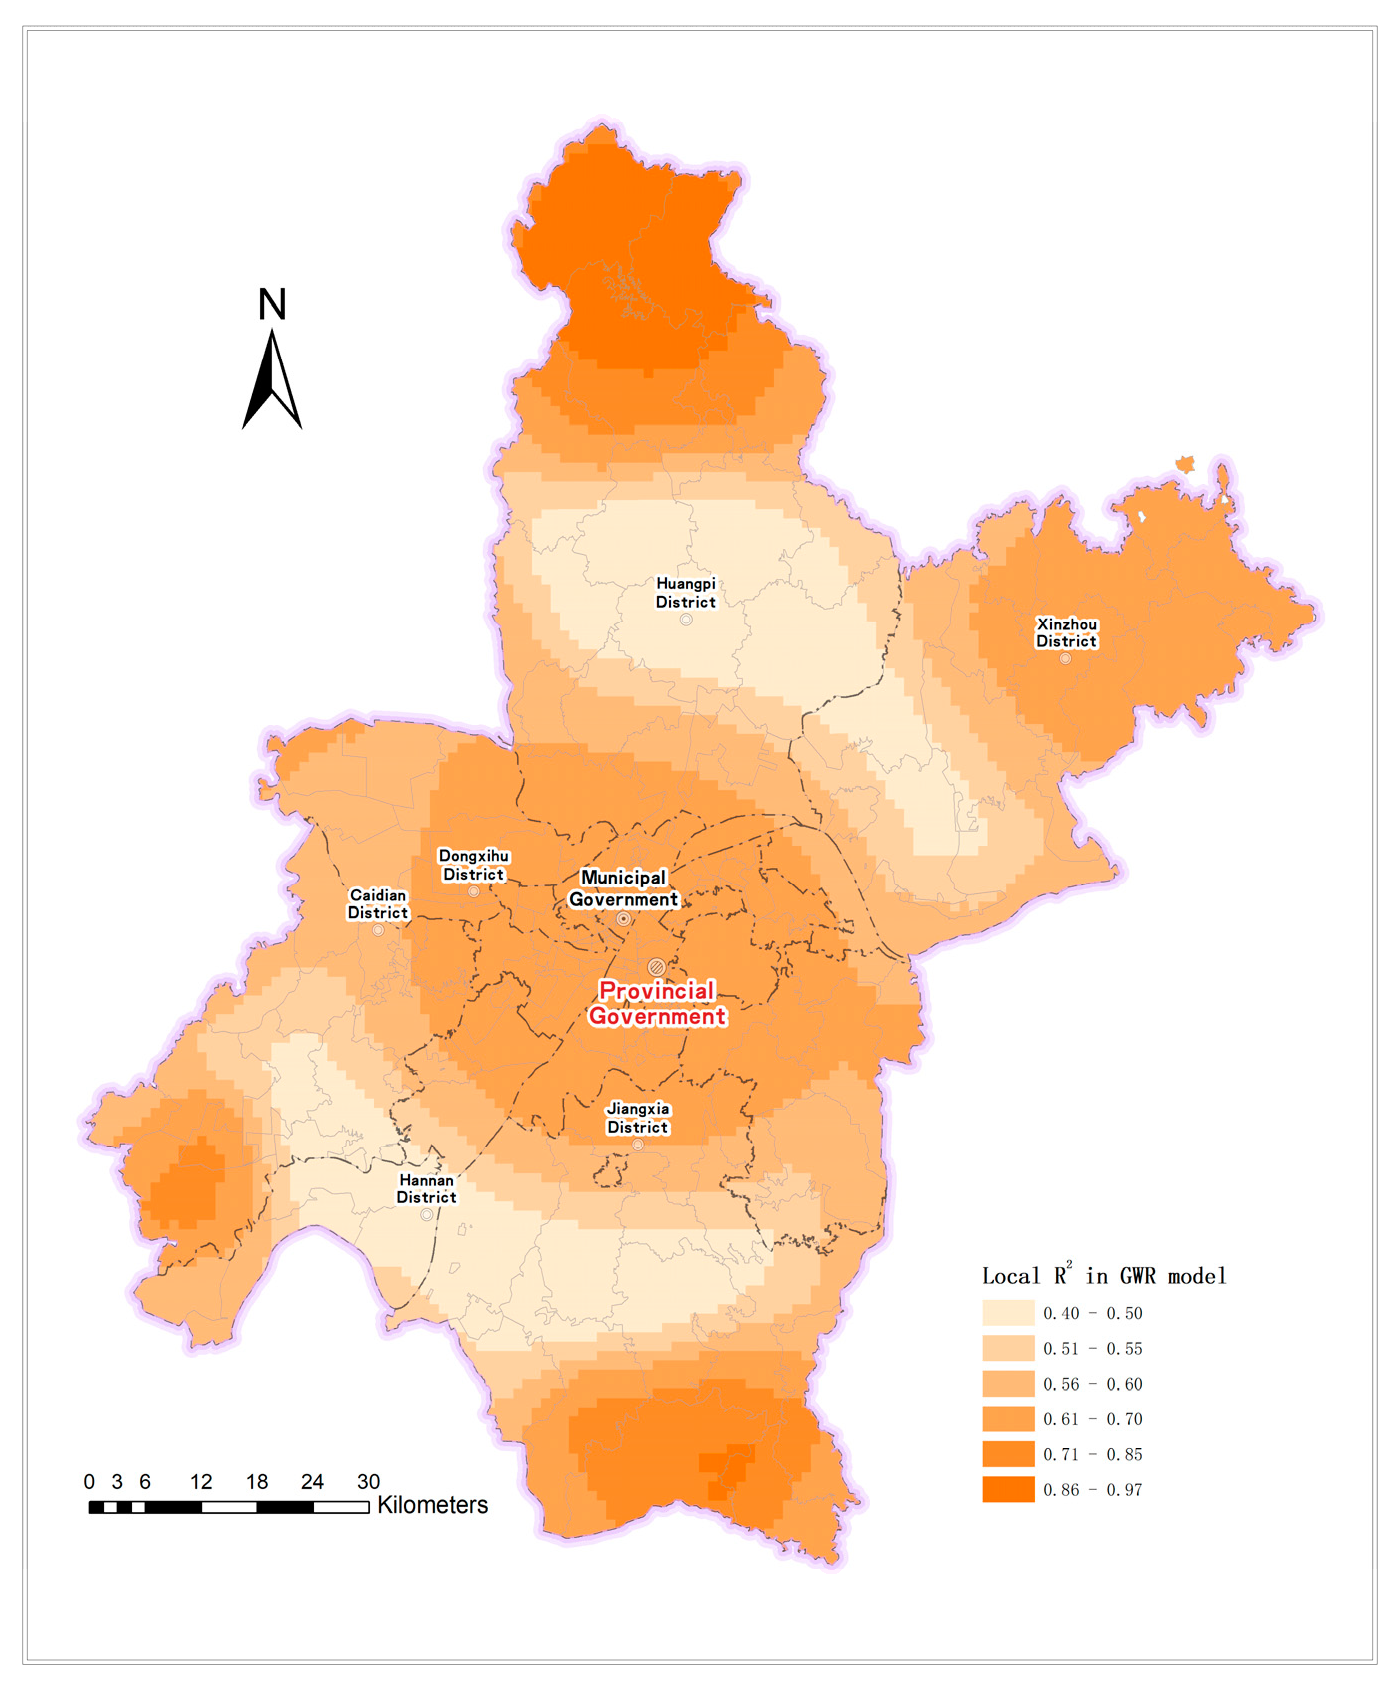
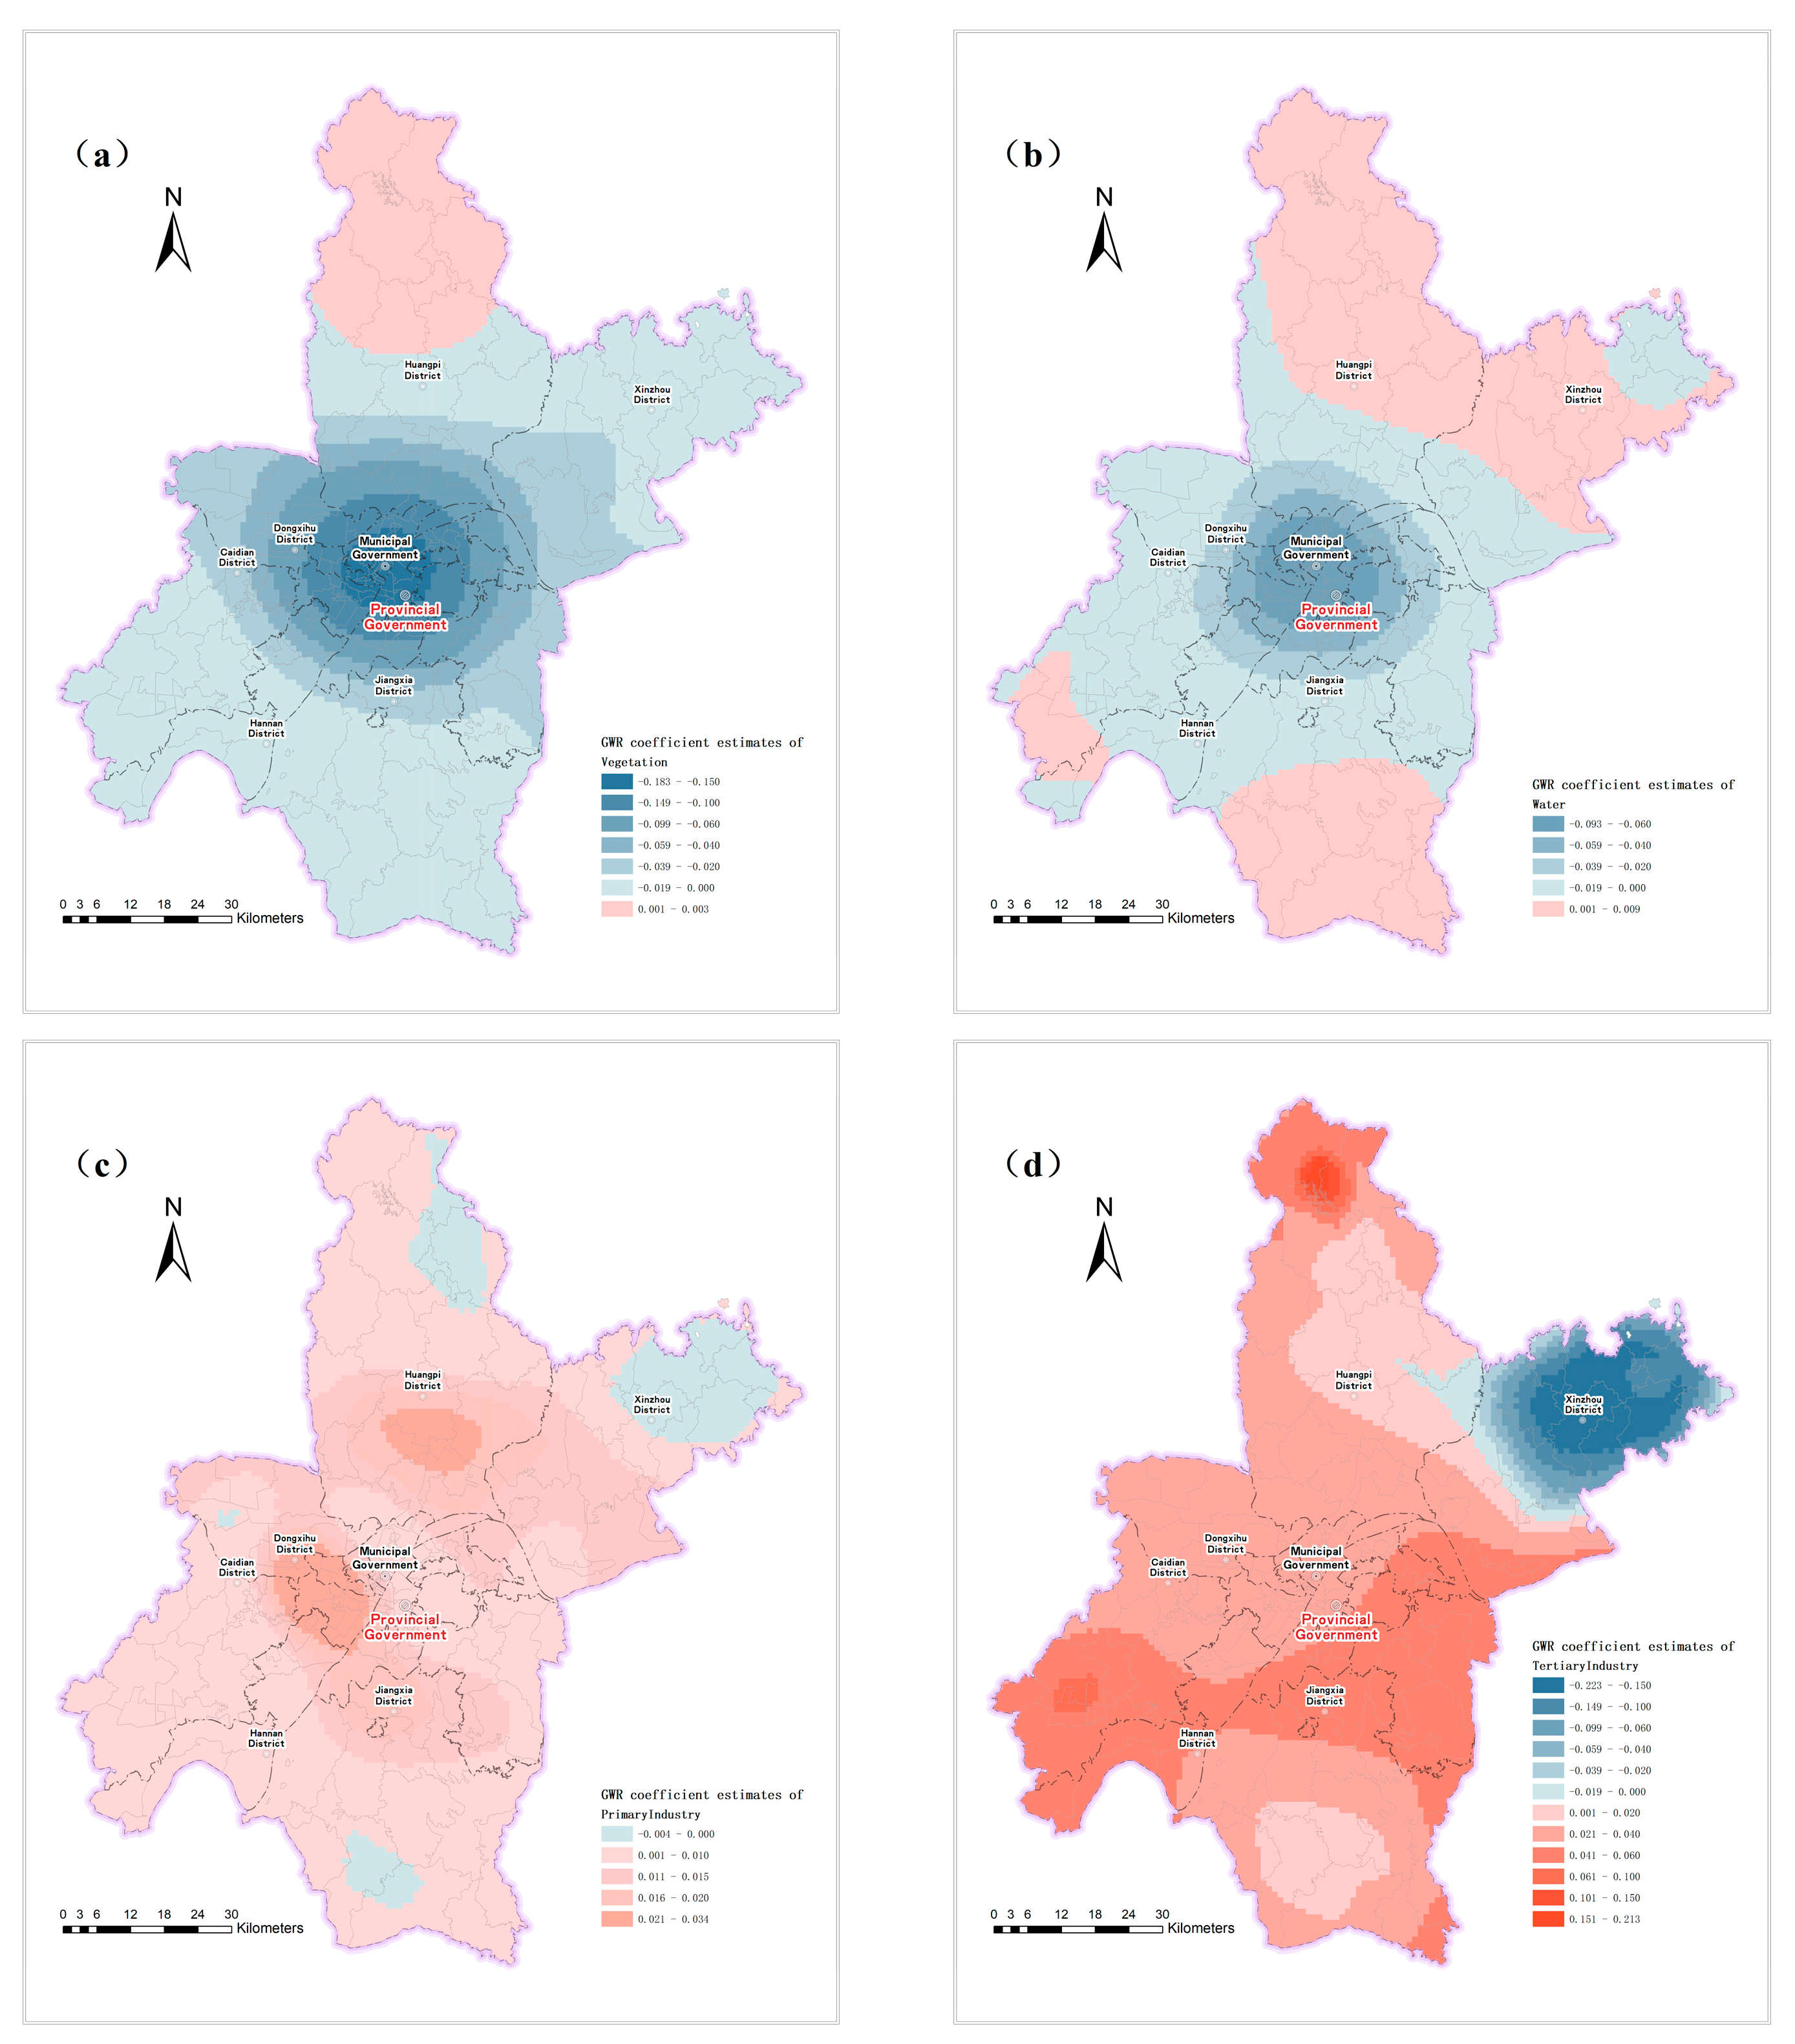
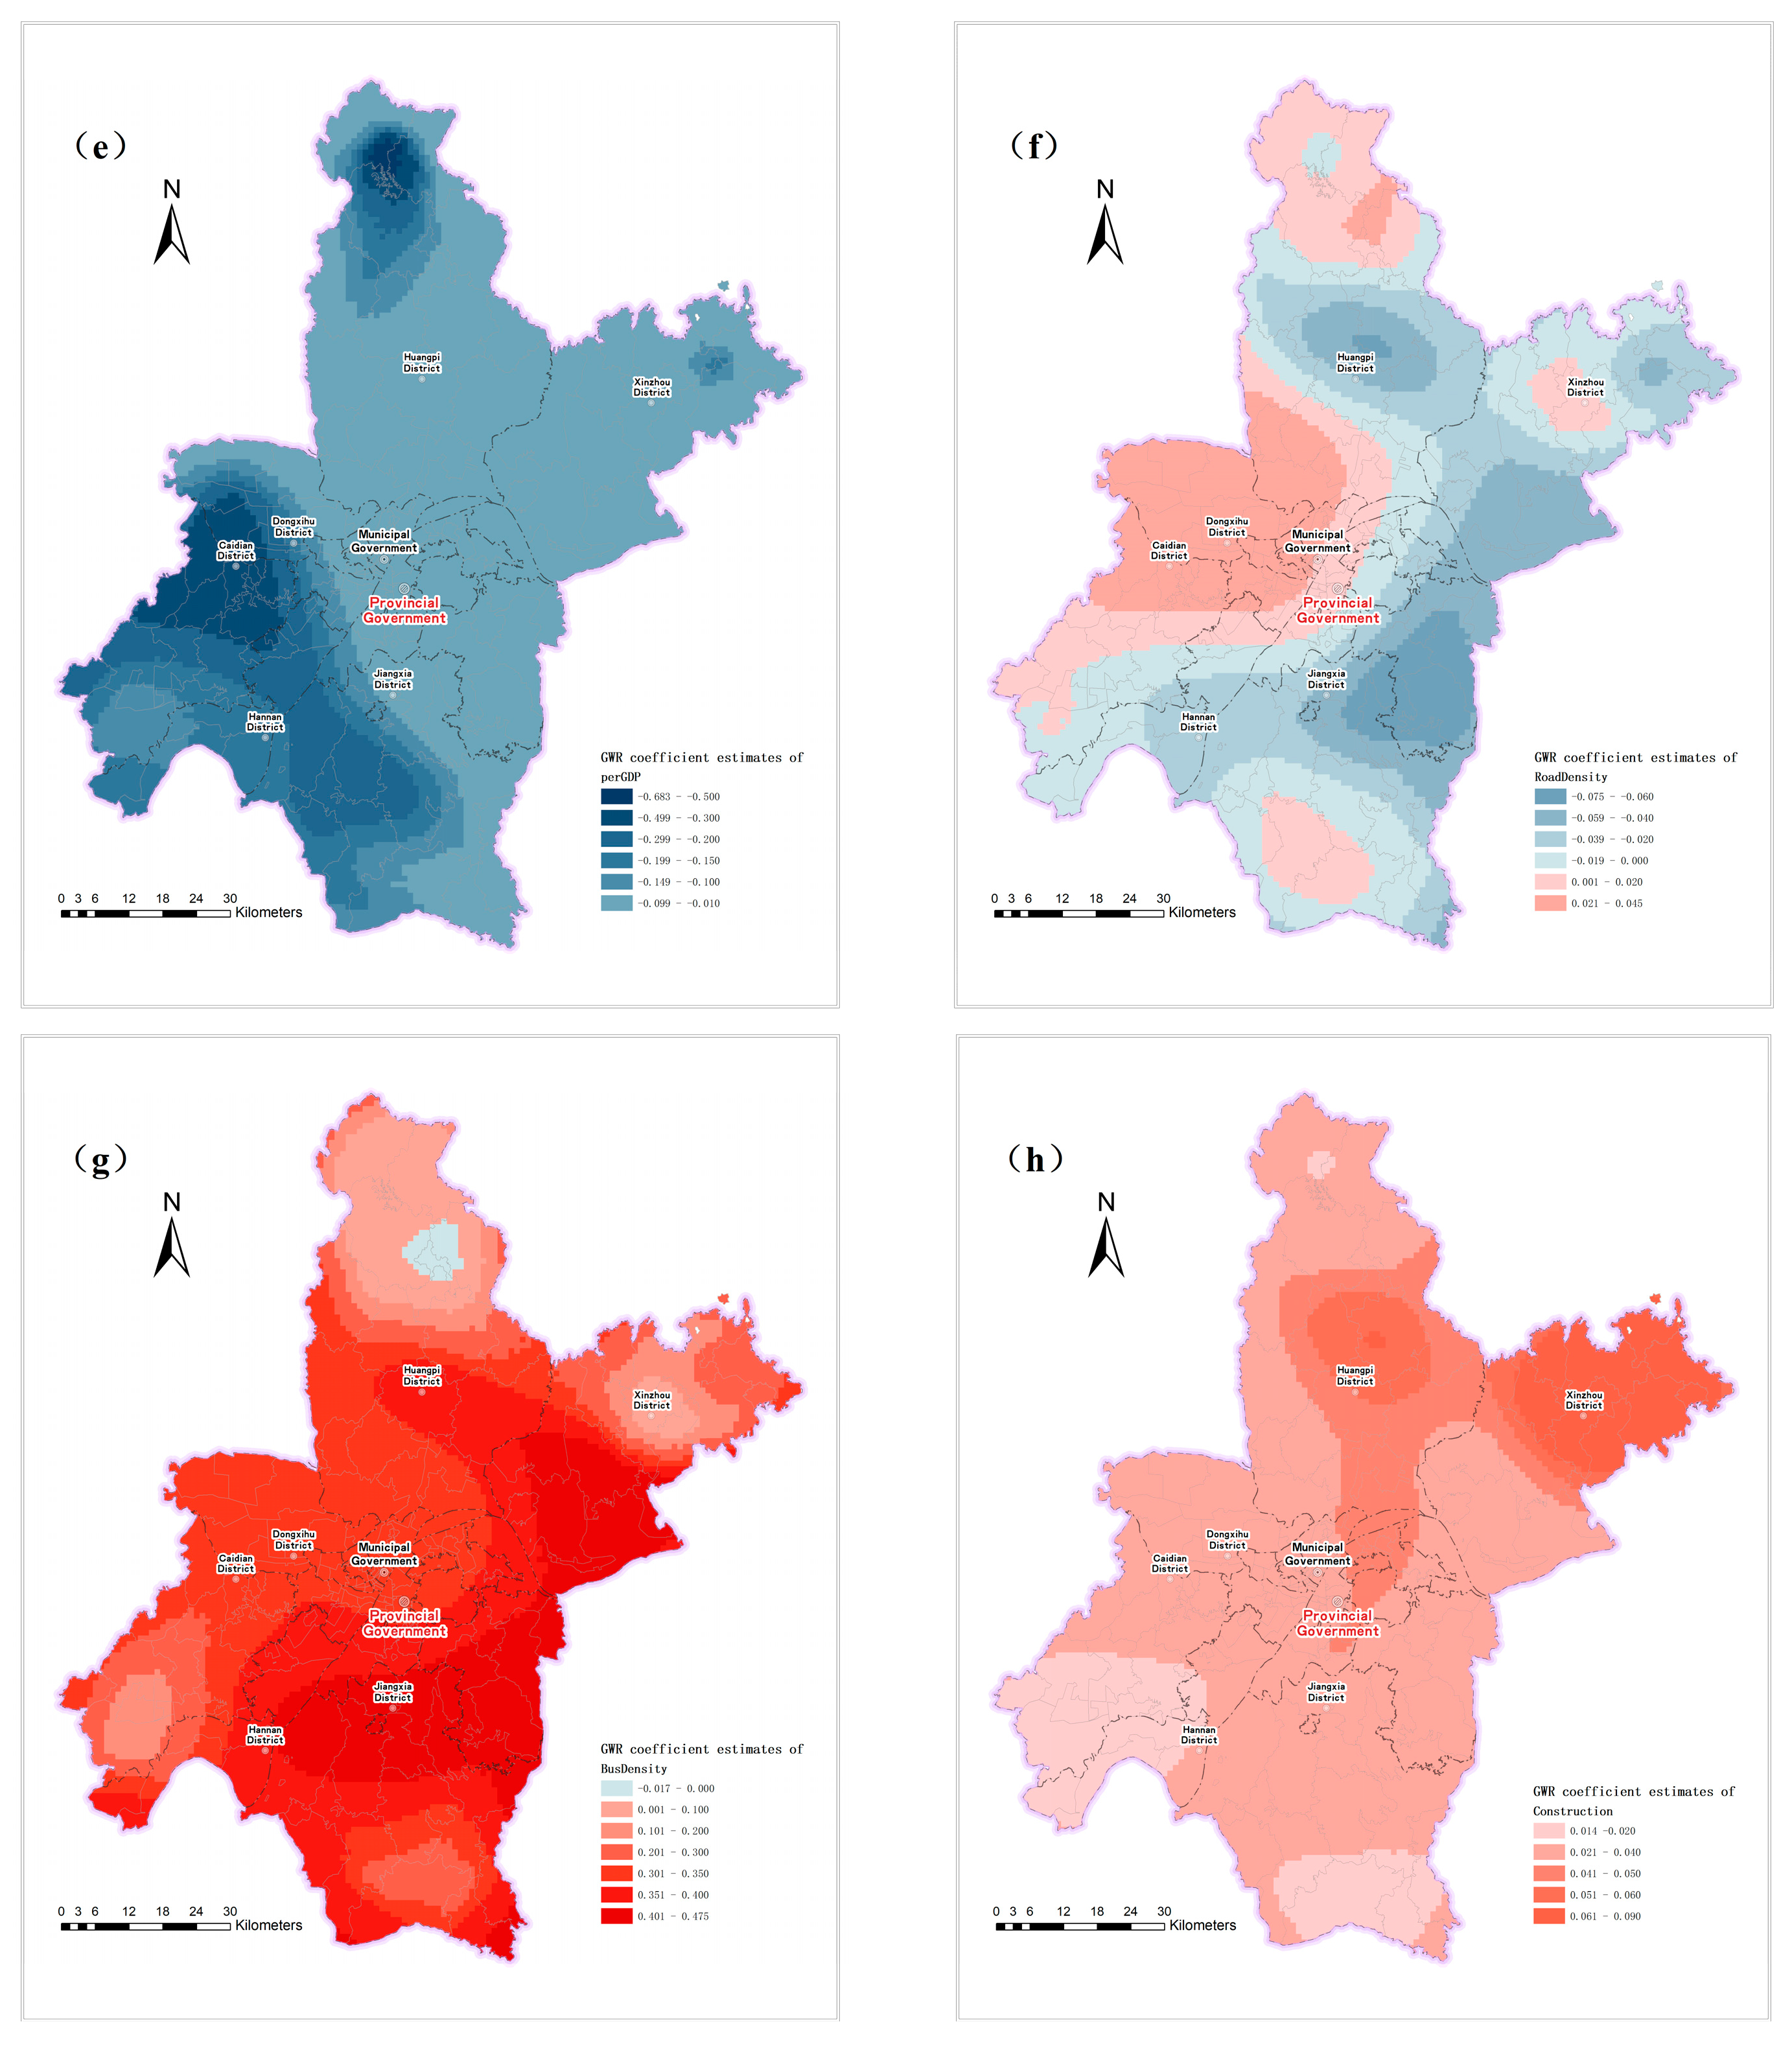
3.3. GWR Results
4. Conclusions
Author Contributions
Funding
Acknowledgments
Conflicts of Interest
Appendix A
References
- Jung, H.B. Nutrients and heavy metals contamination in an urban estuary of northern new jersey. Geosciences 2017, 7, 108. [Google Scholar] [CrossRef]
- Zhang, J.; Fu, M.; Zhang, Z.; Tao, J.; Fu, W. A trade-off approach of optimal land allocation between socio-economic development and ecological stability. Ecol. Model. 2014, 272, 175–187. [Google Scholar] [CrossRef]
- Shao, W.W.; Zhou, Z.H.; Liu, J.H.; Yang, G.Y.; Wang, J.H.; Xiang, C.Y.; Cao, X.L.; Liu, H.Z. Changing mechanisms of agricultural water use in the urbanization and industrialization of China. Water Policy 2017, 19, 908–935. [Google Scholar] [CrossRef]
- Cairns, R.D.; Martinet, V. An environmental-economic measure of sustainable development. Eur. Econ. Rev. 2014, 69, 4–17. [Google Scholar] [CrossRef] [Green Version]
- Rydzewski, P. The implementation of sustainable development vs. environmental attitudes in international comparative studies. Probl. Ekorozw. 2013, 8, 125–137. [Google Scholar]
- Tong, Y.Q. Bureaucracy meets the environment: Elite perceptions in six Chinese cities. China Q. 2007, 189, 100–121. [Google Scholar] [CrossRef]
- Ye, L.M.; Van Ranst, E. Population carrying capacity and sustainable agricultural use of land resources in Caoxian County. J. Sustain. Agric. 2002, 19, 75–94. [Google Scholar] [CrossRef]
- Lane, M. The carrying capacity imperative: Assessing regional carrying capacity methodologies for sustainable land-use planning. Land Use Policy 2010, 27, 1038–1045. [Google Scholar] [CrossRef] [Green Version]
- Yang, L.; Lv, Y.; Zheng, H.Y. Review on research of urban land carrying capacity. Prog. Geogr. 2010, 29, 593–600. [Google Scholar]
- Wei, Y.G.; Huang, C.; Lam, P.T.I.; Yuan, Z.Y. Sustainable urban development: A review on urban carrying capacity assessment. Habitat Int. 2015, 46, 64–71. [Google Scholar] [CrossRef]
- UNESCO; FAO. Carrying Capacity Assessment with a Pilot Study of Kenya: A Resource Accounting Methodology for Exploring National Options for Sustainable Development; UNESCO: Paris, France; FAO: Rome, Italy, 1985. [Google Scholar]
- Lin, W.; Chen, Y. The impact of urbanization on land carrying capacity in Beijing-Tianjin-Hebei region. Argo Food Ind. Hitech 2017, 28, 3747–3751. [Google Scholar]
- Yan, H.M.; Liu, F.; Liu, J.Y.; Xiao, X.M.; Qin, Y.W. Status of land use intensity in China and its impacts on land carrying capacity. J. Geogr. Sci. 2017, 27, 387–402. [Google Scholar] [CrossRef]
- Zhang, J.X.; Liu, J.P.; Zhai, L.; How, W. Implementation of geographical conditions monitoring in Beijing-Tianjin-Hebei, China. ISPRS Int. J. Geo-Inf. 2016, 5, 89. [Google Scholar] [CrossRef]
- Li, D.R.; Ding, L.; Shao, Z. Considerations on several issues concerning monitoring of geo-graphical conditions. Geomat. Inf. Sci. Wuhan Univ. 2016, 41, 144–147. [Google Scholar]
- Zhang, J.; Li, W.; Zhai, L. Understanding geographical conditions monitoring: A perspective from china. Int. J. Digit. Earth 2015, 8, 38–57. [Google Scholar] [CrossRef]
- Pozzi, F.; Small, C. Exploratory analysis of suburban land cover and population density in the USA. In Proceedings of the IEEE/ISPRS Joint Workshop on Remote Sensing and Data Fusion over Urban Areas (Cat. No.01EX482), Rome, Italy, 8–9 November 2001; pp. 250–254. [Google Scholar]
- Xu, Y.Q.; Li, Y.H.; Zhao, F.F. Simulation of land use change under the restriction of water resource in ecologically fragile region: A case study of Zhangbei County, Hebei Province. J. China Agric. Univ. 2015, 20, 214–223. [Google Scholar]
- Peng, C.; Song, M.L.; Han, F. Urban economic structure, technological externalities, and intensive land use in China. J. Clean. Prod. 2017, 152, 47–62. [Google Scholar] [CrossRef]
- Liu, N.; Shi, P.J.; Li, B. Space difference and correlation between population and economy in Gansu Province. Arid Land Geogr. 2014, 37, 179–187. [Google Scholar]
- Zhang, R.S.; Pu, L.J.; Zhu, M. Impact of transportation arteries on land use patterns in urban-rural fringe: A comparative gradient analysis of Qixia District, Nanjing City, China. Chin. Geogr. Sci. 2013, 23, 378–388. [Google Scholar] [CrossRef]
- Song, G.B.; Li, Z.H.; Bao, Y.J.; Lu, H.Y.; Gao, J.X.; Wang, H.M.; Xu, T.; Cheng, Y. Spatial distribution regularity and influence factors of population density in the LRGR. Chin. Sci. Bull. 2007, 52, 90–97. [Google Scholar] [CrossRef]
- Brunsdon, C.; Fotheringham, A.S.; Charlton, M. Geographically weighted summary statistics—A framework for localised exploratory data analysis. Computers. Environ. Urban Syst. 2002, 26, 501–524. [Google Scholar] [CrossRef]
- GolliniI, I.; Lu, B.; Charlton, M.; Brunsdon, C.; Harris, P. GWmodel: An R package for exploring spatial heterogeneity using geographically weighted models. J. Stat. Softw. 2015, 63, 1–50. [Google Scholar] [CrossRef]
- Fotheringham, A.S.; Brunsdon, C.; Charlton, M. Geographically Weighted Regression: The Analysis of Spatially Varying Relationships; Wiley: Chichester, UK, 2002. [Google Scholar]
- Han, S.S.; Wu, X.A. City profile Wuhan. Cities 2004, 21, 349–362. [Google Scholar] [CrossRef]
- Wuhan Statistics Bureau. Wuhan National Economic and Social Development Statistical Bulletin in 2016. Available online: http://www.whtj.gov.cn/details.aspx?id=3439 (accessed on 31 March 2017).
- Li, L.; Li, J.; Jiang, Z.; Zhao, L.; Zhao, P. Methods of population spatialization based on the classification information of buildings from china’s first national geoinformation survey in urban area: A case study of Wuchang district, Wuhan city, China. Sensors 2018, 18, 2558. [Google Scholar] [CrossRef] [PubMed]
- Szombara, S. Automation of Dot Maps Production Supported by BDOT10k Database. In Proceedings of the 2017 Baltic Geodetic Congress (BGC Geomatics), Gdansk, Poland, 22–25 June 2017; pp. 100–104. [Google Scholar]
- Li, S.J.; Zhou, C.S.; Wang, S.J.; Gao, S.; Liu, Z.T. Spatial Heterogeneity in the Determinants of Urban Form: An Analysis of Chinese Cities with a GWR Approach. Sustainability 2019, 11, 479. [Google Scholar] [CrossRef]
- Dong, G.P.; Richard, H. Spatial Autoregressive Models for Geographically Hierarchical Data Structures. Geogr. Anal. 2015, 47, 173–191. [Google Scholar] [CrossRef]
- Schneider, A.; Mertes, C.M. Expansion and growth in Chinese cities, 1978–2010. Environ. Res. Lett. 2014, 9, 024008. [Google Scholar] [CrossRef] [Green Version]
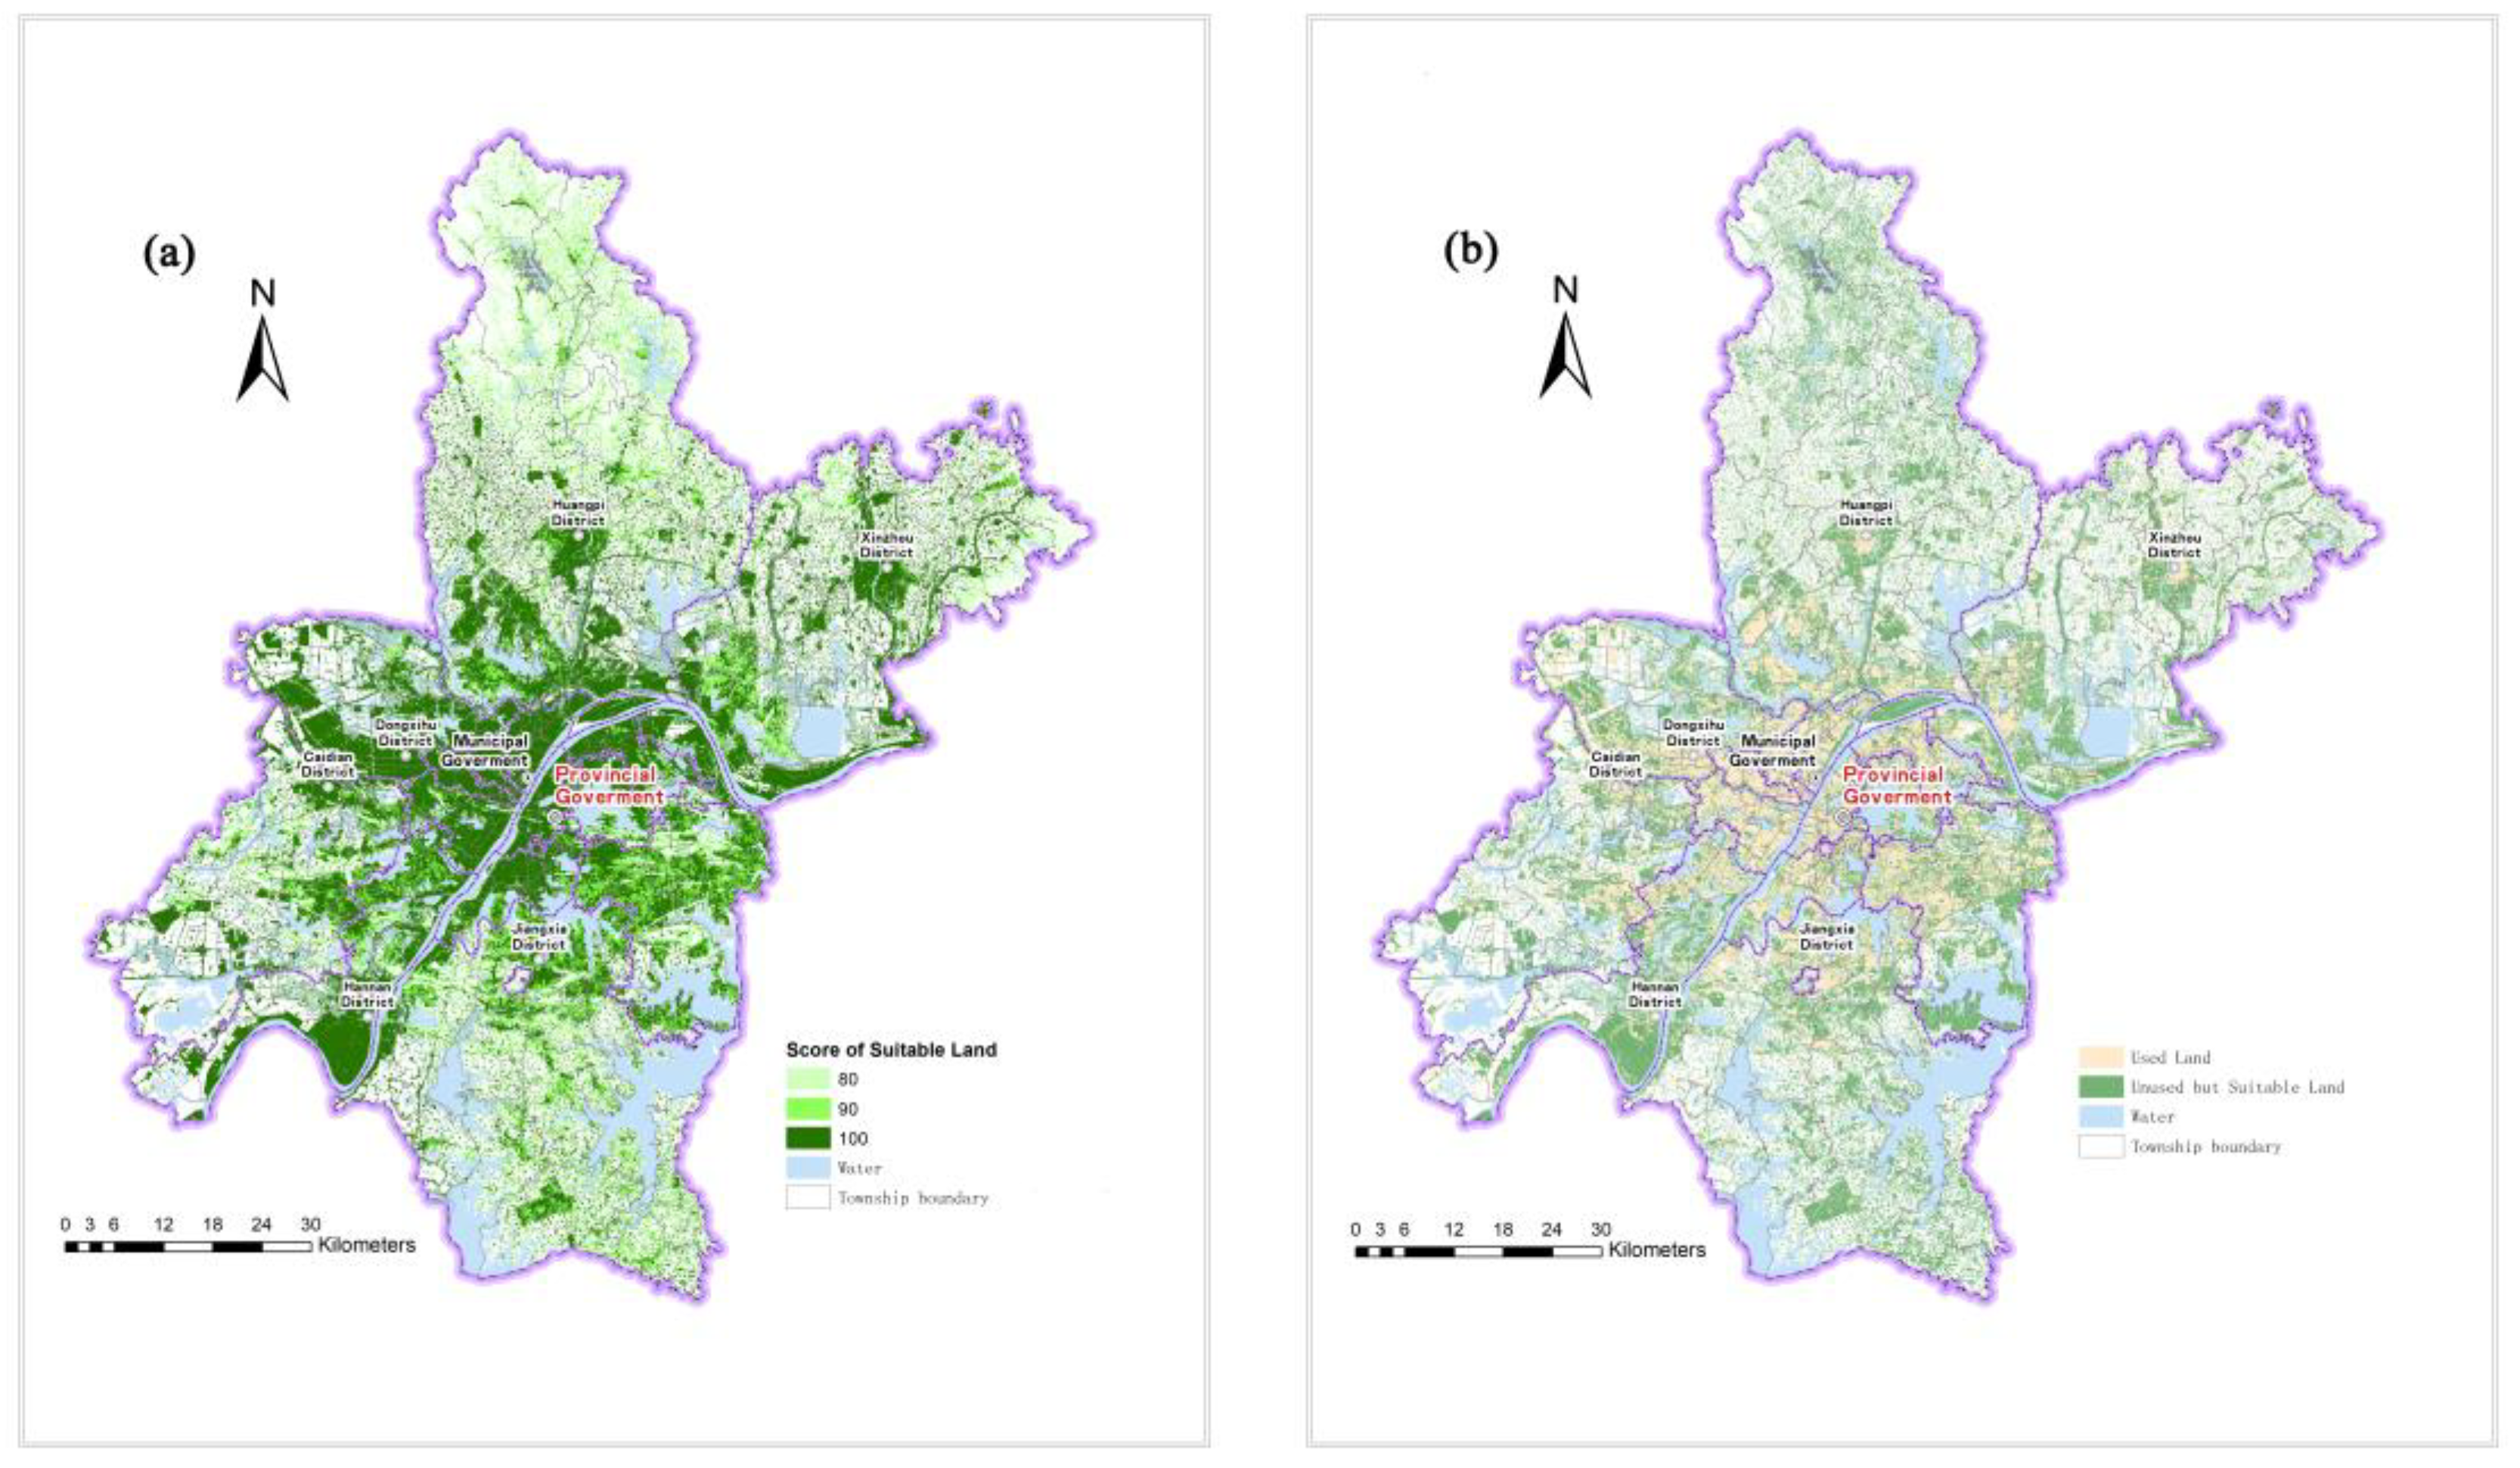
- Xu, Y.; Tang, Q.; Fan, J. Available land index items and their calculational methods for major function oriented regionalization. Geogr. Res. 2010, 29, 1223–1232. [Google Scholar]
- Xu, X.R.; Xu, Y. Potential of available construction land in the Yangtze River economic belt. Resour. Environ. Yangtze Basin 2016, 25, 1789–1795. [Google Scholar]
- Openshaw, S. The Modifiable Areal Unit Problem; Geo Books: Norwich, UK, 1984; p. 3. [Google Scholar]
- Lu, B.; Charltion, M.; Harris, P.; Fotheringham, A.S. Geographically weighted regression with a non-euclidean distance metric: A case study using hedonic house price data. Int. J. Geogr. Inf. Sci. 2014, 28, 660–681. [Google Scholar] [CrossRef]
- Pak, M.; Gulci, S.; Okumus, A. A study on the use and modeling of geographical information system for combating forest crimes: An assessment of crimes in the eastern Mediterranean forests. Environ. Monit. Assess. 2018, 190, 62. [Google Scholar] [CrossRef] [PubMed]
- Lewandowska-Gwarda, K. Geographically Weighted Regression in the Analysis of Unemployment in Poland. ISPRS Int. J. Geo-Inf 2018, 7, 17. [Google Scholar] [CrossRef]
- Török, I. Qualitative Assessment of Social Vulnerability to Flood Hazards in Romania. Sustainability 2018, 10, 3780. [Google Scholar] [CrossRef]
- Całka, B. Comparing continuity and compactness of choropleth map classes. Geod. Cartogr. 2018, 67, 21–34. [Google Scholar]
- Lu, B.; Brunsdon, C.; Charlton, M.; Harris, P. Geographically weighted regression with parameter-specific distance metrics. Int. J. Geogr. Inf. Sci. 2017, 31, 982–998. [Google Scholar] [CrossRef]
- Fotheringham, A.S.; Yang, W.; Kang, W. Multiscale Geographically Weighted Regression (MGWR). Ann. Am. Assoc. Geogr. 2017, 107, 1247–1265. [Google Scholar] [CrossRef]
- Brunsdon, C.; Charlton, M.; Harris, P. Living with collinearity in Local Regression Models. In Proceedings of the Accuracy 2012—10th International Symposium on Spatial Accuracy Assessment in Natural Resources and Environmental Sciences, Florianópolis, Brazil, 10–13 July 2012. [Google Scholar]
- Fotheringham, A.S.; Oshan, T.M. Geographically weighted regression and multicollinearity: Dispelling the myth. J. Geogr. Syst. 2016, 18, 303–329. [Google Scholar] [CrossRef]
- Comber, A.; Chi, K.; Huy, M.Q.; Nguyen, Q.; Lu, B.; Phe, H.H.; Harris, P. Distance metric choice can both reduce and induce collinearity in geographically weighted regression. Environ. Plan. B Urban Anal. City Sci. 2018. [Google Scholar] [CrossRef]

| Type of Industrial Land | Description |
|---|---|
| Primary Industry | Farmland in LCA |
| Secondary Industry | Industrial enterprises in urban intergrated functional units (BUCA) |
| Tertiary Industry | Service industry facilities, logistics and storage land in BUCA; construction sites in LCA |
| Variable | Description | Unit | Min. | Max | |
|---|---|---|---|---|---|
| LRP | The land resource pressure index of each grid | 0.00 | 1.00 | ||
| Nature resources | Vegetation | Ratio of vegetation | 0.00 | 1.00 | |
| Water | Ratio of water | 0.00 | 1.00 | ||
| Economy | PrimaryIndustry | Added value of primary industry | 100 million/km2 | 0.00 | 0.99 |
| SecondaryIndustry | Added value of secondary industry | 1 billion/km2 | 0.00 | 1.02 | |
| TertiaryIndustry | Added value of tertiary industry | 1 billion/km2 | 0.00 | 3.41 | |
| PerGDP | Per capita gross domestic product | 10 million/person | 0.00 | 2.86 | |
| Transportation | RoadDensity | Road network density | 10 km/km2 | 0.00 | 1.43 |
| BusDensity | Bus lines density | 100 km/km2 | 0.00 | 0.96 | |
| SubCover | Ratio of 500-m subway buffer | 0.00 | 1.00 | ||
| Urban construction | Construction | Ratio of urban construction lands | 0.00 | 1.00 |
| ID | Variable | Classification | Score | |
|---|---|---|---|---|
| 1 | SL | ≤3° | 100 | |
| 2 | 3°~8° | 80 | ||
| 3 | 8°~15° | 60 | ||
| 4 | 15~25° | 40 | ||
| 5 | >25° | 20 | ||
| 6 | EL | ≤500 m | 100 | |
| 7 | 500~1000 m | 80 | ||
| 8 | 1000~2000 m | 60 | ||
| 9 | 2000~3000 m | 40 | ||
| 10 | >3000 m | 20 | ||
| 11 | Basic farmland | 0 | ||
| 12 | Water or wetland | 0 | ||
| 13 | Lake reserve | 0 | ||
| Variables | Min. | Median | Max. | Max-Min | Mean |
|---|---|---|---|---|---|
| Vegetation | −0.919 | −0.286 | 0.490 | 1.408 | −0.252 |
| Water | −0.779 | −0.278 | 0.570 | 1.349 | −0.260 |
| PrimaryIndustry | −0.809 | −0.294 | 0.554 | 1.363 | −0.270 |
| SecondaryIndustry | −0.852 | 0.058 | 0.724 | 1.576 | −0.022 |
| TertiaryIndustry | −0.648 | 0.326 | 0.940 | 1.588 | 0.294 |
| PerGDP | −0.841 | −0.328 | 0.447 | 1.288 | −0.318 |
| RoadDensity | −0.186 | 0.611 | 0.897 | 1.082 | 0.596 |
| BusLinesDensity | −0.209 | 0.641 | 0.949 | 1.158 | 0.601 |
| SubCover | −0.415 | 0.388 | 0.967 | 1.382 | 0.352 |
| Construction | −0.877 | −0.143 | 0.670 | 1.547 | −0.142 |
| Variables | GWR | OLS | ||
|---|---|---|---|---|
| Min. | Median | Max. | ||
| Intercept | −0.015 | 0.000 | 0.051 | −0.002 |
| Vegetation | −0.183 | −0.010 | 0.003 | −0.013 |
| Water | −0.093 | −0.001 | 0.009 | −0.007 |
| PrimaryIndustry | −0.004 | 0.006 | 0.034 | 0.010 |
| TertiaryIndustry | −0.223 | 0.029 | 0.213 | 0.038 |
| PerGDP | −0.683 | −0.065 | −0.016 | −0.037 |
| RoadDensity | −0.075 | −0.011 | 0.045 | −0.024 |
| BusDensity | −0.017 | 0.335 | 0.475 | 0.383 |
| Construction | 0.014 | 0.029 | 0.090 | 0.032 |
| AIC | −39,844.03 | −38,296.97 | ||
| AICc | −39,774.34 | −38,296.94 | ||
| R2 | 0.6197 | 0.5461 | ||
| Adjusted R2 | 0.6157 | 0.5457 | ||
© 2019 by the authors. Licensee MDPI, Basel, Switzerland. This article is an open access article distributed under the terms and conditions of the Creative Commons Attribution (CC BY) license (http://creativecommons.org/licenses/by/4.0/).
Share and Cite
Yang, N.; Li, J.; Lu, B.; Luo, M.; Li, L. Exploring the Spatial Pattern and Influencing Factors of Land Carrying Capacity in Wuhan. Sustainability 2019, 11, 2786. https://doi.org/10.3390/su11102786
Yang N, Li J, Lu B, Luo M, Li L. Exploring the Spatial Pattern and Influencing Factors of Land Carrying Capacity in Wuhan. Sustainability. 2019; 11(10):2786. https://doi.org/10.3390/su11102786
Chicago/Turabian StyleYang, Nana, Jiansong Li, Binbin Lu, Minghai Luo, and Linze Li. 2019. "Exploring the Spatial Pattern and Influencing Factors of Land Carrying Capacity in Wuhan" Sustainability 11, no. 10: 2786. https://doi.org/10.3390/su11102786
APA StyleYang, N., Li, J., Lu, B., Luo, M., & Li, L. (2019). Exploring the Spatial Pattern and Influencing Factors of Land Carrying Capacity in Wuhan. Sustainability, 11(10), 2786. https://doi.org/10.3390/su11102786