Article

Production System Diversification and Livelihood in the Drylands of North Central Mexico

by
Benjamín Figueroa-Sandoval
1,
Martín A. Coronado-Minjarez
1,
Eduviges J. García-Herrera
1,
Artemio Ramírez-López
1,
Dora M. Sangerman-Jarquín
2,* and
Katia A. Figueroa-Rodríguez
3,*
1
Colegio de Postgraduados-Campus San Luis, Programa de Innovación en el Manejo de Recursos Naturales, Calle de Iturbide 73, Salinas de Hidalgo, San Luis Potosí, CP 78622, Mexico
2
INIFAP, Campo Experimental Valle de México, Carretera Los Reyes-Texcoco, km 13.5 Coatlinchán, Texcoco Estado de México, CP 56250, Mexico
3
Colegio de Postgraduados-Campus Córdoba, Programa de Innovación Agroalimentaria Sustentable, Km. 348 Carretera Córdoba-Veracruz, Congregación Manuel León, Amatlán de los Reyes, Veracruz, CP 94953, Mexico
*
Authors to whom correspondence should be addressed.
Sustainability 2019, 11(10), 2750; https://doi.org/10.3390/su11102750
Submission received: 3 April 2019 / Revised: 3 May 2019 / Accepted: 7 May 2019 / Published: 14 May 2019

Abstract

:
Drylands (arid and semi-arid regions) are important regions in the world; they have been disregarded and considered poor undeveloped regions due to their ecological limitations. Farmers in these regions tend towards diversification of production systems in order to achieve livelihood security, and this phenomenon has not been extensively studied. The objective of this study was to create a typology of the production systems present in the Mexican north central drylands, using variables related to production, socioeconomics, and social capital. 1044 interviews were conducted in the semi-arid region of north central Mexico. Analysis of the data allowed for the observation of nine types of production systems distributed in three groups: Subsistence, commercial, and off-farm income systems. The differences observed within these systems are due to generational gaps, gender differences, market orientation, and social capital. It can be concluded that the diversification of the dryland production systems allows for an understanding of why generic public policies have failed to mitigate poverty in these regions. The implications of the study refer to the reconfiguration of Mexican policies for the development of the drylands.

1. Introduction

Poverty is common in the drylands (arid and semi-arid regions) of underdeveloped and developing countries, particularly as a result of ecological, political, and socioeconomic conditions. Their inhabitants suffer from droughts and erosion, torrential rains of short duration that flood crops and increase the incidence of pests, along with food insecurity and the effects of degradation due to overexploitation of communal resources [1,2]. The farm products tend to be generic, and are sold as raw materials or commodities, without industrial processing [3]. In this context, small farmers are unable to benefit from economies of scale, and they have little access to markets and little bargaining power, while their input costs are high, due to a lack of information and access to credit [4].
Diversification is a strategy associated with achieving livelihood security under deteriorating conditions; therefore, livelihood diversification is related to rural poverty, household coping strategies, rural non-farm activity, and rural-urban migration [5]. Diversification in the drylands is common and depends on multiple factors. Previous studies have shown that dryland inhabitants supplement their income with the sale of other by-products: Brooms, mats, crafts, and beer [3]; the diversification of their production, i.e., various crops and livestock at the same time [1]; seeking employment in other sectors; and seasonal migration to nearby cities [6,7] or to other countries [8]. Meanwhile, following diversification strategies depends on previous experience in the production system, distance from the market, farm size, yields, education level, and off-farm income [6]. Therefore, production systems are a result of multiple possible combinations of strategies or decisions.
Another variable that influences the decisions that farmers make in relation to their production system is social capital. Social capital is a particular kind of resource available to an actor, defined by its function in the relations that the actor has with other actors within a network [9]. A network can be understood as a series of bridges that link numerous individuals, where the bridges are made of social capital [10]. Individuals who do best tend to be better connected within their network [11]. Thus, there is a relationship between the proximity among individuals and the ease with which they exchange resources and information with others. In agri-food chains, social capital develops due to interactions with suppliers, customers, and partners, which serve to provide them with information, allowing for advantages in business processes and/or in the acquisition of innovations. This holds true up to a certain point at which very cohesive networks generate repetitive information, limiting the advantages found in the connections between members who are not as close, also known as weak ties [12]; hence the relevance of maintaining external ties. Social capital has been considered and evaluated previously as a livelihood asset [13].
Diversification in the production systems has the tendency to be ignored, despite the relevance it has in its impact on rural development and towards more commercial agricultural systems [13]. This paper investigates Mexican drylands, considered poor regions with limited production strategies due to ecological limitations where farmers follow similar strategies. In order to demonstrate the diversification in the drylands, a production system typology was developed through integrating productive [14] and socioeconomic [15] frameworks, with insights derived from the livelihood diversification literature [5]. The objective was to create a typology of production systems present in the Mexican north central drylands, using variables related to production, socioeconomics, and social capital.

2. Materials and Methods

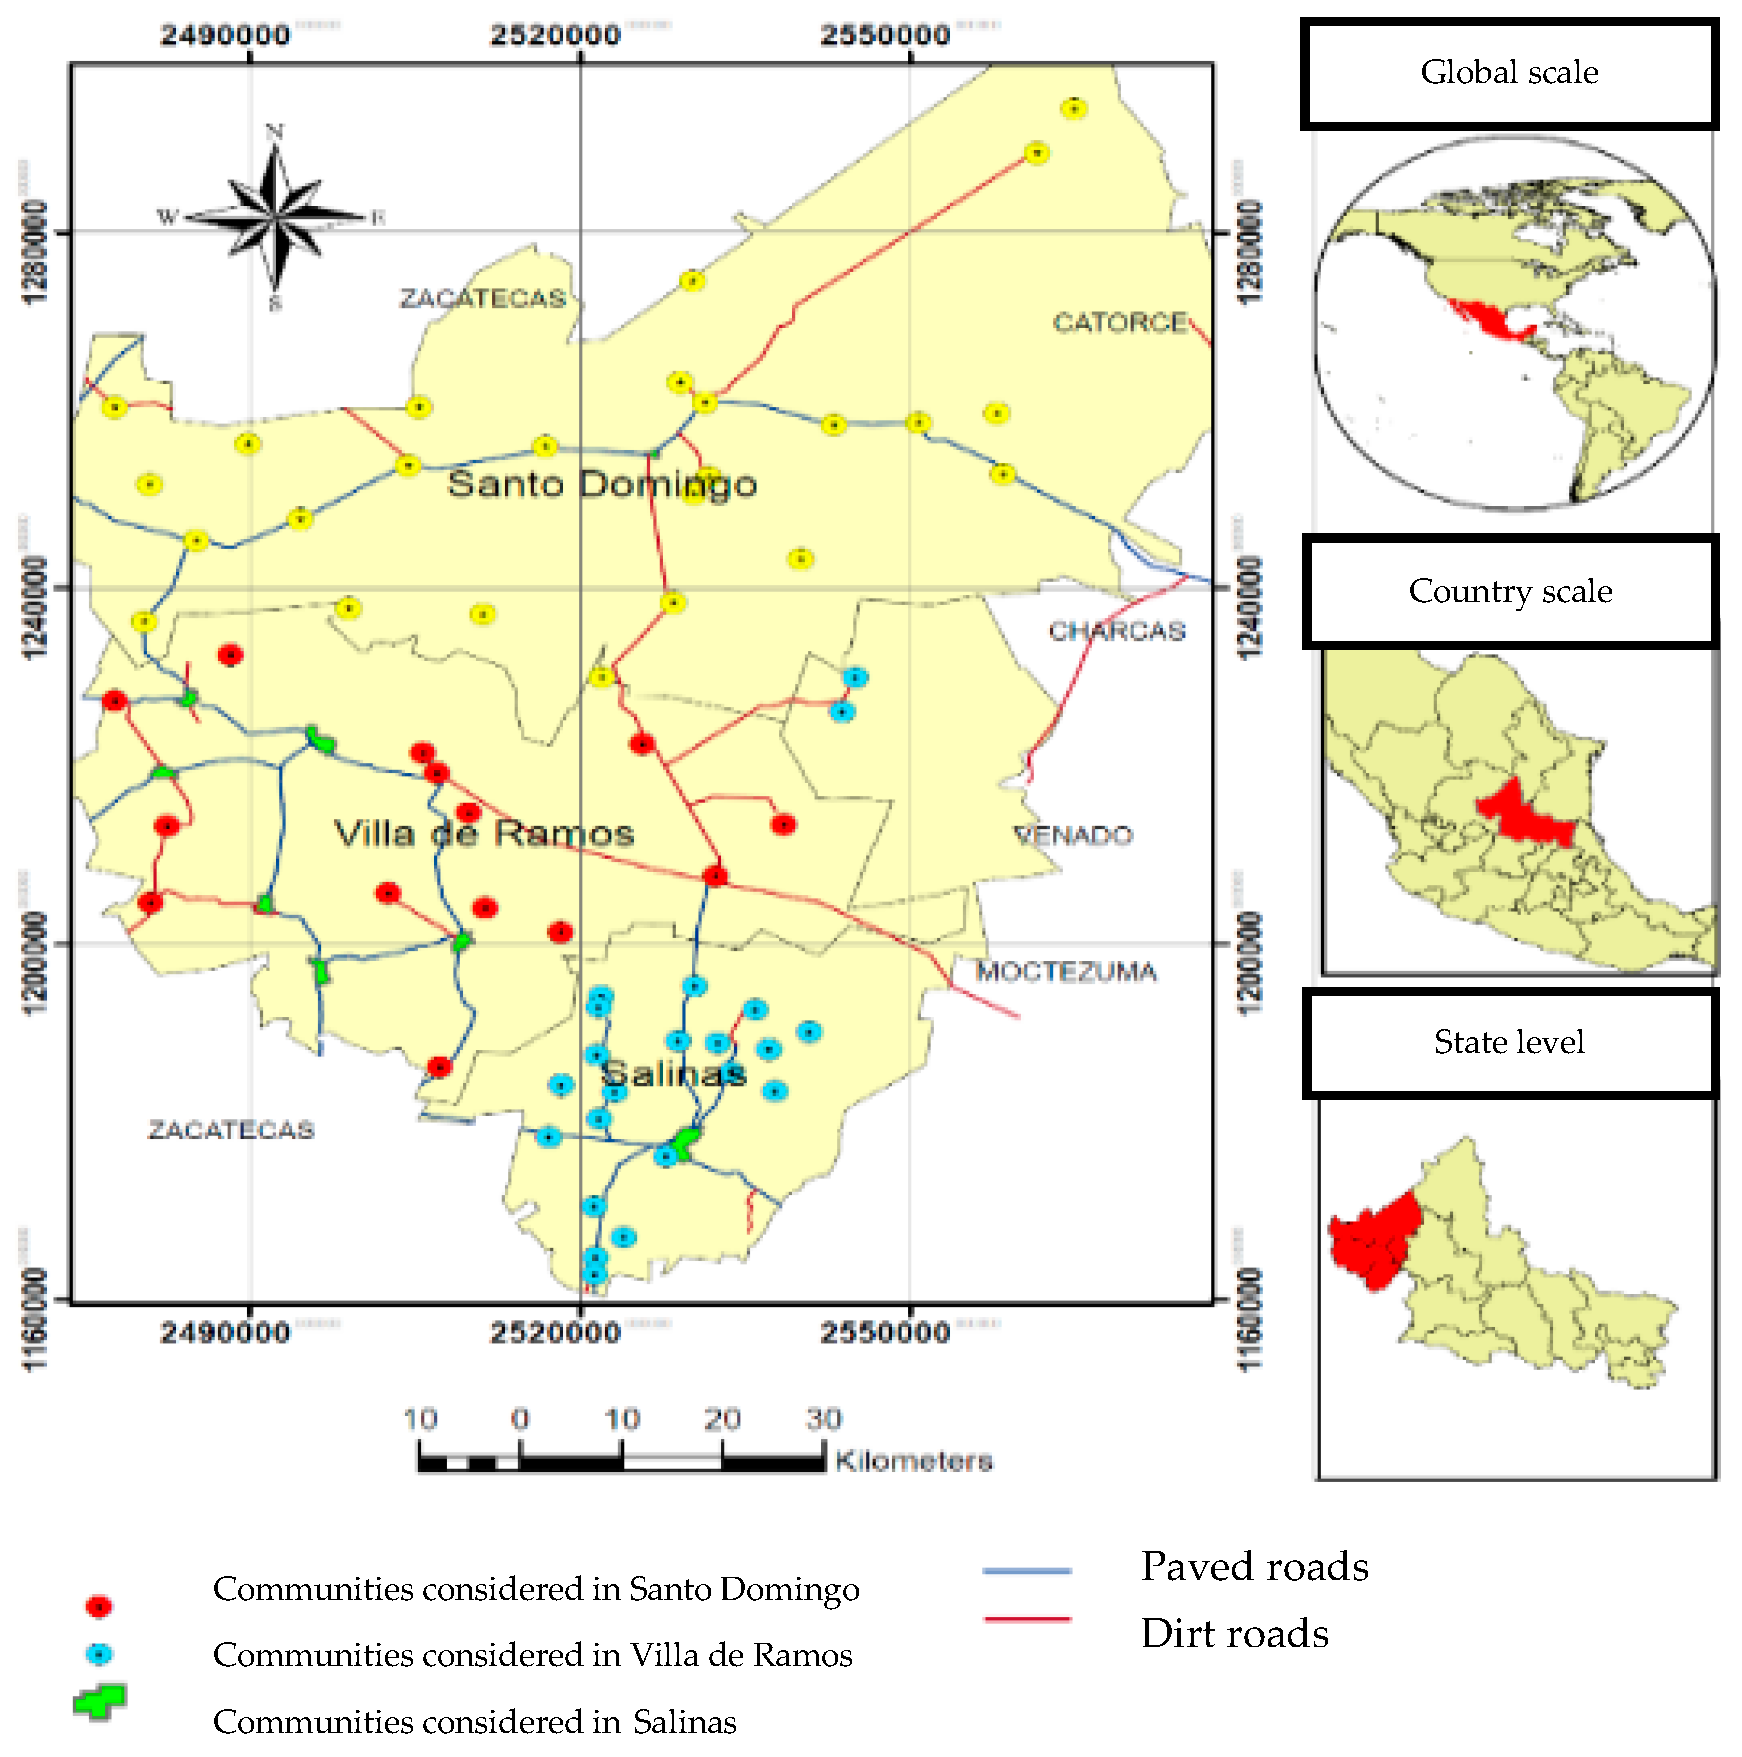
2.1. Study Area, Sampling, and Data Collection

This study was conducted with rural farmers in three municipalities of the highlands of San Luis Potosí: Santo Domingo, Villa de Ramos, and Salinas (Figure 1). The municipalities were selected after consultation and discussion with local government officials following an introduction to the aims of the study.
A total of 1044 face-to-face interviews were conducted. Farmers were randomly selected from the farmer registry of the Ministry of Agriculture of the State of San Luis Potosí, and a stratified random sampling with 95% confidence and 5% error was used in order to select the number of farmers in each of the communities for all the municipalities reported by the National Institute of Geography and Statistics (INEGI).

2.2. Variables

Based on previous studies on production system typologies [16,17,18,19], each farmer was asked about the basic characteristics of the production unit (surface area, type of crop or crops, species and size of herd, off-farm income, number of customers, number of suppliers, agricultural strategy, and livestock development strategy: Table 1), as well as socioeconomic variables (gender, age, number of years as a farmer, and level of education: Table 2). The variables used in the multivariate analysis are presented in Table 1.
There were four possibilities for the agricultural strategy: 0) No agricultural production; 1) monoculture production (a single crop grown on more than 75% of the surface area, such as beans (Phaseolus vulgaris), corn (Zea mays), or another crop such as garlic (Allium sativum), alfalfa (Medicago sativa), oats (Avena sativa), onion (Allium cepa), or chili pepper (Capsicum annuum)); 2) a mix of corn and beans; and 3) a polyculture (more than three mixed crops). The livestock development strategies were as follows: 0) No livestock; 1) cattle; 2) sheep; 3) other species (goats, pigs, or poultry); 4) mixed; and 5) backyard livestock (fewer than 10 heads of different species).
Social capital was measured by asking farmers to give the names of the three farmers with whom they interacted most in their community [20], along with three customers and three suppliers [21]; not all of the farmers were able to name three contacts [22,23]; therefore a proxy variable for social capital was created using the number of names referenced by each respondent. The values of the variable were as follows: 0 = Did not reference anyone, 1 = 1 reference, up to three as a maximum. Therefore, the focus was on the number of contacts and not on the names of the contacts or the quality of the farmers’ relationships with them [23].
Another part of the survey was related to agri-food chain data. Farmers were asked about the point of sale of their main product and the market to which their production was destined (Table 3). These variables were used in order establish the actors’ degree of market orientation.

2.3. Statistical Analysis

There is no single methodology for creating production system typologies; generally, many variables are considered in order to properly understand a region and multivariate statistical analysis, especially cluster analysis, has been considered as a good method [13,17,24]. Therefore, this approach was followed.
A multivariate method was used in order to more efficiently analyze the large number of variables used [17,25,26]. The analysis performed was a cluster analysis based on Ward’s minimum variance method [27]. This method joins clusters whose inertia, or the sum of the principal diagonal of the covariance matrix, is minimal [28]; this method has been shown to be more efficient since the procedure tends to form spherical or compact clusters [29]. The analysis was performed using the CLUSTER procedure [30]; SAS® software, version 9.4. The optimal number of clusters was chosen based on the R2 goodness-of-fit criterion of 0.8. R2 is defined as the between cluster deviance divided by the total deviance, maximizing the R2 implies the maximization of the between-cluster variability, or, equivalently the minimization of within cluster variability, it has been used to determine the number of groups in the data [31]. In order to characterize and compare the identified clusters, the average and standard deviation were calculated for each of them.
To validate the number of clusters obtained, the technique of significance testing for the chosen variables was used for creating the clusters [25]; to this end ANOVA tests (for continuous variables) and chi-square (X2) tests (for categorical variables) were performed. Means and standard deviations of the continuous variables and the frequencies of the categorical variables were calculated. The statistical package used was SPSS® software version 20.

3. Results

3.1. Diversification of the Production Systems in the Drylands

Following Ward’s minimum variance criterion [29], the optimal number of clusters identified for production systems in the highlands of San Luis Potosí was nine. Clusters were clearly independent, except for the number of customers referenced and the point of sale, and significant differences between clusters were observed using ANOVA or a test of the expected distribution of the data (X2; Table 1, Table 2, and Table 3). Therefore, variables are discriminatory and allow for proper differentiation of the production systems and this validates the number of clusters obtained [25].
The number of production units per cluster ranged from 6 to 244. Four clusters had fewer than 65 farmers, characterized as intensive production systems, either in agricultural area or in the size of the herd, and they were considered commercial production systems (cluster 6, cluster 8, and cluster 9). Two clusters presented the highest level of off-farm income (cluster 2 and cluster 3), and these were considered off-farm income production systems. The rest of the clusters (cluster 1, cluster 4, cluster 5, and cluster 7) behaved similarly in terms of agricultural area and a low off-farm income (Figure 2).

3.1.1. Subsistence Systems

The subsistence systems had the largest number of production units (61% of the total units), so this was the typical production system in the studied region. These are production units with mixed production of corn and beans, of fewer than 15 hectares, without livestock or with backyard livestock only, and with moderate off-farm income or none at all. Combining crops is a common activity in dryland production units because of the high risk attributable to drought conditions [32]. Backyard livestock production is also a common activity in various dry regions of Mexico, usually with goats and cows that are kept as a financial cushion [33].
Cluster one was characterized by backyard livestock with mixed production of corn and beans. This group had the second-highest number of production units. The average number of hectares was lower than that of the other groups, and off-farm income was low. Cluster four had the highest number of production units; half of them mix corn and beans, one-third have monoculture, and the rest plant a mixture of several crops; 60% had no livestock and the rest mainly had large herds of cattle and minor species (goats, pigs, and poultry). One-fourth of their income is from off-farm sources. In cluster five, off-farm income was almost non-existent, with mixed corn and beans and predominantly small herds of cattle. Cluster seven, was composed of farmers who had herds of cattle, and the mean surface area of the production units was slightly lower than the regional mean. This is the only group characterized by the mixing of several crops in the production unit.

3.1.2. Commercial Systems

The commercial system is characterized by livestock farmers who produce cattle or mixed herds of goats, pigs, and poultry, or by agricultural producers with a larger agricultural area than the regional mean, or by a combination of both strategies. In order to confirm the commercial nature of this category, it can be seen that these clusters (cluster 6, cluster 8, and cluster 9) reported more suppliers than the regional mean and more customers than the groups included in the subsistence category, which is consistent with previous studies in which entrepreneurial producers are oriented towards commercial systems [34]. Nine percent of the production units in this study belong to this category. Previous publications have shown that this type of large-scale agriculture occurs in dry regions, especially in those that are close to highly-populated areas; however, their yields are still lower than those of other non-dryland regions and their strategy is the expansion and not the intensification of production [35].
In particular, cluster six was characterized by farms with three times more agricultural area than the regional mean, with mixed corn and beans. These farmers had mixed herds, and the level of off-farm income was low. Cluster eight was composed of livestock farmers. Their herds were mixed, and they had little agricultural area, which is usually planted with a mixture of corn and beans. Off-farm income was low. Finally, cluster nine comprises the smallest number of production units. These were livestock farmers, mainly cattle with a large number of heads; their agricultural area, which is double that of the regional average, is dedicated to corn and beans and is occasionally used to feed the livestock. Off-farm income was low.

3.1.3. Off-farm Income Systems

The off-farm income system receives money via remittances from migrant relatives or employment in activities outside the community such as working as a day laborer or hired hand, or in another related activity. Our results show that 30% of the surveyed population belonged to this system. These farmers showed similar characteristics to those of the subsistence farmers in terms of agricultural area and herd size. Two clusters were identified. Farmers in cluster two depended on a significant amount of off-farm income. Their farming system mixes corn and beans and has backyard livestock. The farmers belonging to cluster three showed significant off-farm income and depended on agriculture with an agricultural area lower than the regional mean along with backyard livestock.

3.2. Socioeconomic Characteristics of the Farmers by Production System

In the socioeconomic variables, significant differences were observed among groups, and the differences can be explained by comparing cluster one (elderly adults, whose age is proportional to the number of years of experience as a farmer, meaning that they have been farmers most of their lives, and also proportional to the percentage of them who had no schooling (60%)) with cluster four, also considered subsistence farmers, with an average age of 50 and a primary (62%) and secondary (18%) level of education. This might be presented as a second generation of farmers, who, despite having improved their educational levels, did not create any changes at their farms, reinforcing the idea that “the poor stay poor” [36], and that schooling is not sufficient to produce changes in the production systems adopted by rural inhabitants. Furthermore, in cluster nine (commercial system), the majority of the farmers had only a primary school education; thus, entrepreneurship in the drylands can be explained by characteristics other than the individuals’ level of education.
As for gender, only cluster two showed significant differences; where 18.6% of the respondents were women. This cluster belongs to the off-farm income production system, so its income comes from the husbands or children who migrated and support them, leaving the women in charge of the farm but their main source of income does not depend on agricultural activities. Traditionally, in rural Mexico, women do not work in agricultural activities, but in this case, and because of migration, they have no other choice.

3.3. Market Orientation

The commercial decisions used as variables to compare farmers in the different production systems were point of sale and market orientation (Table 3). There was no significant statistical difference for point of sale. Most of the farmers sold the farm products at the municipal seat (around 50%) and the second most common strategy was a combination of places, selling their production at the farm gates, the municipality, or other (Figure 3).
The second variable was market orientation (Figure 4). Most of the farmers indicated that their market was mixed, which combines local, state, and national markets (27.1% or the farmers). The second most important option was to sell locally (26% of the total), while 16% indicated that their market was national, 10% sold at the state level, and only one farmer indicated that production was intended for export. The rest of the farmers reported that the farm production was for self-consumption (21%). In several cases, self-consumption referred to the practice of using farm production as raw products for fattening cattle, especially in the case of the commercial production system; therefore self-consumption did not necessarily mean that the production was consumed by the family.

3.4. Social Capital

A single region can have similar natural conditions throughout its area such as climate and soil, but there can be intra-regional differences in factors such as human and social capital [18]. In the previous section, an emphasis on the relationship between social capital (e.g., number of relationships, type of contact) and the market was made; e.g., where a better-connected actor (farmer) who has more relationships with customers and suppliers obtains advantages in comparing and accessing different markets. In this study, the definition of social capital is the number of names provided by the respondent in terms of other farmers, customers, and suppliers, under the premise that a larger number of references implies more social capital (Figure 5).
The respondents were asked to reference other farmers whom they knew, who were engaged in the same activity within their communities, as a proxy variable for social capital. Ninety three percent of the farmers gave at least one reference, 74% gave a second reference, and only 45% gave a third reference. As shown in Table 1, there were significant differences between the clusters, especially due to the low number of references given by the elderly subsistence farmers (cluster 1) compared to the commercial farmers (cluster 9).
Of the total number of farmers surveyed, 215 reported not having any customers (21%), 40% reported having one customer, 12% reported two customers, two farmers reported that they had four clients, one farmer reported five customers, and one farmer reported ten customers. With regard to customer references, of those farmers who reported that they did have customers, 270 did not reference anyone (33%) and 14 could not provide one name (2%); thus, 209 customer names were given. There are two explanations for the large number of customers referenced locally: That nicknames create duplication, and that there are several local intermediaries, which is common for rural areas [37]. On average, the respondents gave the name of one customer and among clusters there were no statistical differences for the number of customers referenced.
As for the suppliers, 74% of the total farmers reported not having suppliers (768 of the 1044 surveyed), 212 reported one supplier, 56 reported two suppliers, and three farmers reported that they had three suppliers. As with the customer references, there were 84 names that were reported only once, suggesting duplication due to nicknames. The supplier most commonly referenced were veterinarians, hardware stores, and livestock breeding and forage cultivation facilities in nearby towns. There were significant differences in the number of referenced suppliers, but this can be explained by the fact that the commercial farmers (cluster 9) named more suppliers than the rest of the clusters.

4. Discussion

Drylands, especially in underdeveloped and developing countries, have been characterized as marginalized areas with high levels of poverty [38], where various farming strategies are used [39]. Based on the analysis of the data, nine production systems in the region were identified, which were grouped as follows: Subsistence, commercial, and off-farm income systems. Findings were consistent with previous studies that indicate the presence of these three types of production systems in other regions of the world, e.g., in India, they found that 70% of the farms in dryland farming systems were small and extensive and 20% were irrigation based and intensive, the rest were off-farm based and irrigation based semi-intensive [18]. It can be observed that in both cases, Indian and Mexican drylands households’ livelihood strategies can be classified as: Extensive, intensive, and off-farm based. Other studies have also pointed out the heterogeneity of households in rural areas [40]. In the case of the north central Mexican drylands agricultural-led would be the most common livelihood capital strategy, where agricultural income accounts for the largest proportion of total household income and this is complimented by government subsidies.
A notable difference in the findings of this study is that farmers in the northern north central Mexican drylands had larger agricultural areas (15.10 ha) compared to those reported for other drylands, e.g., India (2.7 ha) [18], and the difference is even greater compared to other regions of Mexico (2.5 ha) [2,33]. Migration can explain the phenomena; in this region only one son or daughter remains in the community and he or she inherits the land; therefore, farmers do not divide the land among all of their children as in other regions, which normally leads to land-holdings fragmentation [41].
Regarding the production systems, a previous study classified 48.8% of the farms in a dry region of India as small and extensive [18] versus 60.8% of farms classified as subsistence in the present study. This difference can be attributed to labor migration, as the inhabitants of the present particular region have a long tradition of migration to the United States dating from 1882 [41]. Production systems that depended on off-farm income have been documented previously; the results of this study indicate a general average of 20% off-farm income versus 35.7% [18] and 48% [42] in India and levels between 40% and 96% in Africa [16]. For clusters 2 and 3, off-farm income values were 81% and 34%, respectively, while the rest of the clusters had values close to zero, far below the trends in other dry regions of the world [16,18]. This is consistent with the fact that the child who remains must live off his or her farm, and it is mainly women who depend on remittances. The farmers who do not migrate normally participate in various federal government programs, this allows farmers to survive [2,43]. Therefore, most of the farmers in the studied drylands tend to specialize in on-farm income-generating strategies, the same phenomena have been reported in some African countries where income is agriculture-based [44]. In some cases, tourism has gradually come to play an important role in the livelihood activities of households [14], in the north Mexican drylands studied, tourism was not present, therefore the off-farm income options is reduced to remittances. Even more, in central Texas, USA, 39% of farmers own land exclusively for lifestyle reasons [45], this was not the case for the present study where farmers’ income depends on the agriculture or diversification strategies.
In the case of gender, previous studies in Nepal have found that women in rural areas were attracted to market-oriented commercial farming and rural enterprises [46], this was not the case for the women in the north Mexican drylands as they mainly manage the farm in the absence of men. Furthermore, subsistence production systems tend to perpetuate themselves due to problems such as limited financial resources [47] and social factors. Two different clusters of the subsistence production systems were composed of two generations of farmers following the same subsistence production system; this is common in rural areas [16] and has been explained by the social structure [39] in which the generational repetition of patterns confirms the identity of network members and their ability to cooperate with one another [48]; in other words, since there is a social incentive to repeat patterns, individuals who are similar are better accepted.
Regarding the point of sale, the dispersion, geographical distance of the dryland farms, the lack of public transportation, and limited road access [33] make municipal seats the places where most commercial exchanges take place. Therefore, they become poles of local development [49]. The findings of this study are consistent with previous studies reporting that the heterogeneity of households in rural areas of Mexico farmers tend to travel to the municipal seat on market days to sell their products [50,51]; once there, they take the opportunity to purchase supplies, clothing, food, or use services that they require, e.g., banking. On the contrary, commercial farmers sell at the farm gate, as they produce higher volumes; therefore, they have more bargaining power, and achieve economies of scale and cost reduction in transportation of their goods.
Farmers in dry regions are therefore facing imperfect markets [32]. Climatic conditions make it difficult to predict yields and the final quality of the agricultural products that they produce. In addition, the products are mostly commodities, and there is not a wide dispersion of production, which complicates the signing of contracts with customers [52]. Finally, it should be noted that leaving the farm in search of markets requires resources and a broad knowledge of the market, or having contacts who are knowledgeable about markets [9], which places emphasis on the relationships that these farmers have [11]. The personal characteristics of the farmers should also be considered [13]; for example, previous authors have found three types of producers: Good, mad, and lazy, with different characteristics and activities at the production unit [53]. In a study of farmers in South African Kalahari, authors found that situational factors such as financial resources, farm infrastructure, farm size, and land tenure challenged or constrained farmers’ land management practices [47]. A combination of all of the factors discussed previously explains why the farmers destine their products to the domestic market and local customers.
With regard to social capital, the results show that the level of social capital through the agri-food chain is low; neither suppliers or customers play an important role; therefore, innovation diffusion becomes difficult [50], thus limiting the transition to commercial production units. What is more, elderly farmers gave fewer names and they mainly referenced their children, which leads to weak ties that do not allow for an increase in social capital [12]. In contrast, the commercial farmers seem to be more active in their networks, using them as a strategy to obtain economic advantages. The present findings are in line with previous studies showing that social capital and human capital can explain differences in the trajectory of a production unit, in terms of growth or lack of growth [54].

5. Conclusions

Despite the relevance of Mexico’s drylands, there are few studies regarding the typology of production systems present there. The research objective was to create a typology of production systems present in the Mexican north central drylands, usng variables related to production, socioeconomics, and social capital. The first challenge was to answer the following question: Which variables should be used in order to characterize and differentiate the production units in a region? The second challenge was to develop a clearer understanding of these rural farmers using the production system approach based on livelihood diversification literature.
In response to the first challenge, and unlike other studies, the number of variables that were used in order to characterize the production systems was quite low; this was due to an interest in creating theoretically-based instruments that were more appropriate for the fieldwork in elderly populations or populations with limited time for responding to a survey. This study showed that an appropriate selection of variables analyzed by a multivariate method allows for proper classification of production systems.
As for the second challenge, the production system approach based on livelihood diversification literature as a theoretical framework was most appropriate for the characterization of the drylands, since it allowed us to group the farmers generally, into subsistence, commercial, and off-farm income production systems. At the same time, the method allowed us to observe differences within these systems that explain phenomena such as generational gaps and other variations due to gender, market orientation, and social capital.
The implications of the research are related to public policy. The diversification of the dryland production systems observed in this study allows for a good understanding of why generic public policies have failed to mitigate poverty in these regions. Unfortunately, a policy that seeks to intensify production (improved seeds or livestock) has no future, because of the local agroclimatic conditions; a better alternative is to expand production, which is also difficult due to the lack of resources needed in order to increase the size of the production units, leaving the subsistence farmers with little growth potential. This leaves us with the task of reassessing agricultural policies for the drylands. Concerning the limitations of the study, the variable irrigation was not included in this study but it should be considered in order to properly classify dryland production units since it increases the intensity of production systems [18]; normally it is disregarded due to the nature of the region, but some farms do report irrigation infrastructure.

Author Contributions

Conceptualization, B.F.-S.; Formal analysis, B.F.-S.; Investigation, M.A.C.-M., E.J.G.-H. and A.R.-L.; Writing – original draft, K.A.F.-R.; Writing – review & editing, D.M.S.-J.

Funding

This research was funded by the Colegio de Postgraduados.

Acknowledgments

The authors acknowledge CONACyT for the grant received by Martin A. Coronado-Minjarez and Artemio Ramírez-López. We would also like to thank Patrick Weill for his review of the English version. Katia A. Figueroa R. wrote the first draft while she was a Visiting Scholar at Oklahoma State University MIAP´s program.

Conflicts of Interest

The authors declare no conflict of interest.

References

  1. Ulrich, A.; Ifejika Speranza, C.; Roden, P.; Kiteme, B.; Wiesmann, U.; Nüsser, M. Small-scale farming in semi-arid areas: Livelihood dynamics between 1997 and 2010 in Laikipia, Kenya. J. Rural Stud. 2012, 28, 241–251. [Google Scholar] [CrossRef]
  2. Vásquez-León, M. One decade of drought and two of neoliberal reforms in the Sierra Sonorense: Responses by the rural poor. South. Rural Sociol. 2009, 24, 44–66. [Google Scholar]
  3. Shackleton, S.; Campbell, B.; Lotz-Sisitka, H.; Shackleton, C. Links between the local trade in natural products, livelihoods and poverty alleviation in a semi-arid region of South Africa. World Dev. 2008, 36, 505–526. [Google Scholar] [CrossRef]
  4. Latynskiy, E.; Berger, T. Networks of rural producer organizations in Uganda: What can be done to make them work better? World Dev. 2016, 78, 572–586. [Google Scholar] [CrossRef]
  5. Ellis, F. Household strategies and rural livelihood diversification. J. Dev. Stud. 1998, 35, 1–38. [Google Scholar] [CrossRef]
  6. Zhang, W.-S.; Li, F.-M.; Xiong, Y.-C.; Xia, Q. Econometric analysis of the determinants of adoption of raising sheep in folds by farmers in the semiarid Loess Plateau of China. Ecol. Econ. 2012, 74, 145–152. [Google Scholar] [CrossRef]
  7. Cunha, A.P.M.; Alvalá, R.C.; Nobre, C.A.; Carvalho, M.A. Monitoring vegetative drought dynamics in the Brazilian semiarid region. Agric. For. Meteorol. 2015, 214–215, 494–505. [Google Scholar] [CrossRef]
  8. Cohen, I.S.; Spring, Ú.O.; Padilla, G.D.; Paredes, J.C.; Inzunza Ibarra, M.A.; López, R.L.; Díaz, J.V. Forced migration, climate change, mitigation and adaptive policies in Mexico: Some functional relationships. Int. Migr. 2013, 51, 53–72. [Google Scholar] [CrossRef]
  9. Coleman, J.S. Social capital in the creation of human capital. Am. J. Sociol. 1988, 94, S95–S120. [Google Scholar] [CrossRef]
  10. Anderson, A.R.; Jack, S.L. The articulation of social capital in entrepreneurial networks: A glue or a lubricant? Enterp. Reg. Dev. 2002, 14, 193–210. [Google Scholar] [CrossRef]
  11. Burt, R.S. The network structure of social capital. Res. Org. Behav. 2000, 22, 345–423. [Google Scholar] [CrossRef]
  12. Granovetter, M. The impact of social structure on economic outcomes. J. Econ. Persp. 2005, 19, 33–50. [Google Scholar] [CrossRef]
  13. Chipfupa, U.; Wale, E. Farmer typology formulation accounting for psychological capital: Implications for on-farm entrepreneurial development. Dev. Pract. 2018, 28, 600–614. [Google Scholar] [CrossRef]
  14. García-Arias, A.-I.; Vázquez-González, I.; Sineiro-García, F.; Pérez-Fra, M. Farm diversification strategies in northwestern Spain: Factors affecting transitional pathways. Land Use Policy 2015, 49, 413–425. [Google Scholar] [CrossRef]
  15. Martin-Collado, D.; Soini, K.; Mäki-Tanila, A.; Toro, M.A.; Díaz, C. Defining farmer typology to analyze the current state and development prospects of livestock breeds: The Avileña-Negra Ibérica beef cattle breed as a case study. Livest. Sci. 2014, 169, 137–145. [Google Scholar] [CrossRef]
  16. Tittonell, P.; Muriuki, A.; Shepherd, K.D.; Mugendi, D.; Kaizzi, K.C.; Okeyo, J.; Verchot, L.; Coe, R.; Vanlauwe, B. The diversity of rural livelihoods and their influence on soil fertility in agricultural systems of East Africa—A typology of smallholder farms. Agric. Syst. 2010, 103, 83–97. [Google Scholar] [CrossRef]
  17. Köbrich, C.; Rehman, T.; Khan, M. Typification of farming systems for constructing representative farm models: Two illustrations of the application of multi-variate analyses in Chile and Pakistan. Agric. Syst. 2003, 76, 141–157. [Google Scholar] [CrossRef]
  18. Haileslassie, A.; Craufurd, P.; Thiagarajah, R.; Kumar, S.; Whitbread, A.; Rathor, A.; Blummel, M.; Ericsson, P.; Kakumanu, K.R. Empirical evaluation of sustainability of divergent farms in the dryland farming systems of India. Ecol. Indic. 2016, 60, 710–723. [Google Scholar] [CrossRef]
  19. Kamau, J.W.; Stellmacher, T.; Biber-Freudenberger, L.; Borgemeister, C. Organic and conventional agriculture in Kenya: A typology of smallholder farms in Kajiado and Murang’a counties. J. Rural. Stud. 2018, 57, 171–185. [Google Scholar] [CrossRef]
  20. Coleman, J.; Katz, E.; Menzel, H. The diffusion of an innovation among physicians. Sociometry 1957, 20, 253–270. [Google Scholar] [CrossRef]
  21. Moran, P. Structural vs. relational embeddedness: Social capital and managerial performance. Strat. Manag. J. 2005, 26, 1129–1151. [Google Scholar] [CrossRef]
  22. Burt, R.S. A note on sociometric order in the general social survey network data. Soc. Netw. 1986, 8, 149–189. [Google Scholar] [CrossRef]
  23. Merluzzi, J.; Burt, R.S. How many names are enough? Identifying network effects with the least set of listed contacts. Soc. Netw. 2013, 35, 331–337. [Google Scholar] [CrossRef]
  24. Nainggolan, D.; Termansen, M.; Reed, M.S.; Cebollero, E.D.; Hubacek, K. Farmer typology, future scenarios and the implications for ecosystem service provision: A case study from south-eastern Spain. Reg. Environ. Change 2013, 13, 601–614. [Google Scholar] [CrossRef]
  25. Bernhardt, K.J.; Allen, J.C.; Helmers, G.A. Using cluster analysis to classify farms for conventional/alternative systems research. Rev. Agric. Econ. 1996, 18, 599–611. [Google Scholar] [CrossRef]
  26. Usai, M.G.; Casu, S.; Molle, G.; Decandia, M.; Ligios, S.; Carta, A. Using cluster analysis to characterize the goat farming system in Sardinia. Livest. Sci. 2006, 104, 63–76. [Google Scholar] [CrossRef]
  27. Stevens, J.P. Applied Multivariate Statistics for the Social Sciences, 4th ed.; Lawrence Erlbaum Associates Inc.: New Jersey, NY, USA, 2002. [Google Scholar]
  28. Alvarez Caceres, R. Estadística Multivariante y no Paramétrica con SPSS: Aplicación a las Ciencias de la Salud; Ediciones Díaz de Santos: Madrid, Spain, 1994; 408p. [Google Scholar]
  29. Ward, J.H. Hierarchical grouping to optimize an objective function. J. Am. Stat. Assoc. 1963, 58, 236–244. [Google Scholar] [CrossRef]
  30. SAS. SAS Institute Inc., SAS/STAT User’s Guide, Version 6, 4th ed.; SAS Institute Inc.: Cary, NC, USA, 1989; Volume 1. [Google Scholar]
  31. Loperfido, N.; Tarpey, T. Some remarks on the R2 for clustering. Stat. Anal. Data Min. ASA Data Sci. J. 2018, 11, 135–148. [Google Scholar] [CrossRef]
  32. Nagarajan, L.; Smale, M.; Glewwe, P. Determinants of millet diversity at the household-farm and village-community levels in the drylands of India: The role of local seed systems. Agric. Econ. 2007, 36, 157–167. [Google Scholar] [CrossRef]
  33. Gravel, N. Mexican smallholders adrift: The urgent need for a new social contract in rural Mexico. J. Latin Am. Geogr. 2007, 6, 77–98. [Google Scholar] [CrossRef]
  34. Engler, J.-O.; Abson, D.J.; Feller, R.; Hanspach, J.; von Wehrden, H. A social-ecological typology of rangelands based on rainfall variability and farming type. J. Arid Environ. 2018, 148, 65–73. [Google Scholar] [CrossRef]
  35. Enfors, E. Social-ecological traps and transformations in dryland agro-ecosystems: Using water system innovations to change the trajectory of development. Glob. Environ. Change 2013, 23, 51–60. [Google Scholar] [CrossRef]
  36. Naschold, F. “The poor stay poor”: Household asset poverty traps in rural semi-arid India. World Dev. 2012, 40, 2033–2043. [Google Scholar] [CrossRef]
  37. Tran, N.; Bailey, C.; Wilson, N.; Phillips, M. Governance of global value chains in response to food safety and certification standards: The case of shrimp from Vietnam. World Dev. 2013, 45, 325–336. [Google Scholar] [CrossRef]
  38. Easdale, M.H.; Domptail, S.E. Fate can be changed! Arid rangelands in a globalizing world—A complementary co-evolutionary perspective on the current “desert syndrome”. J. Arid Environ. 2014, 100–101, 52–62. [Google Scholar] [CrossRef]
  39. Ruben, R.; Pender, J. Rural diversity and heterogeneity in less-favoured areas: The quest for policy targeting. Food Policy 2004, 29, 303–320. [Google Scholar] [CrossRef]
  40. Cortez-Arriola, J.; Rossing, W.A.H.; Massiotti, R.D.A.; Scholberg, J.M.S.; Groot, J.C.J.; Tittonell, P. Leverages for on-farm innovation from farm typologies? An illustration for family-based dairy farms in north-west Michoacán, Mexico. Agric. Syst. 2015, 135, 66–76. [Google Scholar] [CrossRef]
  41. Ochoa, A.C.; Solís, V.V. International migration, money remittance and economic territorial structure changes in the municipality of Cerritos, San Luis Potosi, Mexico. Rev. de Geogr. Norte Gd. 2009, 42, 5–20. [Google Scholar]
  42. Rigg, J. Land, farming, livelihoods, and poverty: Rethinking the links in the Rural South. World Dev. 2006, 34, 180–202. [Google Scholar] [CrossRef]
  43. De Figueiredo Guilherme, R.; De Farias, D.A.; Alves, J.R.A.; Da Costa, D.F.; Pinheiro, R.R.; Alves, F.S.F.; De Azevedo, S.S.; Alves, C.J. Characterization and typology of sheep and goat production systems in the State of Paraíba, a semi-arid region of northeastern Brazil. Semin. Cienc. Agrar. 2017, 38, 2163–2178. [Google Scholar] [CrossRef]
  44. Davis, B.; Di Giuseppe, S.; Zezza, A. Are African households (not) leaving agriculture? Patterns of households’ income sources in rural Sub-Saharan Africa. Food Policy 2017, 67, 153–174. [Google Scholar] [CrossRef] [PubMed] [Green Version]
  45. Sorice, M.G.; Kreuter, U.P.; Wilcox, B.P.; Fox, W.E. Classifying land-ownership motivations in central, Texas, USA: A first step in understanding drivers of large-scale land cover change. J. Arid. Environ. 2012, 80, 56–64. [Google Scholar] [CrossRef]
  46. Paudel Khatiwada, S.; Deng, W.; Paudel, B.; Khatiwada, J.R.; Zhang, J.; Wan, J. A gender analysis of changing livelihood activities in the rural areas of central Nepal. Sustainability 2018, 10, 4034. [Google Scholar] [CrossRef]
  47. Kong, T.M.; Austin, D.E.; Kellner, K.; Orr, B.J. The interplay of knowledge, attitude and practice of livestock farmers’ land management against desertification in the South African Kalahari. J. Arid. Environ. 2014, 105, 12–21. [Google Scholar] [CrossRef]
  48. Milton, L.P.; Westphal, J.D. Identity confirmation networks and cooperation in work groups. Acad. Manag. J. 2005, 48, 191–212. [Google Scholar] [CrossRef]
  49. Scott, A.; Storper, M. Regions, globalization, development. Reg. Stud. 2003, 37, 579–593. [Google Scholar] [CrossRef]
  50. Aguilar-Gallegos, N.; Muñoz-Rodríguez, M.; Santoyo-Cortés, H.; Aguilar-Ávila, J.; Klerkx, L. Information networks that generate economic value: A study on clusters of adopters of new or improved technologies and practices among oil palm growers in Mexico. Agric. Syst. 2015, 135, 122–132. [Google Scholar] [CrossRef]
  51. Charcas Salazar, H.; Aguirre Rivera, J.R.; Reyes Agüero, J.A.; Durán-García, H.M. Runoff agriculture in the highlands of San Luis Potosí state, Mexico. Interciencia 2010, 35, 716–722. [Google Scholar]
  52. Williamson, O.E. Transaction-cost economics: The governance of contractual relations. J. Law Econ. 1979, 22, 233–261. [Google Scholar] [CrossRef]
  53. Fajardo, B.G.; Hernández, M.E.O.; McDonagh, J.; Arteaga, G.A.; Lezama, P.M. Land management strategies and their implications for Mazahua farmers’ livelihoods in the highlands of Central Mexico. Misc. Geogr. 2016, 20, 5–12. [Google Scholar]
  54. Westbrooke, V.; Nuthall, P. Why small farms persist? The influence of farmers’ characteristics on farm growth and development. The case of smaller dairy farmers in NZ. Aust. J. Agric. Resour. Econ. 2017, 61, 663–684. [Google Scholar] [CrossRef]
Figure 1. Study area.
Sustainability 11 02750 g001
Figure 2. Cluster distribution for hectares, herd size and off-farm income: (a) Hectares, (b) herd size, and (c) off-farm income (%).
Sustainability 11 02750 g002
Figure 3. Point of sale for each cluster (% of responses).
Sustainability 11 02750 g003
Figure 4. Market orientation for each cluster (% of responses).
Sustainability 11 02750 g004
Figure 5. Average number of references by type of contact for the different production systems.
Sustainability 11 02750 g005
Table 1. Descriptive statistics of variables by cluster*.
Cluster123456789TotalFSig
Farmers20817713424415263312961044
Hectares9.5 a9.8 ab13.1 ab18.0 b14.1 ab52.2 d14.3 ab12.2 ab38.8 c15.196.680.00
Herd size3.1 a10.7 ab7.0 ab82.2 d1.7 a16.5 b29.6 c159.3 e419.2 f21.01028.900.00
Off-farm income (%)1.4 a80.7 d39.1 c16.6 b0.1 a0.7 a1.0 a4.7 a5.0 a20.0768.110.00
SC Farmers1.9 a2.1 ab2.2 ab2.2 ab2.3 ab2.4 ab2.1 ab2.2 ab2.7 b2.13.720.00
SC Customers1.51.71.21.51.31.41.51.41.81.51.790.08
SC Suppliers0.3 a0.3 a0.4 a0.5 a0.2 a0.4 a0.4 a0.5 a1.0 b0.34.520.00
Ppal Agri. Syst.222222320 37.22 +0.04
Ppal Livest. Syst.555414142 612.93 +0.00
(*) Analysis of variance (ANOVA). F: F-statistic. a, b, c, d, e, f: Means with different letters are statistically significant (p ≤ 0.05). Ppal Agri Syst: 0) No agriculture, 1) monoculture, 2) mixed corn and bean, and 3) over three crops mixed. Ppal Livest Syst: 0) No livestock, 1) cattle, 2) sheep, 3) other species, and 4) mixed. SC Social capital (+) X2 chi-squared coefficient (p ≤ 0.05).
Table 2. Descriptive statistics of the socioeconomic variables by cluster*.
Cluster123456789TotalFSig
Age71.9 c43.5 a51.2 ab49.5 ab57.7 b58.3 b51.6 ab53.6 b58.3 b55.183.20.000
Years as farmer48.2 c24.3 a28.4 ab28.0 ab37.1 bc33.6 ab38.2 bc31.4 ab38.5 bc33.639.30.000
Women (%)11.118.66.75.76.611.16.56.909.625.7 +0.001
Education (%)
No schooling59.914.115.719.718.430.26.513.833.324.8169.6 +0.000
Primary43.859.360.452.061.847.674.2055.266.754.7
Secondary2.921.519.423.017.717.519.4017.20.016.7
High School0.55.12.24.12.64.80.006.90.03.1
University0.00.02.21.20.00.00.006.90.00.8
(*) Analysis of variance (ANOVA). F: F-statistic. a, b, c: Means with different letters are statistically significant, (+) X2 chi-squared coefficient (p ≤ 0.05).
Table 3. Descriptive statistics of the market orientation variables by cluster.
Cluster123456789TotalX2Sig
Point of sale (%)
Farm gate3.87.36.04.52.04.80.06.916.74.729.4 +0.205
Municipality54.350.349.354.449.342.954.824.150.050.8
Other8.79.611.210.215.817.512.910.316.711.3
Mixed33.232.833.630.732.934.932.358.616.733.2
Market orientation (%)
Local28.824.330.625.024.328.622.613.833.326.190.7 +0.000
State7.79.65.212.78.615.912.93.416.79.6
National10.616.911.220.115.812.732.320.716.715.8
Export0.00.00.00.00.00.00.03.40.00.1
Own consumption23.616.428.418.423.022.20.041.40.021.3
Mixed29.332.824.623.828.320.632.317.233.327.1
(+) X2 chi-squared coefficient (p ≤ 0.05).

