1. Introduction
Recently, international trade has greatly increased with more participation in global production and trade by vertical specialization in tasks. The role of global value chains (GVCs) in shaping international trade has important implications for economic growth and sustainable development according to Fessehaie and Morris [
1]. As a result, the flows of value-added contributing to capital investment and employment, have become a most debated topic.
This study on the role of value-added exports within a bilateral trading partner aims to improve our understanding of the sustainable linkage between GVCs, international trade, and free trade policies. Our findings on the influential role of intermediate trade will contribute to improving international trade policies for GVCs, which could be critical to reach economic growth and sustainable development objectives.
Value-added international trade focused on GVCs describes an approach used to estimate the sources of value-added to produce goods and services. Foster-Mcgregor and Stehrer [
2] use the trade factor content of Trefler and Zhu [
3] to decompose the value-added content of trade into foreign and domestic components. Recently, the foreign content of exports has increased, and value-added trade is more considered because gross trade statistics overestimate exports and imports.
Intuitively, as countries become more integrated into global production networks, currency depreciation has less of a positive impact on the competitiveness of final goods exports. The rise of the exchange rate improves the trade balance by increasing price competitiveness in the case of small economies but may not in the case of large economies because it affects international prices via exports and imports. Also, export price competitiveness will be offset by the rise in the intermediate import price or by the fall in the value-added portion of domestic production.
Theoretically, we determine a proper model by combining the trade aspect of Koopman et al.’s [
4,
5] model with the exchange rate aspect of Bems and Johnson’s [
6,
7] model in value-added perspectives. Empirically, we investigate the value-added effect of the exchange rate on both exports and trade imbalance by using gross and bilateral models. To date, value-added exports, including the trade balance, have been investigated by Hummels et al. [
8], Johnson and Noguera [
9], and UNCTAD [
10], among others. On the other hand, value-added exchange rates have been investigated by scholars such as Patel et al. [
11] and Yang et al. [
12].
In particular, by using value-added measures on the trade and real exchange rate, we assess world trade and determine the value-added effect of the exchange rate on international trade. This study aims to help forecast the exact trade deficits and prevent global imbalance, which is necessary to enhance the sustainability of free trade as GVCs expand.
The rest of the paper is organized as follows. The next section provides a short background on value-added international trade focused on GVCs, and proposes an appropriate model to describe the value-added linkage between international trade and the exchange rate.
Section 3 reports the empirical results and reveals policy implications.
Section 4 concludes the paper.
2. Background and Models
Nowadays, real attention to the value-added in international trade is paid in economic research due to widespread global value chains. First, we examine the background of this study through examples from the US and Korea.
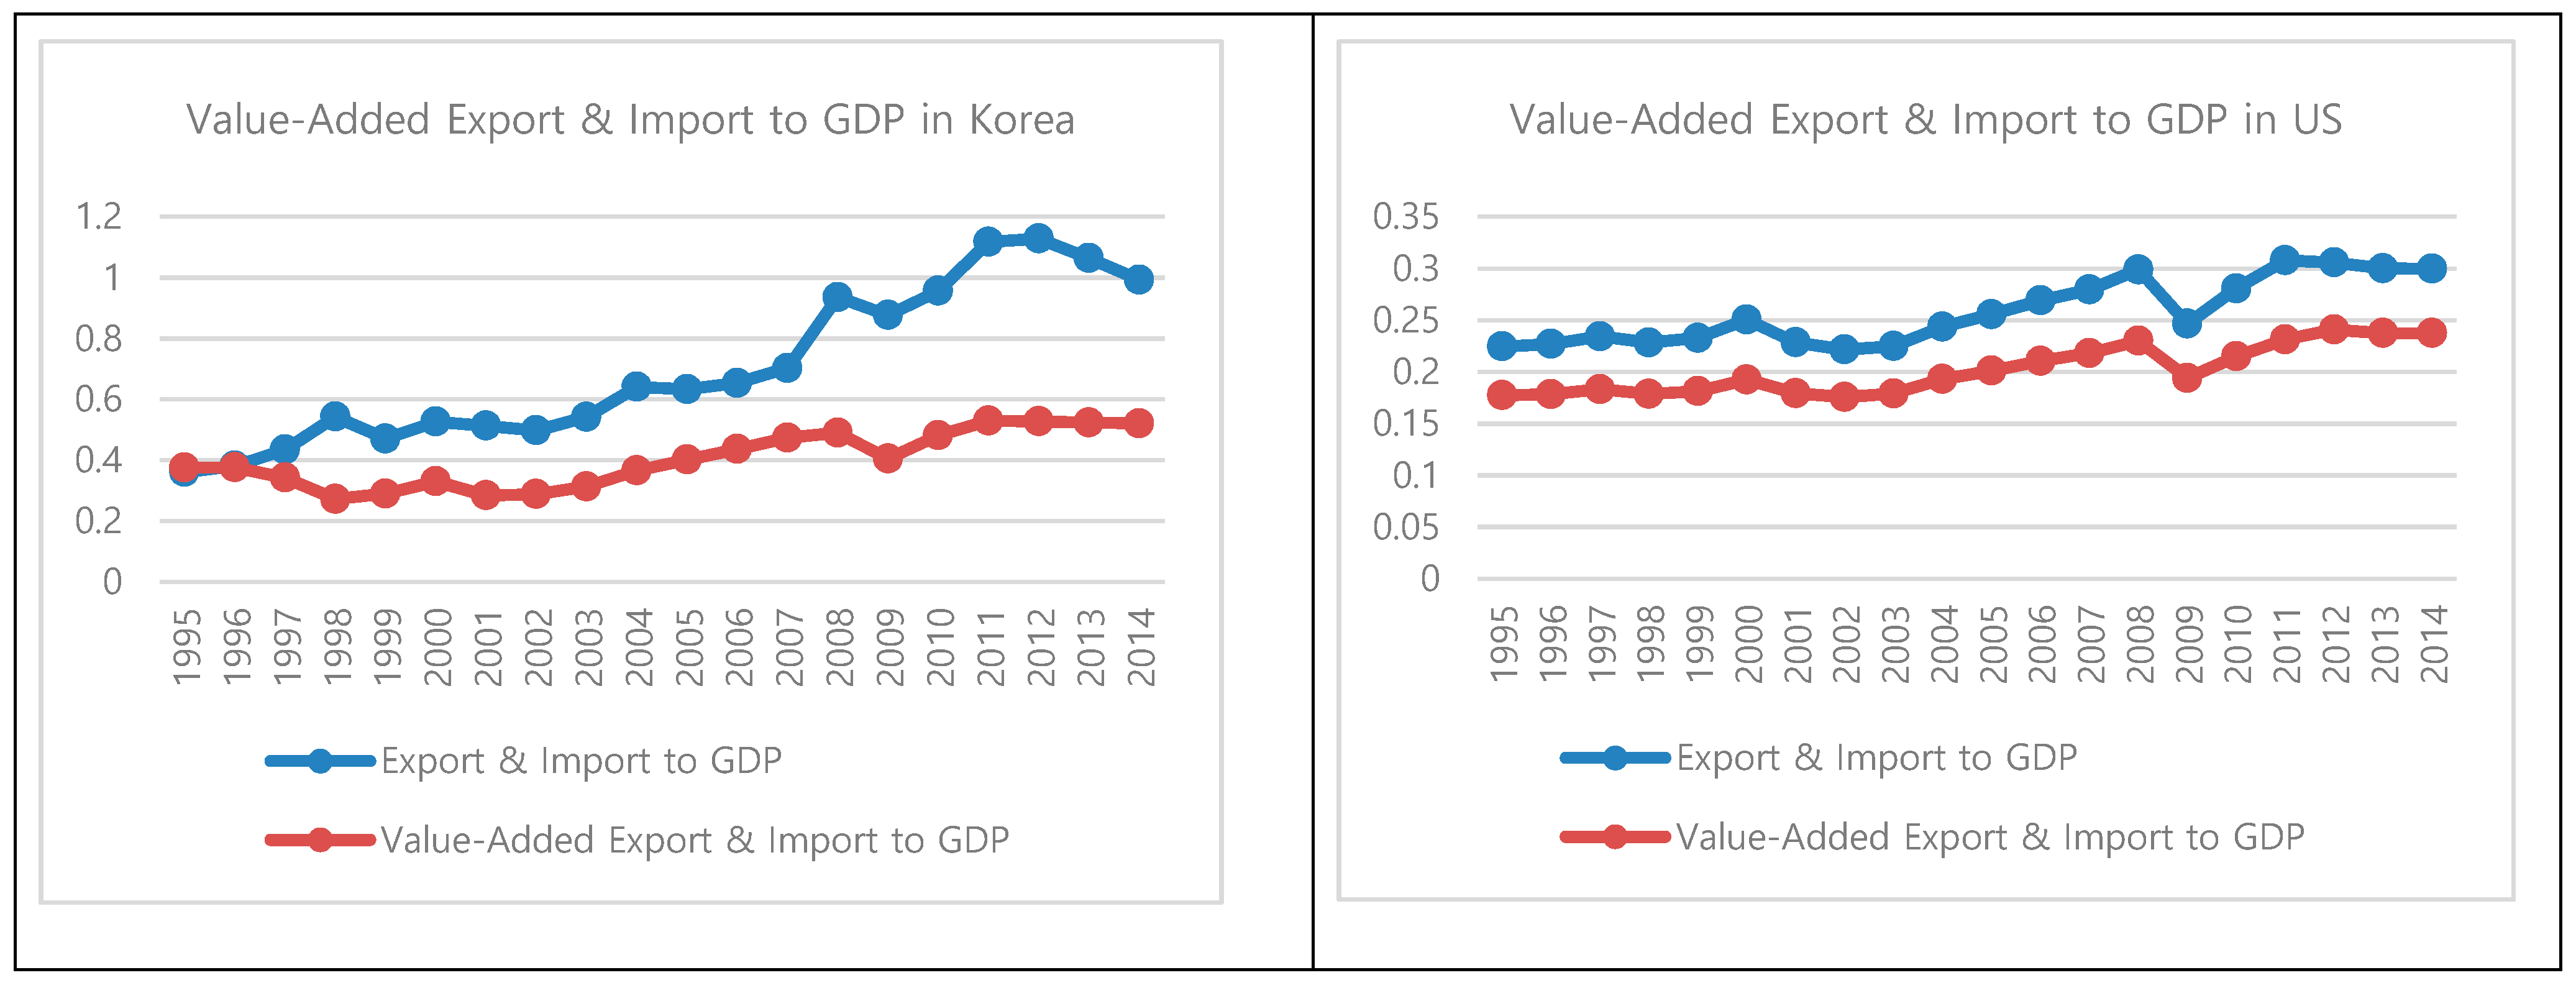
Figure 1 indicates a value-added dependence on external economies where the gap between international trade and its value-added trade has increased since 1995. During the 2010s, the export and import (trade) to GDP ratio is similar to the value-added trade to GDP ratio in the US, but the value-added trade to GDP ratio represents about half of the trade to GDP ratio in Korea. Also, the trend of the value-added bilateral trade balance of Korea and the US after 2010 explains the dramatic increase in the value-added trade imbalance between the US and China. Additionally, as Korea has a larger share of domestic value-added to meet foreign final demand (according to OECD’s [
13] TiVA indicators, “foreign final demand” excludes any value-added that may be embodied in inventories, electricity, gas and water supply, and construction sectors.) than the US, this implies that because Korea exports intermediate goods and parts to Asian countries, which in turn export the final goods assembled and manufactured from imported parts to the US, Korea’s exports to the US are higher in terms of value-added.
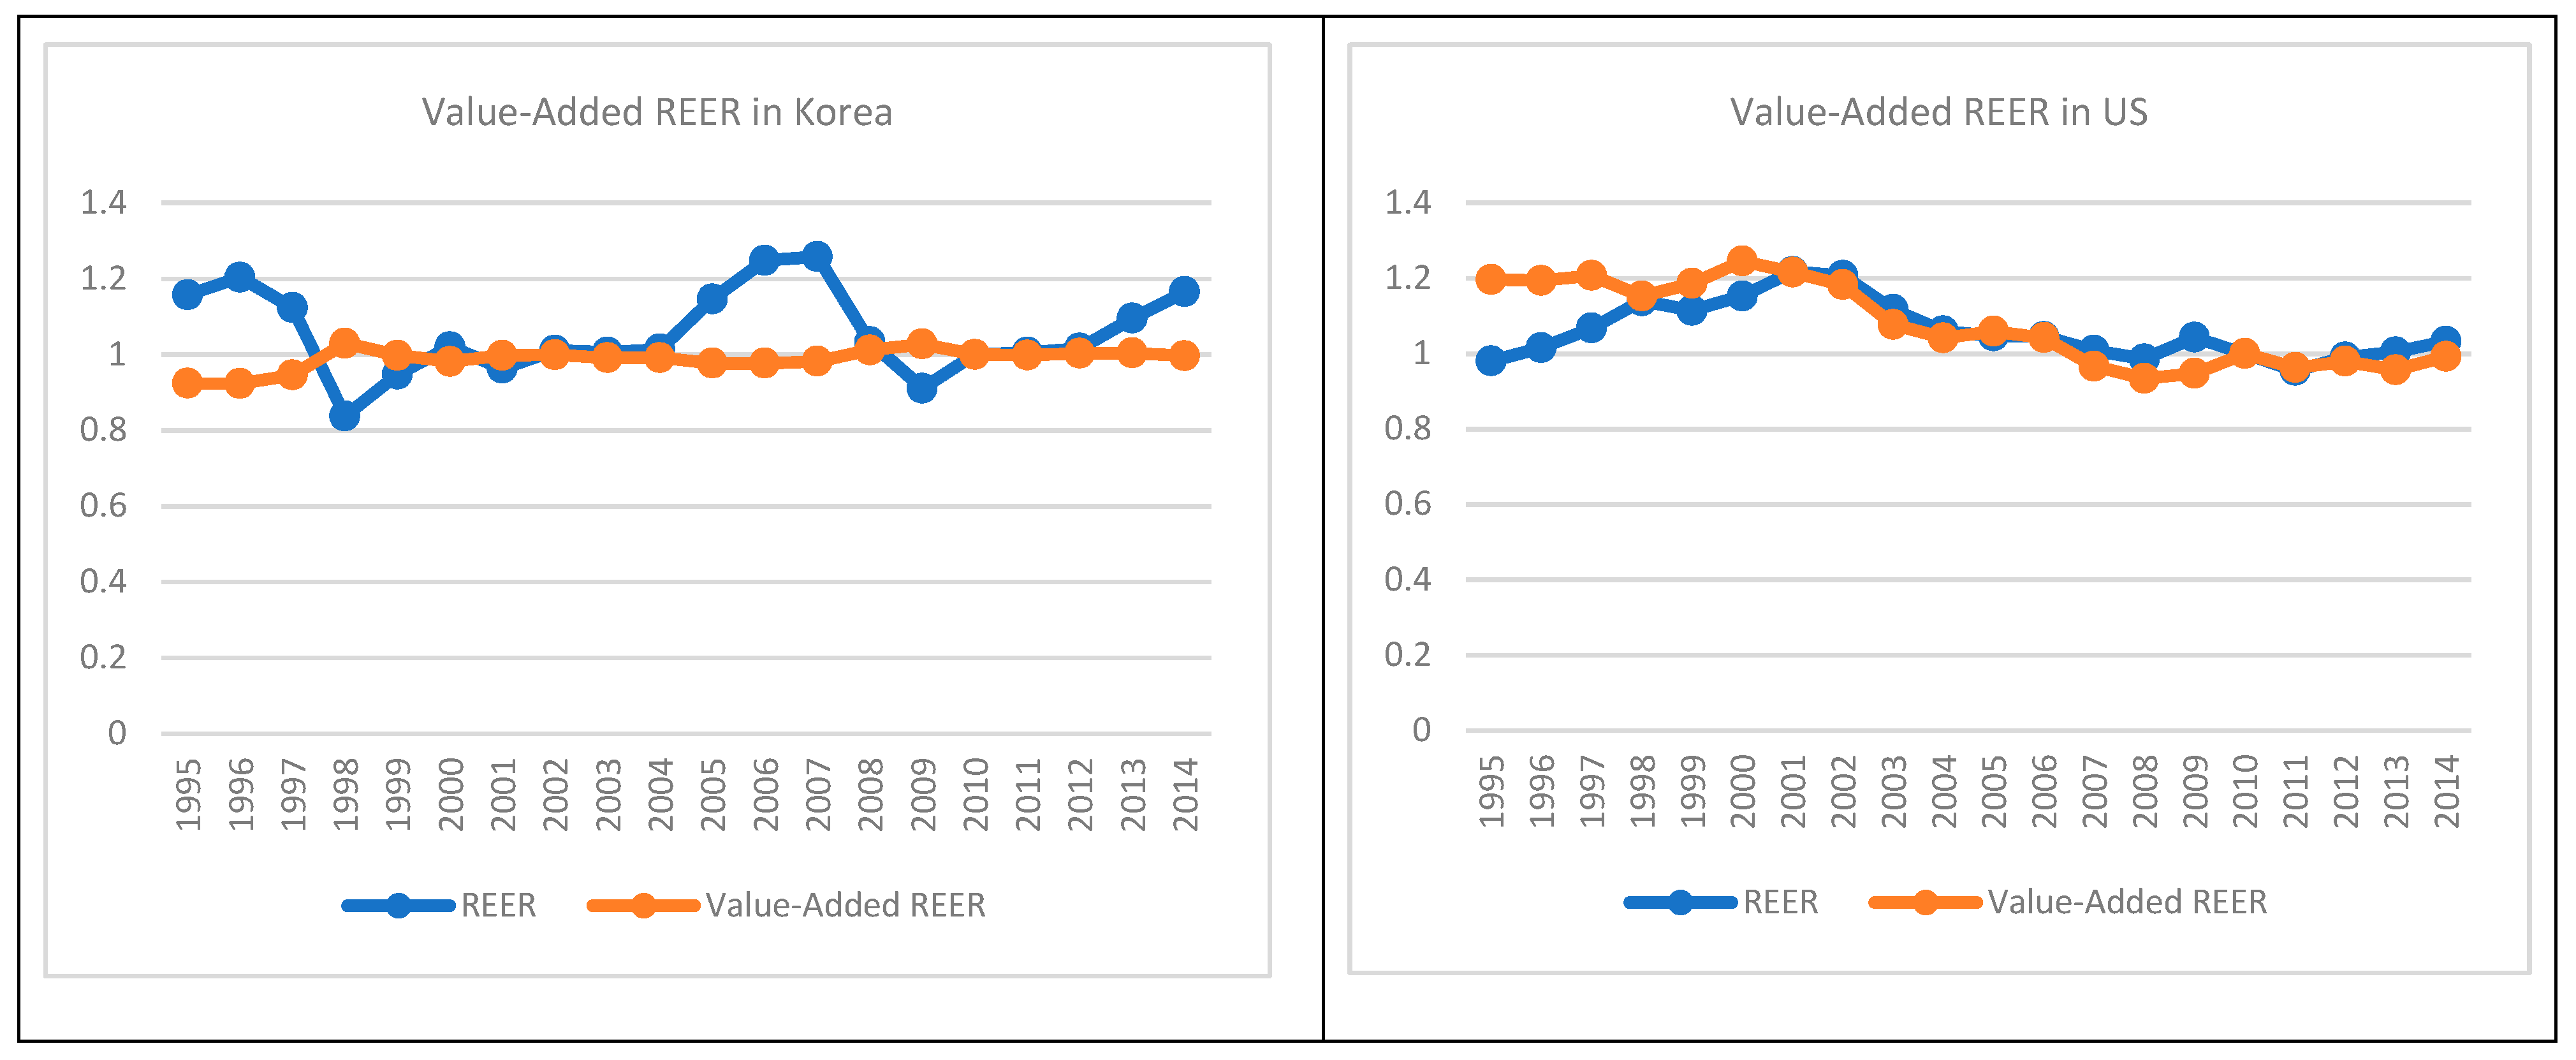
Figure 2 represents the real effective exchange rate (REER) which is produced by BIS’s [
14] narrow method and the value-added REER that we compute by using the GDP deflator and value-added trade weights according to the BIS narrow method plus China based on Bems and Johnson [
6,
7]. The REER indicates the overall external competitiveness of an economy compared to its trade partners in terms of the prices of goods and services internationally traded.
Here, the REER and value-added REER slightly differ because of the price levels and trade weights. In the case of Korea, the levels of the value-added REER after 2010 are around the equilibrium level (base year). The yearly change rates are −0.2%, 0.5%, 0.1%, and −0.7% for 2011, 2012, 2013, and 2014, respectively. In the case of the US, the levels of the value-added REER are slightly lesser than the equilibrium level, implying the depreciation of the US dollar.
To present the bilateral models for exports and imports on the exchange rate changes in the value-added framework focused on GVCs, we apply the traditional standard model of bilateral trade to the value-added framework. Also, we adopt the value-added REER to measure the value-added effect of the exchange rate to value-added trade as follows. The value-added REER is calculated by comparing the primary currency to the average value of other currencies, which are weighted by the overall amount of value-added trade with nations using that currency.
where X
ij represents the value-added exports of domestic country
i to foreign country
j, M
ij represents the value-added imports of domestic country
i from foreign country
j, TB
ij is the value-added trade balance of domestic country
i with foreign country
j, R
ij is the value-added REER of domestic country
i, Y
j is the income of foreign country
j, Y
i is the income of domestic country
i, and f(.) represents the functional notation.
The signs of the partial derivatives are the expected signs of the regression coefficients. This indicates that a change in the value-added exports means a marginally higher degree of elasticity in the value-added exports to the value-added REER. The same principle applies to imports and the trade balance. We could guess that the expected sign of value-added exports to value-added REER is minus (−) and the expected sign of value-added imports to value-added REER is plus (+).
Additionally, the trade balance is improved through changing the relative prices by domestic currency devaluation in the elasticity approach. The trade balance is affected by devaluation if changes induce an income increase bigger than an expenditure increase in the absorption approach. The trade balance is only temporarily affected by the devaluation in the monetary approach, implying that there is no long-run equilibrium relationship between the trade balance and real exchange rate, and the trade balance can be improved by an income increase.
Here, we measure the value-added trade weights, which are used to create the value-added REER. These weights are computed as follows: , where wj is the domestic country i’s value-added weight with foreign country j, is the value-added imports, is the value-added exports, is the value-added import ratio of foreign country j, is the value-added import from foreign country j, is the value-added export ratio of foreign country j, is the value-added export to foreign country j, is the domestic manufacturing supply in foreign country j, is the value-added exports to foreign country j excluding home country i, is the value-added exports to foreign country k excluding foreign country j, is the domestic manufacturing supply in foreign country k, is the value-added exports to foreign country k excluding home i and foreign country j, and is the value-added exports of foreign country j to foreign country k excluding home country i. Finally, the value-added REER is computed using the GDP deflator instead of the CPI.
3. Testing Results
Our interest is in exploring the value-added responses of the exports, imports, and trade balance to the exchange rate changes focused on GVCs. This section reports econometric procedures based on Equation (2) and summarizes our empirical findings.
We obtained yearly data from the OECD-WTO for the value-added trade statistics and from Federal Reserve Economic Data (FRED) for other economic statistics. To estimate the effect of the exchange rate on value-added trade, we specify the set of dependent variables and explanatory variables for the period between 1995 and 2014 by using all the value-added data available from OECD-WTO. For all the variables, logarithmic transformation is adopted in the sense that negative values by adding a constant can be put in logarithmic form.
In the empirical testing procedures, major bilateral single variables for the chosen sample are tested for unit roots to examine the long-run equilibrium in the stationarity testing stage. The results using the augmented Dickey–Fuller tests (Dickey and Fuller, [
15]) are presented in
Table 1.
Table 1 reports that all level variables except several TBs are found to be non-stationary during the sample period, and they are first-difference stationary except several Ys and TBs. This indicates that we can use either first-difference stationary variables or cointegrated level variables.
Secondly, we use the time series integrated in order one in the long-run equilibrium testing stage. The results are checked using the cointegration procedure of Engle and Granger [
16].
Table 2 suggests that all the null hypotheses of no cointegration for all models on exports, imports, and trade balance except some TBs, are not rejected at the 5% level. Therefore, all models need to be estimated with stationary data to avoid any spurious regression problem. So, we use the first-difference stationary data to estimate the trade models which do not cointegrate while we use the stationary level data to estimate the three trade balance models which are cointegrated.
The statistically significant testing results for bilateral trade models to investigate the effects of the currency devaluation on both international trade and value-added trade, including exports, imports, and trade balance, using the stationary variables are represented in Tables. In addition, we confirm that estimations reflect the fitness of the model with reasonable coefficients of determination, stable coefficients with F-statistics, and no structural breaks after the financial crisis with break test of dummy variable, and feasibility of linear regression with residual diagnostics as a representative case of Korea–US, such as the coefficient of determination = 0.55, Durbin–Watson statistic = 2.03, F-statistic (p-value) = 0.59 (0.21), estimated dummy break variable (p-value) = 1697 (0.30).
For the bilateral trade of Korea shown in
Table 3, we find that currency depreciation has a positive effect on value-added exports, but has a negative effect on exports due to the effect on intermediate imports dominating the effect on value-added exports or the effect on the foreign content of exports dominating the effect on the domestic content of exports. The same effect applies to Korea–Japan imports. Also, foreign income has a positive effect on exports and value-added exports, and domestic income has a positive effect on imports and value-added imports, but their effects on trade balance are not consistent.
For the bilateral trade of the US shown in
Table 4, we find that currency depreciation has a positive effect on imports. Also, foreign income has a positive effect on exports and value-added exports, and domestic income has a positive effect on imports and value-added imports.
For the bilateral trade of China shown in
Table 5, we find that currency depreciation has a positive effect on imports. Also, foreign income has a positive effect on exports and value-added exports, and domestic income has a positive effect on imports. In addition, as we expect, foreign income has a positive effect on the trade balance and value-added trade balance.
For the bilateral trade of Japan shown in
Table 6, we find that currency depreciation has a positive effect on value-added exports, but has a negative effect on exports due to the effect on intermediate imports dominating the effect on value-added exports or the effect on the foreign content of exports dominating the effect on the domestic content of exports. The same effect applies to imports. Also, foreign income has a positive effect on exports and value-added exports, and domestic income has a positive effect on imports and value-added imports. And their effects on trade balance are consistent.
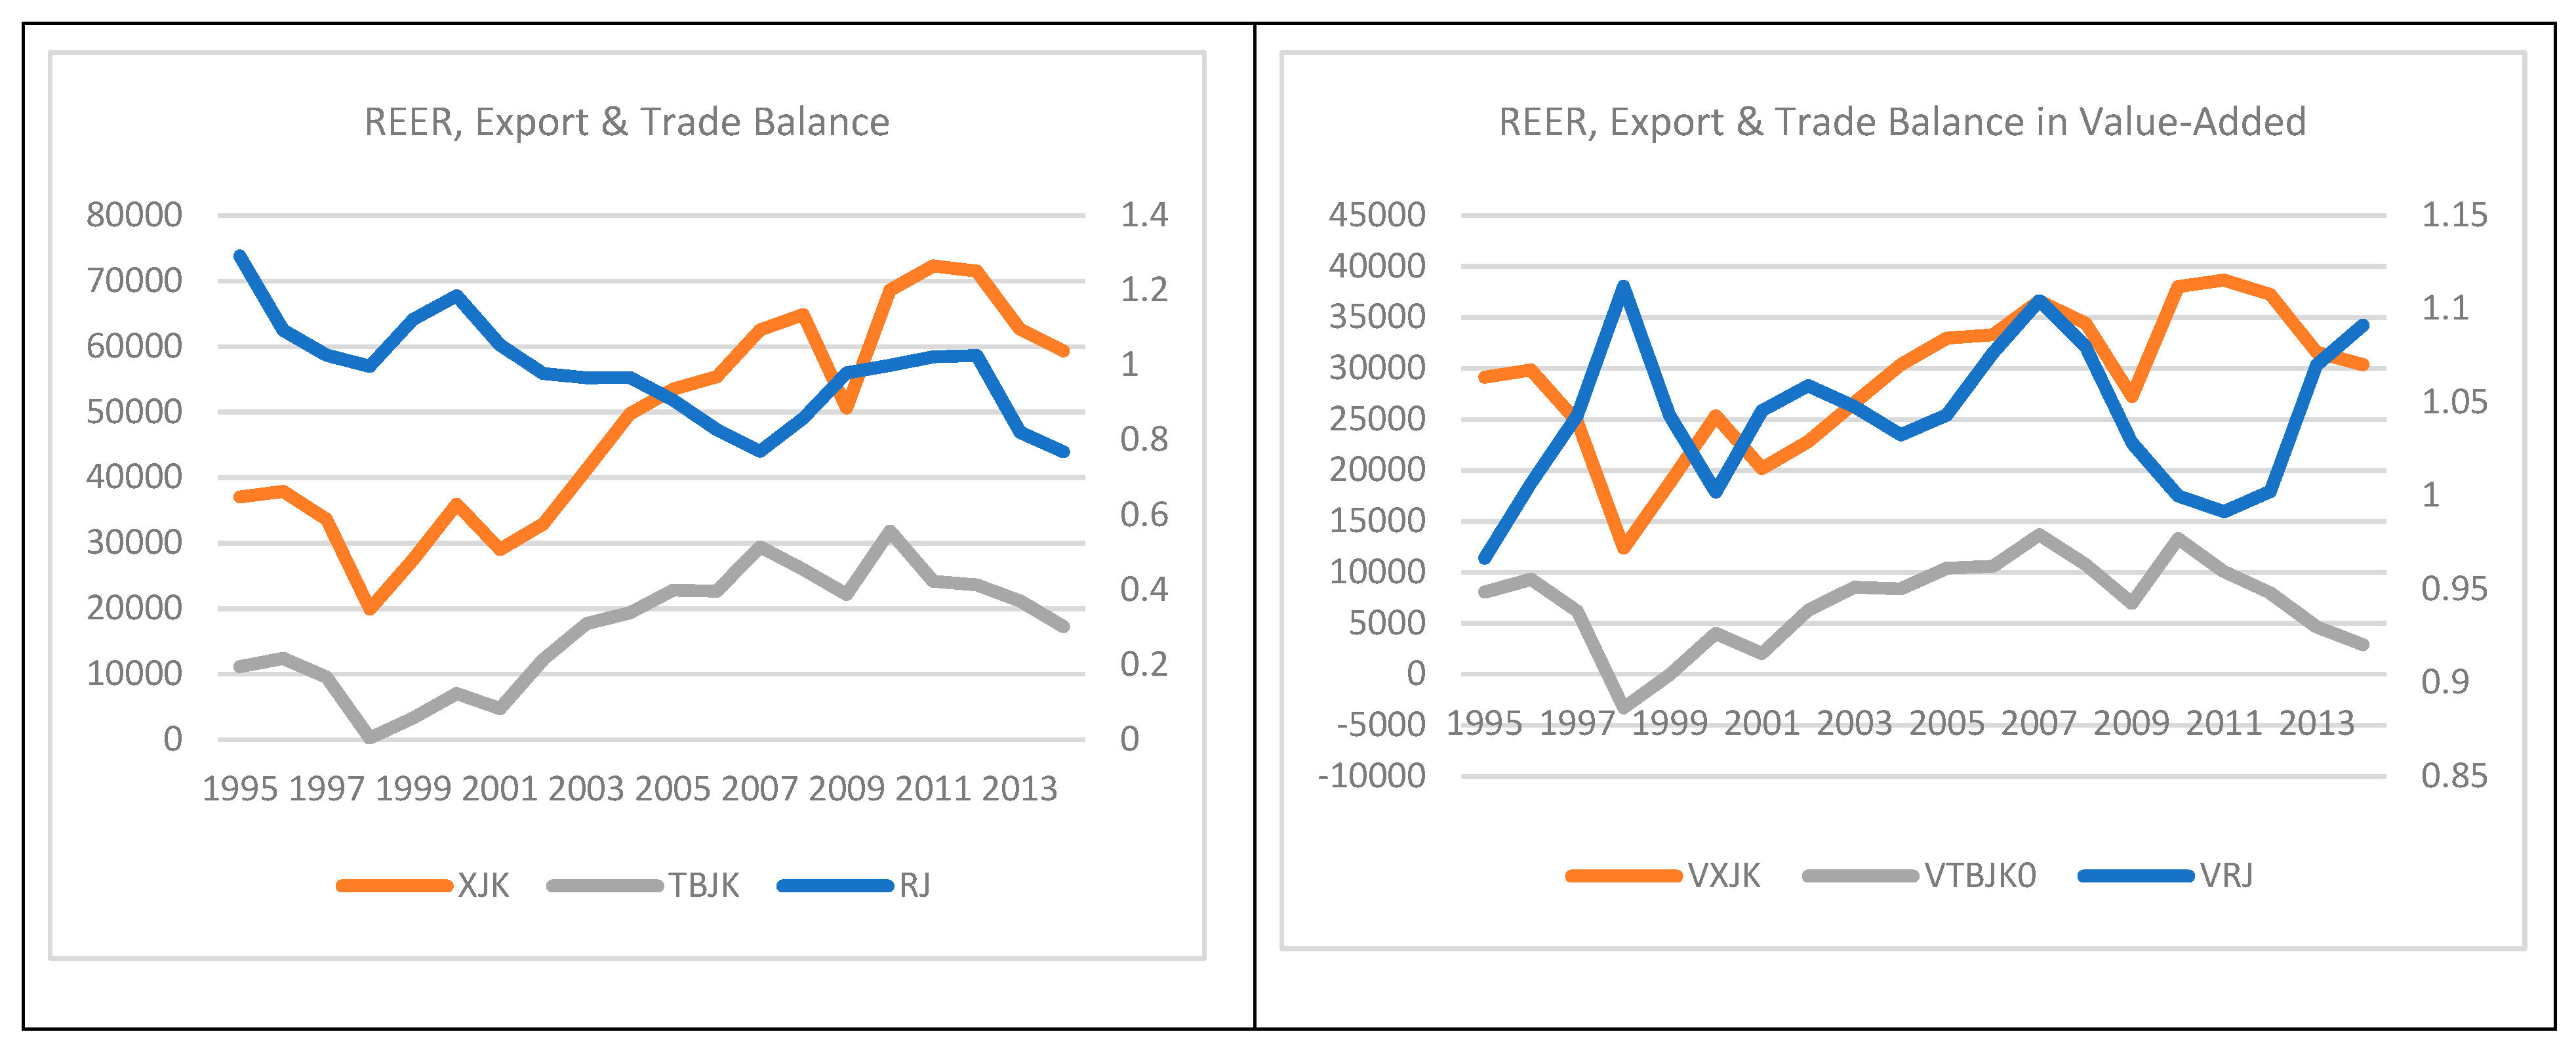
In addition, we pay scrutiny on the J-curve effect by using lagged variables. In the case of Japan–Korea whose exports and trade balance are both significantly affected by exchange rate changes, these exports and trade balance do not seem to have closer relations with the past exchange rate than the current exchange rate, shown as the following
Figure 3 and
Table 7. This implies little existence of the J-curve effect.
4. Conclusions
This paper investigates the value-added effects of the exchange rate on exports and the trade balance focused on GVCs to evaluate world trade. Our findings address the policy implications that could contribute to sustainable free-trade development.
Beginning in the 2000s, the value-added portions of Korea’s exports to the US have been about 90%, but the value-added portions of the US’s exports to Korea have been about 70%; meanwhile, Korea’s value-added exports to the US continue to be in surplus. This indicates that the share of domestic value-added to meet foreign final demand in Korea is higher than in the US. This implies that because Korea exports intermediate goods and parts to Asian countries, which in turn export the final goods assembled and manufactured from imported parts to the US, Korea’s exports to the US are higher in terms of value-added. Also, the value-added exports to gross exports ratio is higher in Korea than in the US, which indicates that increased segmentation of the global value chains of production is one reason why exports do not greatly contribute to growth.
We investigate the bilateral trade and value-added trade of the US, China, Japan, and Korea for the previous 20 years. In the case of Korea and Japan, we find that currency depreciation has a positive effect on value-added exports. But currency depreciation has a negative effect on gross exports because the effect of currency depreciation on the foreign value-added content of exports dominates the effect on the domestic value-added content of exports, such as the effect on intermediate imports dominating the effect on value-added exports when gross exports are counted by both domestic value-added content and foreign value-added content. The same effect applies to imports as we find that currency depreciation has a positive effect on imports. On the other hand, foreign income has a positive effect on exports and value-added exports, and domestic income has a positive effect on imports and value-added imports. However, their effects on trade balance are not consistent.
Our findings imply that the effects of currency depreciation on value-added trade are more effective, and the analysis of value-added trade focusing on GVCs can best contribute to the sustainability of globally free trade by considering trade policies as a result of accurately reflecting either the easing of the global imbalance and the exchange rate war or the mitigation of trade restriction. Moreover, we acknowledge that the sample is small and that future research would benefit from a larger data set as it becomes available.
The topic of this paper is highly relevant given that recent open economies have resorted to global value chains and international value-added trade as well as the exchange rate as additional instruments of monetary policy. Thus, policymakers should consider our suggestions, which contribute to mitigating global imbalances and exchange rate conflicts. As a result, the policy recommendations to maintain free trade schemes, diversify world markets, and build relationships between export promotion and global buyers toward sustainable development should be addressed.


