The Impacts of Socioeconomic Development on Rural Drinking Water Safety in China: A Provincial-Level Comparative Analysis


Abstract
1. Introduction
2. Materials and Methods
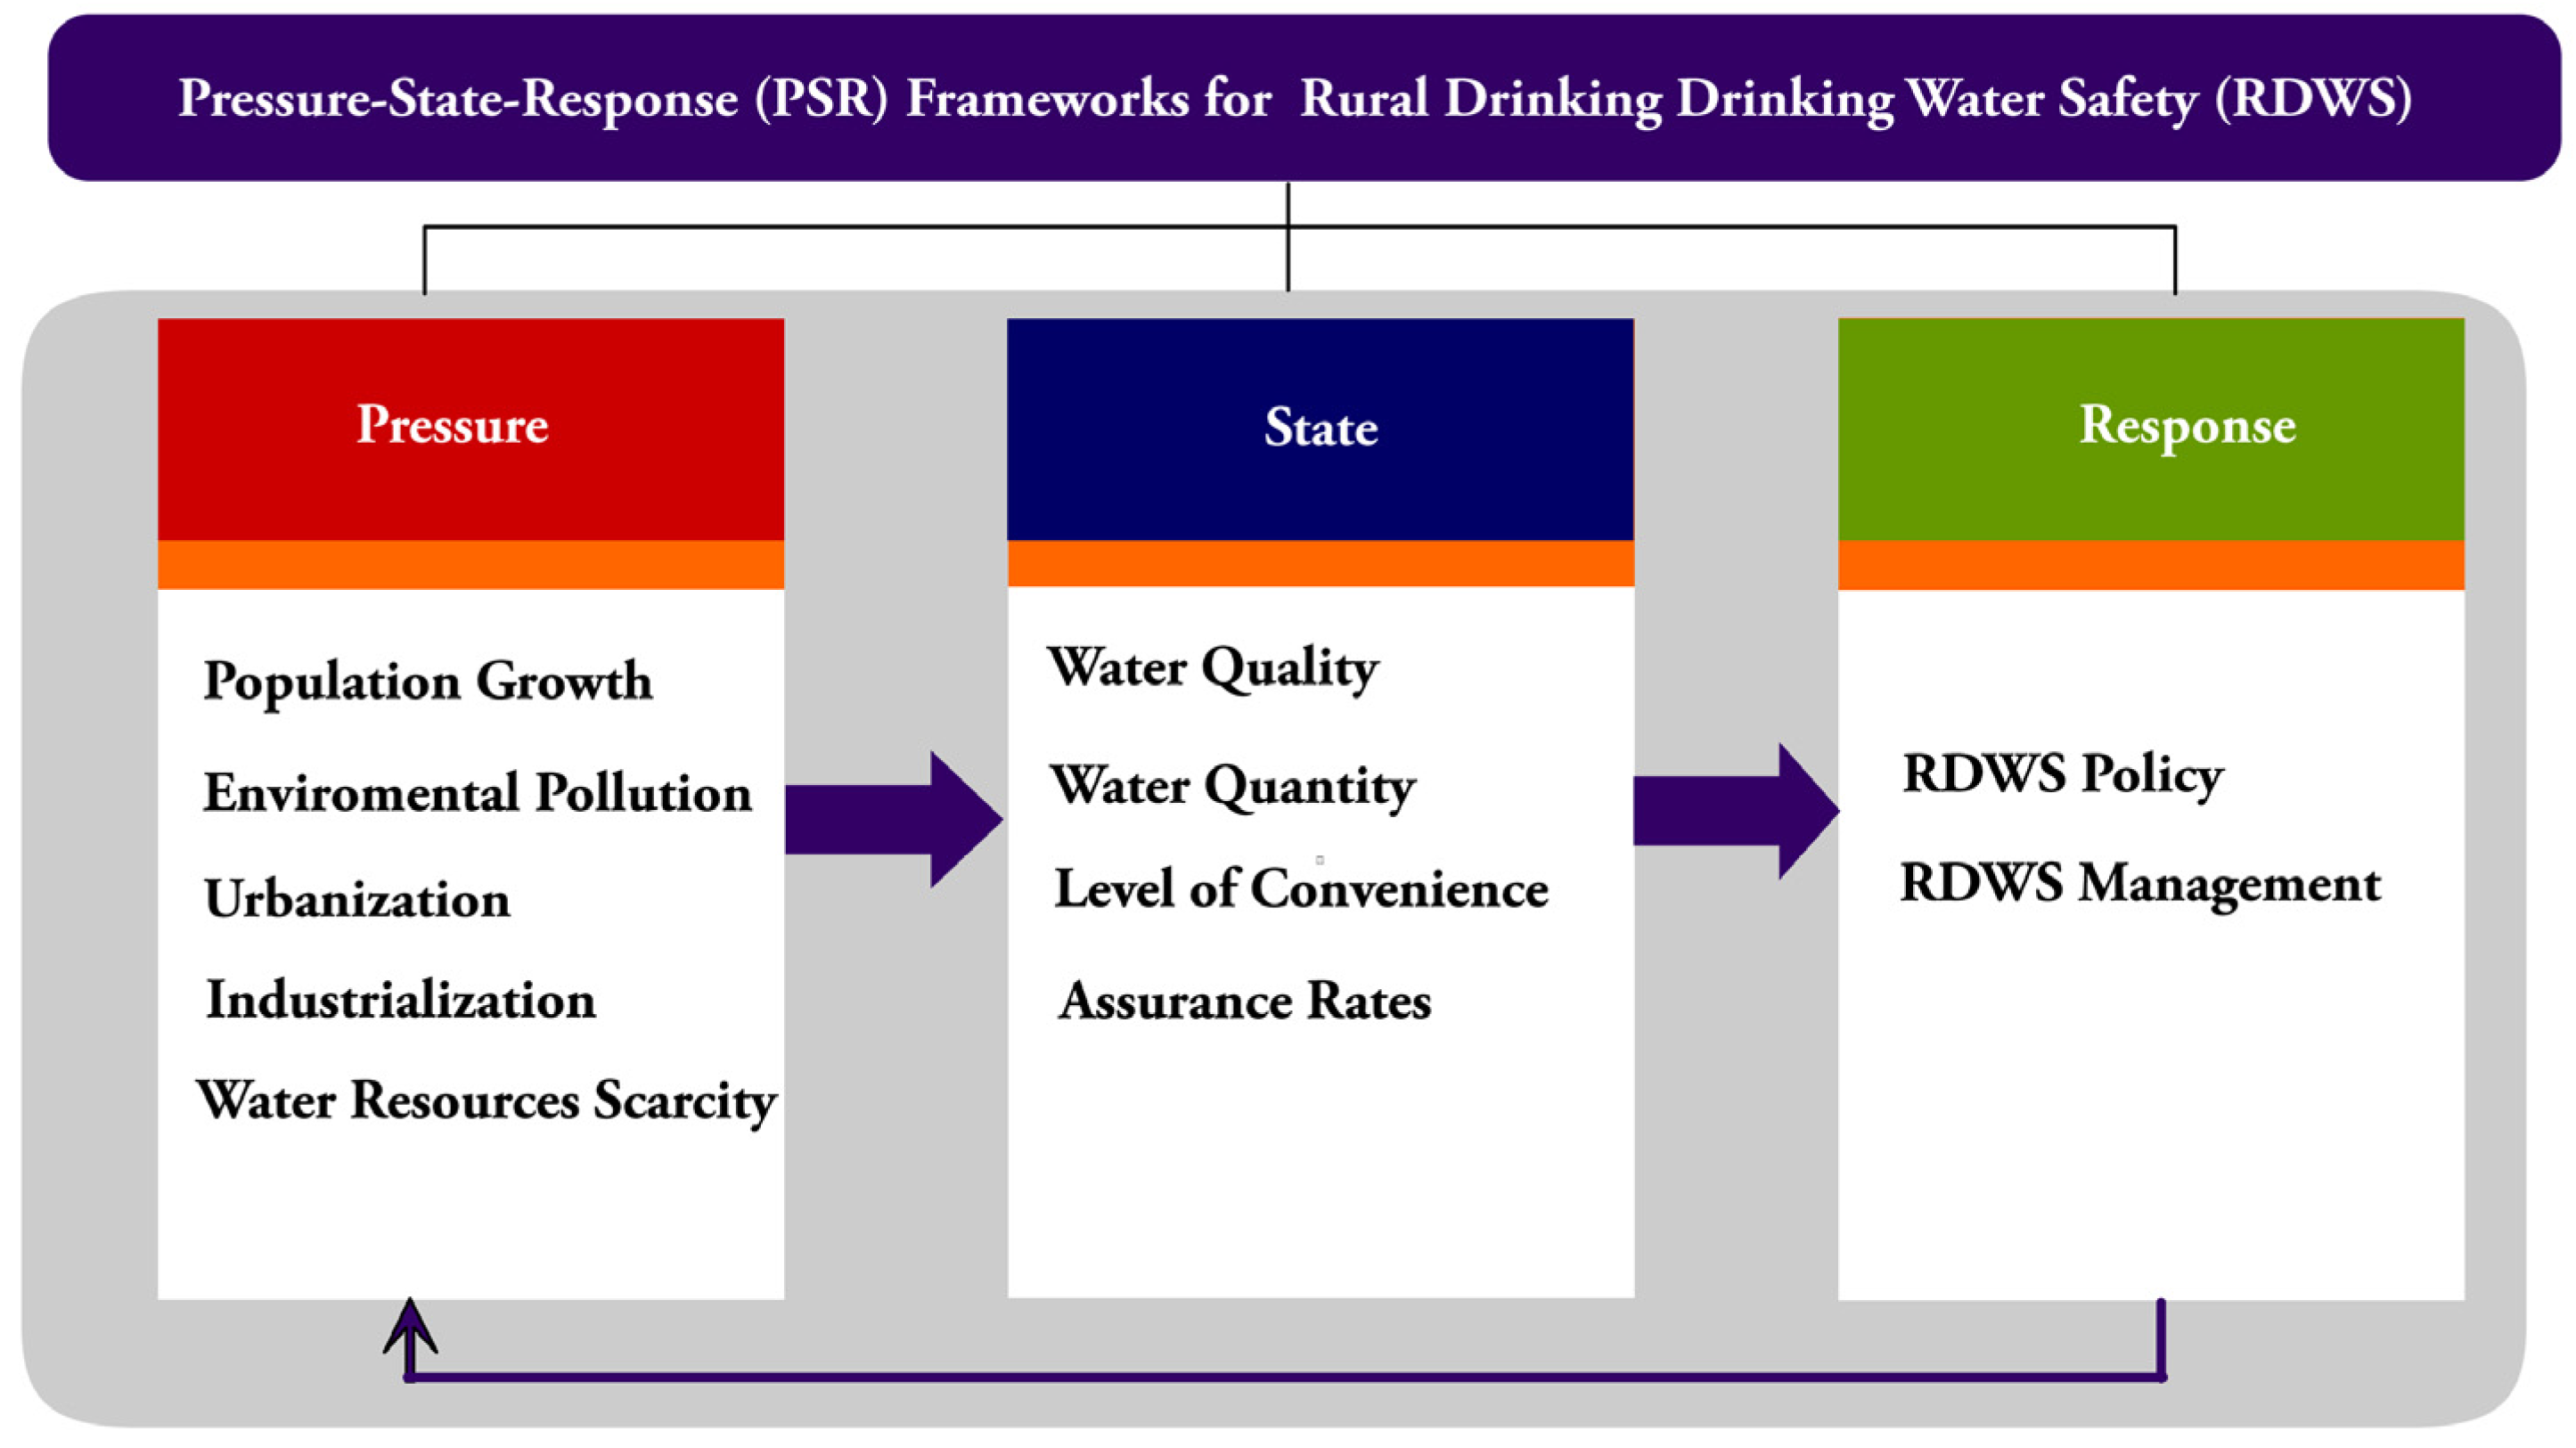
2.1. Theoretical Framework
2.2. Indicator Selection and Data Sources
2.3. Data Analysis
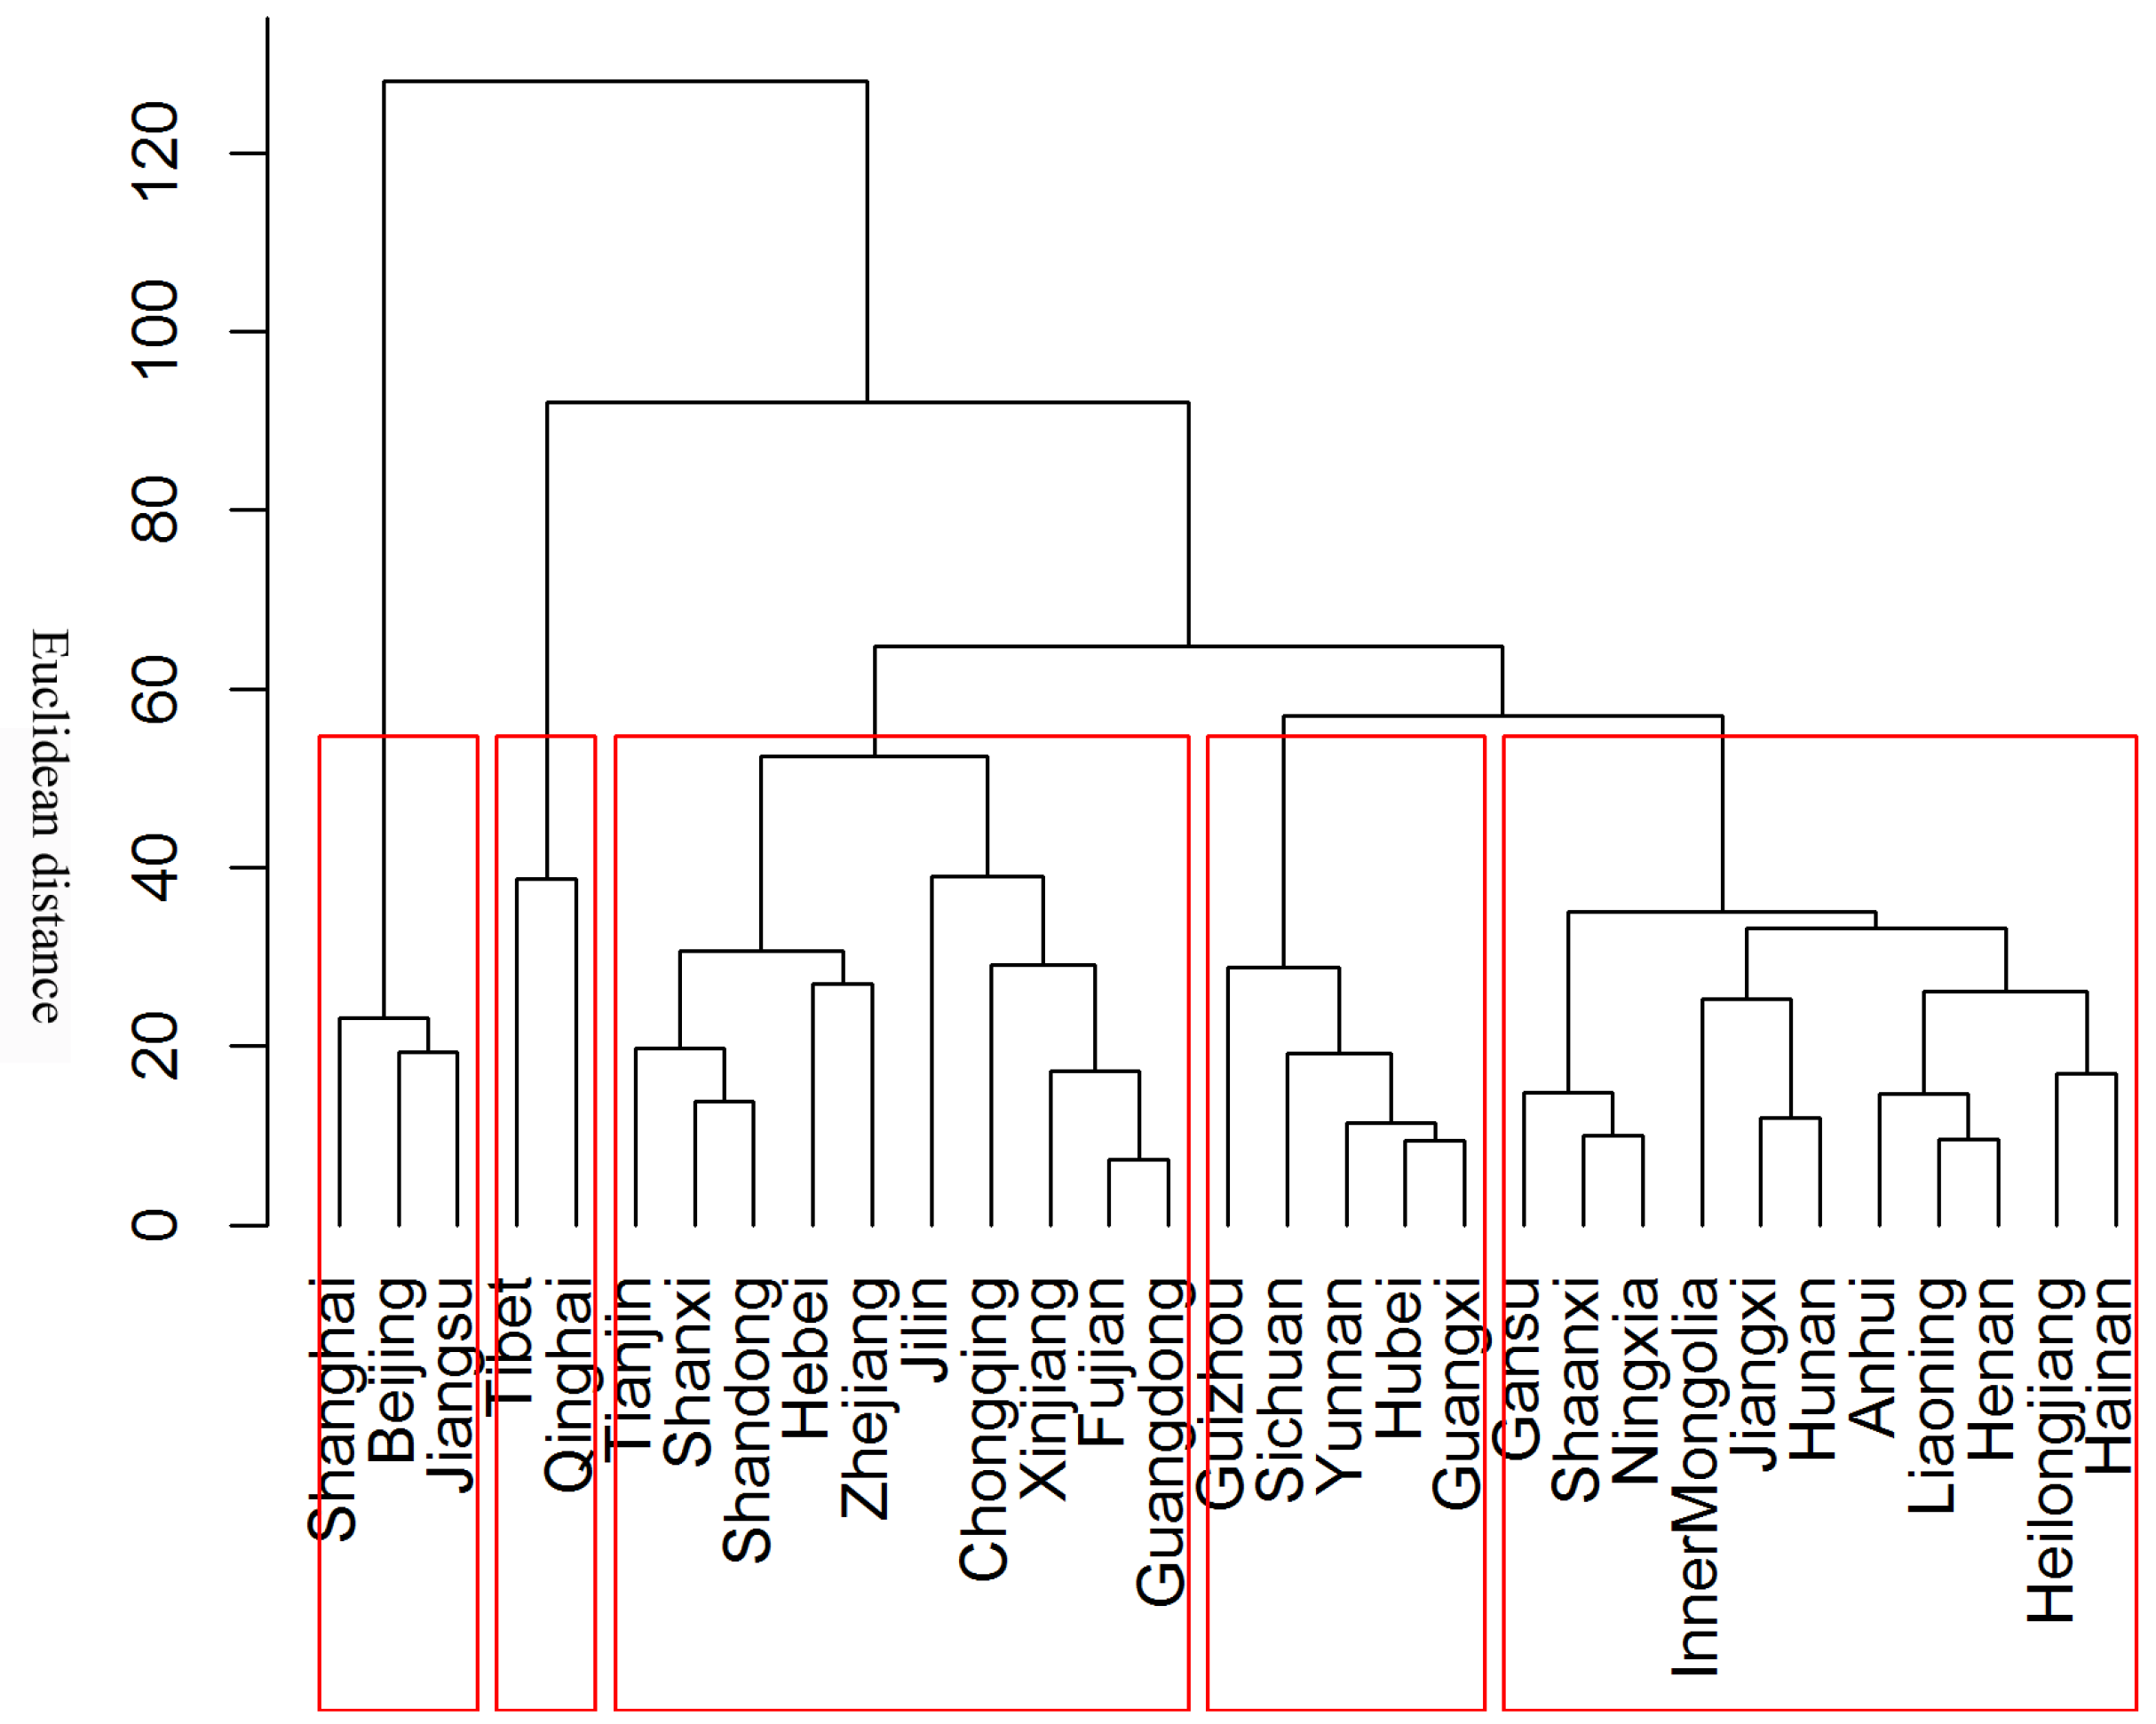
2.3.1. Index and Clustering Analysis
2.3.2. Canonical Correlation Analysis (CCA)
3. Results
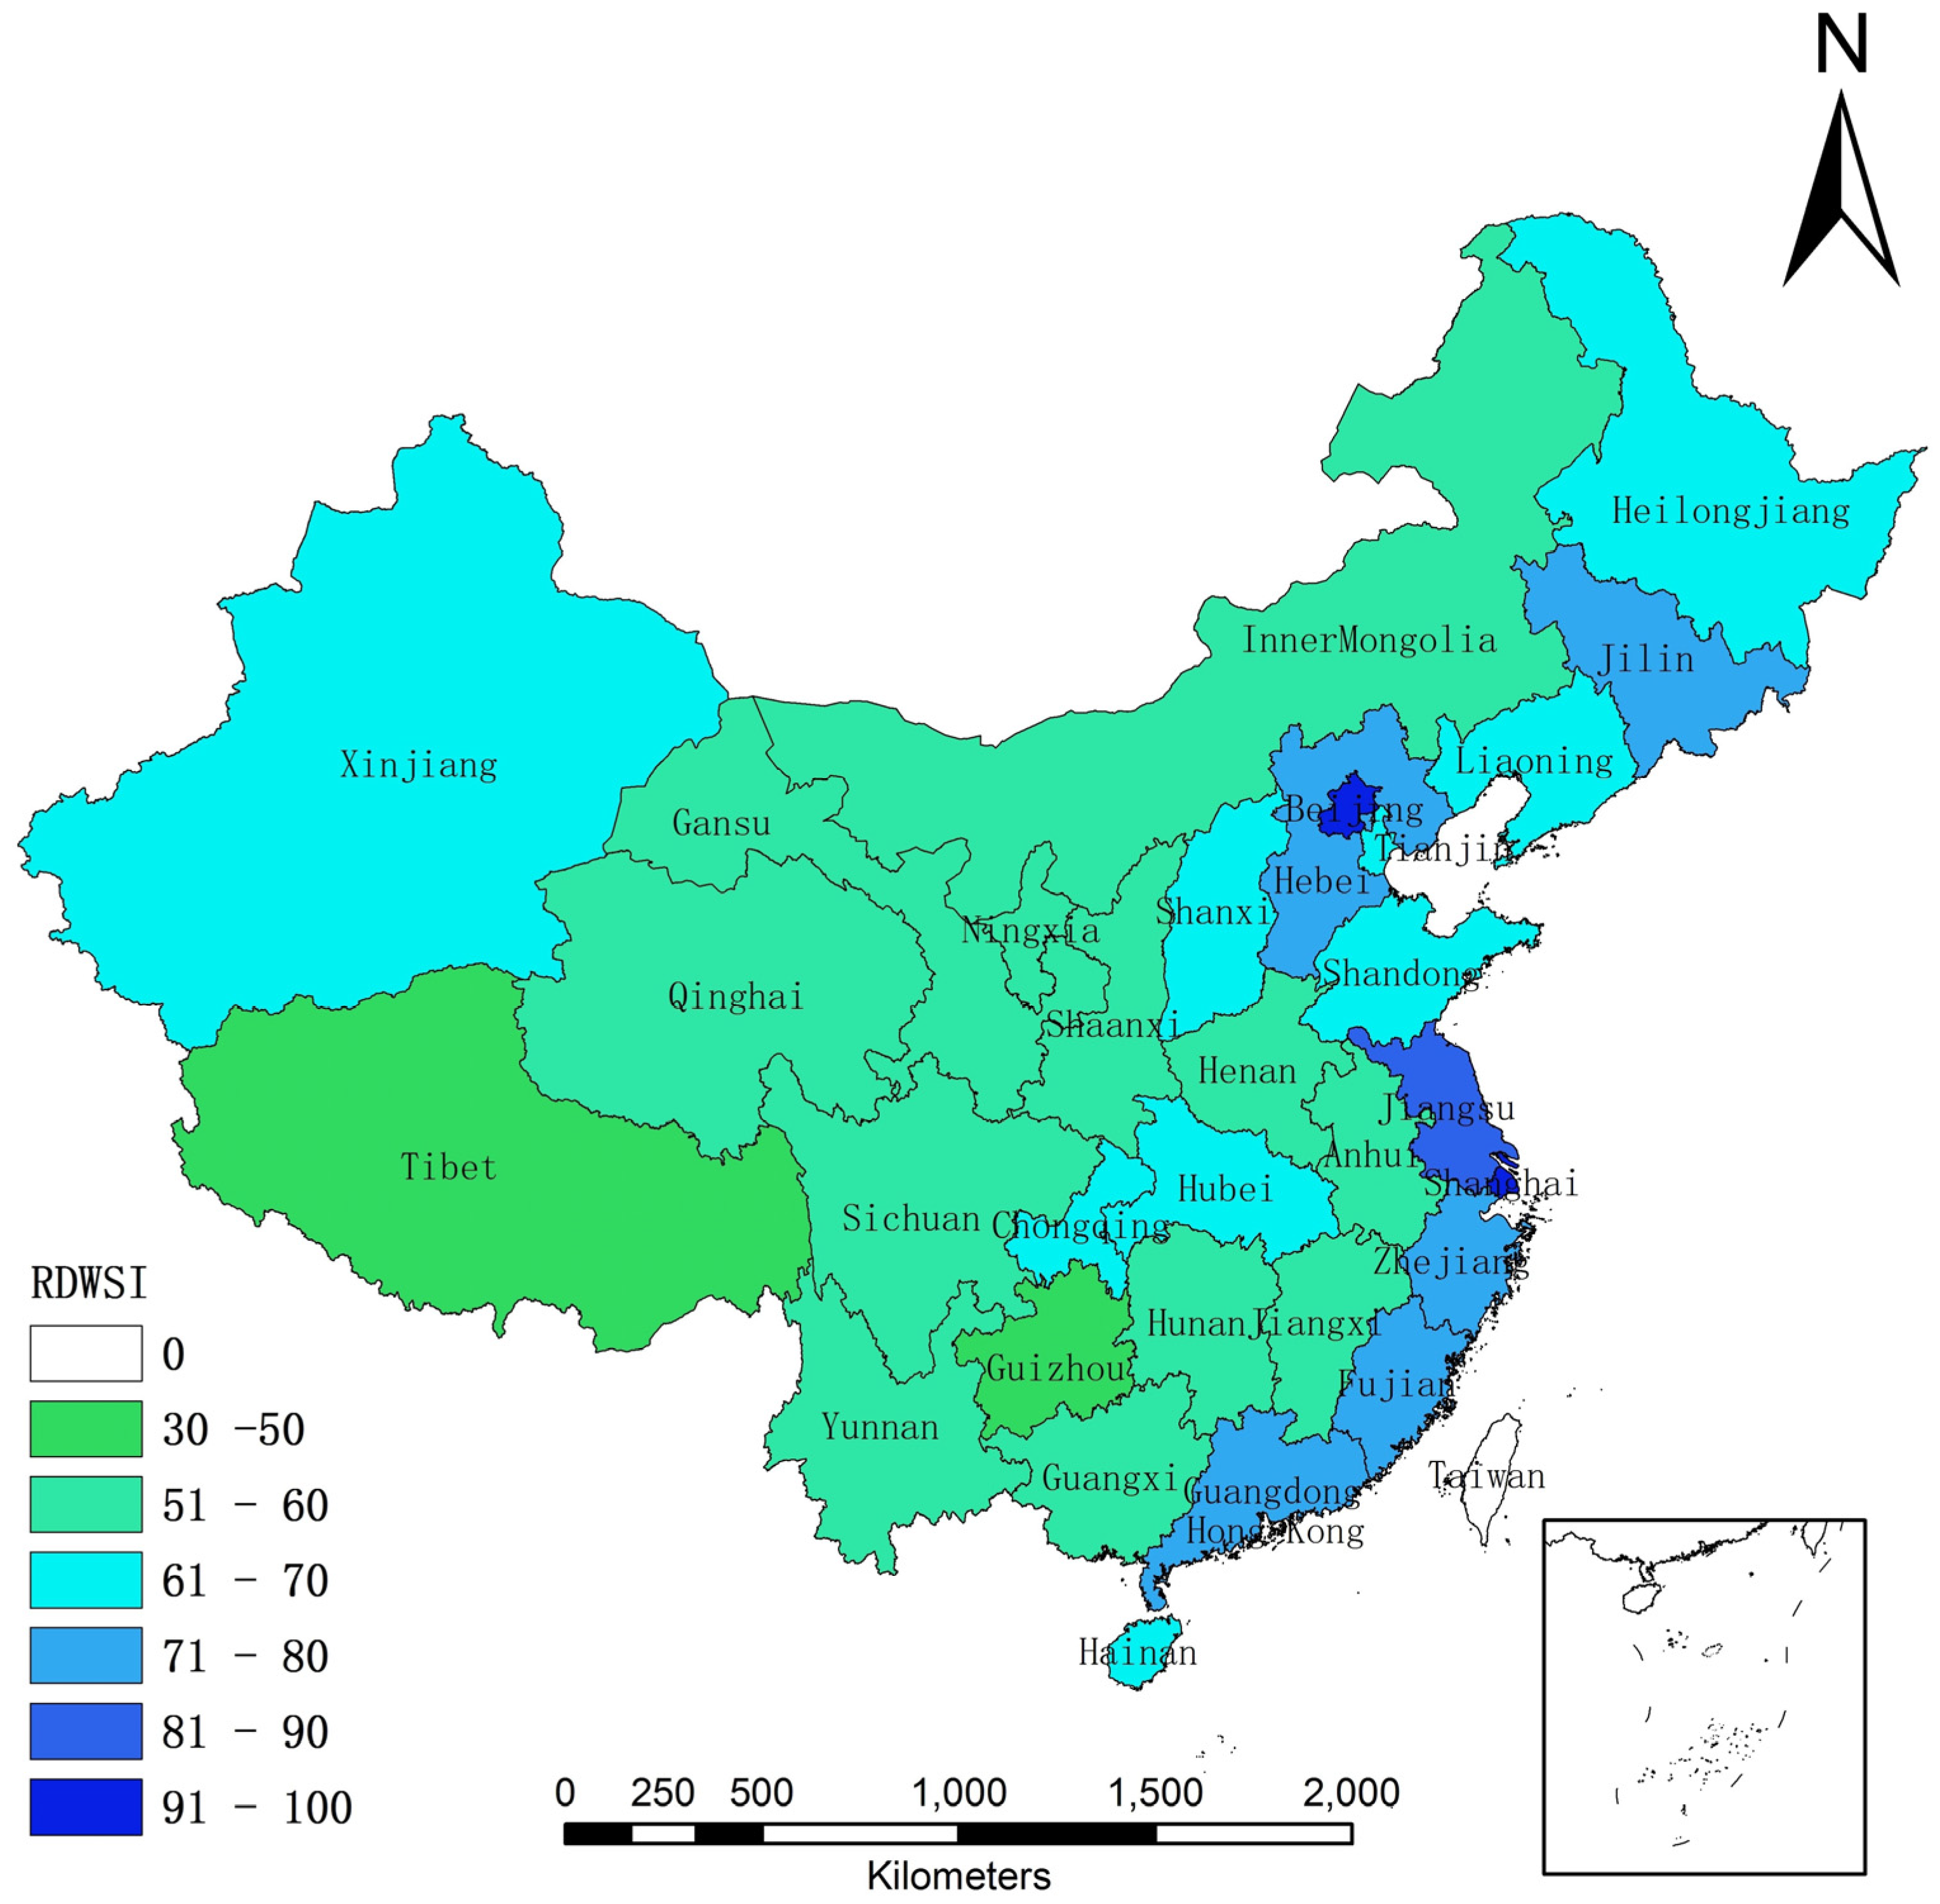
3.1. Provincial-Level RDWS Comparisons
3.2. Impacts Analysis of Socioeconomic Development on RDWS
4. Discussion
4.1. Imbalanced RDWS at the Provincial-Level
4.2. Impacts of Socioeconomic Development on RDWS
- Economic development and RDWS: The CCA results indicate that GDPPC and PCPSI have a high level of influence on RDWS. The data suggest that RDWS and economic development have a positive effect on each other. This is reasonable, since investing in rural water improvement can generate direct economic benefit and contribute significantly to increased production and productivity within economic sectors [33]. Related studies suggest that for each one USD invested in water and sanitation, the return on investment is between USD 9.1 to USD 11.2 [34]. Another potential reason for this positive effect is that willingness to pay for water supply tends to increase alongside rising income levels, since the proportion of income required decreases in step [35,36]. Our analyses also suggest that economic growth has a more direct impact on rural drinking water infrastructure compared with PHDDW and PRRTW.
- Social development and RDWS: The impact of social development on RDWS appears to be two-sided: Some indicators, such as urbanization, had a positive effect on RDWS, while others, PD and RNI, had a negative effect. On the one hand, urbanization appears to have the effect of improving urban and rural drinking water safety infrastructure, and there is some evidence for the positive association between urbanization and nearby rural drinking water quality [37]. On the other hand, with the development of real estate and housing construction, along with the development of secondary industries, RDWS face enormous pressure from population growth and industrial structure changes.
- Environment and RDWS: Our analyses suggest that environmental pollution adversely impacts RDWS. As the model results show, if the pollution load discharged into an environment were to be reduced, the total pressure from environment indicators would decrease, and RDWS would in turn increase. RDWS also faces pressure—both to water quality and availability—from climate change impacts as well as from anthropogenic sources of pollution [38,39].
- Water resource and RDWS: Looking to the water resource indicators, we observed two opposite impacts on RDWS: PWR was positive and TVWS was negative. The model results indicate that water resource factors mainly act on PTCCWS, and these effects are positive, supporting the premise that water resource availability impacts water quantity and rates of water use. Overall, China is a water-stressed country, and the uneven distribution of water resources, both spatially and temporally, exacerbate the severity of water scarcity caused by human water consumption [20]. Water resource stress is aggravated further by poor water resource management as well as the increased use which accompanies rapid economic development and urbanization [40]. Due in part to seasonal water shortages, many rural water treatment plants have water provision rates which fall below national and provincial standards [41].
- Water consumption factors and RDWS: Water consumption factors also impact RDWS, mostly in a negative direction. The continuous growth of non-agricultural water use combined with ineffective control of wastewater discharges in rural areas contributed negatively to RDWS. With recent industrial restructuring [42], secondary and tertiary industries in rural areas increased, while the proportion of primary industry declined overall; this change, in turn, spurred a surge in increased rural water consumption. The low overall rate of rural wastewater treatment also contributes negatively to water production and water quality.
4.3. Potential Policy Options to Improve RDWS
- For water resource, having abundant water resources is clearly a helpful factor with regard to rural water supply, but it is not a prerequisite for achieving a high level of RDWS. Southwest China’s Yunnan Province, for example, has abundant water resources and yet a very low level of RDWS owing to weak water supply infrastructure and relatively high rates of microbiological contamination in drinking water. Infrastructure and technical capacity building investments for rural water supply should therefore be increased, even in regions with abundant supply. The government should also work to improve the efficiency of water use. In 2015, water productivity in China was USD 15 per cubic meter on average, a level well below that of high-income countries (USD 35.80 per cubic meter) [43]. This gap means China still has a lot of room to improve water resource management and water use efficiency. Reliable water-saving measures and rigorous water pollution control should be pursued in rural China.
- For economic and social development, while the government should promote economic growth and guarantee stable financial support for rural water supply infrastructure construction, maintenance, and operation, the government should also revise or create policies to relieve the pressure from the excessive growth and support water saving innovations in industry and agriculture.
- For water consumption, insufficient water consumption and unreasonable water pricing are limiting the development of many rural water utilities. To increase water use efficiency, a more open and transparent water price formation mechanism should be established. Urban and Rural Integrated Water Supply (URIWS) in east China, such as in Zhejiang and Jiangsu provinces, improved the level of RDWS greatly [44]. URIWS may be a good option for improving the sustainable development of rural water supply elsewhere in China as well. More broadly, to support the sustainable development of the rural water utilities, especially in poor areas, direct financial support should be given by the governments at all levels to cover parts of utility operation costs.
- For water pollution, improved water source protection should be a top priority, and additional regulations should be developed to further this objective. Other measures, such as consolidating water quality monitoring among government agencies, better regulating and controlling point-sources of pollution, and strengthening the wastewater discharge permit system, should also be considered. Leveraging RDWS as a means to fight against water pollution is especially important for provinces in the Huaihe River Basin, such as Anhui, Shandong, and Henan provinces. The level of RDWS in these provinces does not align with their levels of socioeconomic development. Water quality problems (such as nitrate and high chemical oxygen demand) likely due to water pollution may explain this apparent mismatch. China’s government has proposed an Action Plan for Prevention and Control of Water Pollution [45], which is an action guide for national efforts against water pollution, and this may prove to be helpful in this regard.
4.4. Limitations
5. Conclusions
Author Contributions
Funding
Acknowledgments
Conflicts of Interest
Appendix A

| Province | RDWSI | Province | RDWSI | Province | RDWSI | Province | RDWSI |
|---|---|---|---|---|---|---|---|
| Beijing | 90.02 | Shanghai | 97.82 | Hubei | 60.68 | Yunnan | 57.08 |
| Tianjin | 68.76 | Jiangsu | 89.99 | Hunan | 57.34 | Tibet | 34.68 |
| Hebei | 71.06 | Zhejiang | 79.44 | Guangdong | 72.78 | Shaanxi | 53.49 |
| Shanxi | 66.62 | Anhui | 58.44 | Guangxi | 56.60 | Gansu | 52.61 |
| Inner Mongolia | 53.62 | Fujian | 71.58 | Hainan | 63.28 | Qinghai | 53.51 |
| Liaoning | 62.38 | Jiangxi | 56.19 | Chongqing | 66.31 | Ningxia | 54.12 |
| Jilin | 70.98 | Shandong | 69.31 | Sichuan | 57.95 | Xinjiang | 67.03 |
| Heilongjiang | 67.40 | Henan | 58.35 | Guizhou | 49.95 | - | - |
References
- Bartram, J.; Cairncross, S. Hygiene, sanitation, and water: Forgotten foundations of health. PLoS Med. 2010, 7, e1000367. [Google Scholar] [CrossRef]
- Amrose, S.; Burt, Z.; Ray, I. Safe drinking water for low-income regions. Ann. Rev. Environ. Resour. 2015, 40, 203–231. [Google Scholar] [CrossRef]
- Bain, R.; Wright, J.A.; Christenson, E.; Bartram, J. Rural: Urban inequalities in post 2015 targets and indicators for drinking-water. Sci. Total Environ. 2014, 490, 509–513. [Google Scholar] [CrossRef] [PubMed]
- WHO/UNICEF. Drinking Water: Equity, Safety and Sustainability; WHO/UNICEF: New York, NY, USA, 2011. [Google Scholar]
- Nogueira, G.; Nakamura, C.V.; Tognim, M.C.; Abreu Filho, B.A.; Dias Filho, B.P. Microbiological quality of drinking water of urban and rural communities, Brazil. Rev. Saúde Pública 2003, 37, 232–236. [Google Scholar] [CrossRef] [PubMed]
- Charrois, J.W. Private drinking water supplies: Challenges for public health. Can. Med. Assoc. J. 2010, 182, 1061–1064. [Google Scholar] [CrossRef] [PubMed]
- Liu, Z. Research on Rural Drinking Water Projects Management. In Informatics and Management Science IV; Springer: Berlin, Germany, 2013; pp. 307–313. [Google Scholar]
- Medema, G.J.; Payment, P.; Dufour, A.; Robertson, W.; Waite, M.; Hunter, P.; Kirby, R.; Andersson, Y. Safe drinking water: An ongoing challenge. In Assessing Microbial Safety of Drinking Water; OECD/WHO: Paris, France, 2003; pp. 11–45. [Google Scholar]
- Yang, H.; Bain, R.; Bartram, J.; Gundry, S.; Pedley, S.; Wright, J. Water safety and inequality in access to drinking-water between rich and poor households. Environ. Sci. Technol. 2013, 47, 1222–1230. [Google Scholar] [CrossRef] [PubMed]
- Dai, L.; Wang, J. Evaluation of the profitability of power listed companies based on entropy improved TOPSIS method. Procedia Eng. 2011, 15, 4728–4732. [Google Scholar] [CrossRef]
- Hongwei, L.; Mou, L.; Song, Y. The research and practice of water quality safety evaluation for Ji Nan urban water supply system. Procedia Environ. Sci. 2011, 11, 1197–1203. [Google Scholar] [CrossRef]
- Meng, X.-M.; Hu, H.-P. Application of set pair analysis model based on entropy weight to comprehensive evaluation of water quality. J. Hydraul. Eng. 2009, 3, 257–262. [Google Scholar]
- Tong, F.; Dong, Z.-C.; Qiu, D.-H. A new method for regional water security system assessment—Set pair analysis method. Adv. Sci. Technol. Water Resour. 2008, 2, 008. [Google Scholar] [CrossRef]
- Wang, J.; Da, L.; Song, K.; Li, B.-L. Temporal variations of surface water quality in urban, suburban and rural areas during rapid urbanization in Shanghai, China. Environ. Pollut. 2008, 152, 387–393. [Google Scholar] [CrossRef] [PubMed]
- Cai, X. Water stress, water transfer and social equity in Northern China—Implications for policy reforms. J. Environ. Manag. 2008, 87, 14–25. [Google Scholar] [CrossRef] [PubMed]
- Gong, P.; Liang, S.; Carlton, E.J.; Jiang, Q.; Wu, J.; Wang, L.; Remais, J.V. Urbanisation and health in China. Lancet 2012, 379, 843–852. [Google Scholar] [CrossRef]
- Li, H.; Zhang, Q.; Li, W.; Luo, Q.; Liu, K.; Tao, Y. Spatial analysis of rural drinking water supply in China. Water Policy 2015, 17, 441–453. [Google Scholar] [CrossRef]
- Yuan-qing, Y.; Qing-jiang, P.; Yan, S.; Ling, J. Research on safety of country drinking water quality in China. J. Shandong Agric. Univ. (Nat. Sci. Ed.) 2008, 1, 026. Available online: http://kns.cnki.net/KCMS/detail/detail.aspx?dbcode=CJFQ&dbname=CJFD2008&filename=SCHO200801026&v=MTEyMTZVNzdLTmk3RFliRzRIdG5Ncm85SFlvUjhlWDFMdXhZUzdEaDFUM3FUcldNMUZyQ1VSTEtlWmVSdUZpRG4= (accessed on 28 May 2018).
- Cheng, H.; Hu, Y.; Zhao, J. Meeting China’s water shortage crisis: Current practices and challenges. Environ. Sci. Technol. 2009, 43, 240–244. [Google Scholar] [CrossRef]
- Xie, J. Addressing China’s Water Scarcity: Recommendations for Selected Water Resource Management Issues; World Bank Publications: Washington, DC, USA, 2009. [Google Scholar]
- Yanbing, C.; Peng, L. The pricing mechanism for safety drinking water supply in rural area. Energy Procedia 2011, 5, 1467–1472. [Google Scholar] [CrossRef]
- OECD. Environmental Indicators: OECD Core Set; illustrated ed.; Organisation for Economic Co-Operation and Development: Paris, France, 1994. [Google Scholar]
- OECD, OECD Glossary of Statistical Terms. Available online: https://stats.oecd.org/glossary/detail.asp?ID=2105 (accessed on 28 May 2018).
- Wolfslehner, B.; Vacik, H. Evaluating sustainable forest management strategies with the analytic network process in a pressure-state-response framework. J. Environ. Manag. 2008, 88, 1–10. [Google Scholar] [CrossRef] [PubMed]
- Koskei, E.; Koskei, R.; Koske, M.; Koech, H. Effect of socio-economic factors on access to improved water sources and basic sanitation in bomet municipality, Kenya. Res. J. Environ. Earth Sci. 2013, 5, 714–719. [Google Scholar]
- Safari, D. Impact of Socio-Economic Factors and Water Quality on Human Health in Rural Areas of Bufundi Sub County in Uganda: Implications for Policy and Practice; Clark University: Worcester, MA, USA, 2013. [Google Scholar]
- Raditloaneng, W.N. Socio-Economic Factors in Rural Water Scarcity: A Case Study of Molepolole Village in Botswana. Am. J. Hum. Ecol. 2012, 1, 95–101. [Google Scholar]
- Linser, S. Critical Analysis of the Basics for the Assessment of Sustainable Development by Indicators; Forstliche Versuchs-und Forschungsanst: Baden-Württemberg, Germany, 2002. [Google Scholar]
- Kassambara, A. Factoextra: Extract and Visualization of the Outputs of a Multivariate Analysis. Available online: https://cran.r-project.org/web/packages/factoextra/README.html (accessed on 28 May 2018).
- Thompson, B. Canonical Correlation Analysis. In Encyclopedia of Statistics in Behavioral Science; John Wiley & Sons, Ltd.: Hoboken, NJ, USA, 2005. [Google Scholar]
- González, I.; Déjean, S.; Martin, P.G.; Baccini, A. CCA: An R Package to Extend Canonical Correlation Analysis. J. Stat. Softw. 2008, 23, 1–14. [Google Scholar] [CrossRef]
- Bartlett, M.S. A note on tests of significance in multivariate analysis. In Mathematical Proceedings of the Cambridge Philosophical Society; Cambridge University Press: Cambridge, UK, 1939; pp. 180–185. [Google Scholar]
- Sanctuary, M. Making Water a Part of Economic Development: The Economic Benefits of Improved Water Management and Services; Stockholm International Water Institute (SIWI): Stockholm, Sweden, 2007. [Google Scholar]
- Van Minh, H.; Nguyen-Viet, H. Economic aspects of sanitation in developing countries. Environ. Health Insights 2011, 5, 63. [Google Scholar] [CrossRef] [PubMed]
- Katzman, M.T. Income and price elasticities of demand for water in developing countries. J. Am. Water Resour. Assoc. 1977, 13, 47–55. [Google Scholar] [CrossRef]
- Soto Montes de Oca, G.; Bateman, I.J. Scope sensitivity in households’ willingness to pay for maintained and improved water supplies in a developing world urban area: Investigating the influence of baseline supply quality and income distribution upon stated preferences in Mexico City. Water Resour. Res. 2006, 42. [Google Scholar] [CrossRef]
- Zhang, L.; Gao, S.; Wei, B.; Li, Y.; Li, H.; Wang, L.; Ye, B. Effects of Urbanization on Rural Drinking Water Quality in Beijing, China. Sustainability 2017, 9, 461. [Google Scholar] [CrossRef]
- Delpla, I.; Jung, A.-V.; Baures, E.; Clement, M.; Thomas, O. Impacts of climate change on surface water quality in relation to drinking water production. Environ. Int. 2009, 35, 1225–1233. [Google Scholar] [CrossRef] [PubMed]
- Mimikou, M.; Baltas, E.; Varanou, E.; Pantazis, K. Regional impacts of climate change on water resources quantity and quality indicators. J. Hydrol. 2000, 234, 95–109. [Google Scholar] [CrossRef]
- Jiang, Y. China’s water scarcity. J. Environ. Manag. 2009, 90, 3185–3196. [Google Scholar] [CrossRef]
- Burke, S.; Mulligan, M. The role of seasonal water scarcity on water quality: A global analysis with case study in the Magdalena, Colombia. In Proceedings of the 19th EGU General Assembly, Vienna, Austria, 23–28 April 2017; p. 14598. [Google Scholar]
- He, C.; Zhu, S. Economic Transition and Industrial Restructuring in China: Structural Convergence or Divergence? Post-Communist Econ. 2007, 19, 317–342. [Google Scholar]
- Knoema China—Water Productivity. Available online: https://knoema.com/atlas/China/Water-productivity (accessed on 17 May 2018).
- Yu, X.; Geng, Y.; Heck, P.; Xue, B. A review of China’s rural water management. Sustainability 2015, 7, 5773–5792. [Google Scholar] [CrossRef]
- Council, S. Action Plan for Prevention and Control of Water Pollution printed and Distributed. Available online: http://english.mep.gov.cn/News_service/news_release/201504/t20150427_299595.shtml (accessed on 28 May 2018).


| Indicator | Indicator Definition | Data Source/s |
|---|---|---|
| State Indicators: | ||
| Rural Popularization Rate of Tap Water (RPRTW) | RPRTW indicates the proportion of the population drinking tap water in rural areas via measuring the number of people in rural areas with access to tap water per 100 residents. | China National Health Yearbook |
| Total Eligible Rate of Rural Drinking Water Quality (TERRDWQ) | TERRDWQ indicates the proportion of rural drinking water samples in conformity with national drinking water standard in the total tested water samples in 2006 National Rural Drinking Water and Environmental Health Status Survey. | National Rural Drinking Water and Environmental Health Status Survey |
| Percentage of Households with Difficulty in access to Drinking Water (PHDDW) | PHDDW indicates the proportion of households with difficulty in accessing drinking water in total survey populations in the Second National Agricultural Census in China. | 2nd National Agricultural Census in China |
| Percentage of Towns Covered by Centralized Water Supply (PTCCWS) | PTCCWS indicates the proportion of towns covered by centralized water supply in the total surveyed towns. | 2nd National Agricultural Census in China |
| Pressure Indicators: | ||
| Per-capita Water Resources * (PWR) | PWR was calculated by provincial water resource amount divided by the provincial total population. | China Statistical Yearbook |
| Total Volume of Water Supply (TVWS) | TVWS means the provincial total water supply in one year. | China Statistical Yearbook |
| Gross Domestic Product per Capita (GDPPC) | GDPPC is a measure of the total output that takes gross domestic product (GDP) and divides it by the number of people. | China Statistical Yearbook |
| Rural Per Capita Annual Net Income (RPCANI) | RPCANI is an average of total annual income per capita. | China Statistical Yearbook |
| Percentage of the Contribution to GDP from Primary and Secondary Industry (PCPSI) | PCPSI is a measure of the total contribution of secondary and tertiary industry divided by the GDP. | China Statistical Yearbook |
| Urbanization Rate (UR) | UR is defined as the proportion of total population residing in urban areas of the province. | China Statistical Yearbook |
| Population Density (PD) | PD is a measurement of population per unit area. | China Statistical Yearbook |
| Rate of Natural Increase (RNI) | RNI is the crude birth rate minus the crude death rate. | China Statistical Yearbook |
| Water Consumption of 10 thousand RMB GDP (WQ/GDP) | WQ/GDP means the total water consumption for every 10 thousand RMB worth of GDP produced. | China Statistical Yearbook |
| Water Consumption per Capita (WCPC) | WCPC is measure of the total water consumption divided by the total population. | China Statistical Yearbook |
| Discharge Standard-meeting Rate of Industrial Wastewater (DSRIW) | DSRIW is defined as the proportion of wastewater discharge amount in the total industrial wastewater discharge. | China Statistical Yearbook |
| Proportion of Towns with Sewage Treatment (PTST) | PTST is measure of the total town number with sewage treatment divided by the total town number. | China Statistical Yearbook |
| First Set | Second Set | Canonical Correlation Coefficient | Proportion | Probability Value |
|---|---|---|---|---|
| Economic factor subgroup (GDPPC, RPCANI, and PCPSI) | RDWS | λ1 = 0.86 | 0.938 | <0.0001 |
| λ2 = 0.26 | 0.003 | 0.996 | ||
| λ3 = 0.12 | 0.001 | 0.982 | ||
| Subgroup of social development indicators (UR, PD, and RNI) | RDWS | λ1 = 0.21 | 0.835 | <0.0001 |
| λ2 = 0.10 | 0.002 | 0.899 | ||
| λ3 = 0.08 | 0.001 | 0.964 | ||
| Subgroup of environmental indicators (PTST, DSRIW) | RDWS | λ1 = 0.89 | 0.895 | <0.0001 |
| λ2 = 0.56 | 0.003 | 0.995 | ||
| λ3 = 0.27 | 0.001 | 0.920 | ||
| Water resource indicator subgroup (PWR, TVWS) | RDWS | λ1 = 0.71 | 0.718 | 0.0039 |
| λ2 = 0.49 | 0.005 | 0.996 | ||
| λ3 = 0.16 | 0.001 | 0.975 | ||
| Consumption factors subgroup (WQ/GDP, WCPC) | RDWS | λ1 = 0.88 | 0.887 | <0.0001 |
| λ2 = 0.56 | 0.006 | 0.991 | ||
| λ3 = 0.12 | 0.002 | 0.898 |
| Groups | Formation of Canonical Variant |
|---|---|
| Economy factor subgroup and RDWS | |
| Subgroup of social development indicators and RDWS | |
| Subgroup of environmental indicators and RDWS | |
| Water resource indicator subgroup and RDWS | |
| Consumption factors subgroup and RDWS |
© 2018 by the authors. Licensee MDPI, Basel, Switzerland. This article is an open access article distributed under the terms and conditions of the Creative Commons Attribution (CC BY) license (http://creativecommons.org/licenses/by/4.0/).
Share and Cite
Li, H.; Cohen, A.; Li, Z.; Zhang, M. The Impacts of Socioeconomic Development on Rural Drinking Water Safety in China: A Provincial-Level Comparative Analysis. Sustainability 2019, 11, 85. https://doi.org/10.3390/su11010085
Li H, Cohen A, Li Z, Zhang M. The Impacts of Socioeconomic Development on Rural Drinking Water Safety in China: A Provincial-Level Comparative Analysis. Sustainability. 2019; 11(1):85. https://doi.org/10.3390/su11010085
Chicago/Turabian StyleLi, Hongxing, Alasdair Cohen, Zheng Li, and Mengjie Zhang. 2019. "The Impacts of Socioeconomic Development on Rural Drinking Water Safety in China: A Provincial-Level Comparative Analysis" Sustainability 11, no. 1: 85. https://doi.org/10.3390/su11010085
APA StyleLi, H., Cohen, A., Li, Z., & Zhang, M. (2019). The Impacts of Socioeconomic Development on Rural Drinking Water Safety in China: A Provincial-Level Comparative Analysis. Sustainability, 11(1), 85. https://doi.org/10.3390/su11010085