Article

Yield of Leafy Greens and Microclimate in Deep Winter Greenhouse Production in Minnesota

1
Department of Horticultural Sciences, University of Minnesota, St Paul, MN 55108, USA
2
Center for Sustainable Building Research, University of Minnesota, Minneapolis, MN 55455, USA
3
Sustainable Development Partnerships, University of Minnesota, Minneapolis, MN 55455, USA
*
Author to whom correspondence should be addressed.
Sustainability 2019, 11(1), 28; https://doi.org/10.3390/su11010028
Submission received: 29 November 2018 / Revised: 17 December 2018 / Accepted: 18 December 2018 / Published: 21 December 2018
(This article belongs to the Special Issue Sustainable Crop Production Systems)

Abstract

:
The Deep Winter Greenhouse (DWG) uses passive solar technology to create an environment where cold tolerant crops like leafy greens can be grown during the winter to satisfy consumer demand for fresh local produce year-round and increase revenue for farmers. A cultivar trial consisting of 12 different salad greens was conducted in partnership with three farmers in order to determine suitable cultivars for these unique systems. Yield and days to maturity were recorded, and microclimate conditions such as light, temperature, and relative humidity were tracked throughout the season. This study included three sites from three distinct locations within Minnesota. Environmental differences among the DWG sites and within site replicates were observed. Yield also varied with micro-climate. The trials demonstrate that lettuces and greens such as ‘Florence’ (Lactuca sativa L.), ‘Salanova’ (Lactuca sativa L.), and ‘Vitamin Green’ (Brassica rapa L.) generally grow well. These cultivar trials, coupled with other horticultural trials and economic analyses, will better inform recommendations for farmers growing in these unique environments.

1. Introduction

Studies around the world are highlighting the importance of finding novel production methods or revisiting traditional methods of food production to support the shift towards a more resource efficient and low-carbon economy. Alternative methods will be needed now and in the future to adapt to changing climates while meeting increasing consumer demand for local, fresh produce. For example, heavy rains detrimental to vegetable production in the Philippines prompted farmers and researchers to build low-cost protective structures and evaluate the technical and economic feasibility of growing vegetables under these structures [1]. Theurl et al. described how the adaption of historic European cultivation techniques for unheated winter vegetable production has gained momentum recently in Austria, instead of relying on either imported greens or producing them locally in energy-intensive heated glasshouses [2]. Lastly, Chinese solar greenhouses (CSG) are used widely in northern China for vegetable production due to the relatively low construction cost and zero heat energy input even when external temperatures had fallen below −10 °C [3].
Likewise, small- and medium-scale farmers in the Upper Midwest are looking for new ways to increase their income and meet the demand for locally grown fresh food year round. Recently, market farmers in the Midwest have had success with year-round vegetable production using season extension structures such as high tunnels or hoop-houses [4]. Despite the benefits, high tunnels, constructed of poles and thin plastic sheeting, are frequently damaged by excessive wind pressure on prairie landscapes [5]. Further, production ceases or at least stalls in the winter months in high tunnels, especially in Minnesota, where temperatures average −10 °C [6].
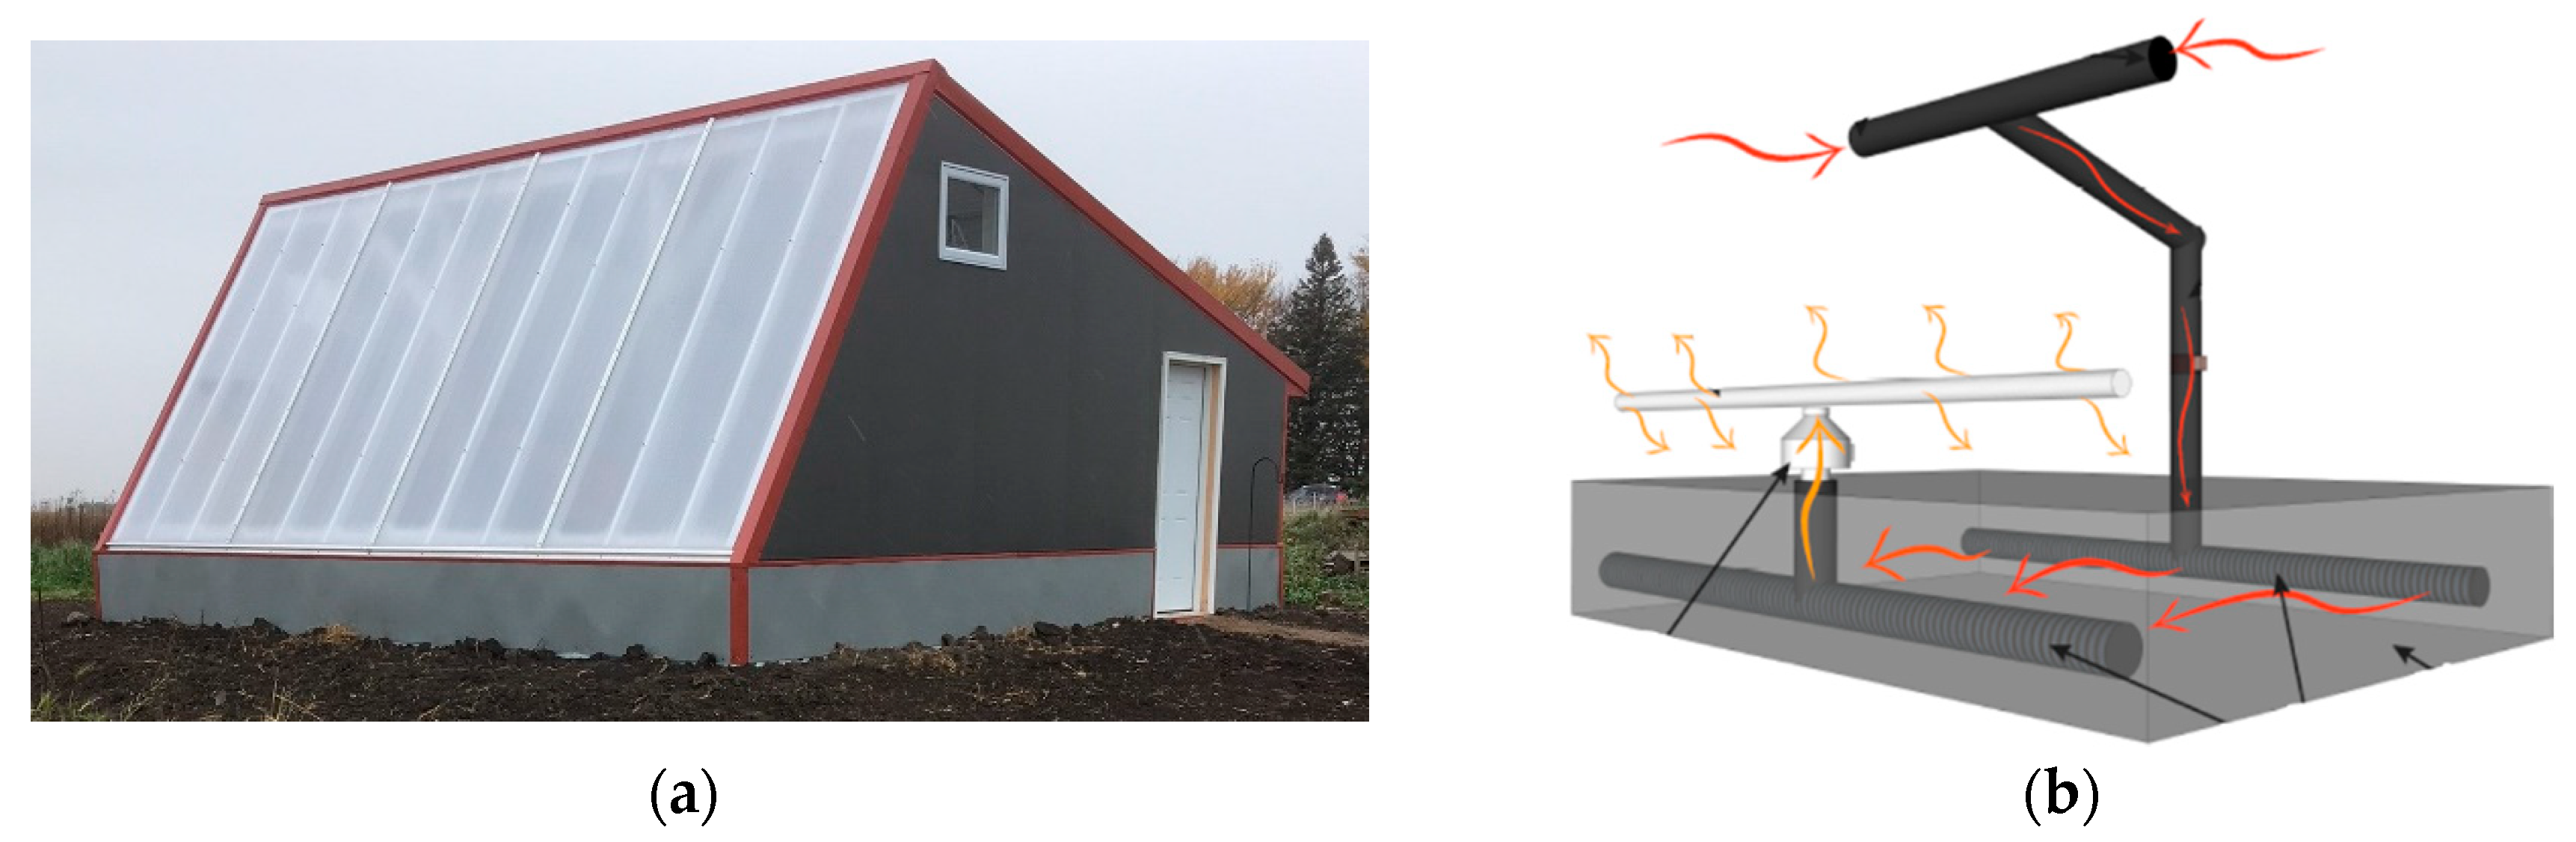
Deep Winter Greenhouses (DWGs) are an emerging technology and production system designed to grow cold tolerant crops during the coldest winter months (Figure 1a) [7]. Similar in design to CSG and solar greenhouses described in The Solar Greenhouse Book, DWG are constructed of common, low-cost building and greenhouse supplies [8]. Conceived from farmers’ innovation and entrepreneurship, The Northlands Winter Greenhouse Manual describes the original design, “v1.0” [7]. Recent architectural improvements have been made to DWG v1.0, culminating now in a research-based building design referred to as DWG v2.0 [9]. Deep Winter Greenhouses are designed to strategically combine thermal mass and insulation to capture and store energy from the sun [7]. This solar heat, stored in a below-ground rock bed, radiates into the growing space at night, making it possible to grow greens throughout the winter with little or no use of fossil fuels (Figure 1b) [9].
Cold tolerant, high-value salad mix components like leafy brassicas and lettuces can be grown in DWGs [7,10]. Research from Collie et al. and Borrelli et al. demonstrated that winter production of salad greens was possible in minimally heated conventional greenhouses and high tunnels, but also stressed the importance of identifying the most suitable cultivars [11,12]. Furthermore, research conducted in growth chambers mimicking the low irradiance and CO2 levels characteristic of controlled environments like DWGs, suggest that certain crops may be more suitable based on their photosynthetic rate [13]. Growth responses to environmental light are, in general, influenced by both quantity (day length, solar angle, cloud cover, plant arrangement) and quality (transmission through greenhouse, reflection from nearby surfaces), while there is also an interaction with temperature and cultural practices [4,14,15].
Current DWG producers have a general understanding of specific production practices and crop cultivars that thrive in the DWG system. However, most of their knowledge is anecdotal, rather than research-based. The purpose of this study was to (1) evaluate the suitability of different salad green cultivars for growth in DWGs based on their yield and days to maturity (DTM), and (2) characterize the microclimate of three DWGs and their potential effects on greens. The specific objective was to examine the effects of location, replicate placement, cultivar, and harvest on yield and DTM of the cultivars included in this study. These results could assist growers in their cultivar decisions and DWG microclimate management strategies, to produce fresh salad mixes for the local market during the winter and early spring seasons, and provide a general model for growers in northern cold climates.

2. Materials and Methods

2.1. Study Locations

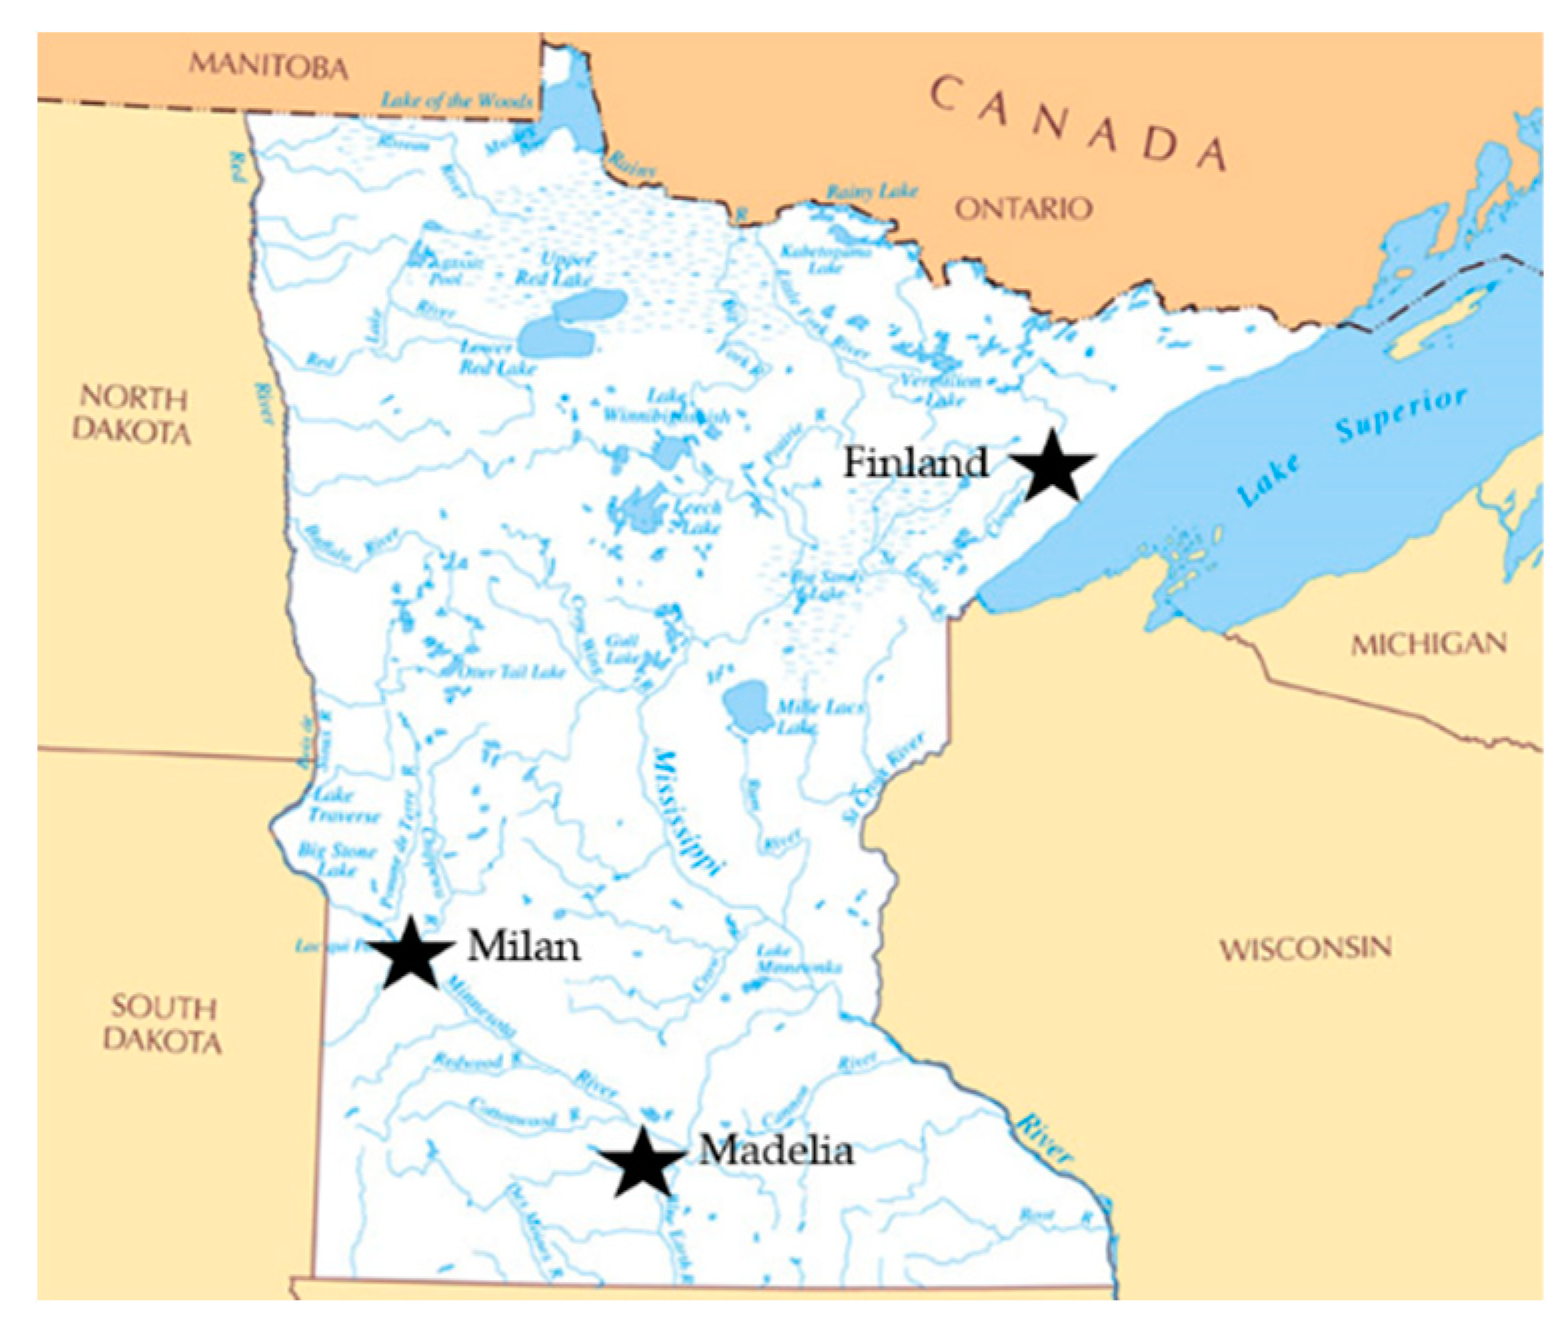
This experiment was conducted in partnership with three farmers in Minnesota during the winter and early spring of 2018 in their DWGs. The first location was in Milan, MN (lat. 45.11° N, long. 95.92° W; Figure 2) at Garden Goddess DWG v1.0 greenhouse, the original design on which the other v2.0 prototypes are based. We included this as a site in order to compare the growing and climatic differences to the v2.0s. The v2.0 sites were Finland, MN (lat. 47.42° N, long. 91.25° W; Figure 2) at the Organic Consumers Association (OCA) Agroecology Research Center; and Madelia, MN (lat. 44.15° N, long. 94.90° W; Figure 2) at Alternative Roots Farm. The average temperature from January to March was −6 °C in Finland and −3 °C in both Milan and Madelia [16].
Garden Goddess uses most of their greens personally, but also sells to friends and community members. As a non-profit, OCA functions as an educational farm and donates their greens to the local grocery store. Alternative Roots is a production farm and sells greens through a winter community supported agriculture (CSA) program and at local farmers’ markets.

2.2. Deep Winter Greenhouse Structure and Technology

Plans for constructing and growing in the DWG v1.0 are available in The Northlands Winter Greenhouse Manual [7]. This original structure in Milan is attached to a garage, and the dimensions of the space are 6.7 × 4.9 m2, with a 1.2 m knee wall and a 3 m high twin-wall polycarbonate glazing wall on a 45° angle. The PAR light transmission through the twin-wall polycarbonate is 80% and has a U-value of 0.58, a solar heat gain coefficient (SHGC) of 0.77, and a visible transmittance (VT) of 82% [17]. The v2.0 builds on the v1.0 design by increasing above-grade wall insulation to R-23, placing roof insulation at R-30, and improving enclosure airtightness and assembly details. The free-standing DWG v2.0s in Finland and Madelia are 2.23 m2 with 32 m3 of growing space closest to the glazing wall and a 16 m2 packing shed on the rear of the building. The 16 mm triple-wall polycarbonate south-facing glazing wall is set at a 60° angle measuring 3.5 m from foundation to roof. The DWG v2.0 design uses a triple-wall polycarbonate glazing for its lower U-value of 0.41. PAR light transmission is 75%, the SHGC is 0.68, and VT is 74% [17]. Specific details regarding structure dimensions, building materials, and plans for constructing a Deep Winter Greenhouse v2.0 are available online at z.umn.edu/DWGplans. Both DWG versions 1.0 and 2.0 function in essentially the same manner. When solar radiation passes through this steeply sloped polycarbonate, a fan moves heated air into an underground rock bed thermal mass. The rock bed, dug below the frost-line to 1.2 m and perimeter insulated with R-10 extruded polystyrene, acts as both a source and sink of heat depending on the temperature of the above ground growing space. There is a backup furnace set to 7 °C if needed. Ventilation occurs by opening windows near the peak and opening either or both of the doors to the packing shed or exterior.

2.3. Experimental Design

We followed current DWG growing methods and utilized standard 10 cm gutters, cut to 1 m lengths with commercial gutter caps on the ends, as our planters. Typically, these gutters are either hung in slings from building rafters, or set on wooden shelves in vertical tiers to maximize sunlight on each gutter. We employed a 184 × 121 × 146 cm 3-tier metal shelving unit with shelves 46 cm apart, and the bottom shelf set 15 cm below the level of the exhaust manifold, and the whole shelf set back 1.8 m from the manifold. This particular layout was developed in the program SketchUp (Trimble, Inc., Sunnyvale, CA, USA) in order to prevent shading between shelves based on the sun’s angle on the glazing wall at noon on the solstice. Six gutters were placed on each shelf and blocked as replicates in a randomized complete block design (i.e., the top shelf was Rep 1, middle shelf was Rep 2, and bottom shelf was Rep 3). In order to maximize the number of cultivars trialed in the limited space, gutters were divided in half and each cultivar was seeded into respective half-gutters. Gutters were rotated or flipped in place within each shelf periodically to decrease the effects of shading on plants further from the glazing wall.

2.4. Growing Methods

Twelve cultivars of salad greens were trialed in this study (Table 1) chosen based on grower preferences [7], previous research in winter greenhouses [11,12,13], and seed company descriptors of traits such as “germination at low temperatures”, “slow to bolt”, and/or “fast-growth” that would be beneficial in the unique DWG system. Greens were seeded at rates ranging from 574 to 864 seeds m−2, depending on seed size and based on seed company recommendations, then covered lightly with vermiculite and pressed down to ensure good seed-substrate contact. Gutters were watered as needed according to grower practices. Greens were grown in a custom grower mix consisting of peat, vermiculite, compost, lime, blood meal, greensand, and rock phosphate [7]. Greens were harvested at maturity (~10 cm), recording days to maturity (DTM) and fresh weight yield. Up to three harvests or cuttings were taken on each cultivar depending on the growth rate. This experiment was repeated twice at Finland and Milan, referred to as “plantings”. Planting dates were 15 January 2018 in Madelia, 19 January and 12 March in Finland, and 16 January and 27 March in Milan.
Microclimate measurements. Substrate temperature and moisture were measured using ECH20 5TM probes with an EM60G 6-port data logger (METER Group, Pullman, WA, USA), and air temperature, relative humidity, and light intensity were measured using a HOBO® Pro v2 (Onset Computer Corporation, Bourne, MA, USA) and HOBO® Pendant (Onset Computer Corporation, Bourne, MA, USA), respectively. Loggers were placed at plant height on each shelf/replicate and recorded at 15 min intervals. Rock bed ambient temperature and relative humidity were also measured using a HOBO® Pro v2 at 15 min intervals at all locations, by lowering the sensor down into a ventilation tube. Growing degree days (GDD) were calculated from daily indoor air temperature readings at all locations with a base temperature of 4 °C for Asian greens, lettuce and spinach [12].

2.5. Statistical Analysis

Data were analyzed using RStudio 1.1.456 (Free Software Foundation, Inc., Boston, MA, USA). Given the different growing environments related to DWG design and farmer management, locations were analyzed separately for fresh weight yield and DTM data. We were, however, able to compare the microclimate data across locations as variances for this dataset were homogeneous. All data were verified for normality and constant variance of residuals using QQ and residuals versus fitted values plots, and quantitatively using the Shapiro-Wilk’s, Bartlett’s, and Levene’s tests using the ‘stats’ and ‘car’ packages in R.
Effects of cultivar, replication, harvest (i.e., first, second, or third cutting), and microclimate on salad green fresh weight yield and DTM, were analyzed with analysis of variance (ANOVA) tests for each location. Microclimate parameters were compared across locations, replicates, and their effect on yield and DTM were also analyzed with ANOVA tests. Treatment means were separated using Tukey’s Honestly Significant Difference (HSD) at 5% level of significance. Pearson’s correlation coefficients were calculated for light intensities and air temperatures, and for air and soil temperatures.

3. Results

3.1. Comparing Location Microclimates

Microclimate conditions averaged across the growing season are presented in Table 2 for all locations. The temperature range is also shown for each location, which ranged overall from 2 to 50 °C. Finland had the highest temperature recorded due to improper ventilation management of the space during the lead farmer’s absence. Milan experienced the lowest temperature minimum and the lowest average temperature (11 °C) compared to the averages of 16 °C and 17 °C in Finland and Madelia, respectively. Average soil and rock bed temperatures closely resembled air temperatures in each location. The narrowest temperature range, as well as the most time (24%) in the ideal range of 16–21 °C was recorded at Madelia. Temperatures in this ideal range were only recorded in Finland 16% of the time and 13% of the time in Milan (data not shown).
Growing degree days (GDD) were, on average, 10 GDD higher in DWG v2.0s than the DWG v1.0 (data not shown). By the end of the trial in Madelia on March 22, cumulative GDD in Milan (DWG v1.0) were only 40% what the DWG v2.0s had accumulated (Figure 3). GDD in Madelia were consistently higher and GDD accumulated more uniformly compared to the other locations (Figure 3). Light intensity was significantly higher in Madelia than Finland (p < 0.0001). This makes sense given the lower latitude, and therefore longer days, in Madelia. Light intensity was not measured at Milan, though the lower internal DWG temperatures could be indicative of less sunlight. Light intensity and temperature were positively correlated in these greenhouses (r = 0.7).
Relative humidity was higher on average in the DWG v2.0s than the DWG v1.0. While higher than desired, levels of 70% RH and above are expected since there are few opportunities for ventilation in the winter. Fortunately, no microbial or fungal growth was observed. Moreover, Finland has a wooden floor which may retain more moisture from watering, compared to the dirt floor of the other locations (the floor in Madelia is covered with landscaping fabric). Soil moisture, measured as volumetric water content, ranged from 16% to 24% across locations.

3.2. Comparing Replication Microclimates Across Locations

Trends across replicates, or shelves, were similar between locations (Table 3). The top shelf (Rep 1) was the warmest and plants in this replicate received the most light and, in two out of the three locations, had the least soil moisture. Correspondingly, the bottom shelf (Rep 3) was the coolest and plants in this replicate received the least amount of light and the most soil moisture. GDD follow these trends between replicates, but when accumulated show the importance of this seemingly minor variation (the top shelf accumulated 80 to 118 GDD more than Rep 2 and Rep 3, respectively). Differences in light are much greater between replicates; shading was apparent on the lower shelves, although gutters were rotated or flipped in place periodically to decrease the effects of shading on plants further from the glazing wall. These results are consistent with the higher yields found in Rep 1 among locations.

3.3. Milan

There were two plantings and up to two harvests in each planting at Milan. Means for both plant response and microclimate data are expressed on this basis, as plantings were similar. Microclimate characteristics varied significantly (p < 0.0001) across replicates with all measurements. Soil characteristics exhibited a trend in watering management by the grower, with Rep 1 drying out the fastest, Rep 2 (at arm level) receiving the most water, and Rep 3 falling in the middle, likely absorbing any excess water dripping from Rep 2 (Table 3). Soil temperatures follow these trends, with the lowest average temperature of 9 °C recorded for Rep 2.
When evaluated by replicate, total average fresh weight yields across cultivars and plantings were significantly higher (p < 0.05) in Rep 1, and decreased by 10 g at each lower replicate (Table 3). Days to maturity (DTM) was not significantly different based on replicate, but ranged from 37 to 48 days across cultivars. For all cultivars, the first harvest weight was significantly higher than the second, averaging 53 g in the first and 37 g in the second (data not shown). Average yields across harvests varied by cultivar, from the lettuce “Florence” with yields of 66 g, down to yields of 23 g for “Shelby” spinach (Figure 4). “Red Veined” sorrel and “Regiment” spinach did not reach maturity, and therefore were not harvested in Milan. The lettuces “Florence” and “Salanova”, as well as the brassicas (with the exception of “Spigariello Liscia”) performed the best in Milan. While DTM did not differ statistically among cultivars, there was a 17 day difference between “Esmee” arugula (37 days) and the endive “Frisee” (54 days).

3.4. Finland

There were two plantings and up to three harvests in Finland, and means for both plant response and microclimate data were averaged across plantings since they were similar (Table 3). Here, again, temperature and relative humidity varied by less than a point between replicates, with ambient and soil temperatures averaging 16 °C with 88% RH. Light intensity was significantly lower (p < 0.0001) on the replicates further from the glazing wall, indicating shading. Soil moisture was highest in Rep 3 and lowest in Rep 1, illustrating that the top shelf (Rep 1) nearest the glazing wall dries out the quickest in these environments.
No significant difference was found between replicates in terms of average plant fresh weight yield or DTM across cultivars. The mean first harvest of 62 g across cultivars was significantly higher than the second and third harvests. Significant differences were found based on cultivar, with “Salanova” yielding 54 g on average down to 23 g on average for “Spigariello Liscia” (Figure 4). Here, crop type influenced yields less, with “Salanova” lettuce, “Esmee” arugula, “Shelby” spinach, and the Asian green “Vitamin Green” among the highest yielding. DTM did vary significantly based on cultivar (p < 0.0001), ranging from “Florence” and “Frisee” maturing after 17 days on average, compared to “Red Veined” sorrel taking 50 days to mature.

3.5. Madelia

There was only one planting in Madelia, given their priority for starting transplants in their DWG, and up to three harvests. Means for both plant response and microclimate data are expressed as a season average when evaluated by replicate (Table 3). Ambient and soil temperatures, as well as ambient relative humidity and soil moisture means, followed similar trends as the other locations, with the highest temperatures recorded in Rep 1 and the highest moisture/humidity recorded in Rep 3. Light intensity was also highest in Rep 1, here, though shading was less apparent on the lower replicates with a difference of only 200 lux ft−2.
While not significantly different (p > 0.05), fresh weight yields were almost 10 g higher in Rep 1 than the lower replicates. DTM between replicates was also not significant in Madelia, but did differ by cultivar, following similar trends to Finland. Averaged across cultivars, yields were significantly different based on harvest, with yields averaging 76 g in the first cutting, followed by 42 g in the second, and 26 g in the third. “Salanova” was again among the highest yielding cultivars, exceeding others by 45–95 g, averaged across harvests (Figure 4). This head lettuce cultivar is bred and marketed as “40% higher yielding than traditional baby-leaf lettuce” (Johnny’s Selected Seeds), and it seems to grow well in the DWG gutter system.

4. Discussion

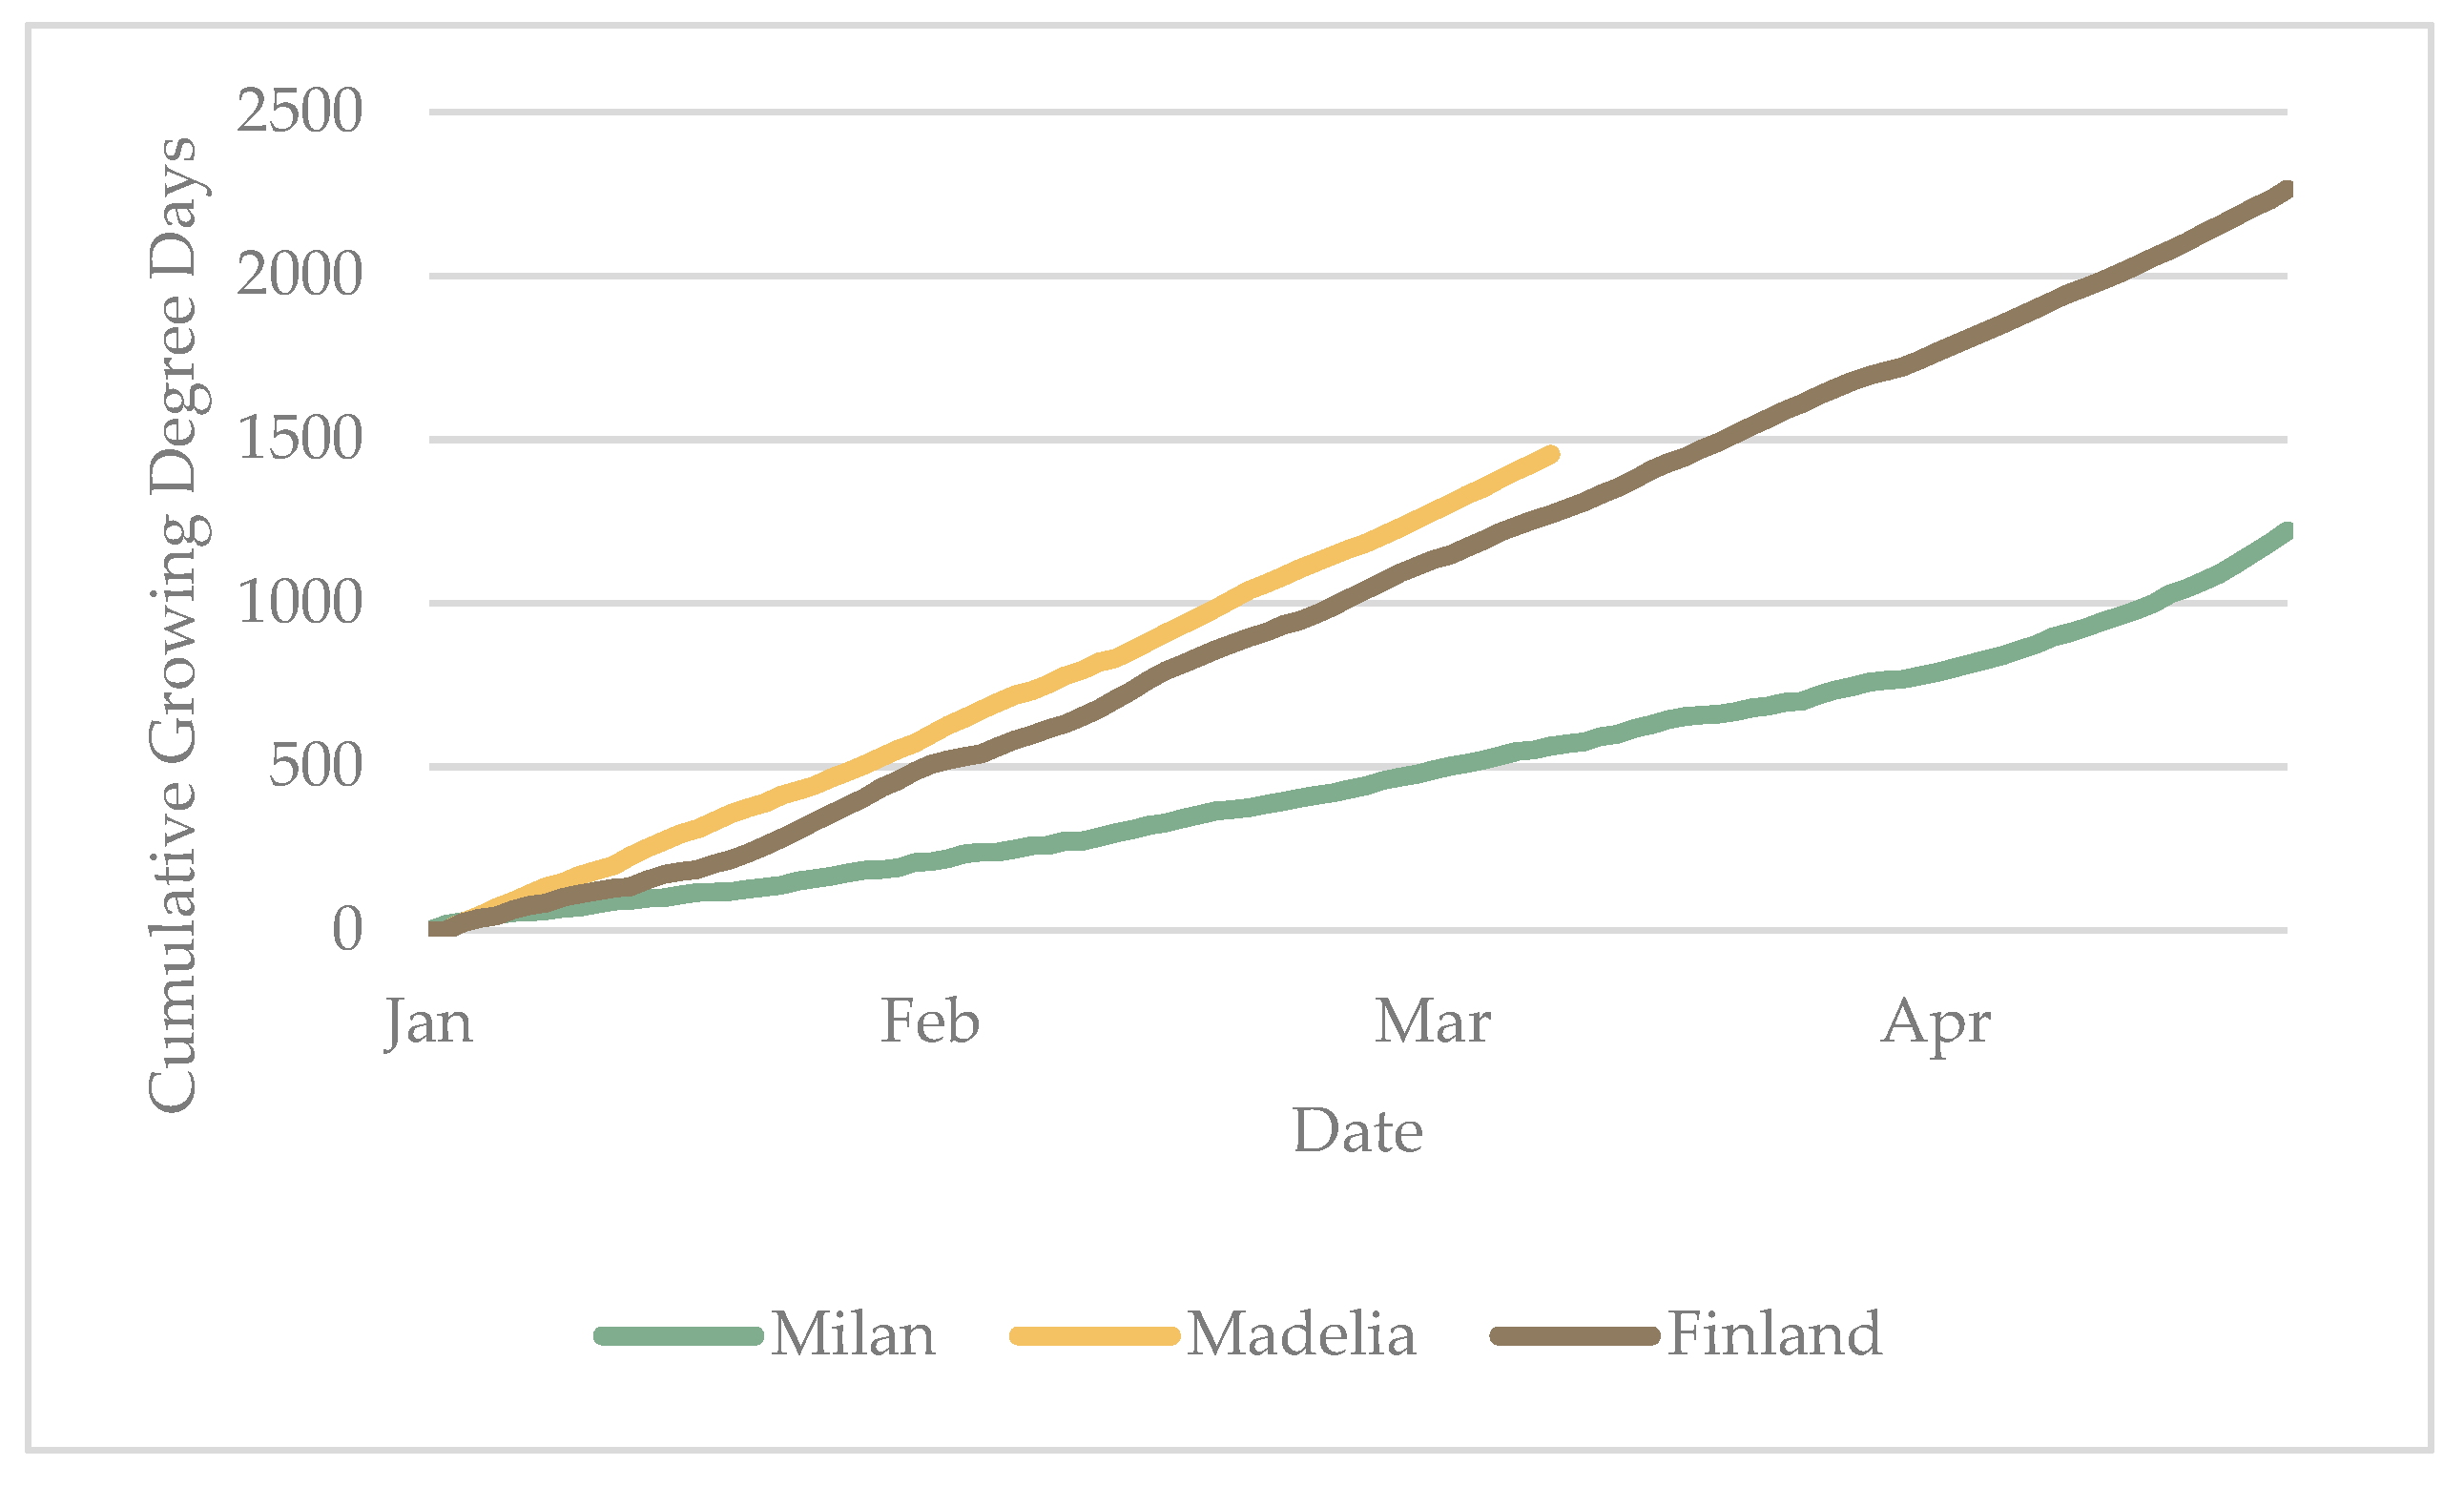
Overall, the temperature range of the DWGs was drastic within a given day and across the growing season. While temperatures fluctuated widely, GDD accumulated steadily, particularly in the DWG v2.0s (Figure 3). Light levels were also uneven, based on shelf height or replicate in the DWG, with low irradiance reaching the bottom shelves. Tao et al. found similar light distribution imbalances in CSG, with PAR intensity in the north section an average of 40% lower than the middle and south sections closer to the glazing wall [18]. The lower PAR resulted in elongated plants with lower dry weight and lower leaf photosynthetic capacity than those in the sections that received more light. Elongation is a shade avoidance response and lower yields were also observed in our study for the lowest shelf that received the least light. In practice, this uneven light distribution becomes important because it can lead to uneven harvest times and may result in heterogeneous product quality when salad components are mixed together.
Maximizing yield of leafy greens depends on photosynthesis, irradiance, CO2, and water availability. Erwin and Gesick emphasize the importance of CO2 levels in unventilated greenhouses such as DWGs [13]. In greenhouses, they found that by increasing CO2 levels from 200 to 400 ppm, Pn increased by 75% to 98% across species, and low CO2 reduced kale and chard Pn more than low irradiance. Given the hesitancy of growers to add CO2 injection systems to their operations, more emphasis should be placed on the importance of ventilation to bring in outside air.
Further, light capture and interception in DWG should be of utmost importance, especially given that for most greenhouse crops, 1% light increase results in 1% increase in production [13]. It is not surprising that in conventional greenhouse lettuce production, daylight is often supplemented with artificial lighting during the winter to realize from 140% to 270% increases in yield compared to lettuce grown without supplemental lighting [13]. In studies examining the interactive effects of light intensity and fertility, lettuce and pak choi in the shaded treatments had lower biomass than those in full sunlight, suggesting that light was the limiting factor to growth, not fertility [19,20].
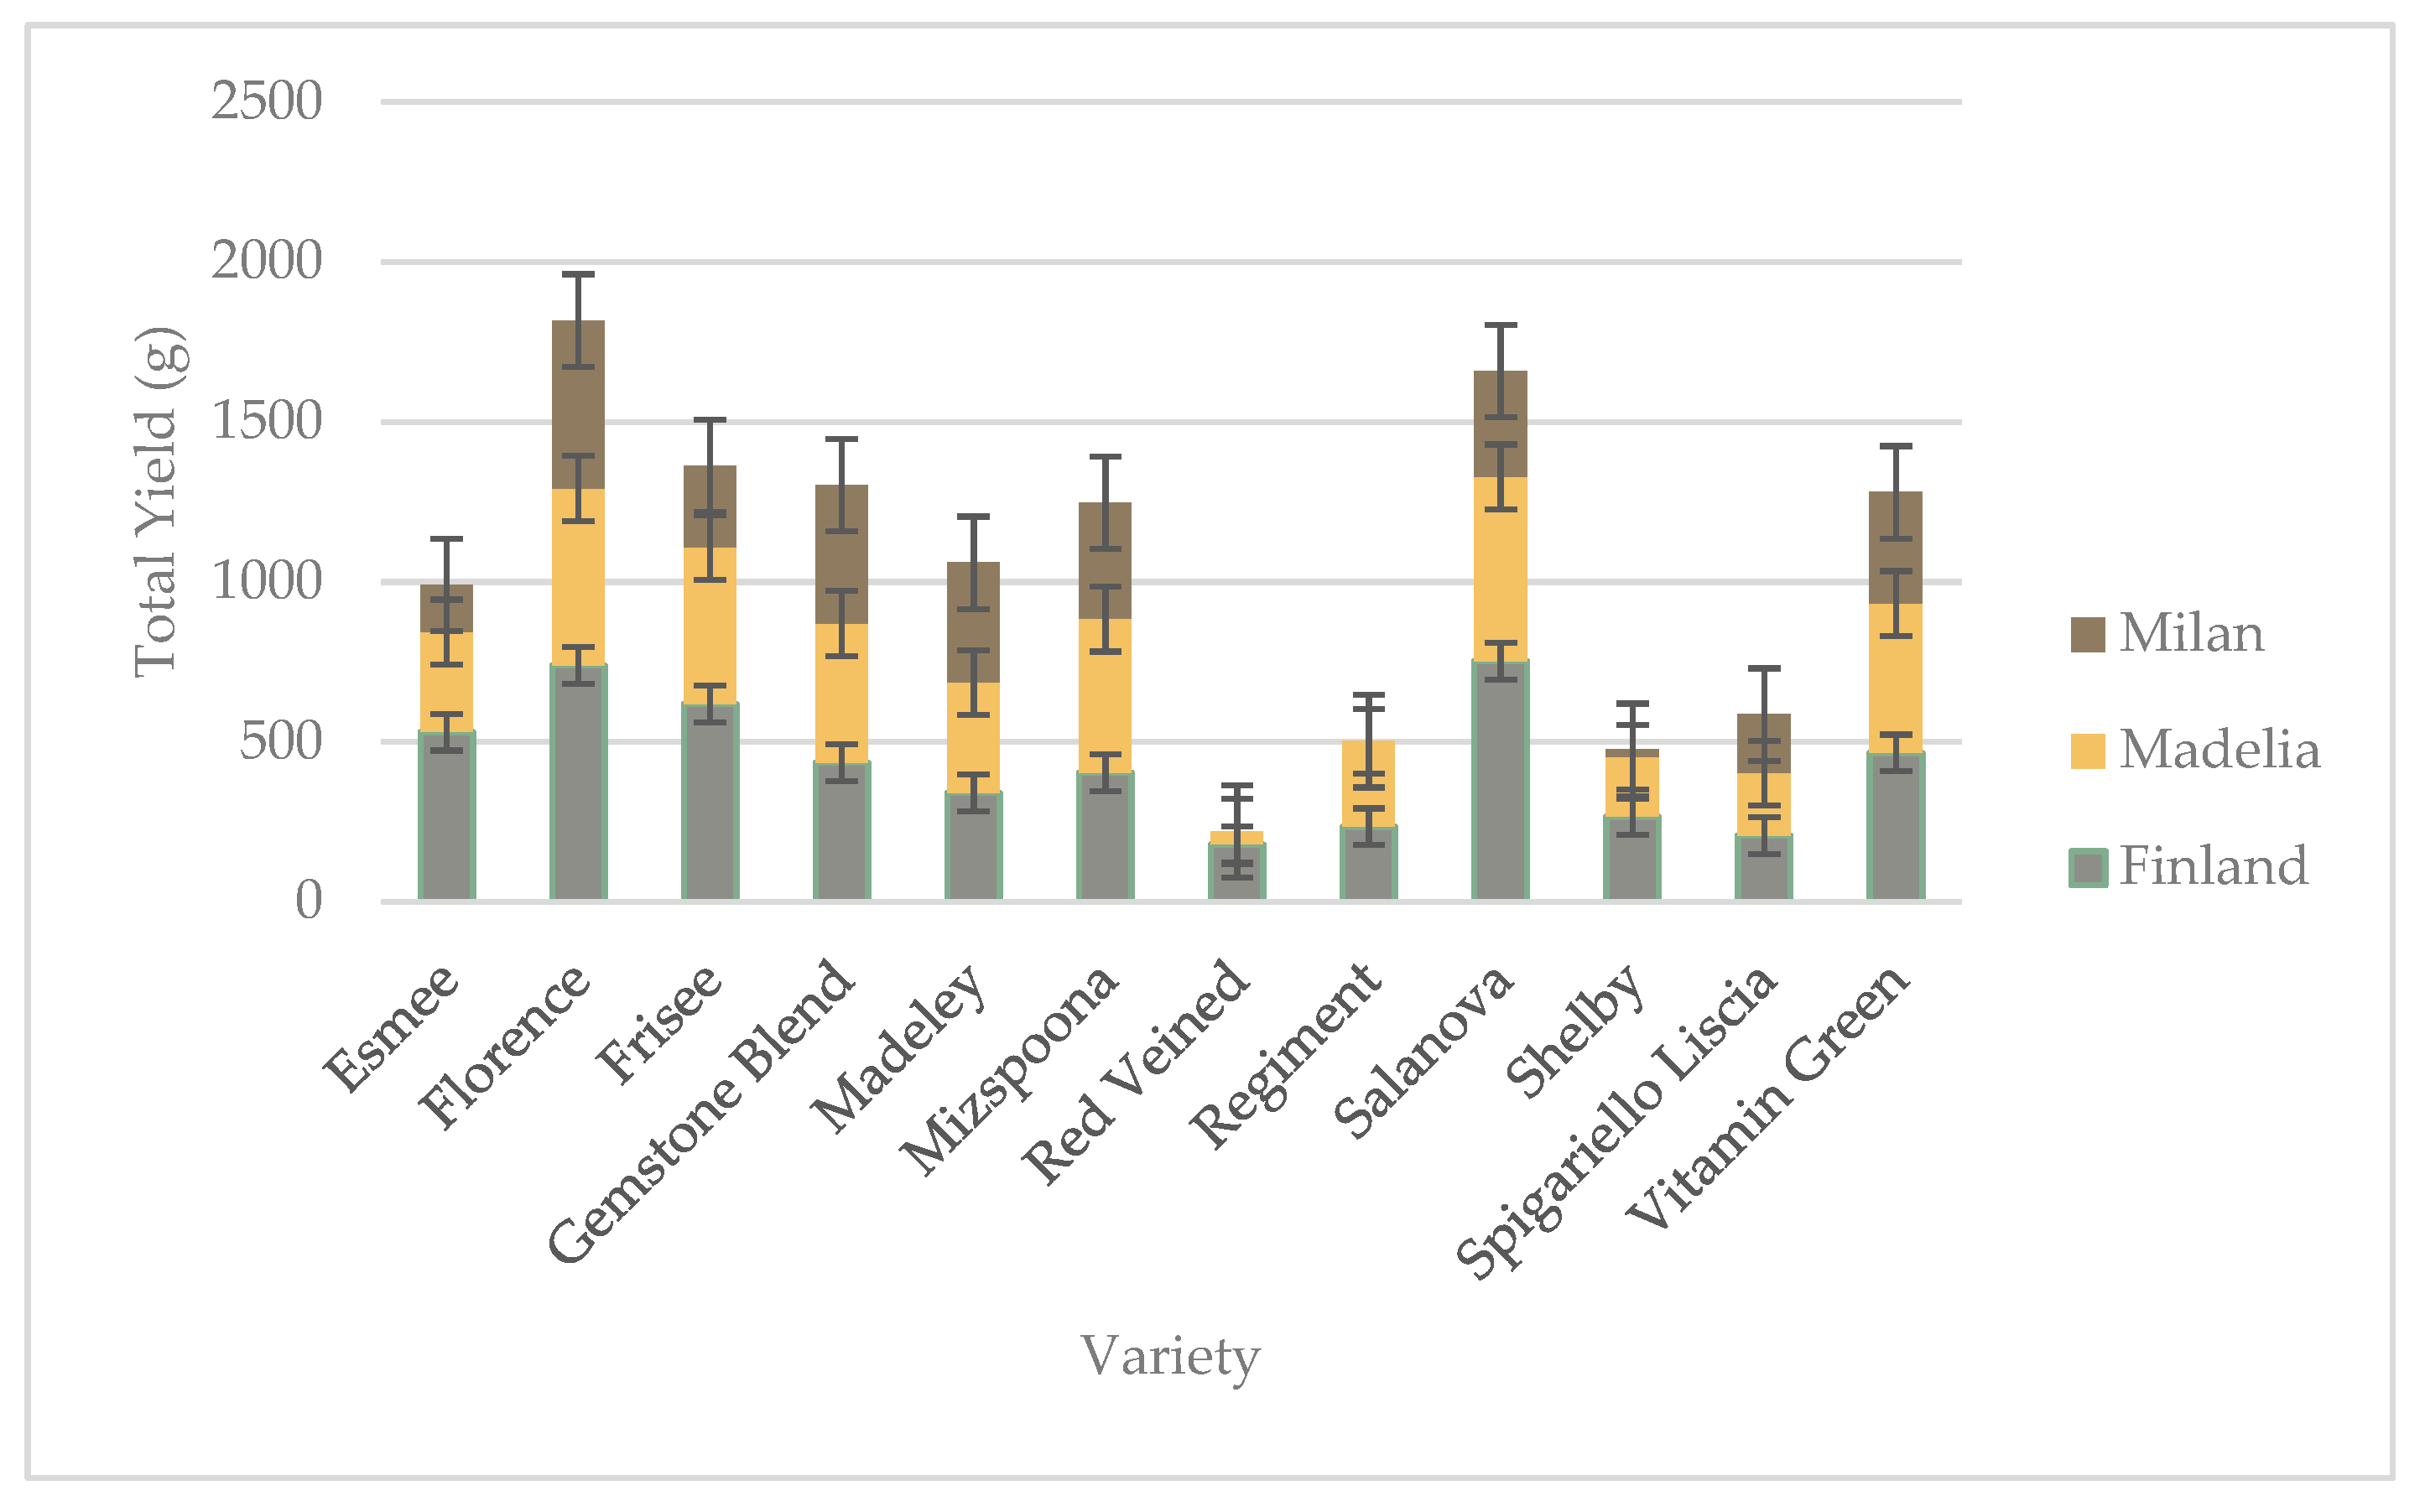
Without the addition of lighting systems, that is, in DWG designed for low-energy use, farmers may maximize production by designing a tiered system with minimal shading, or by frequently rotating gutters to intercept more sunlight. More research is needed to identify cultivars that have a low light requirement, though we would suggest starting with the highest yielding cultivars identified in this study (Figure 4) and those laid out by Ford and Waibel [7]. Further understanding the ability of a cultivar to thrive in the winter sub-seasons (i.e., diminishing, solstice, and expansion) based on available sunlight is an added element worth exploring [7]. Additionally, future research should address planting schedules to ensure continuous production for market, reducing any production gaps resulting in differences in DTM between salad mix components.
Crop type influenced yield and DTM less than cultivar, though the lettuces and Asian greens consistently surpassed the two spinach cultivars. This is somewhat similar to the salad-green benchtop production study by Collie et al. that identified lettuces and some Asian greens as higher yielding than the spinach, Swiss chard, mustards, and kale included in their study [10]. Borrelli et al. reported that Asian green cultivars had the highest overall mean yield, when compared to spinach and lettuce cultivars in their high tunnel studies in Northwest USA [12]. Any differences here are compounded by the use of different cultivars, light availability, and soil or growing media use. The specific microclimates of these systems, or the environmental effect, can influence overall productivity by triggering both genetic and internal physiological mechanisms within individual cultivars [4,12,21]. As we were not able to compare yields between locations, we cannot further elucidate any genetic by environmental (G×E) interaction between DWGs but there were observable replicate effects within location. More research may lead to specific recommendations of when (in time) and where (in space) to grow certain cultivars. Additionally, more research is needed pertaining to controlled environment agriculture as a whole, including soilless media and fertility, material uses, and microclimate modeling.

5. Conclusions

We acknowledge that this was a farmer–researcher collaboration, similar to an Austrian study where organic producers were the pioneers of implementing and developing winter harvest techniques in order to strengthen direct marketing structures [2]. We recognize that how food is produced is as important as where food is produced and by whom [21]. The DWG production system and farmer network was truly born of the inherent complexity of the local food system and its relation to economic development and environmental sustainability specified by place, much like that outlined in Table 2, from Theurl et al. [2].
For increased adoption of this winter production method, farmers need more research-based information on the economic performance of DWGs and reliable information on optimal production practices to maximize yields, and therefore profit potential. According to an enterprise analysis in 2015, DWGs are mostly operating profitably, particularly when enterprises maximize use of the space, pursue direct-to-consumer marketing channels, and keep start-up costs as low as possible [22]. Besides profits, other less tangible benefits can include mood enhancement from enjoying a lush green space during the middle of winter and improved quality of life through seasonal shifts of workload and producing food for their families [23,24].
In terms of sustainable market diffusion of DWGs, research from Theurl et al. [2] showed sustainable market diffusion of their winter production methods, only if multiple aspects of the place-specific system were deemed important. Particularly, the most effective factors were subsidies and image of winter harvest products, followed by consultancy, demand for high quality produce, and regional and seasonal production. A similar evaluation could be conducted with growers’ and consumers’ motives in Minnesota in order to better advance DWG technology. Building a positive public image of DWG greens through advertising and workshops is underway, as well as continued field days and demonstrations of construction and production to facilitate farmer-to-farmer knowledge transfer.

Author Contributions

Each author contributed to the research study in the following capacities: Conceptualization and methodology, C.F.H., M.R., D.H., and G.S.; data collection and analysis, C.F.H.; C.F.H. constructed the original draft; writing—review and editing, C.F.H., M.R., D.H. and G.S.; supervision of research activities performed by M.R. and G.S.; and G.S. managed project administration and funding acquisition.

Funding

This material is based upon work that is supported by the National Institute of Food and Agriculture, U.S. Department of Agriculture, under award number 2017-38640-26916 through the North Central Region SARE program under project number LNC17-395. USDA is an equal opportunity employer and service provider. Any opinions, findings, conclusions, or recommendations expressed in this publication are those of the author(s) and do not necessarily reflect the view of the U.S. Department of Agriculture.

Acknowledgments

We thank Carol Ford for her pioneering work, DWG space, and research assistance, and Brooke and John Knisley of Alternative Roots Farm and Stefan Meyer of Organic Consumers Association for their time, enthusiasm, and research assistance during this project.

Conflicts of Interest

The authors declare no conflict of interest.

References

  1. Capuno, O.B.; Gonzaga, Z.C.; Loreto, M.B.; Gerona, R.G.; Borines, L.M.; Tulin, A.B.; Lusanta, D.C.; Dimabuyu, H.B.; Vega, M.L.P.; Mangmang, J.S.; et al. Development of a cost-effective protected vegetable cropping system in the Philippines. Acta Hortic. 2015, 1107, 221–228. [Google Scholar] [CrossRef]
  2. Theurl, M.C.; Hortenhuber, S.J.; Lindenthal, T. Unheated soil-grown winter vegetables in Austria: Greenhouse gas emission and socio-economic factors of diffusion potential. J. Clean Prod. 2017, 151, 134–144. [Google Scholar] [CrossRef]
  3. Tong, G.; Christopher, D.M.; Li, T.; Wang, T. Passive solar energy utilization: A review of cross-section building parameter selection for chinese solar greenhouses. Renew. Sustain. Energy Rev. 2013, 26, 540–548. [Google Scholar] [CrossRef]
  4. Zhao, X.; Carey, E.E. Summer production of lettuce, and microclimate in high tunnel and open field plots in Kansas. HortTechnology 2009, 19, 113–119. [Google Scholar] [CrossRef]
  5. Schweser, G. High Tunnel Operation in Harsh Climates: Lessons Learned. University of Minnesota Extension, 2013. Available online: http://www.oregonstrawberries.org/fmr/production_systems/CaseStudyHighTunnelOperationinHarshClimatesLessons Learned.pdf (accessed on 27 November 2018).
  6. Minnesota Department of Natural Resources. Climate 2017. Available online: https://www.dnr.state.mn.us/faq/mnfacts/climate.html (accessed on 27 November 2018).
  7. Ford, C.; Waibel, C. The Northlands Winter Greenhouse Manual: A Unique, Low-Tech Solution to Vegetable Production in Cold Climates; Garden Goddess Publications: Milan, MN, USA, 2009. [Google Scholar]
  8. McCullagh, J. The Solar Greenhouse Book; Rodale Press, Inc.: Emmaus, PA, USA, 1978. [Google Scholar]
  9. Regents of the University of Minnesota. Deep Winter Greenhouse V2.2. 2017. Available online: hKp://www.extension.umn.edu/rsdp/statewide/deep[winter[greenhouse/ (accessed on 27 November 2018).
  10. Perkus, L.; Erwin, J.; Rosen, C.; Slavin, J.; Carlson, J.; Schweser, G. Winter produce potential in conventional and deep winter greenhouses in the upper Midwest. In Proceedings of the ASHS Annual Conference, New Orleans, LA, USA, 4–7 August 2015. [Google Scholar]
  11. Collie, C. Bench Top Production of Baby Salad Greens in Greenhouses. Master’s Thesis, University of New Hampshire, Durham, NH, USA, 2013. [Google Scholar]
  12. Borrelli, K.; Koenig, R.T.; Jaeckel, B.M. Yield of leafy greens in high tunnel winter production in the northwest United States. HortScience 2013, 48, 183–188. [Google Scholar]
  13. Erwin, J.; Gesick, E. Photosynthetic responses of swiss chard, kale, and spinach cultivars to irradiance and carbon dioxide concentration. HortScience 2017, 5, 706–712. [Google Scholar] [CrossRef]
  14. Heuvelink, E.; Dorais, M. Crop growth and yield. In Tomatoes; Heuvelink, E., Ed.; CAB International: Wallingford, Oxon, UK, 2003. [Google Scholar]
  15. Wallace, R.W.; Wszelaki, A.L.; Miles, C.A.; Cowan, J.S.; Martin, J.; Roozen, J.; Gunderson, B.; Inglis, D.A. Lettuce yield and quality when grown in high tunnel and open-field production systems under three diverse climates. HortTechnology 2012, 22, 659–668. [Google Scholar] [CrossRef]
  16. NOAA Online Weather Data. National Weather Service, 2018. Available online: http://www.weather.gov/climate/ (accessed on 27 November 2018).
  17. Handeen, D.; Rader, J.; Singh, V. Cold-Climate Greenhouse Resource: A Guidebook for Designing and Building a Cold-Climate Greenhouse. The Regents of the University of Minnesota, 2013. Available online: http://www.cura.umn.edu/publications/catalog/cap-186 (accessed on 27 November 2018).
  18. Tao, L.; Yu-Qi, Z.; Yi, Z.; Rui-Feng, C.; Qi-Chang, Y. Light Distribution in Chinese solar greenhouse and its effect on plant growth. Int. J. Hort Sci. Tech. 2016, 3, 99–111. [Google Scholar] [CrossRef]
  19. Fu, Y.; Li, H.; Yu, J.; Liu, H.; Cao, Z.; Manukovsky, N.S. Interaction effects of light intensity and nitrogen concentration on growth, photosynthetic characteristics and quality of lettuce (Lactuca sativa L. Var. youmaicai). Sci. Hortic. 2017, 214, 51–57. [Google Scholar] [CrossRef]
  20. Shang, H.Q.; Shen, G.M. Effect of ammonium/nitrate ratio on pak choi (Bassica chinensis L.) photosynthetic capacity and biomass accumulation under low light intensity and water deficit. Photosynthetica 2018, 4, 1039–1046. [Google Scholar] [CrossRef]
  21. Dufault, R.J.; Ward, B.; Hassel, R.L. Planting date and romaine lettuce cultivar affect quality and productivity. HortScience 2006, 41, 640–645. [Google Scholar]
  22. Oberhotltzer, L.; Duram, L. A geographic approach to place and natural resource use in local food systems. Renew. Agric. Food Sys. 2010, 25, 99–108. [Google Scholar] [CrossRef] [Green Version]
  23. Pesch, R. Deep Winter Greenhouse Enterprise Analysis: A Study of the Costs and Benefits of Operating Deep Winter Greenhouses in Minnesota and Wisconsin. The Regents of the University of Minnesota, 2015. Available online: https://extension.umn.edu/growing-systems/deep-winter-greenhouses#economics-and-marketing-130162 (accessed on 27 November 2018).
  24. Mohr, C. Improving Quality of Life for Small-Scale Farmers. The Regents of the University of Minnesota, 2018. Available online: https://extension.umn.edu/rsdp-happenings/improving-quality-life-small-scale-farmers (accessed on 27 November 2018).
Figure 1. (a) Photo of Deep Winter Greenhouse (DWG) v2.0 at Alternative Roots Farm, Madelia, MN, taken by Greg Schweser. (b) Ductwork schematic in DWG v2.0 [8].
Sustainability 11 00028 g001
Figure 2. Map of Minnesota with three Deep Winter Greenhouse locations, Finland, Milan, and Madelia, identified with stars.
Sustainability 11 00028 g002
Figure 3. Cumulative growing degree days for leafy greens grown in Deep Winter Greenhouses at base temperature 4 °C during winter and spring months of 2018 in Milan, Madelia, and Finland, MN. Trials at Madelia ended in March.
Sustainability 11 00028 g003
Figure 4. Total fresh weight (g/gutter) for leafy green crops grown in three Deep Winter Greenhouses in Milan, Madelia, and Finland, MN, during the winter and early spring months of 2018. Error bars indicate standard deviations for each cultivar by location.
Sustainability 11 00028 g004
Table 1. Twelve cultivars of leafy salad greens that were grown in the Deep Winter Greenhouse trial in Minnesota during the winter months of 2018.
CultivarCrop TypeCrop SpeciesCompany
EsmeeArugulaEruca sativaJohnny’s Selected Seeds 1
Vitamin GreenAsian greenBrassica rapaHigh Mowing Organic Seeds 2
Spigariello LisciaLeaf broccoliBrassica oleraceaJohnny’s Selected Seeds
FriseeEndiveCichorium endivaHigh Mowing Organic Seeds
Gemstone BlendAsian green and mustard mixBrassica oleracea + junceaHigh Mowing Organic Seeds
MadeleyKaleBrassica oleraceaAdaptive Seeds 3
FlorenceLettuceLactuca sativaAdaptive Seeds
Salanova Foundation CollectionLettuceLactuca sativaJohnny’s Selected Seeds
MizspoonaAsian greenBrassica junceaAdaptive Seeds
Red Veined SorrelSorrelRumex sanguineusJohnny’s Selected Seeds
RegimentSpinachSpinacia oleraceaHigh Mowing Organic Seeds
ShelbySpinachSpinacia oleraceaHigh Mowing Organic Seeds
1 Johnny’s Selected Seeds, Waterville, ME. 2 High Mowing Organic Seeds, Wolcott, VT. 3 Adaptive Seeds, Sweet Home, OR.
Table 2. Seasonal average microclimate parameters including ambient temperature and percent relative humidity (RH), light intensity, soil temperature and moisture, and below-ground rock bed temperature are shown for Deep Winter Greenhouse production in Milan, Finland, and Madelia, MN from 15 January to 1 May 2018.
LocationTemp Range and (Average) (°C)RH%Light Intensity (lux ft−2)Soil Temp (°C)Soil Moisture (m³/m³ VWC) 1Rock bed Temp (°C)
Milan2–41 (11) c 278.63 cNA 310.70 c0.1737 b8 c
Finland6–50 (16) b88.48 a800.77 b15.47 a0.2395 a14 b
Madelia7–42 (17) a84.61 b1112.95 a15.14 b0.1636 b16 a
1 Volumetric water content (VMC). 2 Microclimate parameter means followed by the same letter, a–c, are not significantly different at the 5% level according to a Tukey’s standardized range test. 3 Light intensity was not measured at Milan.
Table 3. Fresh weight yield and days to maturity (DTM), averaged over all cultivars and plantings, and microclimate measurements (ambient temperature and relative humidity (RH), light intensity, and soil temperature and moisture) recorded in three Deep Winter Greenhouses in Milan, Madelia, and Finland, from 15 January to 1 May 2018.
Location 1RepYield (g) 2DTMTemp (°C)RH%Light Intensity (lux ft−2)Soil Temp (°C)Soil Moisture (m³/m³ VWC)
Milan159.04 a 337 a11.14 a77.34 cNA 411.56 a0.1345 c
249.93 ab48 a10.89 b78.51 bNA9.27 c0.2338 a
339.91 b40 a10.72 b79.96 aNA11.26 b0.1528 b
Madelia159.35 a26 a17.08 a84.08 b1215 a15.34 a0.1550 b
252.08 a24 a16.45 b83.64 b1051 b15.05 b0.1194 c
350.54 a25 a16.21 b86.12 a1072 b15.04 b0.2164 a
Finland139.73 a23 a16.08 a88.25 b1404 a15.34 b0.1992 c
240.99 a23 a15.65 b88.80 a672 b15.37 b0.2407 b
337.58 a24 a15.54 b88.40 ab327 c15.70 a0.2786 a
1 Locations analyzed separately. 2 Mean yield across cultivars measured in grams per gutter. 3 Means for each parameter followed by the same letter, a–c, are not significantly different at the 5% level according to a Tukey’s standardized range test. 4 Light intensity was not measured at Milan.

