Such a Shame! A Study on Self-Perception of Household Food Waste

 , , and
Abstract
1. Introduction
2. Methodology
2.1. Survey
- food purchasing behavior;
- extent and types of food discarded in the household;
- evaluation of the motivations, effects, and remedies of food waste;
- personal food waste choices; and
- sociodemographic data.
2.2. Statistical Analysis
3. Results
3.1. Descriptive Statistics
3.2. Logistic Regressions
4. Discussion
5. Conclusions
Author Contributions
Funding
Acknowledgments
Conflicts of Interest
Appendix A

| Predictors | Parameter | Std. Error | Wald Chi Square | Pr > Chi2 | Odds Ratio |
|---|---|---|---|---|---|
| I bought low-quality food | 0.023 | 0.032 | 0.496 | 0.481 | 1.023 |
| I bought too much food | 0.139 *** | 0.040 | 12.221 | 0.000 | 1.149 |
| I cooked too much food | 0.121 *** | 0.039 | 9.566 | 0.002 | 1.129 |
| I did not check the expiration date | 0.054 * | 0.029 | 3.334 | 0.068 | 1.055 |
| I do not reuse leftovers | 0.140 *** | 0.032 | 18.550 | <0.0001 | 1.150 |
| It is a waste of money | −0.085 ** | 0.035 | 5.889 | 0.015 | 0.918 |
| It is a problem in waste management | 0.078 ** | 0.031 | 6.221 | 0.013 | 1.081 |
| It could have been valuable for others | 0.028 | 0.036 | 0.605 | 0.437 | 1.028 |
| Frequency of food purchases—0 | 0.000 | 0.000 | |||
| Frequency of food purchases—1 | −0.431 ** | 0.194 | 4.961 | 0.026 | 0.650 |
| Waste of wizened apple—0 (no) | 0.000 | 0.000 | |||
| Waste of wizened apple—1 (yes) | 1.129 *** | 0.209 | 29.105 | <0.0001 | 3.094 |
| Household size—0 (up to 3 members) | 0.000 | 0.000 | |||
| Household size—1 (aver 3 members) | 0.270 | 0.194 | 1.928 | 0.165 | 1.310 |
| Predictors | Parameter | Std. Error | Wald Chi Square | Pr > Chi2 | Odds Ratio |
|---|---|---|---|---|---|
| I bought low-quality food | 0.170 ** | 0.070 | 5.879 | 0.015 | 1.185 |
| I bought too much food | 0.022 | 0.075 | 0.084 | 0.772 | 1.022 |
| I cooked too much food | 0.107 | 0.081 | 1.746 | 0.186 | 1.113 |
| I did not check the expiration date | 0.139 *** | 0.051 | 7.393 | 0.007 | 1.149 |
| I do not reuse leftovers | 0.061 | 0.056 | 1.179 | 0.278 | 1.062 |
| It is a waste of money | −0.225 *** | 0.059 | 14.409 | 0.000 | 0.798 |
| It is a problem in waste management | -0.009 | 0.052 | 0.028 | 0.867 | 0.991 |
| It could have been valuable for others | 0.155 ** | 0.063 | 5.985 | 0.014 | 1.168 |
| Frequency of food purchases—0 | 0.000 | 0.000 | |||
| Frequency of food purchases—1 | −0.246 | 0.314 | 0.610 | 0.435 | 0.782 |
| Waste of wizened apple—0 (no) | 0.000 | 0.000 | |||
| Waste of wizened apple—1(yes) | 0.198 | 0.377 | 0.275 | 0.600 | 1.219 |
| Household size—0 (up to 3 members) | 0.000 | 0.000 | |||
| Household size—1 (aver 3 members) | 0.286 | 0.315 | 0.825 | 0.364 | 1.331 |
References
- UN. Transforming Our World: The 2030 Agenda for Sustainable Development. 2015. Available online: https://sustainabledevelopment.un.org/post2015/transformingourworld/publication (accessed on 24 September 2018).
- FAO. Global Food Waste and Food Losses. 2011. Available online: http://www.fao.org/docrep/014/mb060e/mb060e.pdf (accessed on 24 September 2018).
- Carlsson-Kanyama, A. Climate change and dietary choices—How can emissions of greenhouse gases from food consumption be reduced? Food Policy 1998, 23, 277–293. [Google Scholar] [CrossRef]
- Foster, C.; Green, K.; Bleda, M.; Dewick, P.; Evans, B.; Flynn, A.; Mylan, J. Environmental Impacts of Food Production and Consumption: A Report to the Department for Environment, Food and Rural Affairs; Manchester Business School, Defra: London, UK, 2006. [Google Scholar]
- Williams, A.G.; Audsley, E.; Sandars, D.L. Determining the Environmental Burdens and Resource Use in the Production of Agricultural and Horticultural Commodities; Main Report; Defra Research Project IS0205; Cranfield University and Defra: Bedford, UK, 2006. [Google Scholar]
- Huppes, G.; de Koning, A.; Suh, S.; Heijungs, R.; van Oers, L.; Nielsen, P.; Guinée, J.B. Environmental impacts of consumption in the European Union: High-resolution input-output tables with detailed environmental extensions. J. Ind. Ecol. 2008, 10, 129–146. [Google Scholar] [CrossRef]
- Pimentel, D.; Pimentel, M.H. Food, Energy and Society, 3rd ed.; CRC Press, Taylor and Francis Group: Boca Raton, FL, USA, 2008. [Google Scholar]
- Weber, C.L.; Matthews, H.S. Food-miles and the relative climate impacts of food choices in the United States. Environ. Sci. Technol. 2008, 42, 3508–3513. [Google Scholar] [CrossRef] [PubMed]
- Khan, S.; Hanjra, M.A. Footprints of water and energy inputs in food production—Global perspectives. Food Policy 2009, 34, 130–140. [Google Scholar] [CrossRef]
- Notarnicola, B.; Tassielli, G.; Renzulli, P.A.; Castellani, V.; Sala, S. Environmental impacts of food consumption in Europe. J. Clean. Prod. 2017, 140, 753–765. [Google Scholar] [CrossRef]
- Sala, S.; Anton, A.; McLaren, S.J.; Notarnicola, B.; Saouter, E.; Sonesson, U. In quest of reducing the environmental impacts of food production and consumption. J. Clean. Prod. 2017, 140, 387–398. [Google Scholar] [CrossRef]
- Cuéllar, A.D.; Webber, M.E. Wasted food, wasted energy: The embedded energy in food waste in the United States. Environ. Sci. Technol. 2010, 44, 6464–6469. [Google Scholar]
- Kummu, M.; de Moel, H.; Porkka, M.; Siebert, S.; Varis, O.; Ward, P.J. Lost food, wasted resources: Global food supply chain losses and their impacts on freshwater, cropland, and fertilizer use. Sci. Total Environ. 2012, 438, 477–489. [Google Scholar] [CrossRef]
- Abeliotis, K.; Lasaridi, K.; Costarelli, V.; Chroni, C. The implications of food waste generation on climate change: The case of Greece. Sustain. Prod. Consum. 2015, 3, 8–14. [Google Scholar] [CrossRef]
- Scherhaufer, S.; Lebersorger, S.; Pertl, A.; Obersteiner, G.; Schneider, F.; Falasconi, L.; De Menna, F.; Vittuari, M.; Hartikainen, H.; Katajajuuri, J.M.; et al. Criteria for and Baseline Assessment of Environmental and Socio-Economic Impacts of Food Waste; FUSIONS Project, BOKU University of Natural Resources and Life Sciences, Institute of Waste Management: Wien, Austria, 2015; ISBN 978-3-900932-32-9. [Google Scholar]
- Song, G.; Li, M.; Semakula, H.M.; Zhang, S. Food consumption and waste and the embedded carbon, water and ecological footprints of households in China. Sci. Total Environ. 2015, 529, 191–197. [Google Scholar] [CrossRef] [PubMed]
- De Laurentiis, V.; Hunt, D.V.; Rogers, C.D. Overcoming Food Security Challenges within an Energy/Water/Food Nexus (EWFN) Approach. Sustainability 2016, 8, 95. [Google Scholar] [CrossRef]
- Vittuari, M.; De Menna, F.; Pagani, M. The Hidden Burden of Food Waste: The Double Energy Waste in Italy. Energies 2016, 9, 660. [Google Scholar] [CrossRef]
- Brancoli, P.; Rousta, K.; Bolton, K. Life cycle assessment of supermarket food waste. Resour. Conserv. Recycl. 2017, 118, 39–46. [Google Scholar] [CrossRef]
- Cicatiello, C.; Franco, S.; Pancino, B.; Blasi, E. The value of food waste: An exploratory study on retailing. J. Retail. Consum. Serv. 2016, 30, 96–104. [Google Scholar] [CrossRef]
- Stenmarck, A.; Jensen, C.; Quested, T.; Moates, G. Estimates of European Food Waste Levels; Publication of the FUSIONS Project, European Commission (FP7), Coordination and Support Action–CSA: Stockholm, Sweden, 2016. [Google Scholar]
- Food Waste: Causes, Impacts and Proposals. Barilla Center for Food & Nutrition. 2012. Available online: https://www.barillacfn.com/en/publications/food-waste-causes-impacts-and-proposals (accessed on 21 September 2018).
- Gunders, D. Wasted: How America is Losing up to 40 percent of its Food from Farm to Fork to Landfill; Natural Resources Defense Council Issue Paper; Natural Resources Defense Council: New York, NY, USA, 2012. [Google Scholar]
- Monier, V.; Mudgal, S.; Escalon, V.; O’Connor, C.; Gibon, T.; Anderson, G.; Montoux, H.; Reisinger, H.; Dolley, P.; Ogilvie, S.; et al. Preparatory Study on Food Waste Across EU 27; European Commission: Paris, France, 2011. [Google Scholar]
- WRAP. Household Food Waste in the UK. Report 2015. Project Code: CSC107-GEN. 2017. Available online: www.wrap.org.uk (accessed on 24 September 2018).
- Cicatiello, C.; Giordano, C. Measuring Household Food Waste at National Level: A Systematic Review on Methods and Results. CAB Rev. 2018, 13, 1–8. [Google Scholar] [CrossRef]
- Koivupuro, H.K.; Hartikainen, H.; Silvennoinen, K.; Katajajuuri, J.M.; Heikintalo, N.; Reinikainen, A.; Jalkanen, L. Influence of socio-demographical, behavioural and attitudinal factors on the amount of avoidable food waste generated in Finnish households. Int. J. Consum. Stud. 2012, 36, 183–191. [Google Scholar] [CrossRef]
- Silvennoinen, K.; Katajajuuri, J.M.; Hartikainen, H.; Heikkilä, L.; Reinikainen, A. Food waste volume and composition in Finnish households. Br. Food J. 2014, 116, 1058–1068. [Google Scholar] [CrossRef]
- Katajajuuri, J.M.; Silvennoinen, K.; Hartikainen, H.; Heikkilä, L.; Reinikainen, A. Food waste in the Finnish food chain. J. Clean. Prod. 2014, 73, 322–329. [Google Scholar] [CrossRef]
- Edjabou, M.E.; Jensen, M.B.; Götze, R.; Pivnenko, K.; Petersen, C.; Scheutz, C.; Astrup, T.F. Municipal solid waste composition: Sampling methodology, statistical analyses, and case study evaluation. Waste Manag. 2015, 36, 12–23. [Google Scholar] [CrossRef]
- Segrè, A.; Falasconi, L. Il Libro Nero Dello Spreco in Italia: Il Cibo; EdizioneAmbiente: Milano, Italy, 2010. [Google Scholar]
- Segrè, A.; Falasconi, L. Il Libro Blu Dello spreco in Italia: L’acqua; EdizioneAmbiente: Milano, Italy, 2011. [Google Scholar]
- Quested, T.E.; Marsh, E.; Stunell, D.; Parry, A.D. Spaghetti soup: The complex world of food waste behaviours. Resour. Conserv. Recycl. 2013, 79, 43–51. [Google Scholar] [CrossRef]
- Setti, M.; Banchelli, F.; Segré, A.; Falasconi, L.; Vittuari, M. Consumption food cycle and household waste. When behaviors matter. J. Clean. Prod. 2018, 185, 694–706. [Google Scholar] [CrossRef]
- Graham-Rowe, E.; Jessop, D.C.; Sparks, P. Identifying motivations and barriers to minimising household food waste. Resour. Conserv. Recycl. 2014, 84, 15–23. [Google Scholar] [CrossRef]
- Graham-Rowe, E.; Jessop, D.C.; Sparks, P. Predicting household food waste reduction using an extended theory of planned behaviour. Resour. Conserv. Recycl. 2015, 101, 194–202. [Google Scholar] [CrossRef]
- WRAP, Consumer Insight: Date Labels and Storage Guidance (Banbury, UK). 2011. Available online: http://www.wrap.org.uk/sites/files/wrap/Technical%20report%20dates.pdf (accessed on 24 September 2018).
- Aschemann-Witzel, J.; de Hooge, I.; Amani, P.; Bech-Larsen, T.; Oostindjer, M. Consumer-related food waste: Causes and potential for action. Sustainability 2015, 7, 6457–6477. [Google Scholar] [CrossRef]
- Stancu, V.; Haugaard, P.; Lähteenmäki, L. Determinants of consumer food waste behaviour: Two routes to food waste. Appetite 2016, 96, 7–17. [Google Scholar] [CrossRef]
- Canali, M.; Amani, P.; Aramyan, L.; Gheoldus, M.; Moates, G.; Östergren, K.; Silvennoinen, K.; Waldron, K.; Vittuari, M. Food waste drivers in Europe, from identification to possible interventions. Sustainability 2017, 9, 37. [Google Scholar] [CrossRef]
- Stefan, V.; Van Herpen, E.; Tudoran, A.A.; Lähteenmäki, L. Avoiding food waste by Romanian consumers: The importance of planning and shopping routines. Food Qual. Prefer. 2013, 28, 375–381. [Google Scholar] [CrossRef]
- Evans, D. Blaming the consumer—Once again: The social and material contexts of everyday food waste practices in some English households. Crit. Public Health 2011, 21, 429–540. [Google Scholar] [CrossRef]
- Evans, D. Beyond the throwaway society: Ordinary domestic practice and a sociological approach to household food waste. Sociology 2012, 46, 41–56. [Google Scholar] [CrossRef]
- Franco, S.; Cicatiello, C. Food waste due to over-nutrition in the Italians’ dietary habits. Rivista di Studi Sulla Sostenibilit 2018, 1, 159–180. [Google Scholar] [CrossRef]
- Secondi, L.; Principato, L.; Laureti, T. Household food waste behaviour in EU-27 countries: A multilevel analysis. Food Policy 2015, 56, 25–40. [Google Scholar] [CrossRef]
- Brook Lyndhurst. Food Behaviour Consumer Researched Findings from the Quantitative Survey. 2007. (Briefing Paper UK: WRAP). Available online: http://www.wrap.org.uk/sites/files/wrap/Food%20behaviour%20consumer%20research%20quantitative%20jun%202007.pdf (accessed on 24 September 2018).
- Watson, M.; Meah, A. Food, waste and safety: Negotiating conflicting social anxieties into the practices of domestic provisioning. Sociol. Rev. 2013, 60, 102–120. [Google Scholar] [CrossRef]
- Visschers, V.H.; Wickli, N.; Siegrist, M. Sorting out food waste behaviour: A survey on the motivators and barriers of self-reported amounts of food waste in households. J. Environ. Psychol. 2016, 45, 66–78. [Google Scholar] [CrossRef]
- Waste Watcher. Osservatorio Sugli Sprechi Alimentari Delle Famiglie Italiane, Rapporto 2013. Available online: http://www.progettareineuropa.com/wp-content/uploads/2016/07/Sprechi-alimentari-in-Italia.pdf (accessed on 24 September 2018).
- Website of the Italian Ministry of Economy and Finance. Available online: www.finanze.gov.it (accessed on 24 September 2018).
- Hultsch, D.F.; MacDonald, S.W.S.; Hunter, M.A.; Maitland, S.B.; Dixon, R.A. Sampling and generalisability in developmental research: Comparison of random and convenience samples of older adults. Int. J. Behav. Dev. 2002, 26, 345–359. [Google Scholar] [CrossRef]
- Guerrero, L.; Claret, A.; Verbeke, W.; Enderli, G.; Zakowska-Biemans, S.; Vanhonacker, F.; Issanchou, S.; Sajdakowska, M.; Signe Granli, B.; Scalvedi, L.; et al. Perception of traditional food products in six European regions using free word association. Food Qual. Preference 2010, 21, 225–233. [Google Scholar] [CrossRef]
- Farrokhi, F.; Mahmoudi-Hamidabad, A. Rethinking convenience sampling: Defining quality criteria. Theory Pract. Lang. Stud. 2012, 2, 784–792. [Google Scholar]
- Hosmer, D.W., Jr.; Lemeshow, S.; Sturdivant, R.X. Applied Logistic Regression; John Wiley & Sons: Hoboken, NJ, USA, 2013; Volume 398. [Google Scholar]
- Griffin, M.; Sobal, J.; Lyson, T.A. An analysis of a community food waste stream. Agric. Hum. Values 2009, 26, 67–81. [Google Scholar] [CrossRef]
- Parfitt, J.; Barthel, M.; Macnaughton, S. Food waste within food supply chains: Quantification and potential for change to 2050. Philos. Trans. R. Soc. Lond. B Biol. Sci. 2010, 365, 3065–3081. [Google Scholar] [CrossRef]
- Priefer, C.; Jörissen, J.; Klaus-Rainer Bräutigam, K.R. ; Technology Options for Feeding 10 Billion People Options for Cutting Food Waste; European Union: Brussels, Belgium, 2013. [Google Scholar]
- Møller, H.; Hanssen, O.J.; Gustavsson, J.; Östergren, K.; Stenmarck, Å.; Dekhtyar, P. Report on Review of (Food) Waste Reporting Methodology and Practice; FUSIONS Project; Østfoldforskning: Kråkerøy, Norway, 2014; ISBN 82-7520-713-4 978-82-7520-713-3. [Google Scholar]
- Principato, L.; Secondi, L.; Pratesi, C.A. Reducing food waste: An investigation on the behaviour of Italian youths. Br. Food J. 2015, 117, 731–748. [Google Scholar] [CrossRef]
- Aschemann-Witzel, J.; Jensen, J.H.; Jensen, M.H.; Kulikovskaja, V. Consumer behaviour towards price-reduced suboptimal foods in the supermarket and the relation to food waste in households. Appetite 2017, 116, 246–258. [Google Scholar] [CrossRef]
- Setti, M.; Falasconi, L.; Segrè, A.; Cusano, I.; Vittuari, M. Italian consumers’ income and food waste behaviour. Br. Food J. 2016, 118, 1731–1746. [Google Scholar] [CrossRef]


| Quantitative Explanatory Variables | Range Min–Max | Missing Values | Mean | Std. Dev. |
|---|---|---|---|---|
| Food shopping behavior | ||||
| Attention to special offers | 0–10 | 11 | 6.624 | 2.571 |
| Motivations of food waste | ||||
| I bought low-quality food | 0–10 | 9 | 1.933 | 2.799 |
| I bought too much food | 0–10 | 8 | 2.946 | 2.947 |
| I cooked too much food | 0–10 | 9 | 2.731 | 2.842 |
| I tried something I did not like | 0–10 | 7 | 2.318 | 2.677 |
| I bought large packages to save money | 0–10 | 10 | 2.213 | 2.694 |
| I did not check the expiration date | 0–10 | 3 | 3.595 | 3.295 |
| I do not reuse leftovers | 0–10 | 8 | 1.945 | 2.874 |
| Perception of the effects of food waste | ||||
| It is a waste of money | 0–10 | 5 | 6.778 | 3.162 |
| It is a waste of time | 0–10 | 8 | 3.848 | 3.488 |
| It makes me feeling guilty | 0–10 | 9 | 5.801 | 3.557 |
| It is a problem for waste management | 0–10 | 1 | 3.908 | 3.369 |
| It is an economic loss for the society | 0–10 | 1 | 4.550 | 3.496 |
| It could have been valuable for others | 0–10 | 1 | 7.237 | 3.226 |
| It is an environmental problem | 0–10 | 2 | 5.015 | 3.589 |
| Categorical Explanatory Variables | Categories | Missing Values | No. Obs. | Frequency |
|---|---|---|---|---|
| Subsamples | ||||
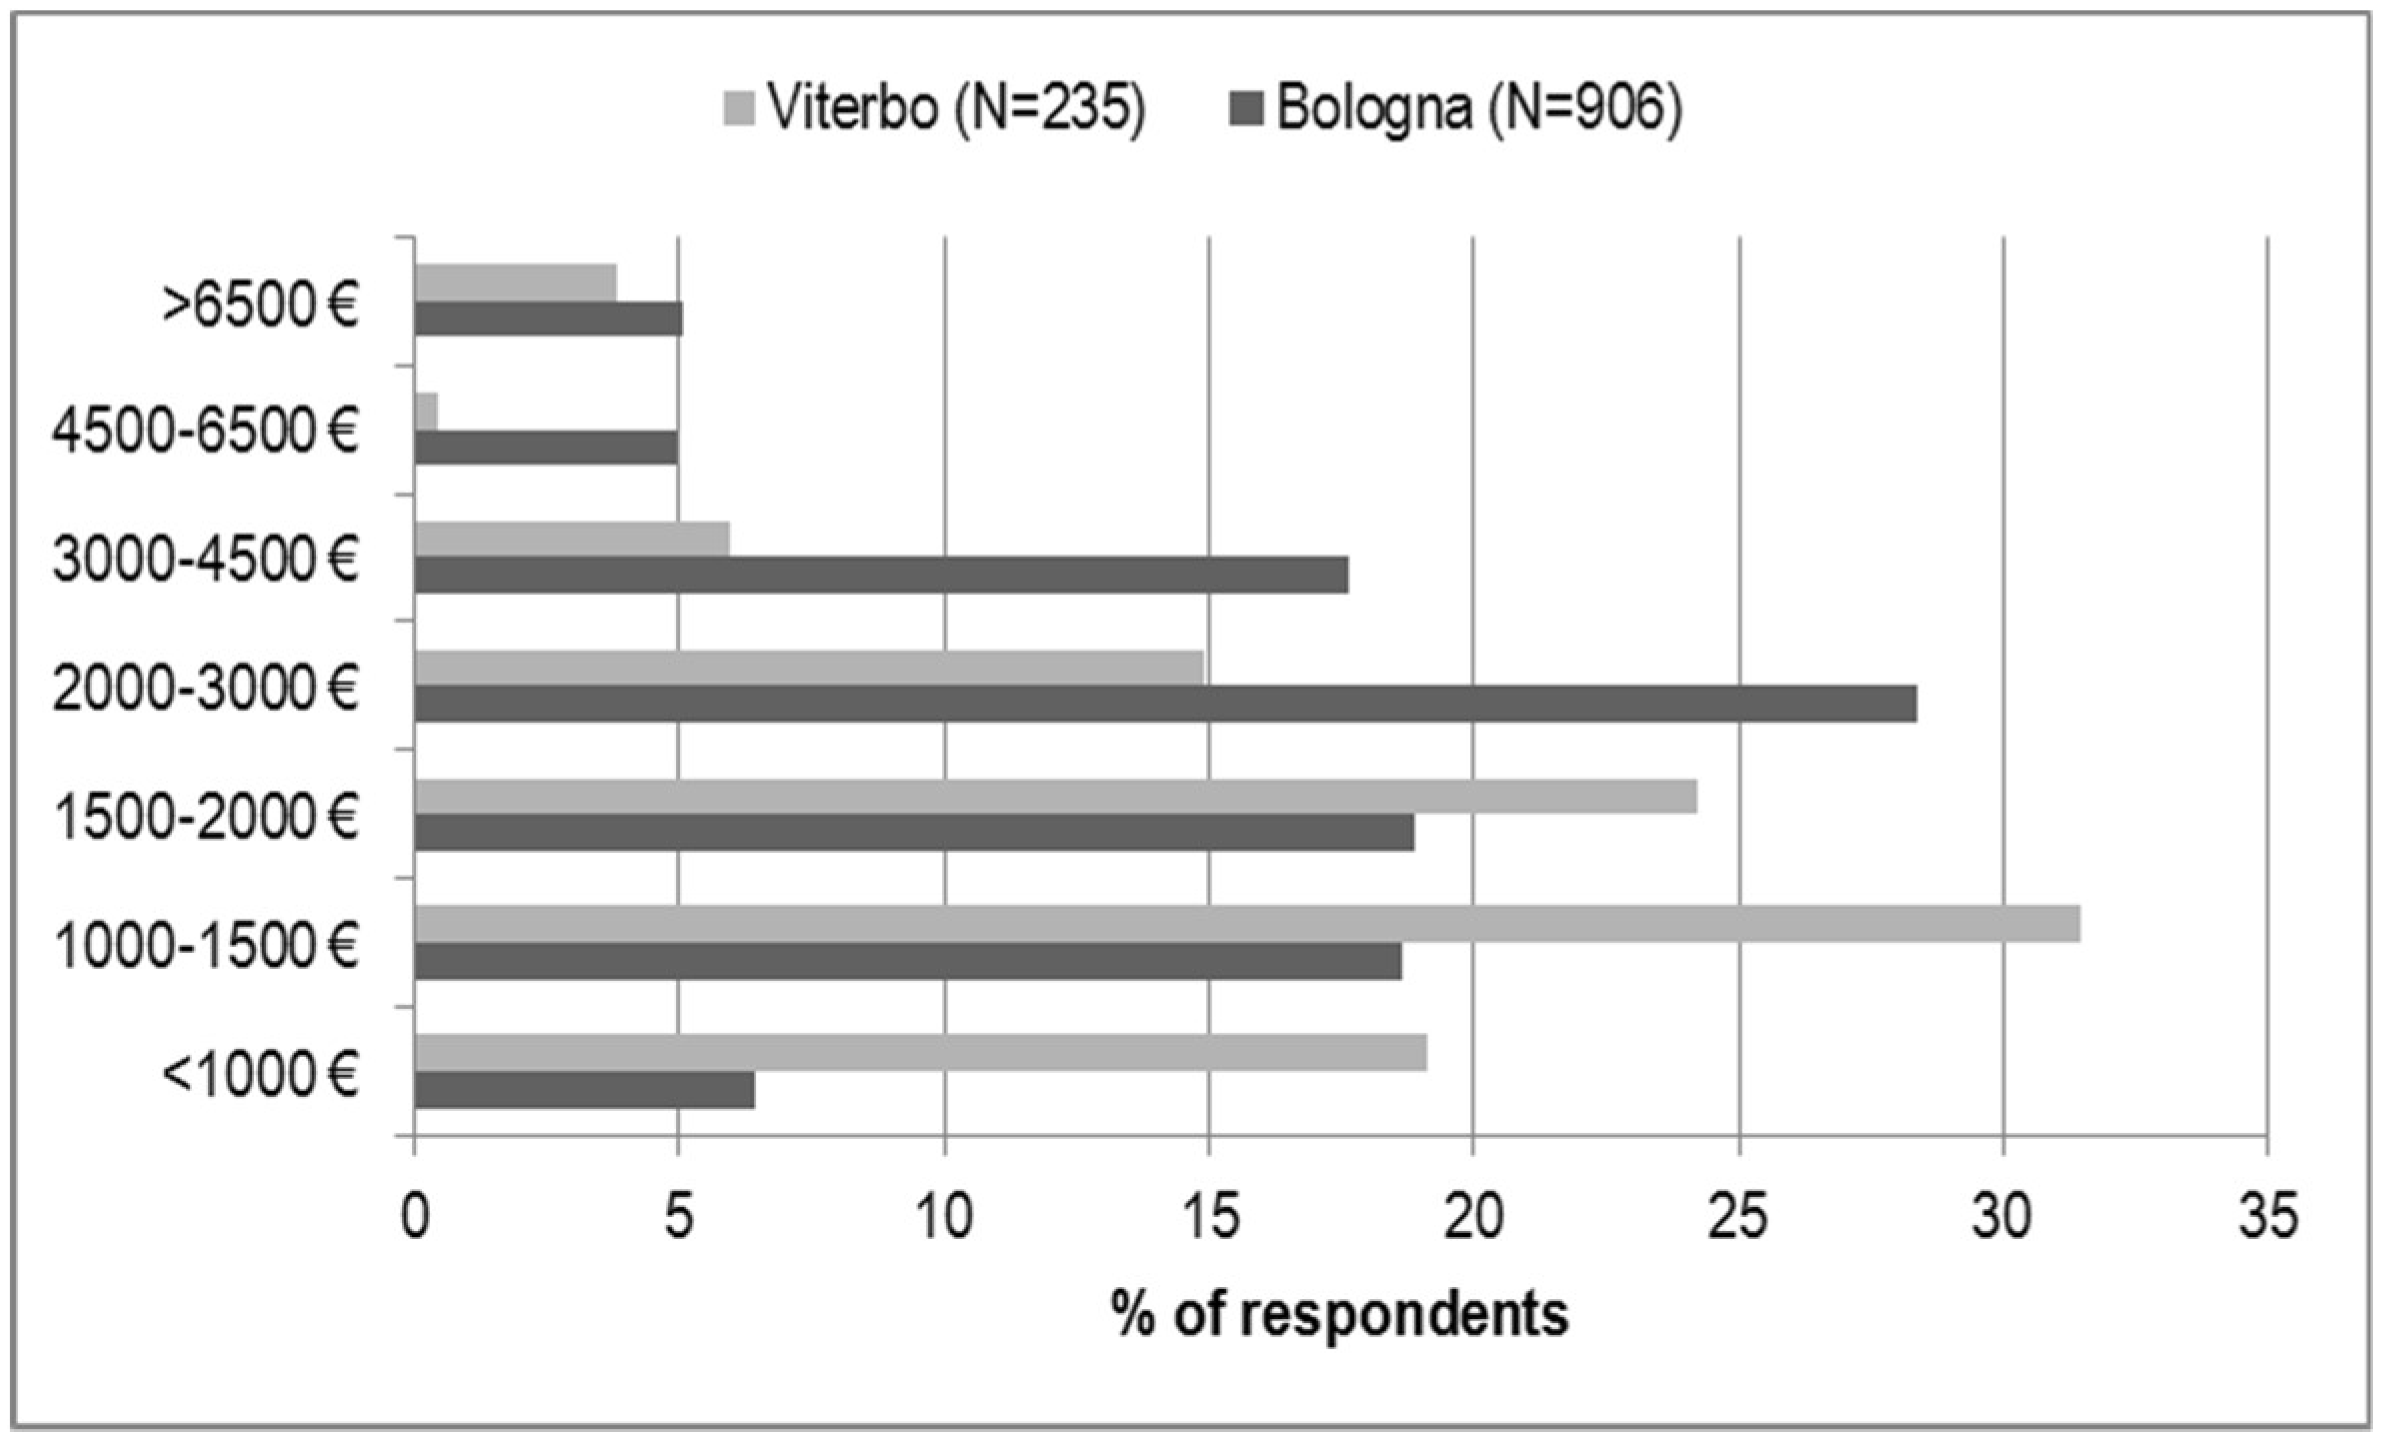
| City | BO = Bologna VT = Viterbo | 0 | 922 250 | 78.67% 21.33% |
| Food shopping behavior | ||||
| Frequency of food purchases | 0 = less than 3 times/week 1 = 3 times/week or more | 0 | 671 501 | 57.25% 42.75% |
| Eating behavior | ||||
| Waste of wizened apple | 1 = yes | 38 | 232 | 20.463% |
| Waste of bruised apple | 1 = yes | 38 | 104 | 9.17% |
| Sociodemographic variables | ||||
| Level of education | 0 = no degree 1 = degree | 0 | 630 542 | 53.75% 46.25% |
| Household size | 0 = less than 3 persons 1 = 3 persons or more | 1 | 728 443 | 62.17% 37.83% |
| Gender | 0 = female 1 = male | 7 | 769 396 | 66.01% 33.99% |
| Age | 0 = under 40 years old 1 = over 40 years old | 0 | 811 361 | 69.20% 30.80% |
| Predictors | Parameter | Std. Error | Wald Chi Square | Pr > Chi2 | Odds Ratio |
|---|---|---|---|---|---|
| I bought low-quality food | 0.050 * | 0.028 | 3.142 | 0.076 | 1.052 |
| I bought too much food | 0.108 *** | 0.034 | 9.825 | 0.002 | 1.114 |
| I cooked too much food | 0.111 *** | 0.034 | 10.456 | 0.001 | 1.118 |
| I did not check the expiration date | 0.078 *** | 0.025 | 9.735 | 0.002 | 1.081 |
| I do not reuse leftovers | 0.113 *** | 0.027 | 17.116 | <0.0001 | 1.120 |
| It is a waste of money | −0.114 *** | 0.028 | 16.107 | <0.0001 | 0.892 |
| It is a problem in waste management | 0.046 * | 0.026 | 3.167 | 0.075 | 1.047 |
| It could have been valuable for others | 0.059 ** | 0.030 | 3.893 | 0.048 | 1.061 |
| City—Bologna | 0.000 | 0.000 | |||
| City—Viterbo | 0.755 *** | 0.188 | 16.188 | <0.0001 | 2.127 |
| Frequency of food purchases—0 | 0.000 | 0.000 | |||
| Frequency of food purchases—1 | −0.357 ** | 0.162 | 4.847 | 0.028 | 0.700 |
| Waste of wizened apple—0 (no) | 0.000 | 0.000 | |||
| Waste of wizened apple—1 (yes) | 0.893 *** | 0.181 | 24.360 | <0.0001 | 2.442 |
| Household size—0 (up to 3 members) | 0.000 | 0.000 | |||
| Household size—1 (aver 3 members) | 0.267 | 0.163 | 2.696 | 0.101 | 1.306 |
© 2019 by the authors. Licensee MDPI, Basel, Switzerland. This article is an open access article distributed under the terms and conditions of the Creative Commons Attribution (CC BY) license (http://creativecommons.org/licenses/by/4.0/).
Share and Cite
Falasconi, L.; Cicatiello, C.; Franco, S.; Segrè, A.; Setti, M.; Vittuari, M. Such a Shame! A Study on Self-Perception of Household Food Waste. Sustainability 2019, 11, 270. https://doi.org/10.3390/su11010270
Falasconi L, Cicatiello C, Franco S, Segrè A, Setti M, Vittuari M. Such a Shame! A Study on Self-Perception of Household Food Waste. Sustainability. 2019; 11(1):270. https://doi.org/10.3390/su11010270
Chicago/Turabian StyleFalasconi, Luca, Clara Cicatiello, Silvio Franco, Andrea Segrè, Marco Setti, and Matteo Vittuari. 2019. "Such a Shame! A Study on Self-Perception of Household Food Waste" Sustainability 11, no. 1: 270. https://doi.org/10.3390/su11010270
APA StyleFalasconi, L., Cicatiello, C., Franco, S., Segrè, A., Setti, M., & Vittuari, M. (2019). Such a Shame! A Study on Self-Perception of Household Food Waste. Sustainability, 11(1), 270. https://doi.org/10.3390/su11010270