1. Introduction
Tunnels are an inseparable part of the road transportation infrastructure [
1]. Previous tunnel fires demonstrate that such accidents have the potential for severe loss of life and large economic losses [
1,
2,
3,
4]. Tunnel fires have the potential to generate high temperatures and high heat fluxes that can hinder evacuation, prohibit firefighting efforts, damage the tunnel structure, and close the tunnel for long periods [
4]. The 1999 Mont Blanc tunnel fire resulted in the death of 38 people and closed the tunnel for three years. In the Tauern tunnel fire the same year, 12 people lost their lives and the tunnel was closed for three months. These and many other tunnel fire catastrophes drive the need for understanding tunnel fire dynamics and the impacts of such fires.
Longitudinal ventilation is used to maintain an amicable tunnel environment when the tunnel is in normal operation. The principle of longitudinal ventilation is therefore extensively used for tunnel ventilation [
3,
4,
5,
6,
7,
8,
9,
10,
11,
12,
13,
14,
15,
16]. During tunnel fires, the longitudinal ventilation can force the gaseous products of the fire to one defined tunnel entrance, ensuring that the other end of the tunnel is available for evacuation and firefighting. The required ventilation velocity to prevent smoke products moving in both directions away from the fire source is called the critical ventilation velocity [
9]. Thus, applying ventilation rates ensuring at least the critical ventilation velocity, the other end of the tunnel is kept free of smoke products (i.e., available for safe evacuation and firefighting). The critical ventilation velocity is therefore an important parameter for designing the tunnel ventilation system and it is the topic most studied in tunnel fire research [
17]. Experimental and numerical studies do, however, show that increasing the ventilation velocity accelerates fire growth and enhances other critical parameters, such as the maximum temperature on the tunnel ceiling and heat flux levels [
4,
17,
18,
19,
20,
21]. This may then limit firefighting efforts and restrict the evacuation of trapped individuals. Since many tunnel safety parameters (such as the maximum temperature at the tunnel ceiling temperature and fire-growth rate) attain a maximum under critical velocity conditions, it is worthwhile looking at other safety strategies.
Froude number conservation makes it possible to perform experiments and modeling in different scales and extrapolate to the scale of particular interest. Froude number preservation may also be used to predict the behavior of disturbed buoyant plumes [
22]. Thomas was the first scientist to propose an analytical expression for the critical ventilation velocity, preventing smoke movement against the air flow in horizontal corridors. His study was based on Froude number preservation [
23]. Woodburn and Britter [
24,
25] were the first to apply Computational Fluid Dynamics (CFD) modeling to study the interaction between ventilation velocity and backflow of smoke. Colella developed a multiscale modeling approach to simulate tunnel ventilation flows [
26]. A review of recent multiscale modeling approaches for tunnel fire modeling is presented in the study by Ralph and Carvel [
27]. Recently, research regarding the tunnel aspect ratio has been studied by experiments [
28] and by modeling [
29].
Analyzing the performance of emergency response systems is crucial. For the purpose of designing an optimal ventilation system, it is important to study the factors that influence the ventilation velocity. There are few studies which explore the importance of vehicular blockage or tunnel geometry on the ventilation velocity and tunnel fire dynamics [
30,
31]. Kayili et al. [
32] investigated the effect of ventilation and geometrical parameters of burning objects on the heat release rates. They employed the Froude scaling to construct a 1/13 scaled model tunnel and found that 79.8% of the variation in heat release rate was attributed to changes in blockage ratio, 10.6% to changes in thickness, and only 4.5% to changes in velocity. It is also important to understand the influence of emergency response systems on tunnel fire development. Few experimental and numerical studies examine the influence of ventilation velocity on tunnel fire dynamics. Xue et al. [
33] studied the influence of ventilation velocity on heat release rate and smoke movement. They found that proper ventilation could control heat and smoke release rates. One study [
34] investigated the effect of ventilation velocity on the tunnel fire dynamics. Several studies [
18,
19,
20,
21] included experiments to investigate the impact of ventilation velocity on the fire growth rate and the maximum ceiling temperature. While in another study [
35], researchers performed numerical simulations to quantify the influence of ventilation velocity on the tunnel fire dynamics. They also compared a statistical and computational fluid dynamics approach to estimate heat release rates in road tunnel fires.
Angerer and Nowak [
36] concluded that working in an environment with oxygen concentrations of 13% is safe for healthy individuals. Currently, there are ongoing efforts to develop alternative strategies for tunnel ventilation where inert gases are introduced [
37]. Research on numerical or experimental work for evaluating the influence of the oxygen content of ventilating air on tunnel fire dynamics have, however, not been found in the available literature.
The present study attempts to quantify the influence of ventilation air oxygen content on tunnel fire dynamics. This raises the question: is there an optimal concentration of oxygen in the ventilation air that limits fire development while at the same time maintains a livable environment within the tunnel? An optimal ventilating agent that suppresses tunnel fires, while at the same time provides a reasonable time for evacuation and firefighting, would be very beneficial. Motivated by this, numerical simulations are performed in a scaled system to determine the impact of oxygen content on the parameters that are critical for tunnel safety and evacuation. The study investigates how the ventilation air oxygen content alters the dynamics of a tunnel fire. Analytical expressions quantify the influence of tunnel ventilation air oxygen content on maximum heat release rate, maximum ceiling temperature, maximum heat flux to the ceiling, maximum heat flux to the floor, and fire growth rate during critical ventilation conditions. Furthermore, for ambient air ventilation, the developed analytical expressions are compared with available experimental data from the literature.
Section 2 describes the simulation setup and reviews the mathematical model and the Froude scaling technique. In
Section 3, several computational fluid dynamics simulations are presented to quantify the importance of oxygen of the ventilating air on tunnel fire safety. Through these simulations, analytical expressions are developed to relate the tunnel fire dynamics to the oxygen concentration. By Froude scaling laws, these mathematical expressions are transformed to realistic tunnel dimensions. An assessment of the transformed expressions compared to the experimental data for ambient air ventilation is also presented.
Section 4 presents the main conclusions of the study. The study is unique in that it evaluates the tunnel fire dynamics based on oxygen content, and in that it reveals approximate limits for any major influence of the oxygen content.
2. Simulation Setup
In the present study, the fire dynamics simulator (FDS) was used for the modelling. FDS is a 3-dimensional model for calculating the non-linear interactions among fluid flow, combustion, and heat transfer processes in time. The relevant turbulent time and length scales over which the interactions evolve are of the order of 1 ms and 1 mm, respectively [
24,
25,
34,
38,
39]. Realistic tunnels are, however, on the order of kilometers in length. The Norwegian Lærdalstunnel and the planned Rogfast (Boknafjorden) subsea tunnel are 24,509 m and 27,000 m long, respectively. Li et al. [
40] and Ingason et al. [
41] concluded that selecting a grid size of
, as defined in Equation (7), is reasonable for tunnel fire simulations. Computer simulation of a 100 MW fire in the Lærdalstunnel will then require around one billion grid cells, which may be reduced by optimizing the shape of the grid cells. Current computational technologies may, however, not be sufficiently mature for simulating fire dynamics details on very large tunnels. Full-scale experiments are expensive, time-consuming, logistically complicated, and not environmentally sustainable. To overcome this limitation, the studies [
6,
26] employ multiscale modeling (i.e. the flow in major parts of the tunnel is resolved by 1D models). Froude modeling is currently the most widespread scaling technique to bridge small- and large-scale experiments [
17,
41,
42].
An extensive discussion regarding scaling theory and its applications to modeling fires was presented by Quintiere [
42]. Fire safety researchers commonly employ the Froude number preservation approach for scaling, where the Froude number represents the inertial force to the buoyancy force ratio:
where
ω (m) is the length scale,
ϱ (kg/m
3) is the density of the gases involved,
g (m/s
2) is the acceleration of gravity, and
u (m/s) is the velocity. The first of these expressions resembles the basic physics more correctly than the second expression [
43]. The fire community does, however, favor the second equation, which is also used in the present work. For restricting the flow of smoke at the fire source, Thomas [
23] stated that the Froude number should be close to 1, whereby the fire plume buoyancy force and ventilation inertia force balance each other. The dynamic similarity between model (M) and full (F) scale requires that:
Froude number equality in the model and the full scale ensures correct gravity forces scaling. The other scaling relations may then be derived using Equation (2) and the respective physical parameters. Equation (3) gives the scaling correlations:
The critical ventilation velocity in the real-scale Runehamar tunnel is around 2.7 m/s [
44,
45,
46,
47]. From Equation (2), the corresponding critical ventilation velocity in the model scale tunnel is 0.57 m/s.
A combustion model (e.g., infinitely fast reaction between properly mixed fuel and oxygen at sufficiently high temperatures), radiation model (e.g., gray gas radiation model), and low-Mach variable density formulations of the fluid dynamics conservation equations represent a good mathematical approximation of the involved processes. FDS uses these assumptions and the mathematical model given by:
where
(kg/m
3) is the density,
is the mass fraction of the gaseous species
,
(W/m
3) is the heat release rate per unit volume,
(kW/m
2) represents radiation and conduction heat fluxes,
(kg/m
3) is the rate of formation per unit volume of the species
,
(m
2/s) is the diffusion coefficient of the species
,
(N/m
2) is the tension tensor for Newtonian fluids,
(W/m
3) represents kinetic energy dissipation, and
(J/kg) is the enthalpy of the fluid. This enthalpy is a function of the fluid specific heat and temperature:
Equation (4) represents a set of partial differential equations for the density (component mass fractions), velocity, pressure, and fluid enthalpy. The momentum equation consists of one equation for each of the three velocity components. So, including Equation (5), there are six unknowns and five equations. The equation of state closes the system:
where
(J/kg∙mol) is the universal gas constant and
(kg/mol) is the molecular mass of the species
. FDS is an implicitly filtered (i.e., the ratio of filter-width to grid-spacing is one) second-order accurate Large Eddy Simulation (LES) code [
38]. It solves the low-Mach formulations of the relevant conservation equations for calculating the fluid dynamics of the fire. To simulate radiation, it solves the gray gas radiation transport equation. For combustion, FDS uses the Eddy Dissipation Concept (EDC) of Magnussen and Hjertager. For modelling turbulence, it uses Large Eddy Simulation (LES) [
3,
38,
39] (i.e., the large scales of fluid motions are simulated while the small scales are either neglected or modeled). The Deardorff turbulence model was used in the present work and numerical simulations were performed in a 15 m by 0.4 m by 0.3 m tunnel. The simulation domain and the fire source is shown in
Figure 1. On the left portal, a uniform velocity of 0.57 m/s was specified while the right portal was open to the atmosphere.
The accuracy of numerical simulations depends strongly on the selected mesh size. The FDS user’s guide recommends using the characteristic fire diameter to estimate an appropriate mesh size:
where
(kW) is the rate of heat release,
(kg/m
3) is the ambient air density,
(kJ/kg∙K) is the air specific heat, and
(K) is the ambient air temperature. The quantity
can be understood as the number of computational cells spanning the characteristic (not necessarily physical) diameter of the fire [
38,
39]. Here,
(m) is the nominal mesh size. The FDS user guide recommends a ratio
between 4 and 16 to adequately resolve plume dynamics. For a 100 kW fire, the mesh size then needs to be between 0.02 and 0.1 m. To increase the simulation speed and to refine the part of the computational domain where most of the changes occur, the domain was divided into three subdomains along the x-direction. In the subdomain x = 0 to x = 4 m, the number of grid cells along the x, y, and z directions were 80, 8, and 6, respectively.
In the next subdomain, i.e., x = 4 m to x = 10 m, the number of grid cells along the three coordinate directions were 240, 16, and 12, respectively. While in the subdomain x = 10 m to x = 15 m, the number of grid cells along the three directions were 100, 8, and 6, respectively. Thus, in the three subdomains, the mesh size is smaller than the recommended size. The construction material for the boundaries (top, left, and right) is Promatect-T [
44,
45]. Thermal conductivity, density, and thermal capacity of the Promatect-T are 0.212 W/mK, 900 kg/m
3, and 1100 J/kgK, respectively [
44]. During sensitivity analysis, the mass loss rate per unit area (MLRPUA) of fuel was 0.016 kg/m
2s.
To ascertain the proper size, a mesh sensitivity study was performed. In the first case, the number of cells in the three subdomains are 80, 8, 6; 240, 16, 12; 100, 8, 6. Thus in the first case, the total number of mesh cells were 54,720. While in the second case, the mesh was refined by a factor of 2 in each of the three subdomains giving a total number of 437,760 mesh cells. Simulating the second case takes significantly more time than the first case. The results of mesh sensitivity study are shown in
Figure 2.
The maximum ceiling temperature after 500 s is compared for ventilating air consisting of 15% and 22% O2. It can be seen that decreasing the concentration of oxygen in the ventilating air decreases the maximum tunnel ceiling temperature. The sensitivity analysis also shows that the oxygen content of the ventilating air influences the maximum tunnel ceiling temperature significantly. The refinement of the grid does not significantly alter the results. The refined case does, however, take considerably more time to simulate. To quantify the importance of oxygen concentration, the number of mesh cells in the three subdomains was kept equal to the first case. That also falls within the FDS recommended guidelines.
3. Results and Discussion
During the sensitivity studies, 25 computational fluid simulations were performed, while varying the concentration of oxygen from 11.7% to 23.0% (by mass). The output or response parameters are maximum heat release rate, maximum tunnel ceiling temperature, maximum tunnel ceiling flux, and maximum fire growth rate. The fire growth rate is given by:
The outcome of the sensitivity studies are presented in
Figure 3 and
Figure 4. The variation of the maximum heat release rate with the oxygen content of the ventilating air is presented in
Figure 3a. It is clearly seen that the maximum heat release rate is strongly dependent on the oxygen concentration. A Boltzmann Sigmoidal function fit to the data provided:
where
(kW) is the maximum heat release rate and
is the molar fraction of oxygen in the air. Here,
stands for the model scale tunnel. For the above fit, the data of the oxygen concentrations between 13% and 20% was used. For the Equation (9), we get
and
.
According to the Magnussen and Hjertager Eddy Dissipation Concept (EDC), the fuel consumption rate is proportional to both the local limiting reactant concentration and the local mixing rate:
where
and
are the fuel and air lumped mass fractions, respectively,
is the mass stoichiometric coefficient for air, and
is a mixing time scale. The heat release rate is proportional to the fuel consumption. The heat release per unit volume is found by summing the species mass production rates times the respective heats of formation
The characteristic mixing time depends on the turbulence characteristics of the flow in an inverse manner. The turbulence characteristics of the flow, in turn, depend on the ventilation velocity and the heat release rate. As the heat release rate decreases, the characteristic mixing time will increase.
The lumped mass fraction of the fuel depends on the mass of the available fuel and the mass of the available oxygen and the mass loss rate per unit area (MLRPUA) is kept constant during the sensitivity analysis. Thus the fuel mass is constant. As the oxygen concentration decreases, the availability of oxygen will govern the combustion reactions (i.e. the fuel mass consumption depends on the oxygen concentration). Thus, from Equation (10), the amount of fuel involved in the combustion will decrease because of a reduction in oxygen concentration and a corresponding increase in the characteristic mixing time. Furthermore, according to Equation (11), it will reduce the maximum heat release rate. That is evident in
Figure 3a. Increasing the oxygen concentration from 14% to 18% increases the heat release rate. At around 18% oxygen concentration, the maximum heat release rate reaches a critical value and remains constant. It is possible that when the oxygen concentration is between 14% and 18%, the combustion is oxygen-controlled, while for oxygen concentration above 18%, the combustion is fuel-controlled.
Understanding heat release rate in tunnel fires is critical. Several studies [
18,
19,
20,
21,
22,
23,
24,
25,
26] explore this further. One study [
35] employs the computational fluid dynamics approach to estimate the heat release rate in a road tunnel fire, while other studies [
18,
19,
20,
21] use a statistical approach to quantify the influence of ventilation conditions and tunnel geometry on heat release rate.
The variation in maximum ceiling temperature with oxygen concentration is shown in
Figure 3b. It is clearly seen that there is a strict dependency of the maximum ceiling temperature on oxygen concentration. Lowering the oxygen concentration to 14% reduces the maximum tunnel ceiling temperature from about 1300 °C to around 700 °C. It can also be seen that for oxygen concentration below 12%, the combustion reaction is terminated. A linear regression fit to the data leads to:
where
is the oxygen mass fraction and
(°C) is the maximum temperature of the tunnel ceiling. The coefficient of determination (or
value) for the relation (9) is 0.84, and the
is 0.193. The
value is a measure of goodness-of-fit of linear regression and its value is in the range 0 to 1. High tunnel ceiling temperatures threaten the safety of trapped individuals, as well as threaten the tunnel structure integrity [
47]. The tunnel structure integrity is one of the key design parameters and it is very dependent on the heat exposure. The concrete structure may break and collapse if the temperature approaches 500 °C [
46,
47,
48]. Furthermore, it will hinder evacuation of trapped individuals. In July 2015, a gasoline truck travelling uphill in the Skatestraum tunnel lost its tank [
1]. The subsequent fire caused explosive shelling of concrete and ignited the PE foam in the tunnel walls. The large scale Runehamar fire tests showed that during a heavy goods vehicle fire, the tunnel ceiling temperatures could reach 1300 °C [
44,
45].
The variation of the maximum heat flux to the tunnel ceiling with the oxygen content of the ventilation air is shown in
Figure 3c. It may be noticed that the maximum heat flux to the tunnel ceiling depends strongly on the oxygen concentration. Tunnel structure heat exposure is usually assessed only by some standard temperature and time curves. Heat flux to the tunnel ceiling is relevant in establishing the tunnel structure integrity. A linear regression fit to the data leads to:
where
(kW/m
2) is the tunnel ceiling maximum heat flux. For the regression fit (13),
= 0.98 and
= 2.17 × 10
−3.
The maximum heat flux to the tunnel floor may have consequences for personnel evacuation and firefighting efforts. The variation of the maximum heat flux to the tunnel floor with the oxygen content of the ventilation air is shown in
Figure 3d. A linear regression fit to the data leads to:
where
(kW/m
2) is the maximum flux to the tunnel ceiling. For the regression fit (14),
= 0.93 and
= 5.37 × 10
−3.
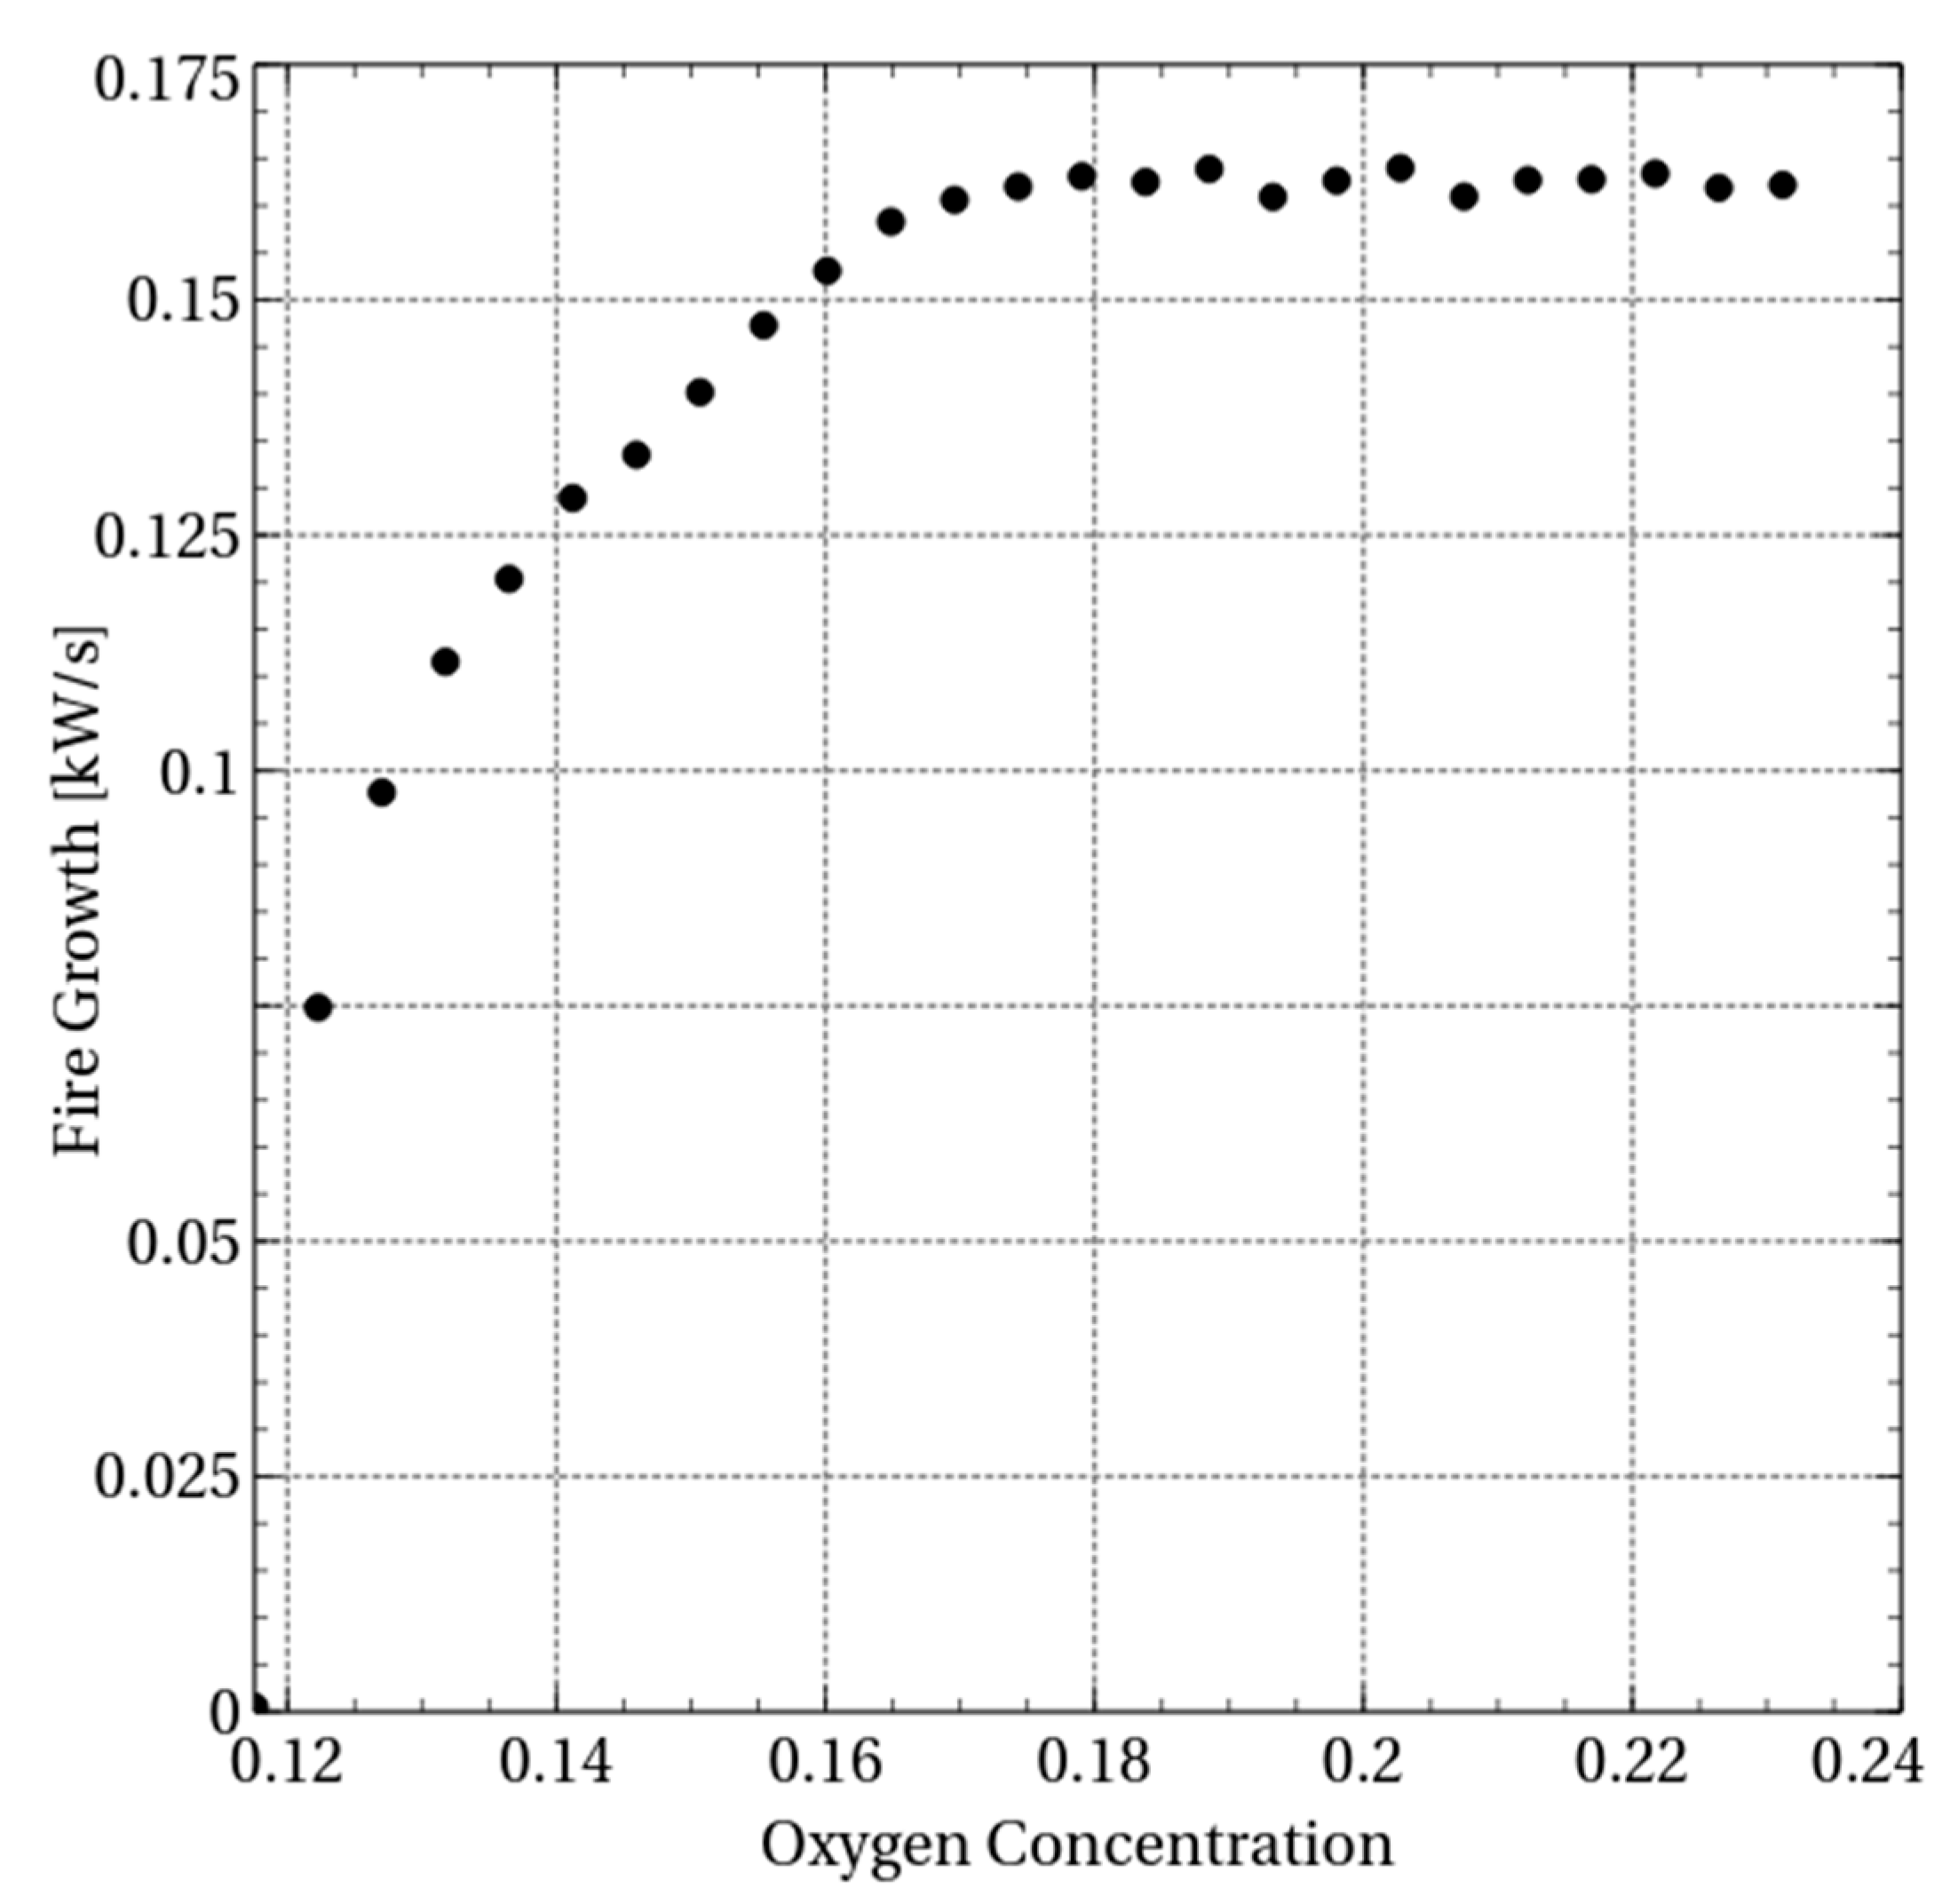
The fire growth rate is the maximum heat release rate divided by the time to reach the maximum heat release rate. The fire growth rate as a function of oxygen concentration is presented in
Figure 4. It is evident that the fire growth rate depends on the oxygen concentration. Increasing the oxygen concentration from around 13% to around 17% increases the fire growth linearly from 0.09 to 0.17. Increasing the oxygen concentration further does not seem to influence the fire growth rate. It is vital to know the fire growth rate as high rates can accelerate spread of fire that can hinder evacuation of personnel. It is also well known that increased ventilation velocity accelerates the fire growth rate. Experimental studies display a linear fire growth increase with the ventilation velocity.
With the help of Froude’s scaling relations (3), results from the small-scale experiments or modeling may be extrapolated to the full scale [
31]. In the present case, the relations (3) extrapolated to the realistic full scale (F) gives:
Now the Equations (15) may be compared with the Runehamar tunnel fire experiments, as shown in
Table 1. It is seen that the analytical expressions compares favorably with the experimental results. The temperature profiles when ventilating tunnel with air containing 15 and 22 percent oxygen is presented in
Figure 5.
It is very interesting to notice that several of the characteristic fire dynamics parameters are quite dependent on the oxygen concentration, at least up to 18% (by mass) O
2-content. The reason for hardly any dependency on the O
2-content above 18% may simply be due to fuel controlled combustion. For O
2-content below 18%, the combustion is likely controlled by ventilation (i.e., the availability of oxygen). In fires, the heat flux from the hot gases at the ceiling to the combustibles often governs the fire development. Comparing the smoke layer temperatures close to the fire, as shown in
Figure 5 (i.e., 15% O
2-content and 22% O
2-content), it is quite clear that the higher temperatures recorded in the second case makes a difference. It should also be noted that, for a given emissivity close to unity in large tunnels, the heat radiation is proportional to the absolute temperature to the fourth power. A temperature change from 600 °C to 1000 °C, for example, then makes a major difference in the heat fluxes (i.e., a factor 4.5). The temperature dependency of the O
2-content, as indicated by the different cases in
Figure 5, is therefore a central part of the explanation for the less severe situation when the O
2-content in the tunnel air is reduced. For 15% O
2-content, which is 2% above the 13% O
2-content limit defined as safe for healthy people [
33], the heat stress to people evacuating the tunnel is far less than the situation at 22% O
2-content. This significantly increases the likelihood of a successful evacuation.


