Article

Wind Erosion Changes in a Semi-Arid Sandy Area, Inner Mongolia, China

1
College of Land Science and Technology, China Agricultural University, Key Laboratory of Agricultural Land Qualify, Monitoring and Control, Ministry of Natural Resources, Beijing 100193, China
2
Sino-Japan Friendship Center for Environmental Protection, Beijing 100029, China
*
Author to whom correspondence should be addressed.
Sustainability 2019, 11(1), 188; https://doi.org/10.3390/su11010188
Submission received: 8 November 2018 / Revised: 23 December 2018 / Accepted: 26 December 2018 / Published: 1 January 2019
(This article belongs to the Section Environmental Sustainability and Applications)

Abstract

:
Wind erosion is one of the major environmental problems in drylands. Identifying the dominant natural factors of wind erosion and using targeted treatment measures are the key steps in wind erosion control. Using Horqin Left Back Banner in China as a case study, we applied the revised wind erosion equation to simulate the spatial distribution of wind erosion in the semi-arid sandy area. Contribution assessment and constraint line analysis were used to investigate the contributions of driving forces to wind erosion changes. The results showed that the wind erosion in the whole area was reduced by 0.35 t/hm2·a from 2005 to 2016. The wind factor and vegetation coverage factor had dominant contributions to the wind erosion modulus and accounted for the erosion in 49.87% and 50.13% of the total area, respectively. In addition, the average wind speed exceeding the threshold and the number of occurrences exhibited significant correlations with the wind erosion severity. Meanwhile, the mitigation effects of vegetation coverage on wind erosion decreased with the increase in wind speed. The temporal mismatch between the wind speed and vegetation coverage was the main reason for the frequent severe wind erosion in spring. Reducing the spring wind speed through adding windbreaks would be an effective method for decreasing wind erosion in semi-arid areas.

1. Introduction

As a major environmental problem in drylands, wind erosion has drawn considerable attention from researchers [1,2,3]. Wind erosion reduces soil fertility [4,5], increases the frequency of sand storms [6], spreads diseases [7,8], and poses serious threats to the health of people and sustainable development. Northern China is one of the most severe wind erosion areas in the world [9]. To alleviate wind erosion and enhance the capacity of sand-stabilization, the Chinese government has introduced a series of projects and policies since 2000 [10], including the Three Norths Shelter Forest System Project (Phase IV) [11], the Grain for Green Project [12], and the Natural Forest Conservation Program (Phase II) [13]. Although the wind erosion in northern China declined after the implementation of these policies [14], it has still not been fully controlled in some areas, such as the heavily sandy areas in Mu Us Sandy Lands and Horqin Sandy Lands in Inner Mongolia, China.
Wind erosion is generally affected by both natural factors and human activities [15,16,17,18]. However, since human activities are bounded by natural conditions and affect wind erosion by changing natural factors [19], the natural factors, such as vegetation coverage, wind speed, temperature, and precipitation, should be the direct contributing drivers to wind erosion. The role of different natural conditions in wind erosion changes needs to be further explored [9,20,21]. Previously, researchers have reported significant negative correlations between vegetation coverage and wind erosion [22], effects of temperature change on wind erosion in Inner Mongolia [23], and the ability of wind speed and precipitation to affect wind erosion [14]. In addition, studies have also shown that the trend of wind erosion and its dominant factors varied greatly due to regional heterogeneity [23,24]. For example, Meng et al. [20] found that the most important natural factors that can influence aeolian sand transportation in Inner Mongolia were wind speed, vegetation coverage, and soil moisture. A finding by Jiang et al. [14] suggested that the spatial distribution pattern of wind erosion was consistent with the distribution patterns of erodible soil, vegetation cover, and precipitation. However, the contribution of each natural factor to regional wind erosion still remains unclear. Therefore, quantitatively identifying the dominant natural factors of wind erosion and using targeted treatment measures are the key steps in wind erosion control.
Various process-based empirical or semi-empirical models were built to assess wind erosion. The most widely used models are the Wind Erosion Equation (WEQ) [25], the Revised Wind Erosion Equation (RWEQ) [26], and the Wind Erosion Prediction System [27]. The RWEQ model is refined based on the WEQ model and is widely used in wind erosion simulation and driving forces determination in dryland systems. For instance, Du et al. [28] used field observation data of 2011 and 2012 to calibrate the RWEQ model and to calculate the wind erosion in the Ningxia-Inner Mongolia reach of Yellow River from 1986 to 2013. The calibration results showed satisfactory simulation accuracy. Jiang et al. [14] analyzed the results of the RWEQ by using redundancy analysis and constrained linear ordination, and concluded that wind erosion reduction was related to the increase in precipitation and decrease in the number of days of strong winds in Inner Mongolia. Li et al. [22] found that climate change accounted for almost half of the soil retention increase by using a multiple linear regression model. However, few studies have focused their analysis on the differences in the contribution between different natural factors to wind erosion, which might be the key to adopting targeted wind erosion control measures.
In this study, we used the RWEQ model to simulate wind erosion in the Horqin Left Wing Back Banner, China (HLBB) and used the partial differential method to analyze the contribution of different driving factors to wind erosion changes. Our analysis also focused on the effects of natural factors on the changes in wind erosion at a semi-monthly scale. The main objectives of this study are as follows: (1) to analyze the spatial and temporal changes of wind erosion in HLBB from 2005 to 2016; (2) to investigate the spatial distribution of meteorological and vegetation factors’ contributions to the wind erosion dynamics in HLBB; (3) to identify the dominant driving factors that influenced wind erosion changes; (4) to reveal the possible mismatches and differences in the temporal distributions among various natural factors; and (5) to provide a scientific basis for wind erosion control policy making in sandy areas.

2. Materials and Methods
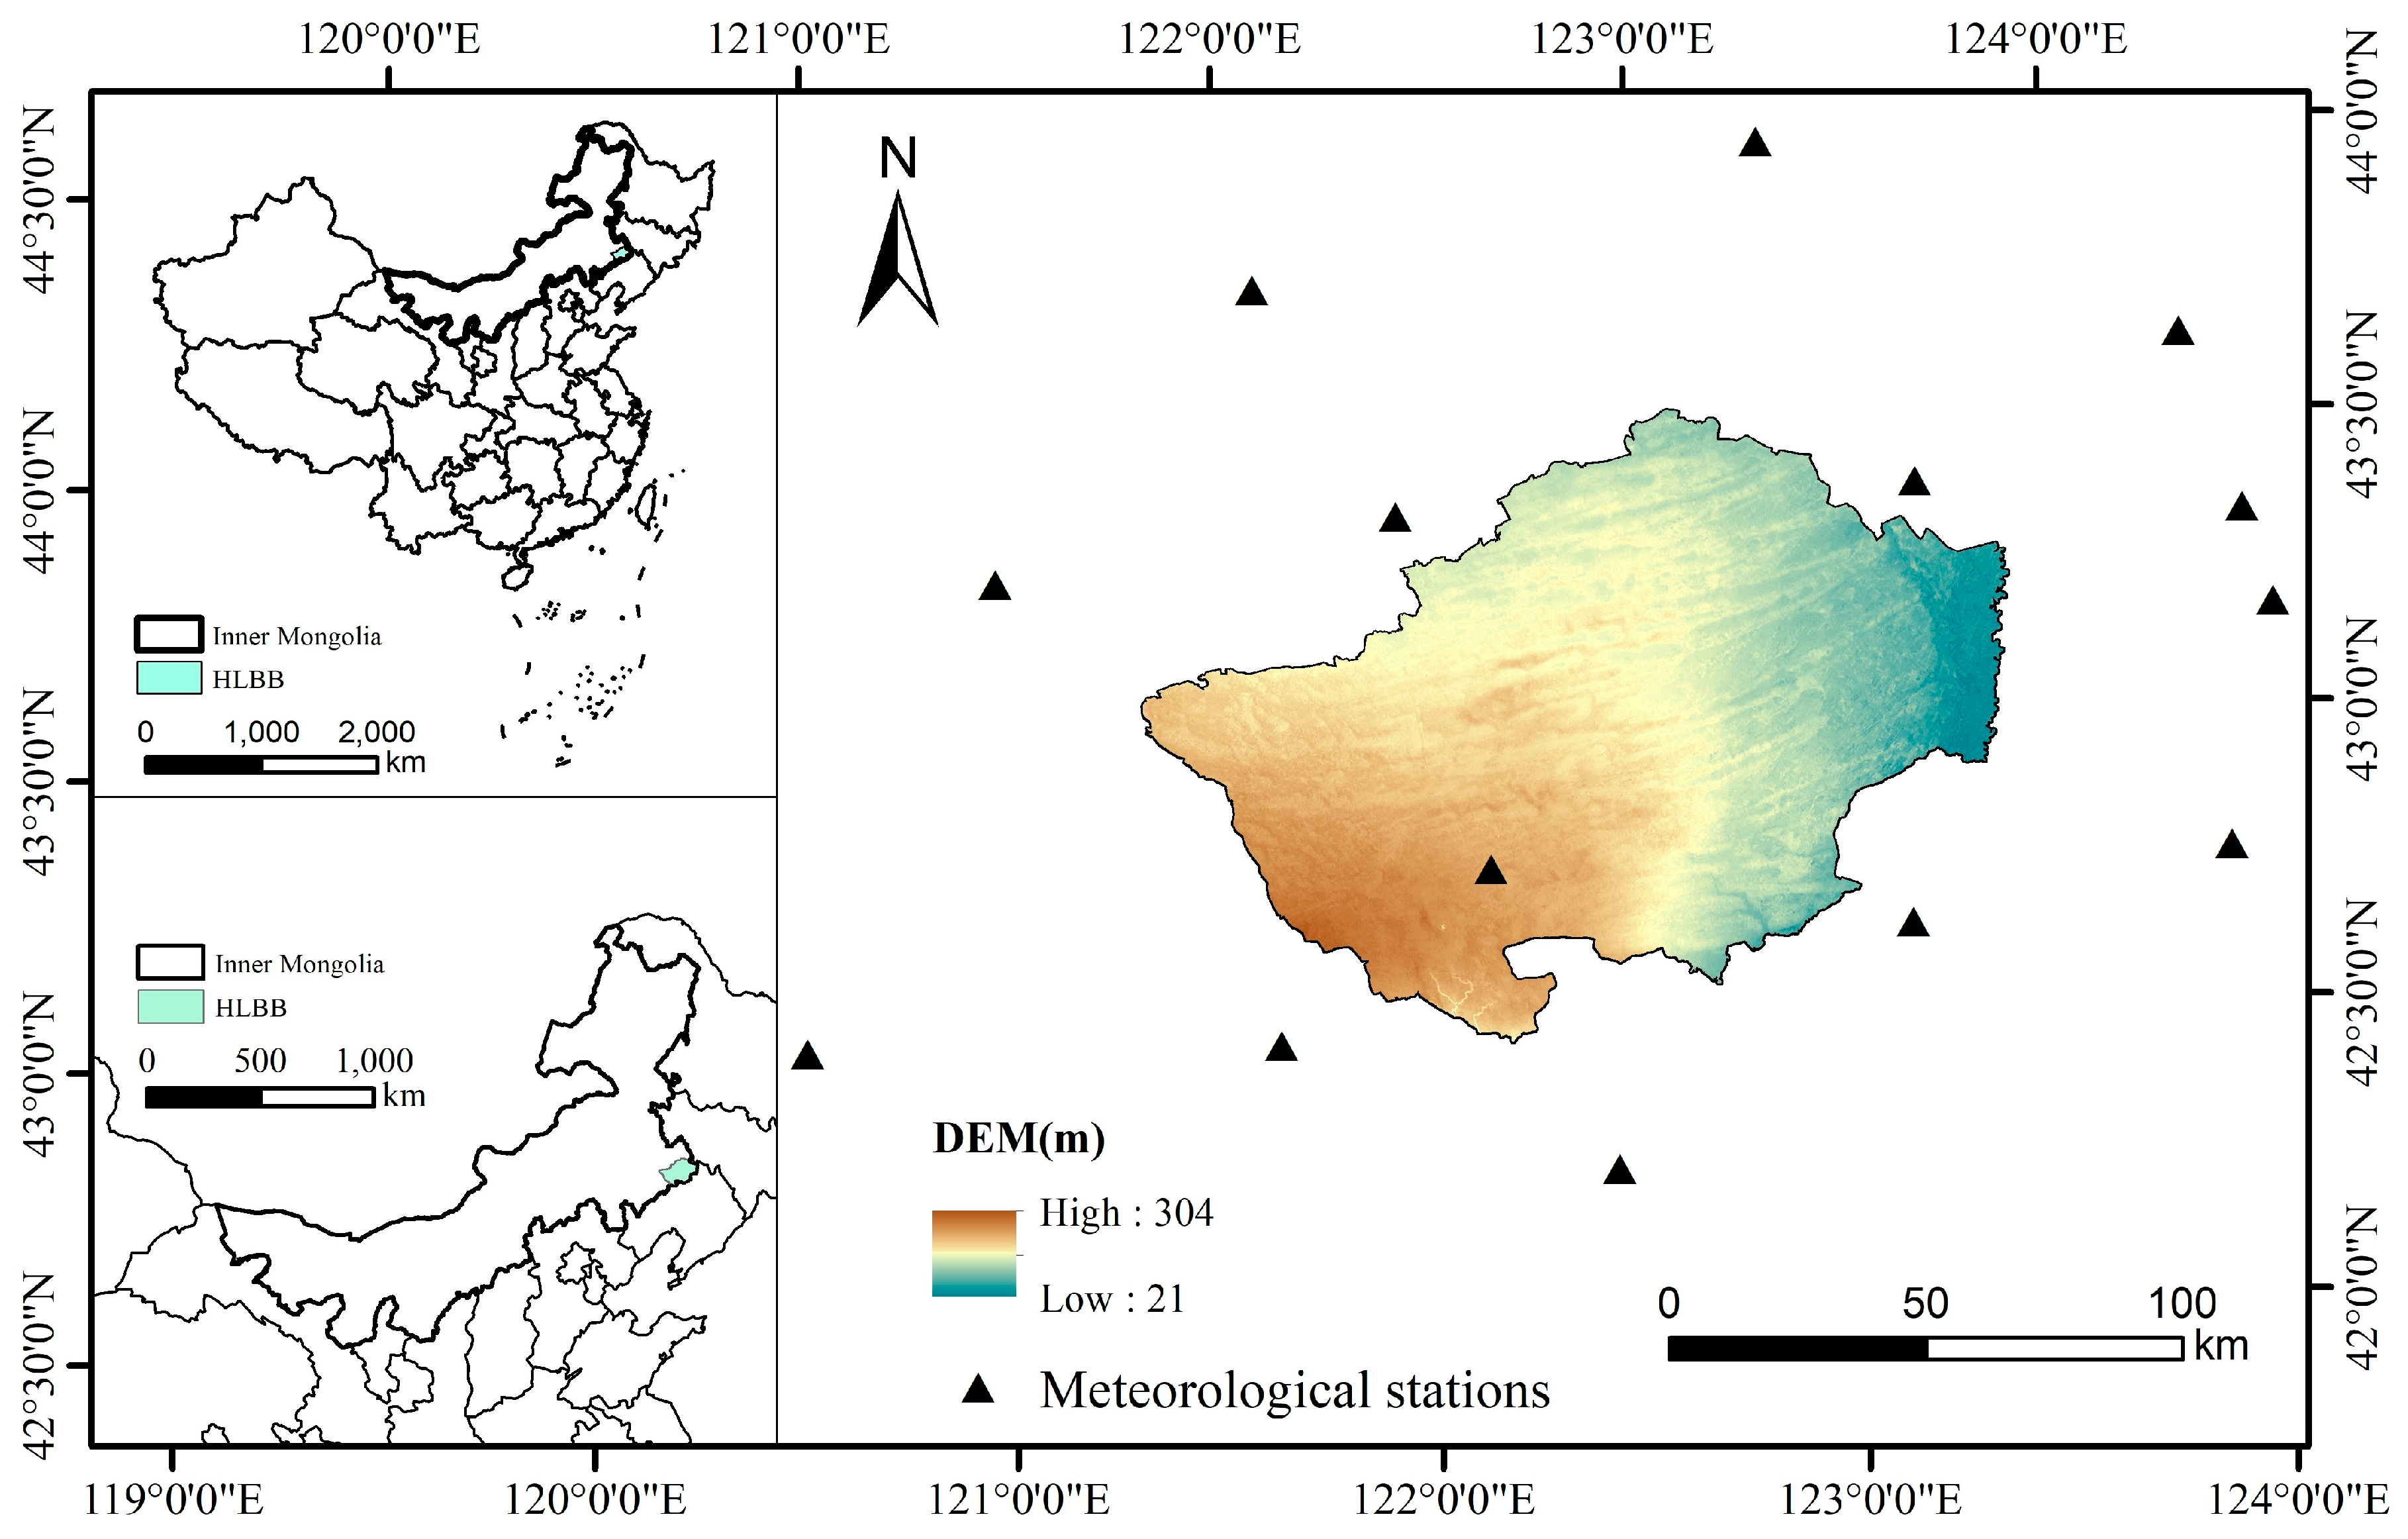
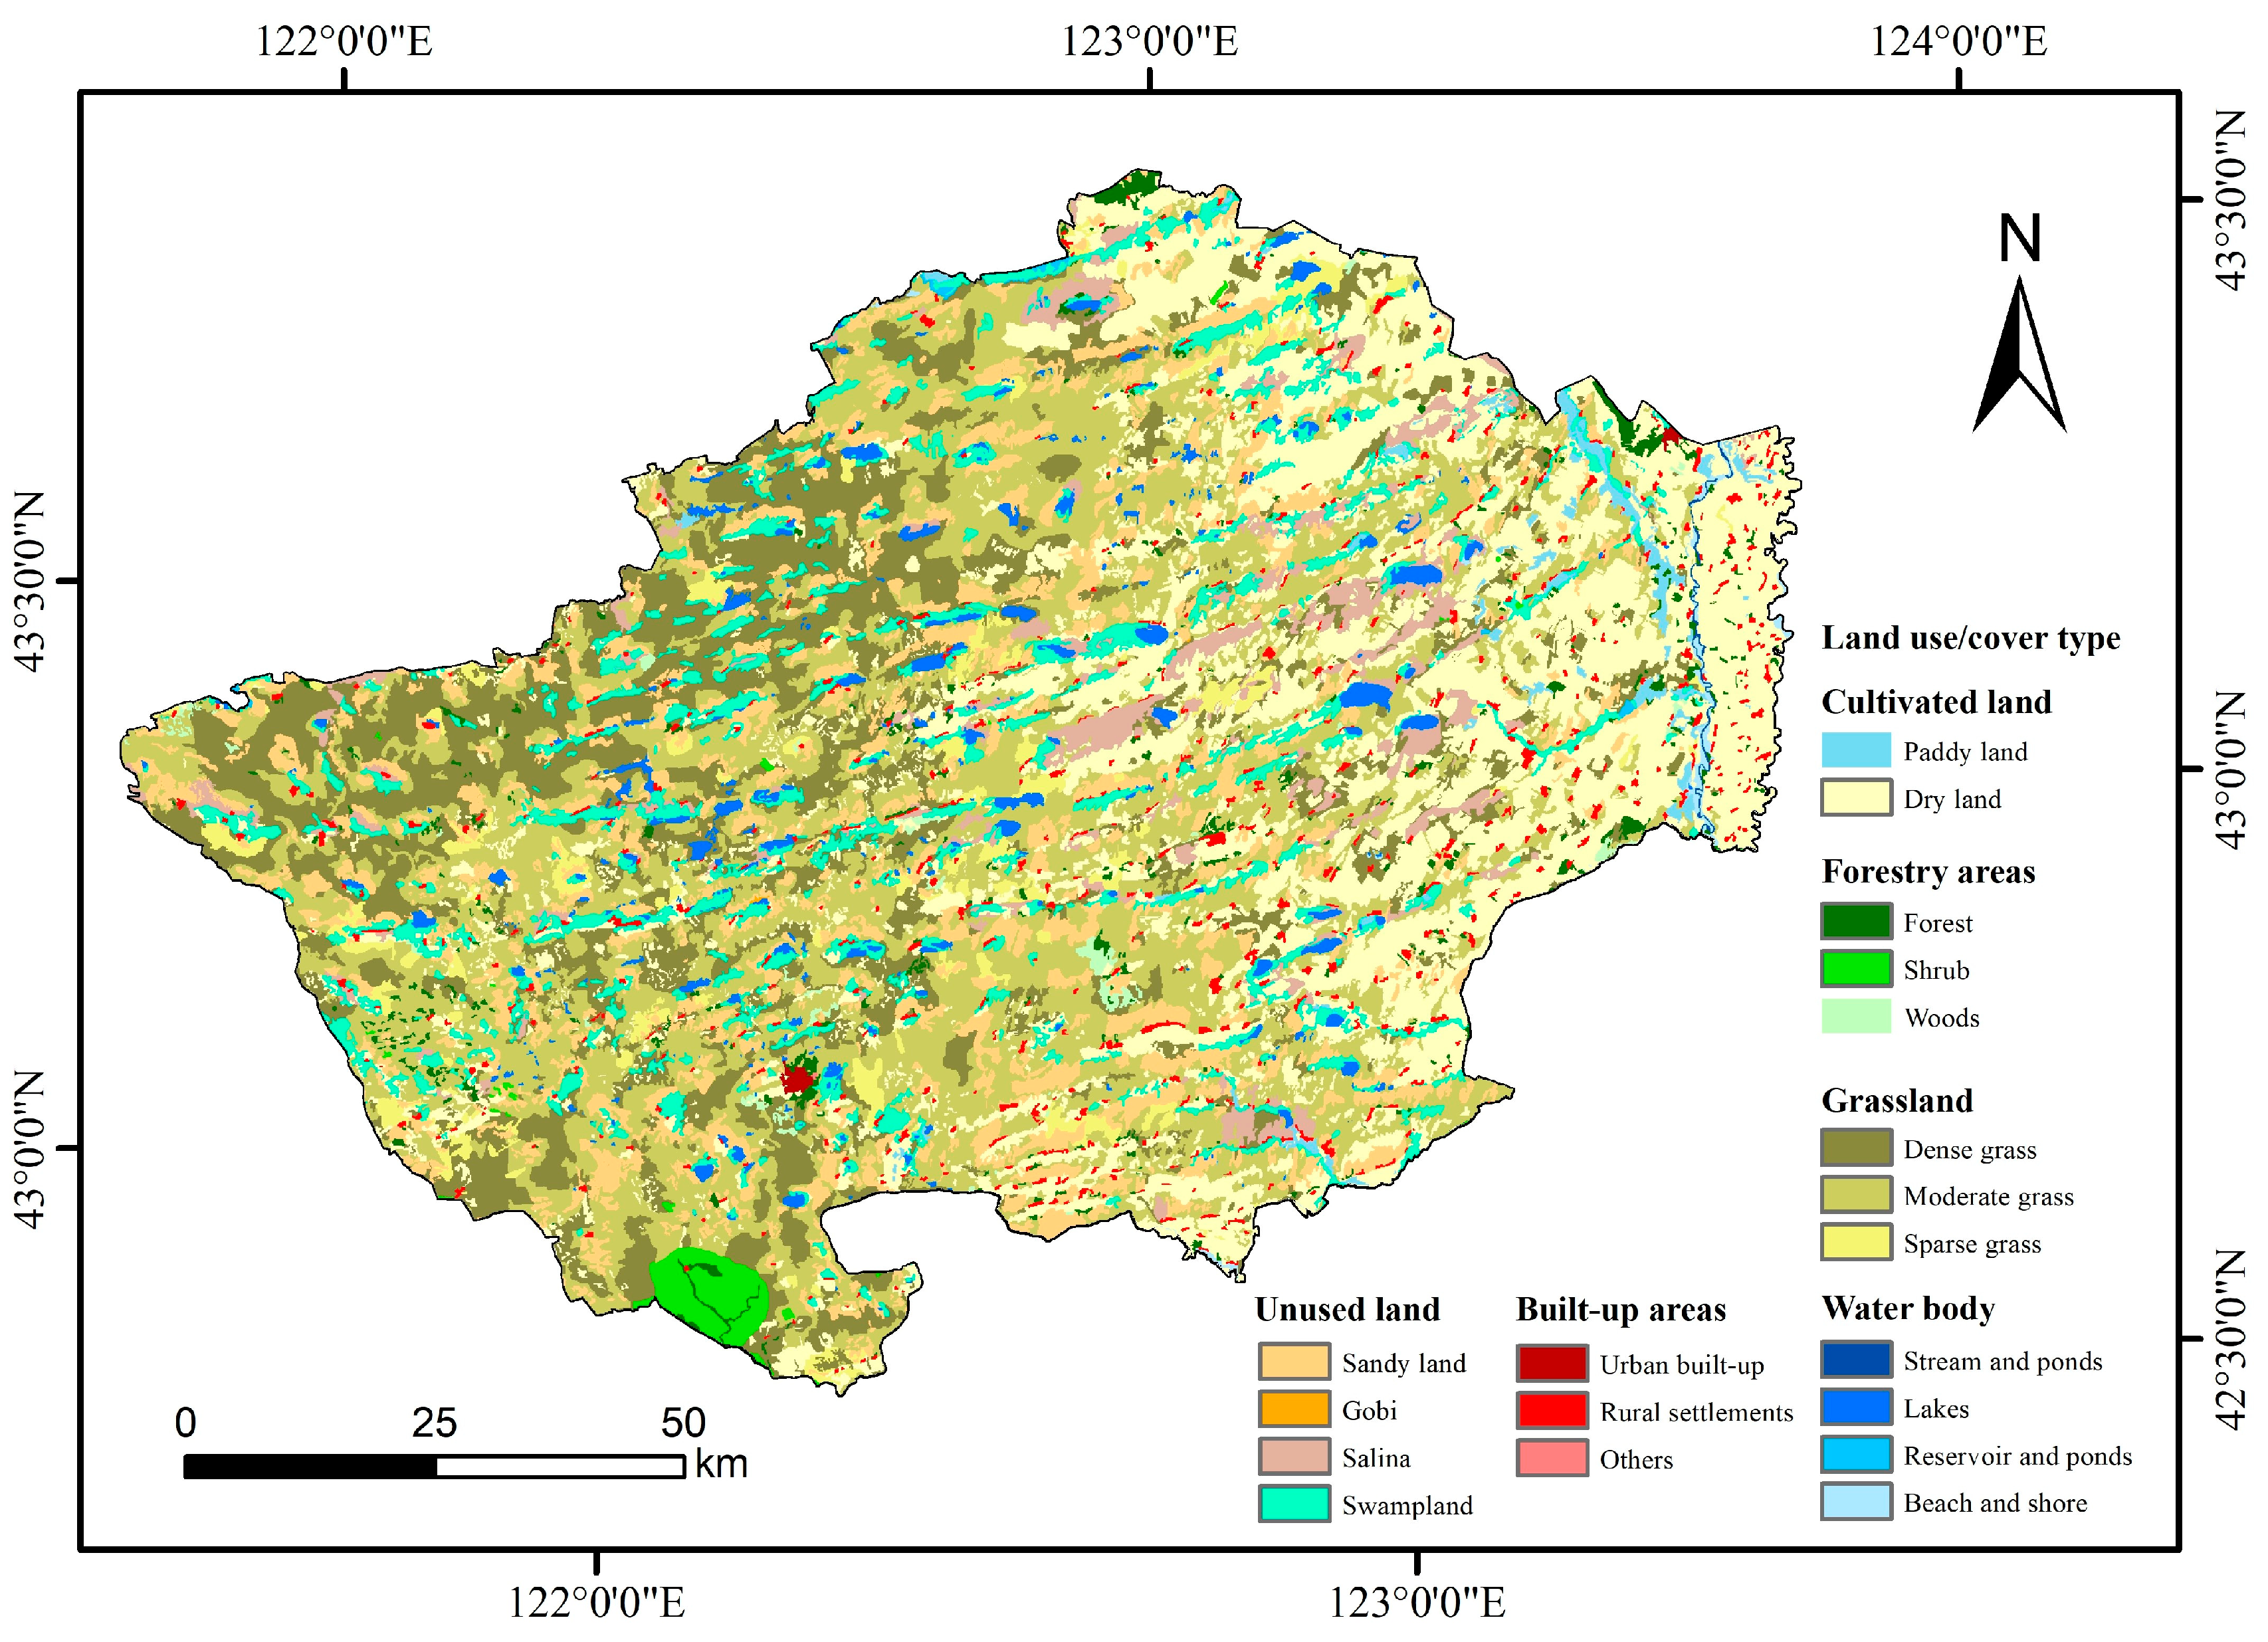
2.1. Study Areas

The Horqin Left Wing Back Banner (121.5° E–123.7° E, 42.7° N–43.7° N) is located at the southeast side of the Horqin Sandy Land (Figure 1) and covers an area of 11,476 km2. HLBB is a typical semi-arid sand area with dry and windy conditions in spring. The average annual precipitation is approximately 350–450 mm, and approximately 70% of the total annual precipitation is concentrated from July to September [29]. The local terrain consists of flat to undulating sand and plains (Figure 1). The topography of HLBB is dominated by sand dunes but also contains alluvial valleys and flat sand. The main soil types include aeolian sandy soil, meadow soil, alkaline soil, and marsh soil, each accounting for approximately 68.9%, 23.1%, 7.2%, and 0.78%, respectively. The surface layer of sandy soil is structureless and is accompanied by coarse sand, which is extremely erosive [30]. HLBB is also a typical agro-pastoral area in northern China. The vegetation community is dominated by secondary grassy plant species and sparse shrubs. Trees can only be found in artificially planted economic forests and windbreaks. Grazing and farming are the traditional land use types with distinct boundaries between cultivated land and pasture land (Figure 2). The desertification is more severe in pasture-dominated central and western regions. The areas with relatively low wind erosion are the eastern plains that are dominated by cultivated land and the Daqinggou nature reserve with high forest cover in the southwest region [31].
Since the 1980s, the local government has implemented a series of policies and measures to control desertification, such as the “Two Million Mu” Sand Control Demonstration Project, the “Converting Farmland to Forest Project”, and the “Three Norths Shelter Forest System Project (Phase V)”. The construction of these projects is expected to control land desertification and slow down wind erosion by planting trees and grasses in areas under severe desertification in the northwest and north HLBB. The trend of desertification has started to reverse in recent years [32]. However, some remote and broad sandy areas that are relatively difficult to treat are not controlled yet. Identifying the driving factors of wind erosion is the key to overcoming the obstacles of wind erosion control in HLBB.

2.2. Data Acquisition and Processing

Meteorological data were obtained from the meteorological stations in HLBB and its surrounding areas (14 stations in total) from the China Meteorological Data Service Center (http://data.cma.cn/). The dataset includes temperature, precipitation, wind speed, wind direction, solar radiation, and sunlight hours data from 2005 to 2016. Given the flat terrain of HLBB, the spatial grid of meteorological data was directly interpolated by using the Kriging method in ArcGIS 10.2. The snow depth data were provided by the Environmental and Ecological Science Data Center for West China, National Natural Science Foundation of China (http://westdc.westgis.ac.cn).
Normalized Difference Vegetation Index (NDVI) data were derived from the MOD13Q1: MODIS/Terra Vegetation Indices 16-Day L3 Global SIN Grid V006 (https://lpdaac.usgs.gov/dataset_discovery/modis/modis_products_table/mod13q1_v006). The Digital Elevation Model (DEM) and soil structure dataset, such as sand, silt and clay, CaCO3, and organic carbon content data, were obtained from the Geospatial Data Cloud site, Computer Network Information Center, and Chinese Academy of Sciences (http://www.gscloud.cn). All grid cells were resampled into 100 m × 100 m resolution.

2.3. The RWEQ Model

The RWEQ model is an empirical-based model designed by Fryrear et al. [26] to estimate soil eroded and transported by wind between the soil surface and a height of 2 m at a field scale. The RWEQ model has been widely used for estimating soil loss at a regional scale [33,34,35,36]. The equation combines the factors that can affect wind erosion processes, which include wind speed, snow depth, soil, and vegetation [37]. The rate of soil loss at a specific location can be computed by the model as follows:
S L = 2 x S 2 · Q max · e ( x s ) 2 ,
Q max = 109.8 ( W F · E F · S C F · K · C ) ,
S = 150.71 ( W F · E F · S C F · K · C ) 0.3711 ,
where SL in kg/m2 is the rate of soil loss caused by wind erosion, which is also referred to as the wind erosion modulus; x in m is the distance from the upwind edge of the field; Qmax in kg/m is the maximum transport capacity; S in m is the critical field length that is defined as the distance at which 63% of the maximum transport capacity is reached; the Qmax and S are calculated by the weather factor (WF) in kg/m; the dimensionless factors are soil erodibility factor (EF), soil crust factor (SCF), soil roughness factor (K′), and combined vegetation factor (C).
WF is one of the most significant factors affecting wind erosion, which is determined by wind speed, precipitation, temperature, radiation, and snow cover. The weather factor can be calculated as follows:
W F = i = 1 N U 2 · ( U 2 U t ) 2 · N d ρ N · g · S W · S D ,
where U2 in m/s is 2 m wind speed; Ut is the threshold wind speed assumed as a constant of 5.0 m/s [26]; Nd is the number of days during the evaluation period; N is the observation frequency of wind speeds during a period; ρ is the air density in kg/m3; g is the acceleration due to gravity in m/s2; SW and SD are the dimensionless soil moisture and snow-cover factor, respectively.
Wind speed is usually the most important driving factor affecting wind erosion [38]. The actual measured wind speed is generally used in the RWEQ model [26]. If the wind speed data are missing or fail to meet the needs of this model, a wind speed simulation add-in named Wind Generator is often used to simulate wind speeds [38]. However, the Wind Generator tends to underestimate wind speed data, especially for the high wind section [39]. In this study, the actual measured hourly wind speed from China Meteorological Center is used in the model calculation.
The threshold wind speed of sand detachment increases with the increase in soil moisture. In June 2016, the research team obtained 12 soil profiles in Wudan Tara Village, HLBB. The soil moisture content was measured by a TDR100 time domain reflectometer in these 12 soil profiles. The results showed that the average soil water content was between 0.8% and 1%. Accordingly, the threshold wind speed should be approximately 4.5–5.0 m/s at this water content [40]. Therefore, the Ut is determined to be 5.0 m/s, which means that wind erosion is not estimated when the wind speed is below 5.0 m/s.
RWEQ computes the soil EF and SCF based on soil physical and chemical properties [41], which can be calculated as follows:
E F = 29.09 + 0.31 · S a + 0.17 · S i + 0.33 · S a C L 2.59 · O M 0.95 · C a C O 3 100 ,
S C F = 1 1 + 0.0066 · ( C L ) 2 + 0.021 · ( O M ) 2 ,
where Sa, Si, and Cl are the proportion of sand (5.50–93.60%), silt (0.50–69.50%), and clay (5.00–39.30%), respectively; Sa/Cl is the ratio of sand to clay (1.20–53.00%); OM is the organic matter content (0.32–4.74%); CaCO3 is calcium carbonate content (0–25.20%). The brackets show the ranges of data required by the RWEQ model.
The K′ factor is related to chain random roughness (Crr) and soil ridge roughness (Kr) and can be calculated as follows:
K = e ( 1.86 · K r 2.41 K r 0.934 0.127 · C r r ) ,
where Crr is considered 0 in this study, because the effect of random roughness on wind erosion is generally negligible [42], and the spatial data of random roughness in HLBB is difficult to obtain. The Kr is generally calculated by the Smith–Carson Equation as follows:
K r = 0.2 · ( Δ H ) 2 L ,
where L and ΔH are the relief parameter and the elevation differences within the distance L in cm, respectively.
Vegetation cover can also effectively reduce wind erosion [38]. In this study, the crop seedlings that provide partial canopy cover to protect the soil (SLRc) are calculated as the effects of vegetation cover on wind erosion:
S L R c = e 5.614 ( C C 0.6413 ) ,
C C = N D V I N D V I s o i l N D V I m a x N D V I s o i l ,
where CC in % is the vegetation coverage of each pixel; NDVI is the normalized difference vegetation index, which is one of the main characteristic descriptors indicating land surface vegetation cover; NDVIsoil is the value of bare soil pixels; NDVIveg is the value of vegetated pixels. Their selection mainly depends on 95% confidence of NDVI pixel statistic values.

2.4. Statistical Methods

2.4.1. Slope Analysis

The non-parametric Mann–Kendall test proposed by Mann [43] and improved by Kendall [44] is widely used when the probability distribution of data is undefined [45]. Since the distribution of wind erosion in a time series also does not follow a particular probability distribution, the Mann–Kendall test is used for trend and catastrophe analyses of wind erosion in this study. However, the Mann–Kendall test focuses on the temporal analysis rather than spatial distribution. Both wind erosion and its changes exhibit significant spatial heterogeneity. Thus, the linear regression analysis is used in each grid to detect the spatial characteristics of wind erosion change trends. The regression coefficient represented the trend slope, which is calculated as follows:
θ = n · i = 1 n i · S L i i = 1 n i i = 1 n S L i n · i = 1 n i 2 ( i = 1 n i ) 2 ,
γ = θ S L ¯ · 100 % ,
where θ is the trend slope; n is the total number of years; SLi is wind erosion modulus in the ith year with i set to 1–12; S L ¯ is the average wind erosion modulus in each grid during this period. A negative θ indicates the grid exhibiting a decrease in wind erosion over the period, whereas a positive θ indicates an increase trend. Since the absolute amount of the average wind erosion affects the trend, a relative slope (γ) is calculated in each pixel to eliminate the average wind erosion effects.

2.4.2. Sensitivity Analysis and Contribution Assessment

Partial differentials are used to calculate the sensitivity of each driving factor during the wind erosion process [46]:
S v m = lim Δ v m 0 ( Δ S L / S L Δ v m / v m ) = S L v m · v m S L ,
where S v m is the sensitivity coefficient of SL that related to the mth climatic variable vm; S v m indicates the sensitivity of SL under the condition when all variable changes are the same. However, the change rate in each grid varies for each wind erosion variable, such as wind speed, precipitation, temperature, and vegetation coverage. To determine the relative contribution of each variable to wind erosion, we used a contribution assessment method proposed by Yin et al. [47], which studies the sensitivity of SL and the change in trends of these variables. The equations are as follows:
C B v m = S v m · R C v m ,
R C v m = Δ v m v m ¯ = n 0 · β v m v m ¯ · 100 % ,
where C B v m is the contribution rate of meteorological variable vm to SL; R C v m is the multi-year relative change of vm; v m ¯ is the multi-year absolute average of vm; β v m is the magnitude of the trend of meteorological variable vm, which is expressed by Sen’s slope estimator. n 0 is the number of periods we calculated in the wind erosion modulus (23 periods per year for 12 years), which equals 276.

2.4.3. Constraint Line Analysis

In bivariate scattergrams, data points sometimes show clouds bounded by an informative edge, which implies that the independent variable may act as a limiting factor constraining the response of the dependent variable (i.e., constraint effect). In this case, constraint line analysis is suggested instead of the correlation and regression methods [48,49,50]. The constraint line helps researchers extract effective information from scattered data and understand the limiting effect among variables. Therefore, we quantified the effects of vegetation cover on wind erosion using the constraint line method as suggested by Zhao et al. [51].

3. Results

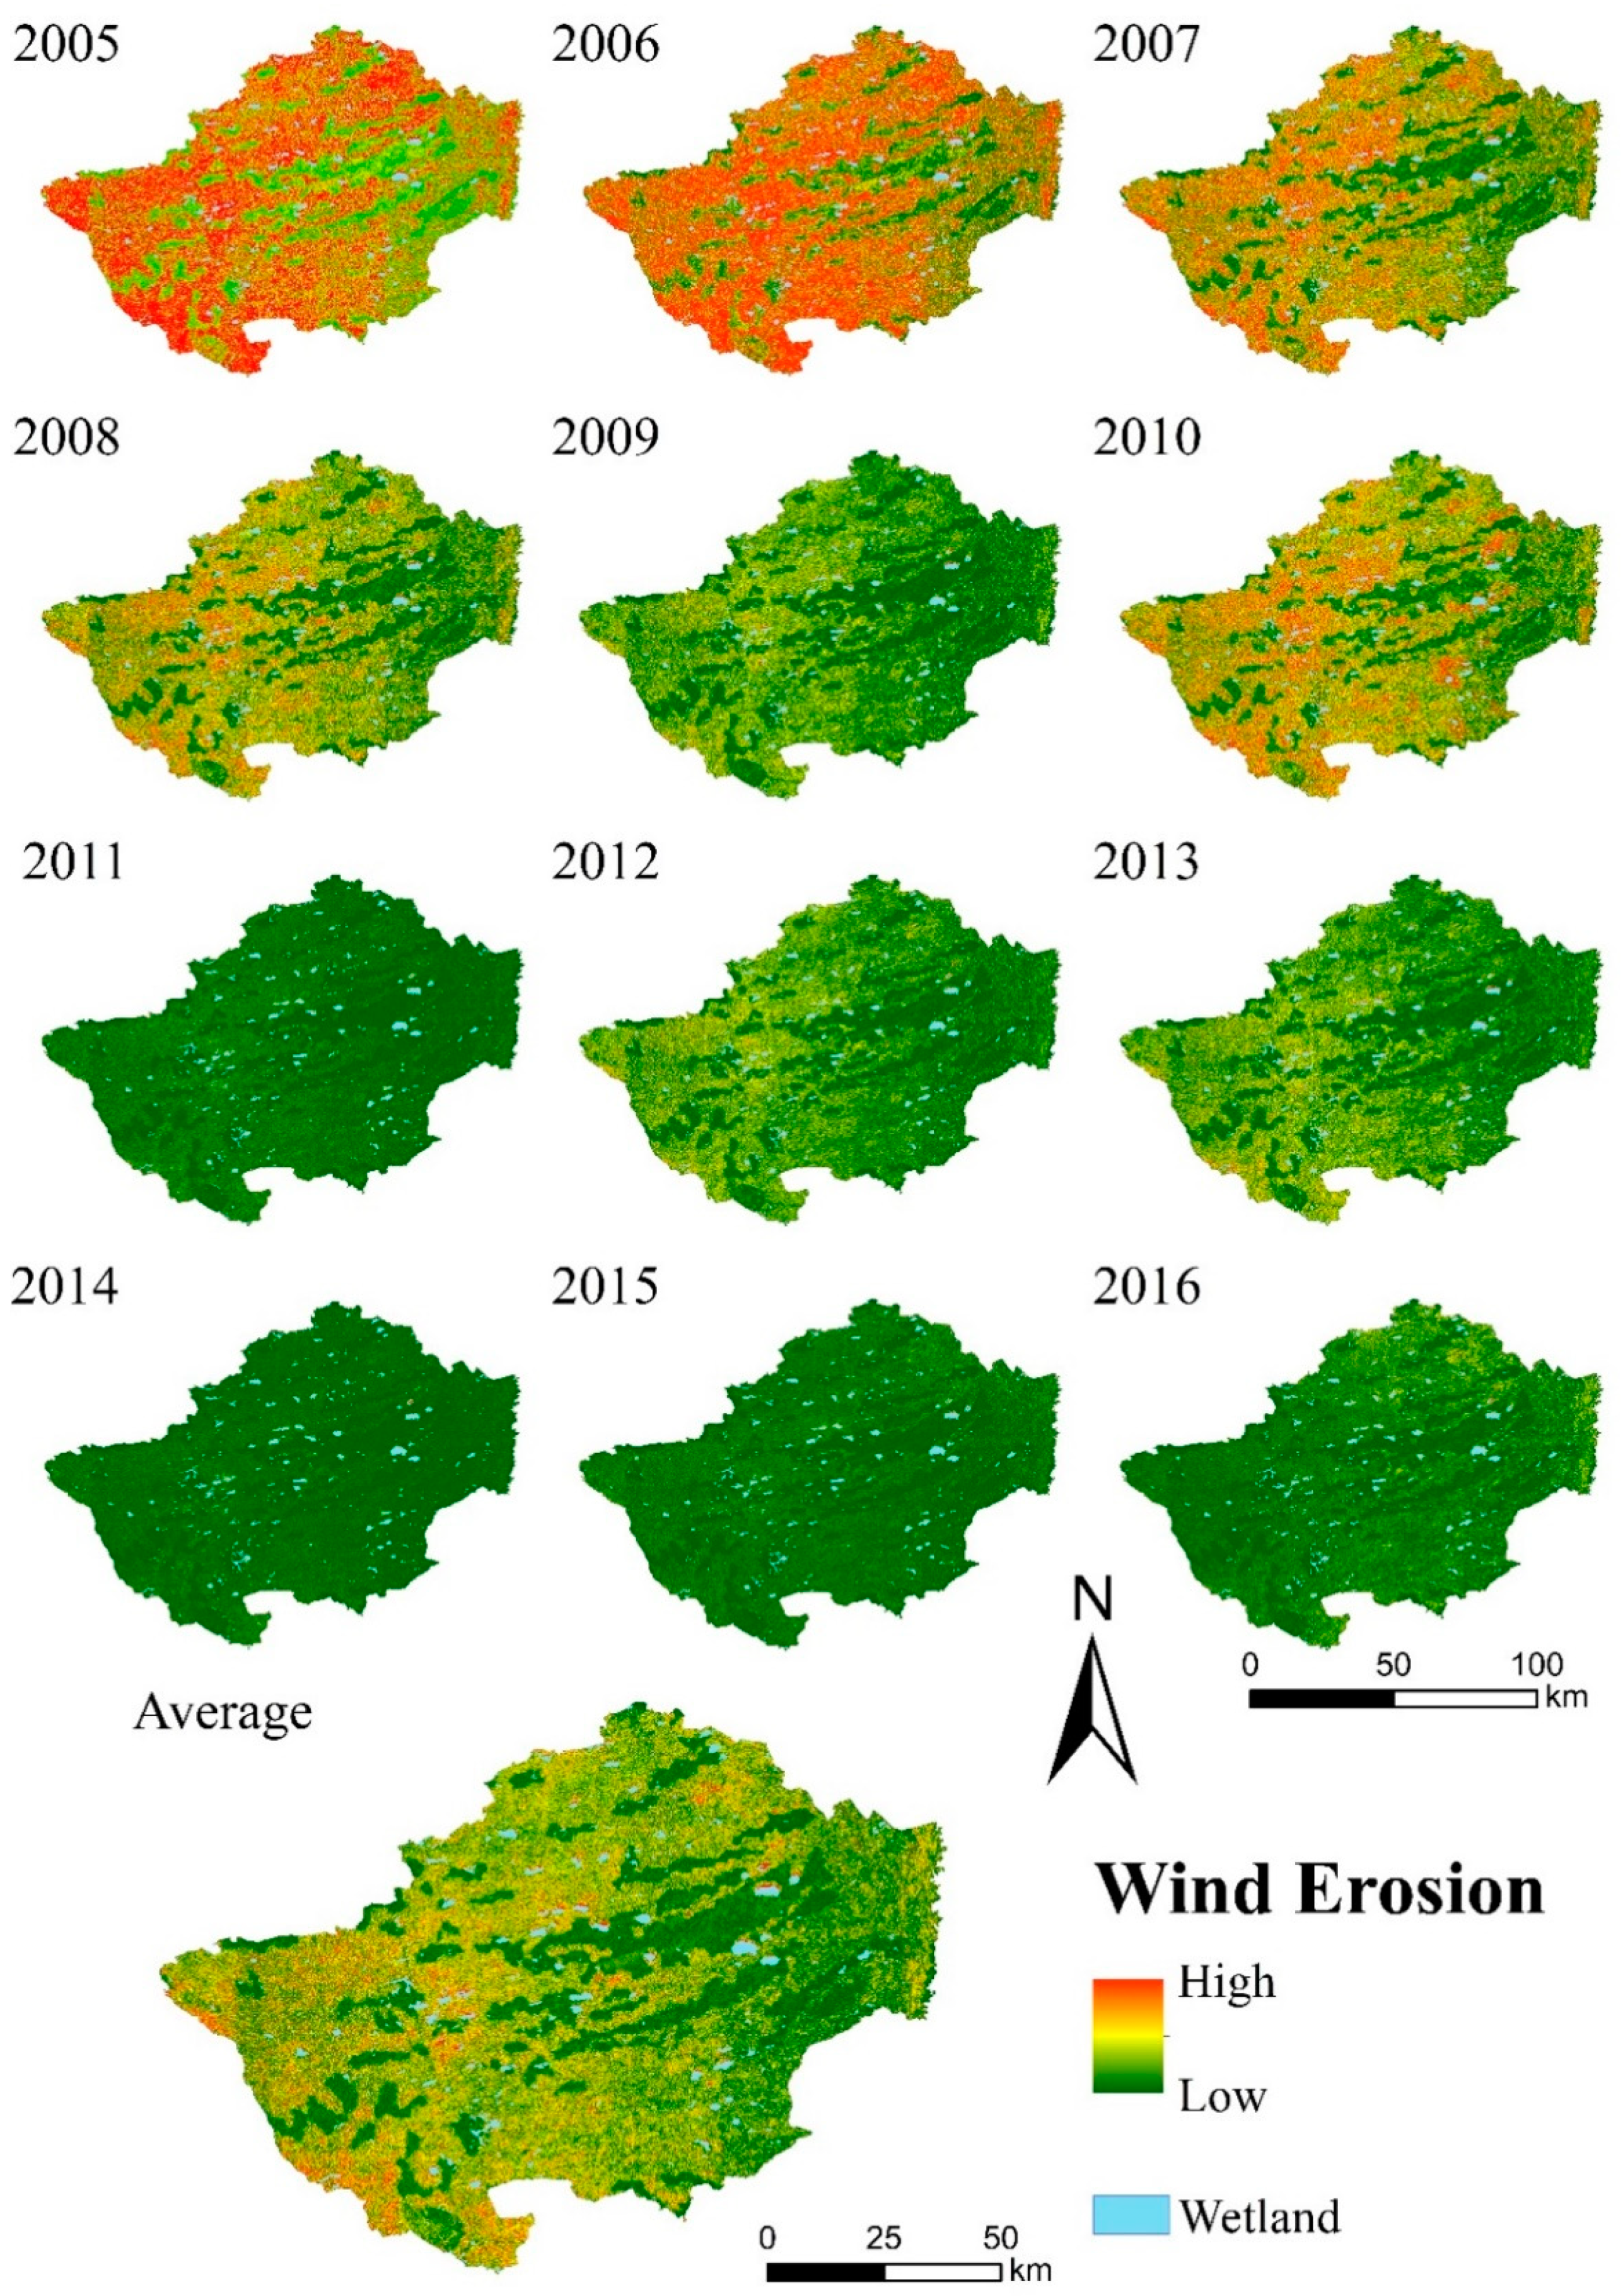
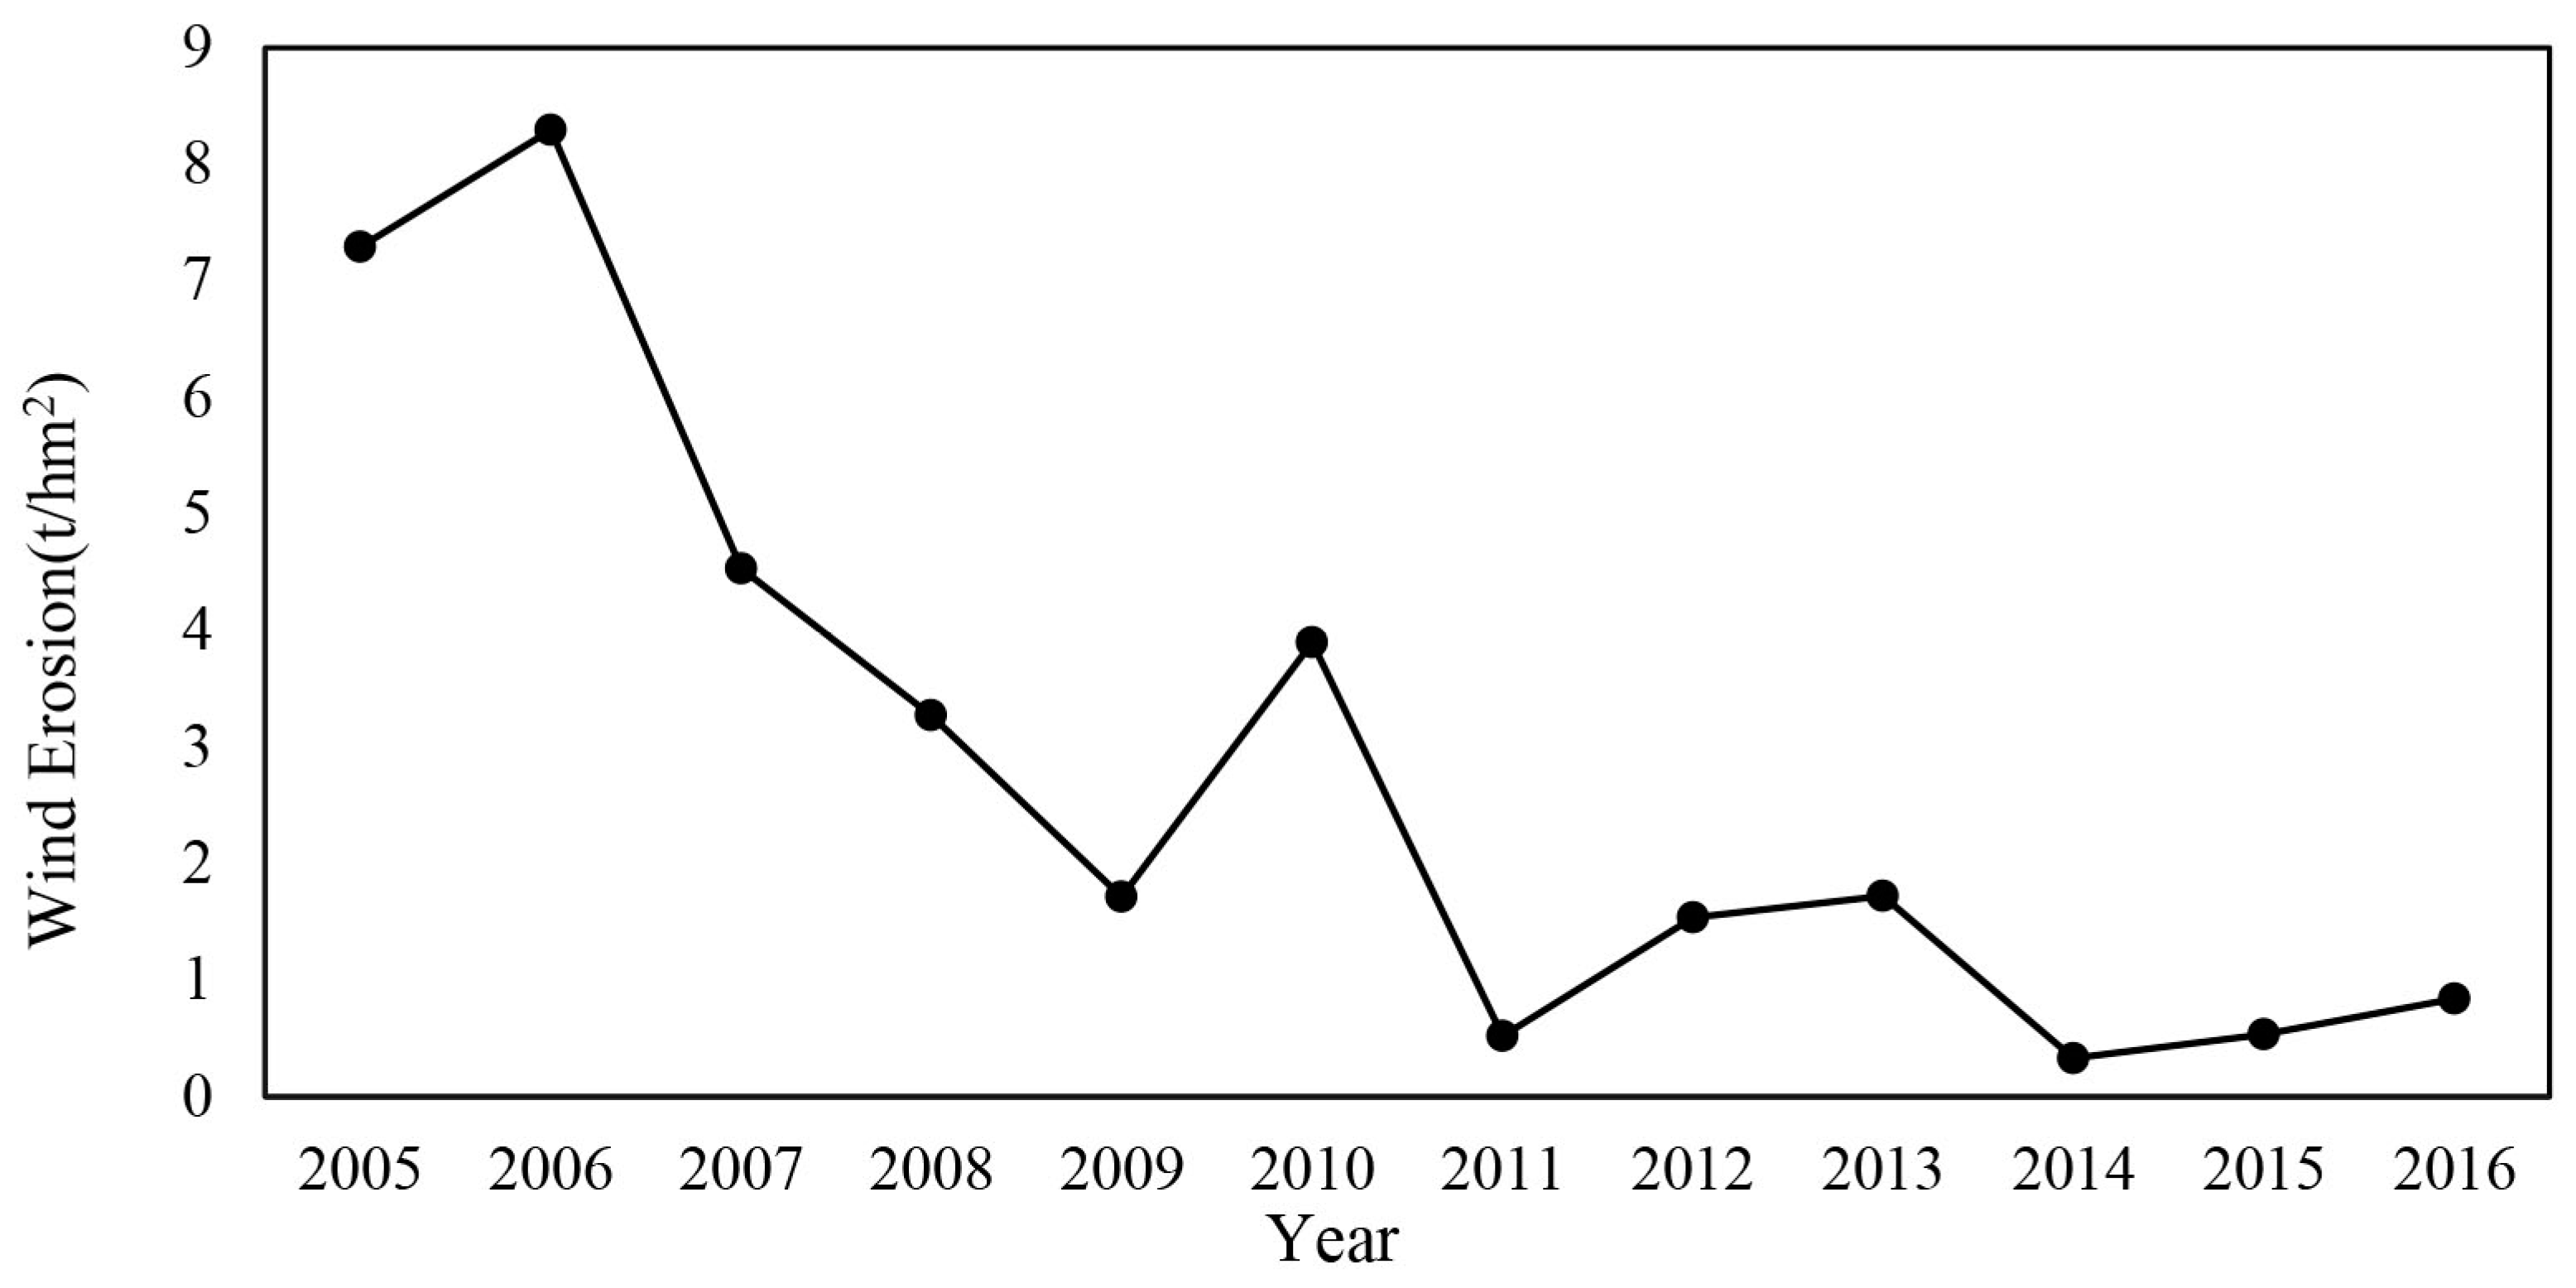
3.1. Temporal–Spatial Changes of Wind Erosion from 2005 to 2016

The RWEQ model simulation results showed that the average wind erosion rate in HLBB from 2005 to 2016 was 2.88 t/hm2·a. The spatial distribution of wind erosion displayed a decreasing pattern from west to east (Figure 3). The highest and lowest annual wind erosion values occurred in 2006 and 2014 and were 8.29 and 0.33 t/hm2·a, respectively. According to the standard of “Classification criteria for soil-erosion modulus” (SL190–2007) in China (Ministry of Water Resources of the People’s Republic of China, 2007), the annual average wind erosion of HLBB from 2005 to 2016 can be divided into five grades, namely, tolerable erosion (<2 t/hm2·a), slight erosion (2–25 t/hm2·a), moderate erosion (25–50 t/hm2·a), severe erosion (50–80 t/hm2·a), and very severe erosion intensities (80–150 t/hm2·a). In HLBB, most areas have tolerable erosion and slight erosion intensities, which account for 49.45% and 50.45% of the total area, respectively.
From 2005 to 2016, the annual average wind erosion clearly decreased in HLBB (Figure 4). The Mann–Kendall test indicated a significant downward trend and a turning point in 2009. The decreasing trend of wind erosion was quite strong before 2009, but slowed down after 2009. The maximum and minimum annual average wind erosion reached 8.29 and 0.33 t/hm2·a in 2006 and 2014, respectively.
The slope analysis results also showed that the wind erosion exhibited a clearly downward trend in the whole region. The declining slope (θ) of the absolute amount of wind erosion modulus was about 0.35 t/hm2·a in HLBB from 2005 to 2016 (Figure 5). From the spatial perspective, the declining slope generally decreased from the west to the east. Its spatial pattern was similar to that of the wind erosion modulus. The relative slope (γ) of wind erosion was −22.24%/a, which excluded the effects of absolute wind erosion modulus on the slope calculation. The value of γ was low in areas with high vegetation coverage. Its spatial distribution exhibited a high correlation with the spatial distribution of vegetation coverage. Figure 6 shows the proportion changes of different wind erosion intensity areas. From 2005 to 2016, the area of tolerable erosion intensity increased, and the area of slight erosion intensity significantly decreased. Moreover, the proportion of other types of wind erosion was less than 1% of the total area except for 2005 and 2006. The wind erosion modulus was evidently reduced from 2005 to 2016.

3.2. Contribution of Driving Factors to the Changes of Wind Erosion

In the RWEQ model, K′, SCF, and EF are constants, whereas WF and C are variables. To reveal the correlation between the spatial distribution of wind erosion, vegetation, and meteorological factors, we represented C by the index of vegetation coverage factor (VCF). In addition, we also divided WF into three indexes, namely wind speed factors (WSF), soil moisture factors (SMF), and air density factors (ADF).
The results showed that the decrease in WSF and the increase in VCF played key roles in wind erosion reduction. The contributions from the other two factors were relatively small. Firstly, the average contribution of WSF in HLBB was 47.40%, which decreased from west to east. This spatial pattern was similar to the trend of wind erosion. Secondly, the average contribution of VCF was 45.93%. The spatial distribution exhibited a strong correlation with vegetation coverage. Thirdly, the average contribution of SMF was about 5.43%. The high contribution was mainly distributed in the eastern part of HLBB. Finally, the average contribution of ADF was 0.96%, which increased from west to east (Figure 7).
To further identify the dominant factors of wind erosion changes in different regions, we compared the contributions of each factor at a grid scale. The results illustrated that wind erosion is mainly dominated by WSF and VCF collectively. However, the dominant factors vary in different regions. We then subtracted the contributions from WSF and VCF at a grid scale and determined the dominant factors by the difference. In the southwestern region, which accounts for 49.87% of HLBB, the WSF was the dominant factor contributing to the decline of wind erosion. The decline of wind erosion in the northeast region, which accounts for 50.13% of the study area, was mainly caused by the VCF (Figure 8).

3.3. Correlation Between the Wind-Related Characteristics and Wind Erosion

Wind speed is widely regarded as the driving force of wind erosion [21]. Our results of the contribution analysis also confirmed that the decline of WSF was one of the main contributing factors to the declining trend of wind erosion in HLBB. The change in WSF exhibited critical impacts on the wind erosion modulus. Thus, it is necessary to explore the relationship between wind-related characteristics and wind erosion. We selected three indicators to analyze, namely the average wind speed (AWS), the number of days when the wind speed exceeded the threshold of the sand detachment wind speed (NWSE), and the average wind speed exceeding the threshold of sand detachment wind speed (AWSE). At the annual scale, all the indicators exhibited clear downward trends from 2005 to 2016 (Figure 9). The annual AWS decreased 9.89% from 2006 to 2015, and the annual NWSE decreased 45.20%. At the same time, the annual AWSE dropped by 46.35%, which was the largest decline among the three.
However, the annual indicators could not reflect the subtle temporal relationship between wind speed and wind erosion since most wind erosion occurred in spring in HLBB. Thus, the correlations between the wind erosion modulus and the semi-monthly AWS, AWSE, and NWSE were calculated through the Spearman’s rank correlation coefficients (SRCC). The results showed that the SRCC between the wind erosion modulus and the semi-monthly AWSE of 0.926 was greater than the SRCC between the wind erosion modulus and semi-monthly AWS of 0.821. Furthermore, the SRCC between the semi-monthly NWSE and wind erosion modulus reached 0.920, which was similar to the SRCC of semi-monthly AWSE and higher than the SRCC of semi-monthly AWS. The Spearman rank correlation coefficients of wind erosion modulus and different wind-related indicators suggested that people should pay more attention to the intensity and frequency of windy weather rather than annual AWS in wind erosion simulation studies. Using AWSE and NWSE as the wind indicators might be able to explain better the effects of wind on the wind erosion modulus.

3.4. Relationship Between Vegetation Coverage and Wind Erosion

Vegetation coverage is widely considered to be effective in mitigating wind erosion [52]. High vegetation coverage can protect the soil from wind erosion. According to the contribution assessment results, the increment of vegetation coverage is another main contributor to wind erosion reduction. In the past 12 years, approximately 78.06% of HLBB experienced increased vegetation coverage, which mainly occurred in the western region (Figure 10). However, the increase in vegetation cannot reduce wind erosion indefinitely. When vegetation coverage exceeds 60%, any further increase in vegetation coverage will no longer result in wind erosion reduction [51]. Moreover, since vegetation has different morphologies at different wind speeds [53], the effects of vegetation on wind erosion mitigation might vary accordingly. Therefore, the relationship between vegetation coverage and wind erosion modulus was analyzed at different wind speeds.
The constraint line method suggested that the increase in vegetation coverage contributed to the slowdown of wind erosion in HLBB. A maximum slowing effect of vegetation on wind erosion was also present. When the vegetation coverage reached approximately 40% and the semi-monthly AWS was greater than 3 m/s, further increase in vegetation would not lead to obvious declines in wind erosion. However, the constraint line changed at different wind speeds. When the semi-monthly AWS was between 2 and 3 m/s, the threshold of vegetation coverage was significantly reduced to 20%. When the semi-monthly AWS was less than 2 m/s, there was no significant threshold of vegetation coverage since the wind erosion was already low (Figure 11). The constraint line moved from top left to bottom right with decreasing semi-monthly AWS, and the threshold of vegetation coverage also decreased.
In summary, the increase in vegetation slows down wind erosion within a certain threshold. Meanwhile, the same vegetation coverage has different effects on wind erosion at different wind speeds. Approximately 25% of vegetation coverage should be enough to resist erosion caused by low-wind speed (less than 2 m/s). However, once the wind speed increases, this coverage of vegetation is insufficient. Vegetation coverage should reach approximately 40% to achieve similar protective effectiveness at higher wind speeds.

4. Discussion

4.1. Influence of Natural Driving Factors on the Wind Erosion Modulus

Previous research has generally studied wind erosion and its correlations between different driving factors based on annual statistics [14,24]. However, the results of this study suggest that wind erosion has a concentrated distribution during the year, which cannot be explained by interannual statistical results. The occurrence of wind erosion should be regarded as an event rather than a long-term state. The wind erosion modulus measures long-term regional wind erosion conditions. However, the wind erosion modulus of HLBB exhibited temporal heterogeneity within a year. The period of high wind erosion mainly concentrated in spring, which coincided with the period of the windy season. The proportion of the wind erosion modulus in spring accounted for more than 81% of the total annual erosion every year from 2005 to 2016 except for 2014. The highest value reached 98.33% in 2012. Therefore, it is necessary to explore the relationship between wind erosion events and its driving factors on a higher time-resolution to reveal the concealed relationships in the interannual analysis. In the following sections, the temporal distributions of wind erosion and driving factors within a year were analyzed on a semi-monthly scale. The temporal distributions were the same as those in the period during which we calculated the wind erosion modulus.

4.1.1. Mismatch Between Wind Speed and Vegetation Coverage

Wind speed and vegetation coverage are the most important factors affecting wind erosion. The reduction of wind speed and increment of vegetation coverage exhibited positive effects on annual wind erosion reduction [22]. However, there is a temporal mismatch between wind speed and vegetation coverage within a year. The windy period in HLBB is from mid-February to mid-June. Wind speed just starts to increase from spring. Meanwhile, vegetation growth has not yet occurred (Figure 12). Wind speed in the windy season is high enough to detach the sand particles, but low vegetation coverage can only provide minimal protection for bare sand. In the windy periods, the semi-monthly NWSE accounts for 66.81% of the whole year. The semi-monthly AWSE is higher than 95.16% of the annual AWSE. In spring, when the low vegetation coverage in HLBB is not able to resist erosion, the frequently occurring high wind speed results in a significant increase in wind erosion. Under the dual influences from wind and vegetation, the wind erosion during this period is very severe. In mid-June, local plants begin their growth. However, the wind speed also begins to decline at this time, which will reduce the wind erosion. Therefore, even after the vegetation cover is fully established, the plants will not fully exert their slowing effects on wind erosion. The temporal mismatch between the occurrences of high wind speed and high vegetation coverage challenges regional wind erosion control.

4.1.2. Relationships Between Precipitation, Temperature, and Wind Erosion

Precipitation and temperature mainly affect wind erosion by influencing soil moisture and vegetation growth. Precipitation increases soil moisture, which makes sand detachment more difficult. In contrast, an increase in temperature increases evapotranspiration and reduces soil moisture. In HLBB, precipitation is mainly concentrated from the end of April to the end of August. During the rainy season, soil moisture is at a high level even when the air temperature is also elevated. After mid-September, the precipitation drops sharply. Consequently, the soil moisture is kept at a low level until the next rainy season. The soil then becomes dry and breaks easily by wind during the winter and spring, which exacerbates the wind erosion situation in spring.
More importantly, vegetation growth is often determined by the rise in temperature and precipitation with a certain hysteresis effect at the local scale [54]. By the end of May, the vegetation coverage increases after the increase in precipitation and temperature at the end of April (Figure 12). As a result, vegetation coverage is not able to effectively slow down wind erosion before June.

4.1.3. Targeted Wind Erosion Prevention Strategy

The results show that the increase in vegetation coverage is one of the most important driving forces of the wind erosion decline. Although it is difficult to greatly increase vegetation coverage in spring due to the low temperature and precipitation in this season, the vegetation coverage can survive in the spring of HLBB. The increase in vegetation coverage was mainly caused by large-scale artificial afforestation since there was no significant change in local temperature and precipitation during the period from 2005 to 2016. In order to alleviate land degradation and soil losses caused by wind erosion, the local government launched a series of afforestation projects, such as the “5820 Forestry Ecological Project” in 1999, which built concentrated and contiguous forest within five years, and eventually afforested 133,333 hectares of forest and 66,666 hectares of grassland. Recently, the “Double Ten Million Mu Project” (1 mu equals 0.0667 hectares), which plans to effectively manage 10 million mu of forest and 10 million mu of grassland in seven years, has been implemented. The purposes of this project are to reduce soil wind erosion and land degradation as well as improve the quality of the local environment by gradually restoring the sparse forest ecosystems. These afforestation projects play a positive role in the decline of wind erosion in HLBB. However, the wind erosion problem has not yet been fully managed. For example, vegetation restoration in areas under severe desertification is still difficult, which makes spring sandstorms still frequent.
From the above discussion, we can find the key factor in wind erosion control in HLBB, namely, the domination of the high wind erosion period in spring, which accounts for more than 80% of annual wind erosion. The results of this study provide two recommendations for wind erosion control. Firstly, vegetation coverage must reach the minimum thresholds as soon as possible to effectively reduce wind erosion. Secondly, at high wind speeds, vegetation coverage must be further increased to reach the corresponding threshold. Therefore, the ideal situation is the presence of enough vegetation coverage in the windy season. However, in reality, the mismatch between wind speed, precipitation, and temperature impeded the difficulties of wind erosion control in HLBB. If people can solve this mismatch, wind erosion in spring should be greatly alleviated. Given the insufficient precipitation and low temperature, increasing vegetation coverage via planting more trees and grasses might not be the most cost-effective method.
Some management techniques, such as maintaining the residues on farmlands in winter, creating windbreaks, and having drought-tolerant bush covers, can be considered as erosion control methods during the high wind erosion season. These measures can alleviative wind erosion in spring through improving the surface roughness, reducing the wind speed on the surface, and capturing airborne dust, which hinders the process of sand transmission [55]. However, HLBB is located in a semi-arid area with limited water, which makes the survival rate of existing windbreak plants low [56,57,58,59,60]. Therefore, strategies such as the cultivation of optimal windbreak and shrub species, and careful selection of planting locations are needed to improve the mitigating effects of windbreaks.

4.2. Limitations

The RWEQ model is an empirical model based on various empirical parameters. These parameters are obtained from the statistical analyses of multiple data [37]. Given that the RWEQ model was originally designed at a field scale, some problems might be raised during regional-scale wind erosion simulation, such as the adjustment of empirical parameters and the determination of the wind speed threshold of sand detachment. A uniform parameter setting might also cause simulation result deviations due to the spatial heterogeneity of the natural conditions. Therefore, applying the RWEQ model to simulate the wind erosion modulus in other regions might require adjustments of the model [61].
The RWEQ model has been widely used in arid regions of northern China, especially in Inner Mongolia. Some studies used the measured data to verify the model simulation accuracy. The results showed that the RWEQ model exhibited good adaptability in China [22,62]. In the setting of wind speed parameters, we used the method of TDR (Time Domain Reflectometry) to determine the soil water content, which provided the basis to determining the local wind speed threshold. We also used the hourly wind speed with higher time resolution as the data source for the wind factor calculation, which is more consistent with the original RWEQ model. Compared with the results obtained from other studies [14,19,22], the wind erosion simulation results of this study are consistent with the modulus and trends of wind erosion reported there. However, there are also some limitations that need to be improved in future studies, for example, revised K′ and C parameters based on different land cover types. The Cs-137 tracing technique can be used to verify the wind erosion simulation results in the study area.

5. Conclusions

Based on the RWEQ model, we simulated the wind erosion modulus and mapped the temporal and spatial variations of wind erosion in HLBB from 2005 to 2016. Furthermore, the contribution analysis method was applied to analyze the dominant driving factors of wind erosion. The main conclusions are as follows:
(1)
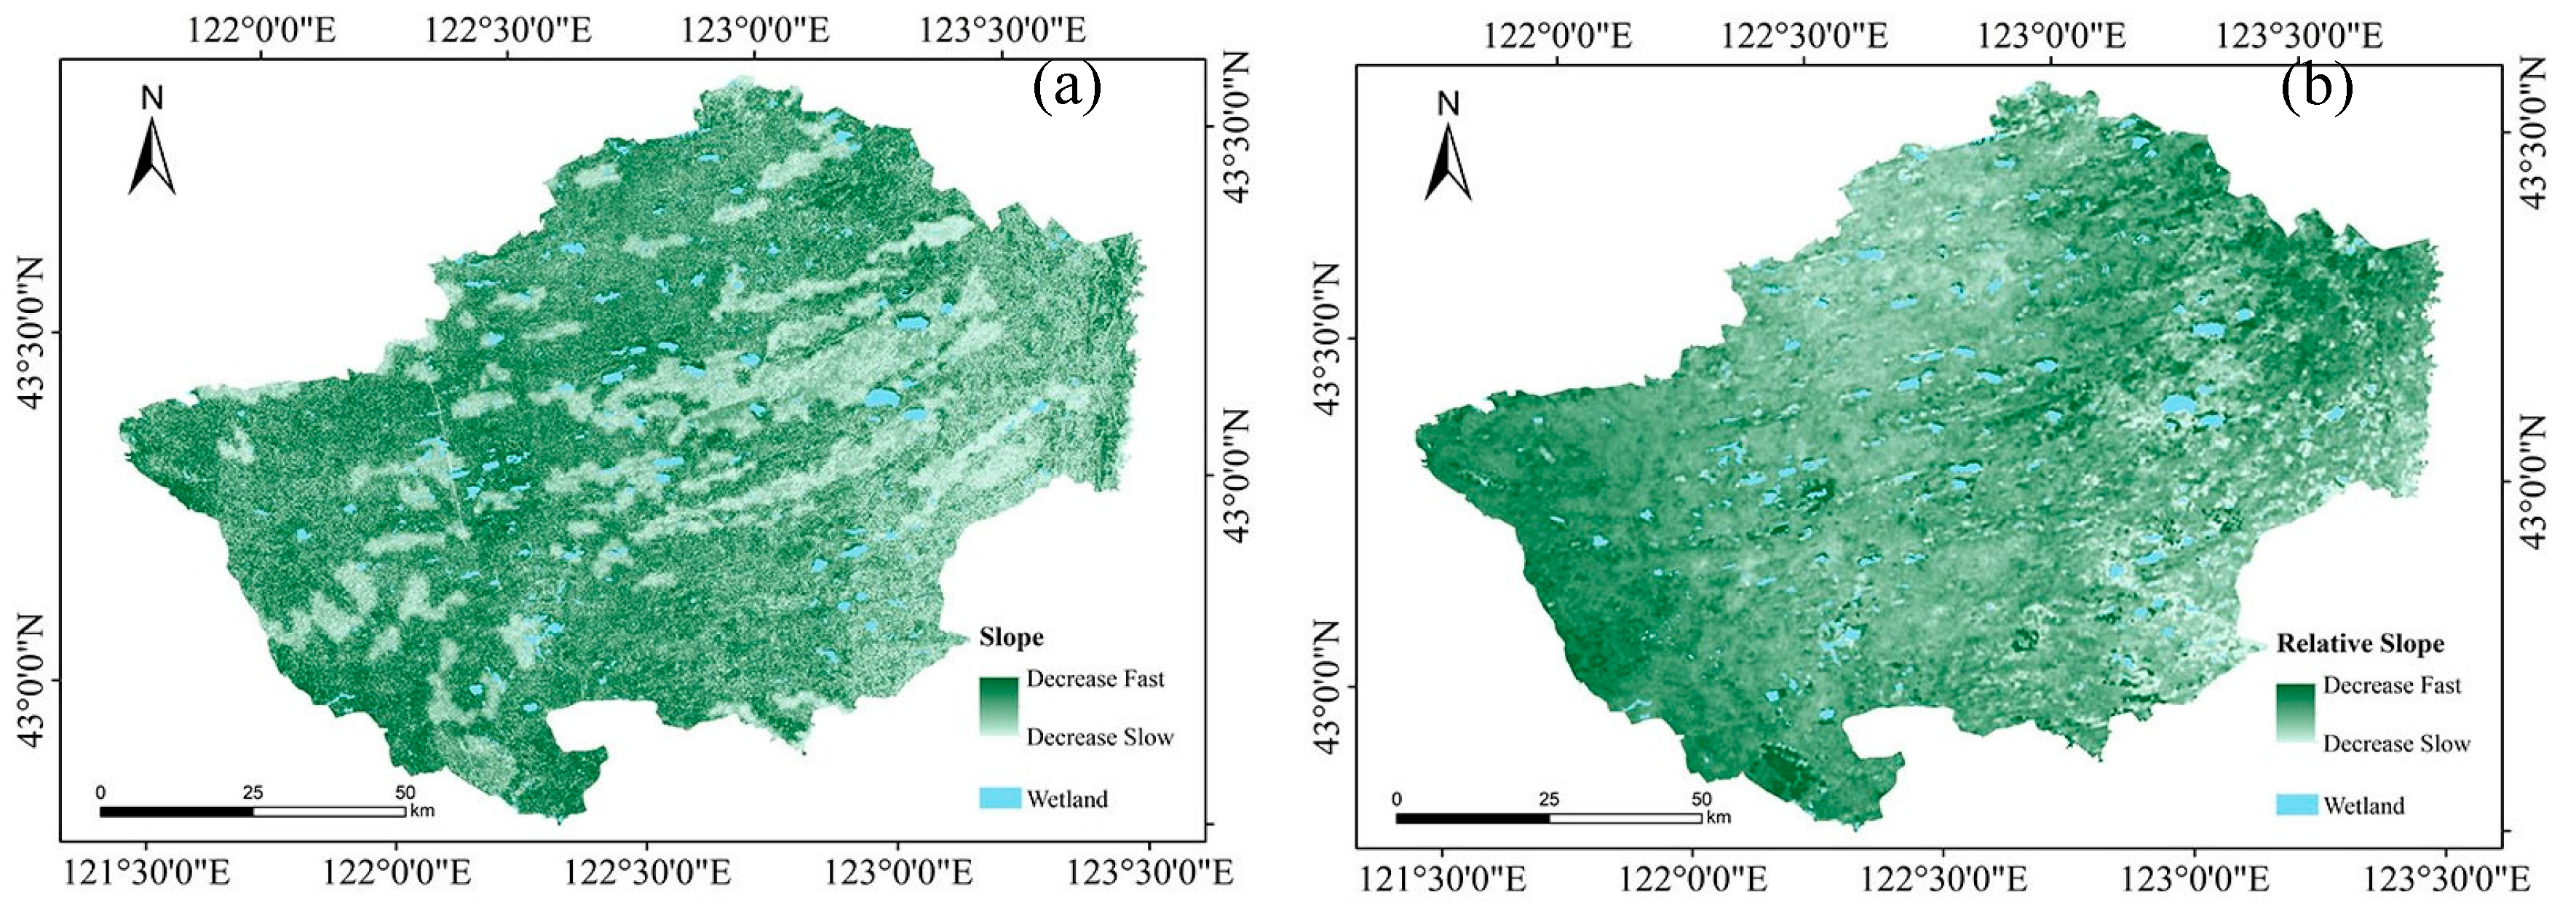
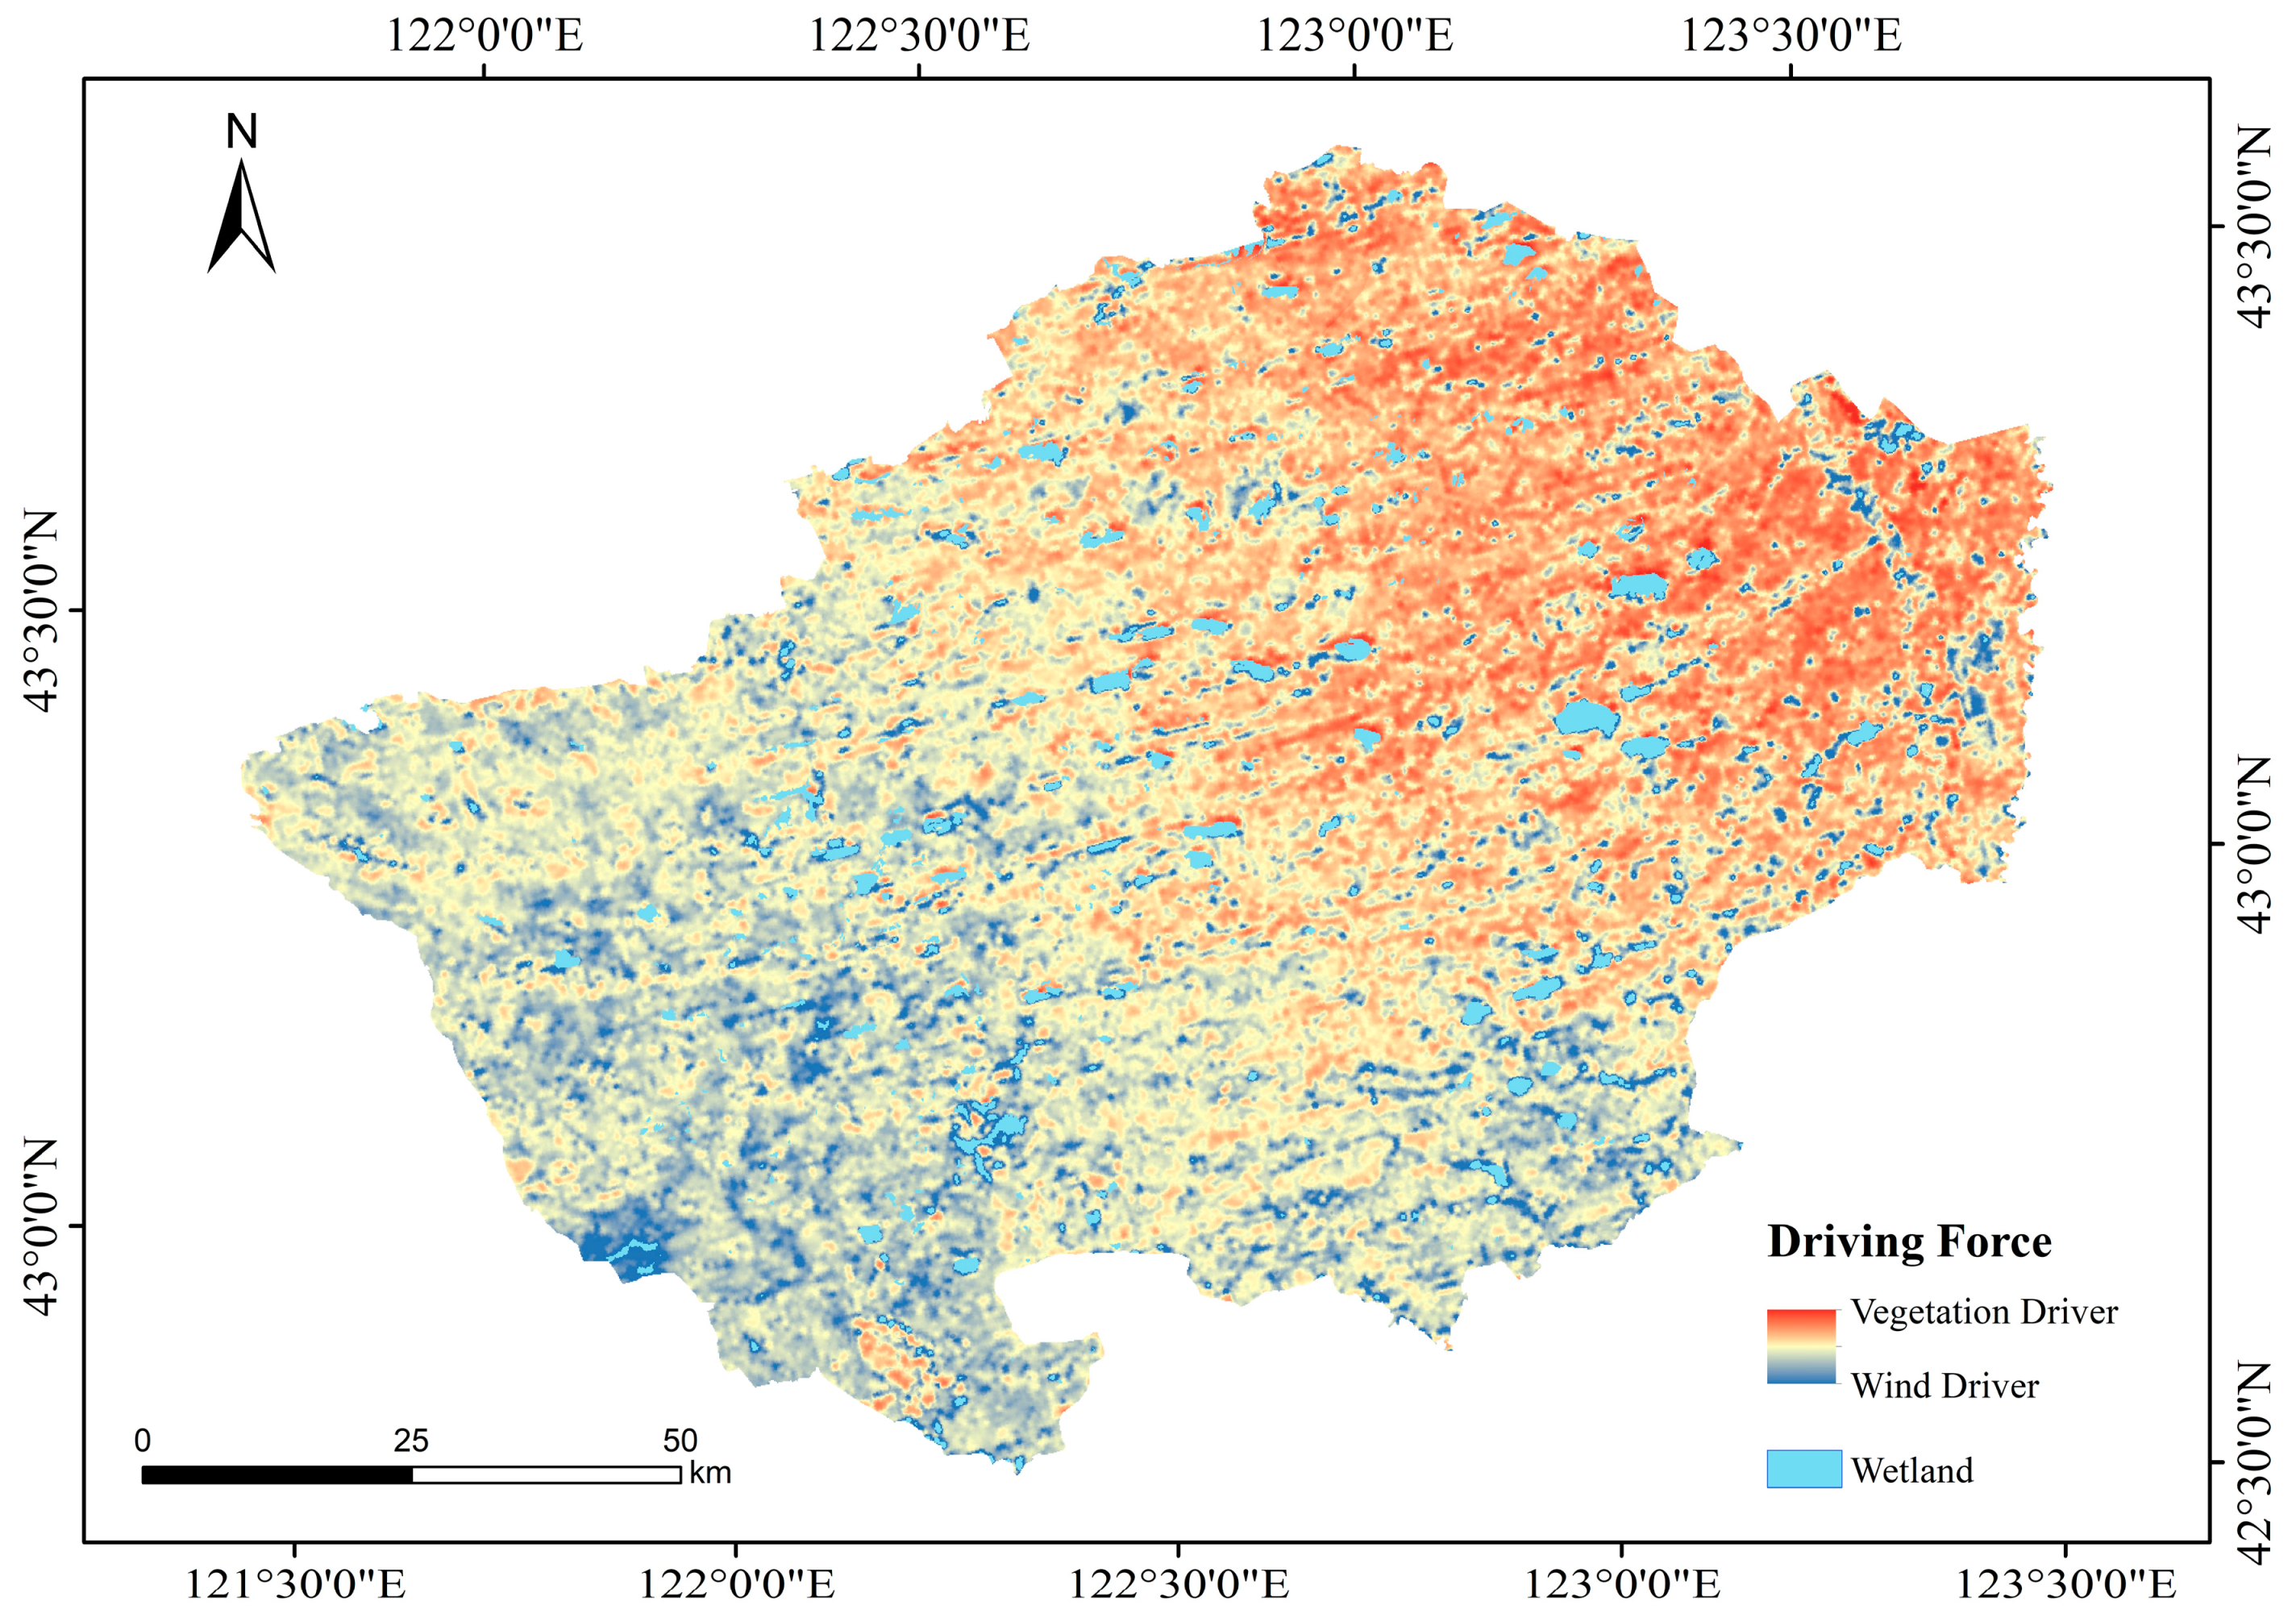
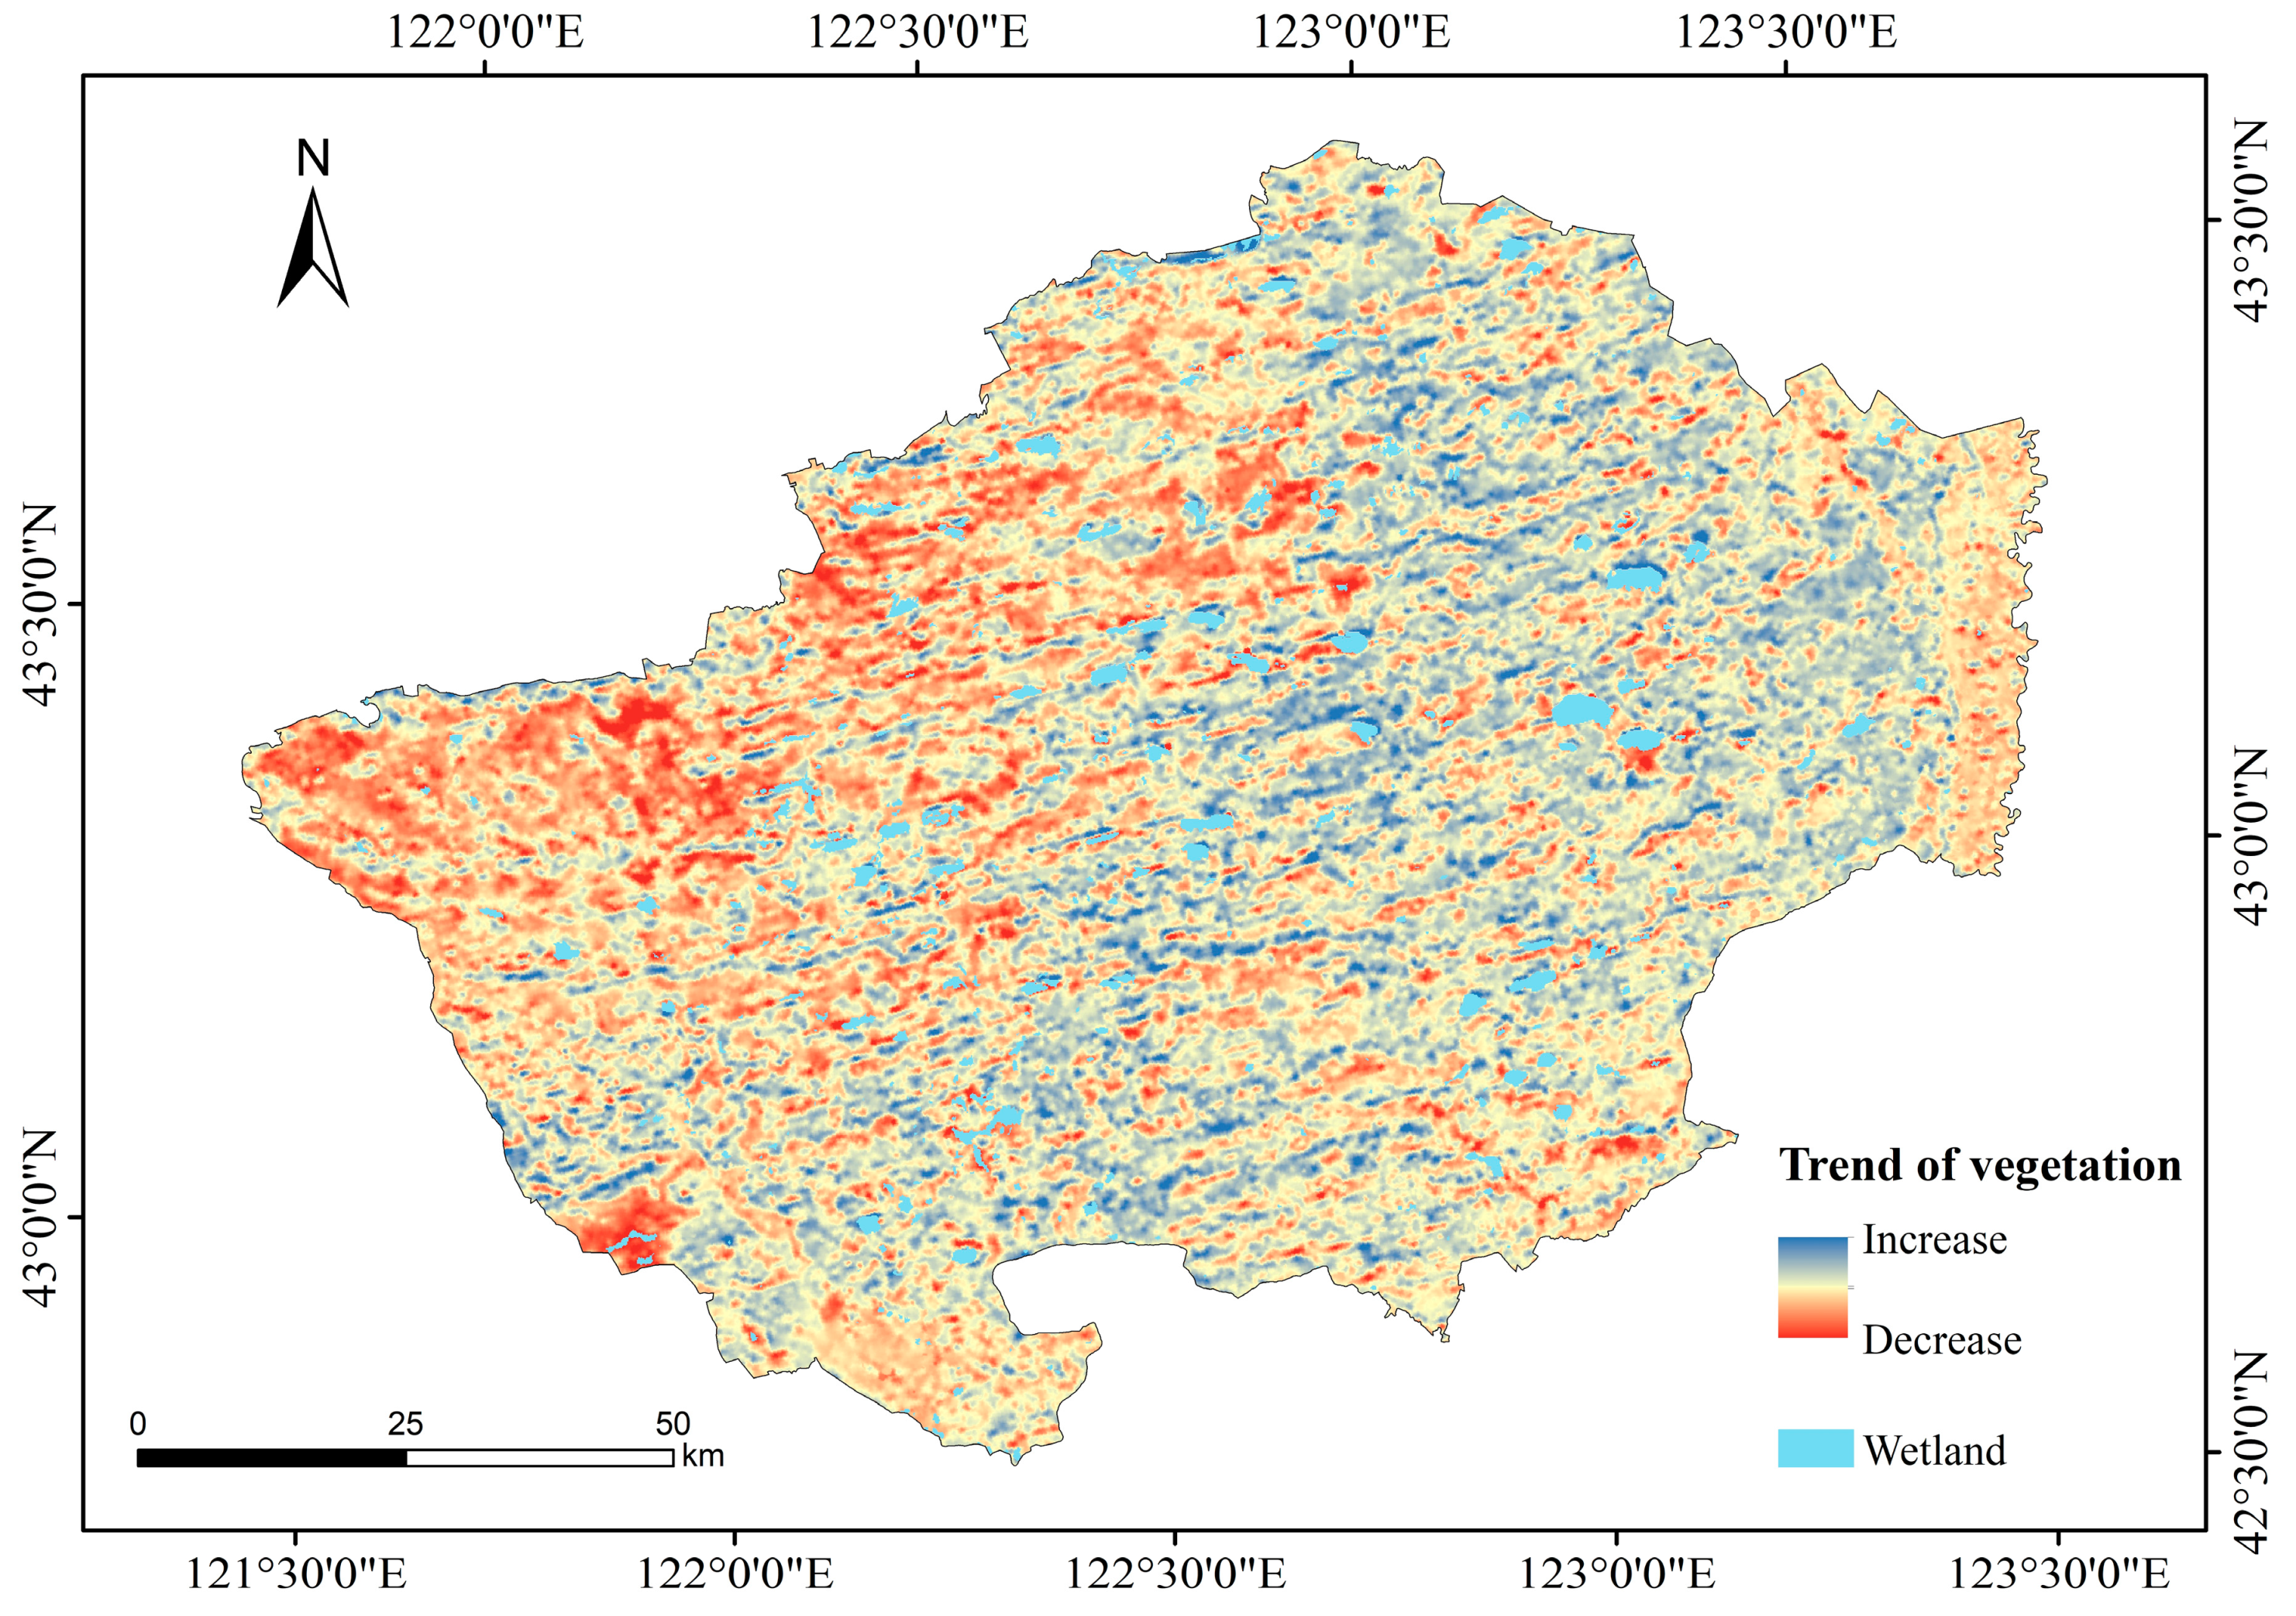
The average modulus of wind erosion was 2.88 t/hm2·a in HLBB from 2005 to 2016, which generally increased from west to east. The wind erosion modulus significantly dropped by 0.35 t/hm2·a from 2005 to 2016. The spatial pattern of the relative decline rate was similar to the distribution of vegetation. The main causes for the wind erosion reduction in HLBB were the decrease in wind speed and the increase in vegetation coverage. The decline in wind erosion in the southeastern region, which accounts for 49.87% of the study area, was mainly attributed to wind speed reduction. The decline in wind erosion in the northeast region, which accounts for 50.13% of the study area, was mainly due to the increase in vegetation coverage.
(2)
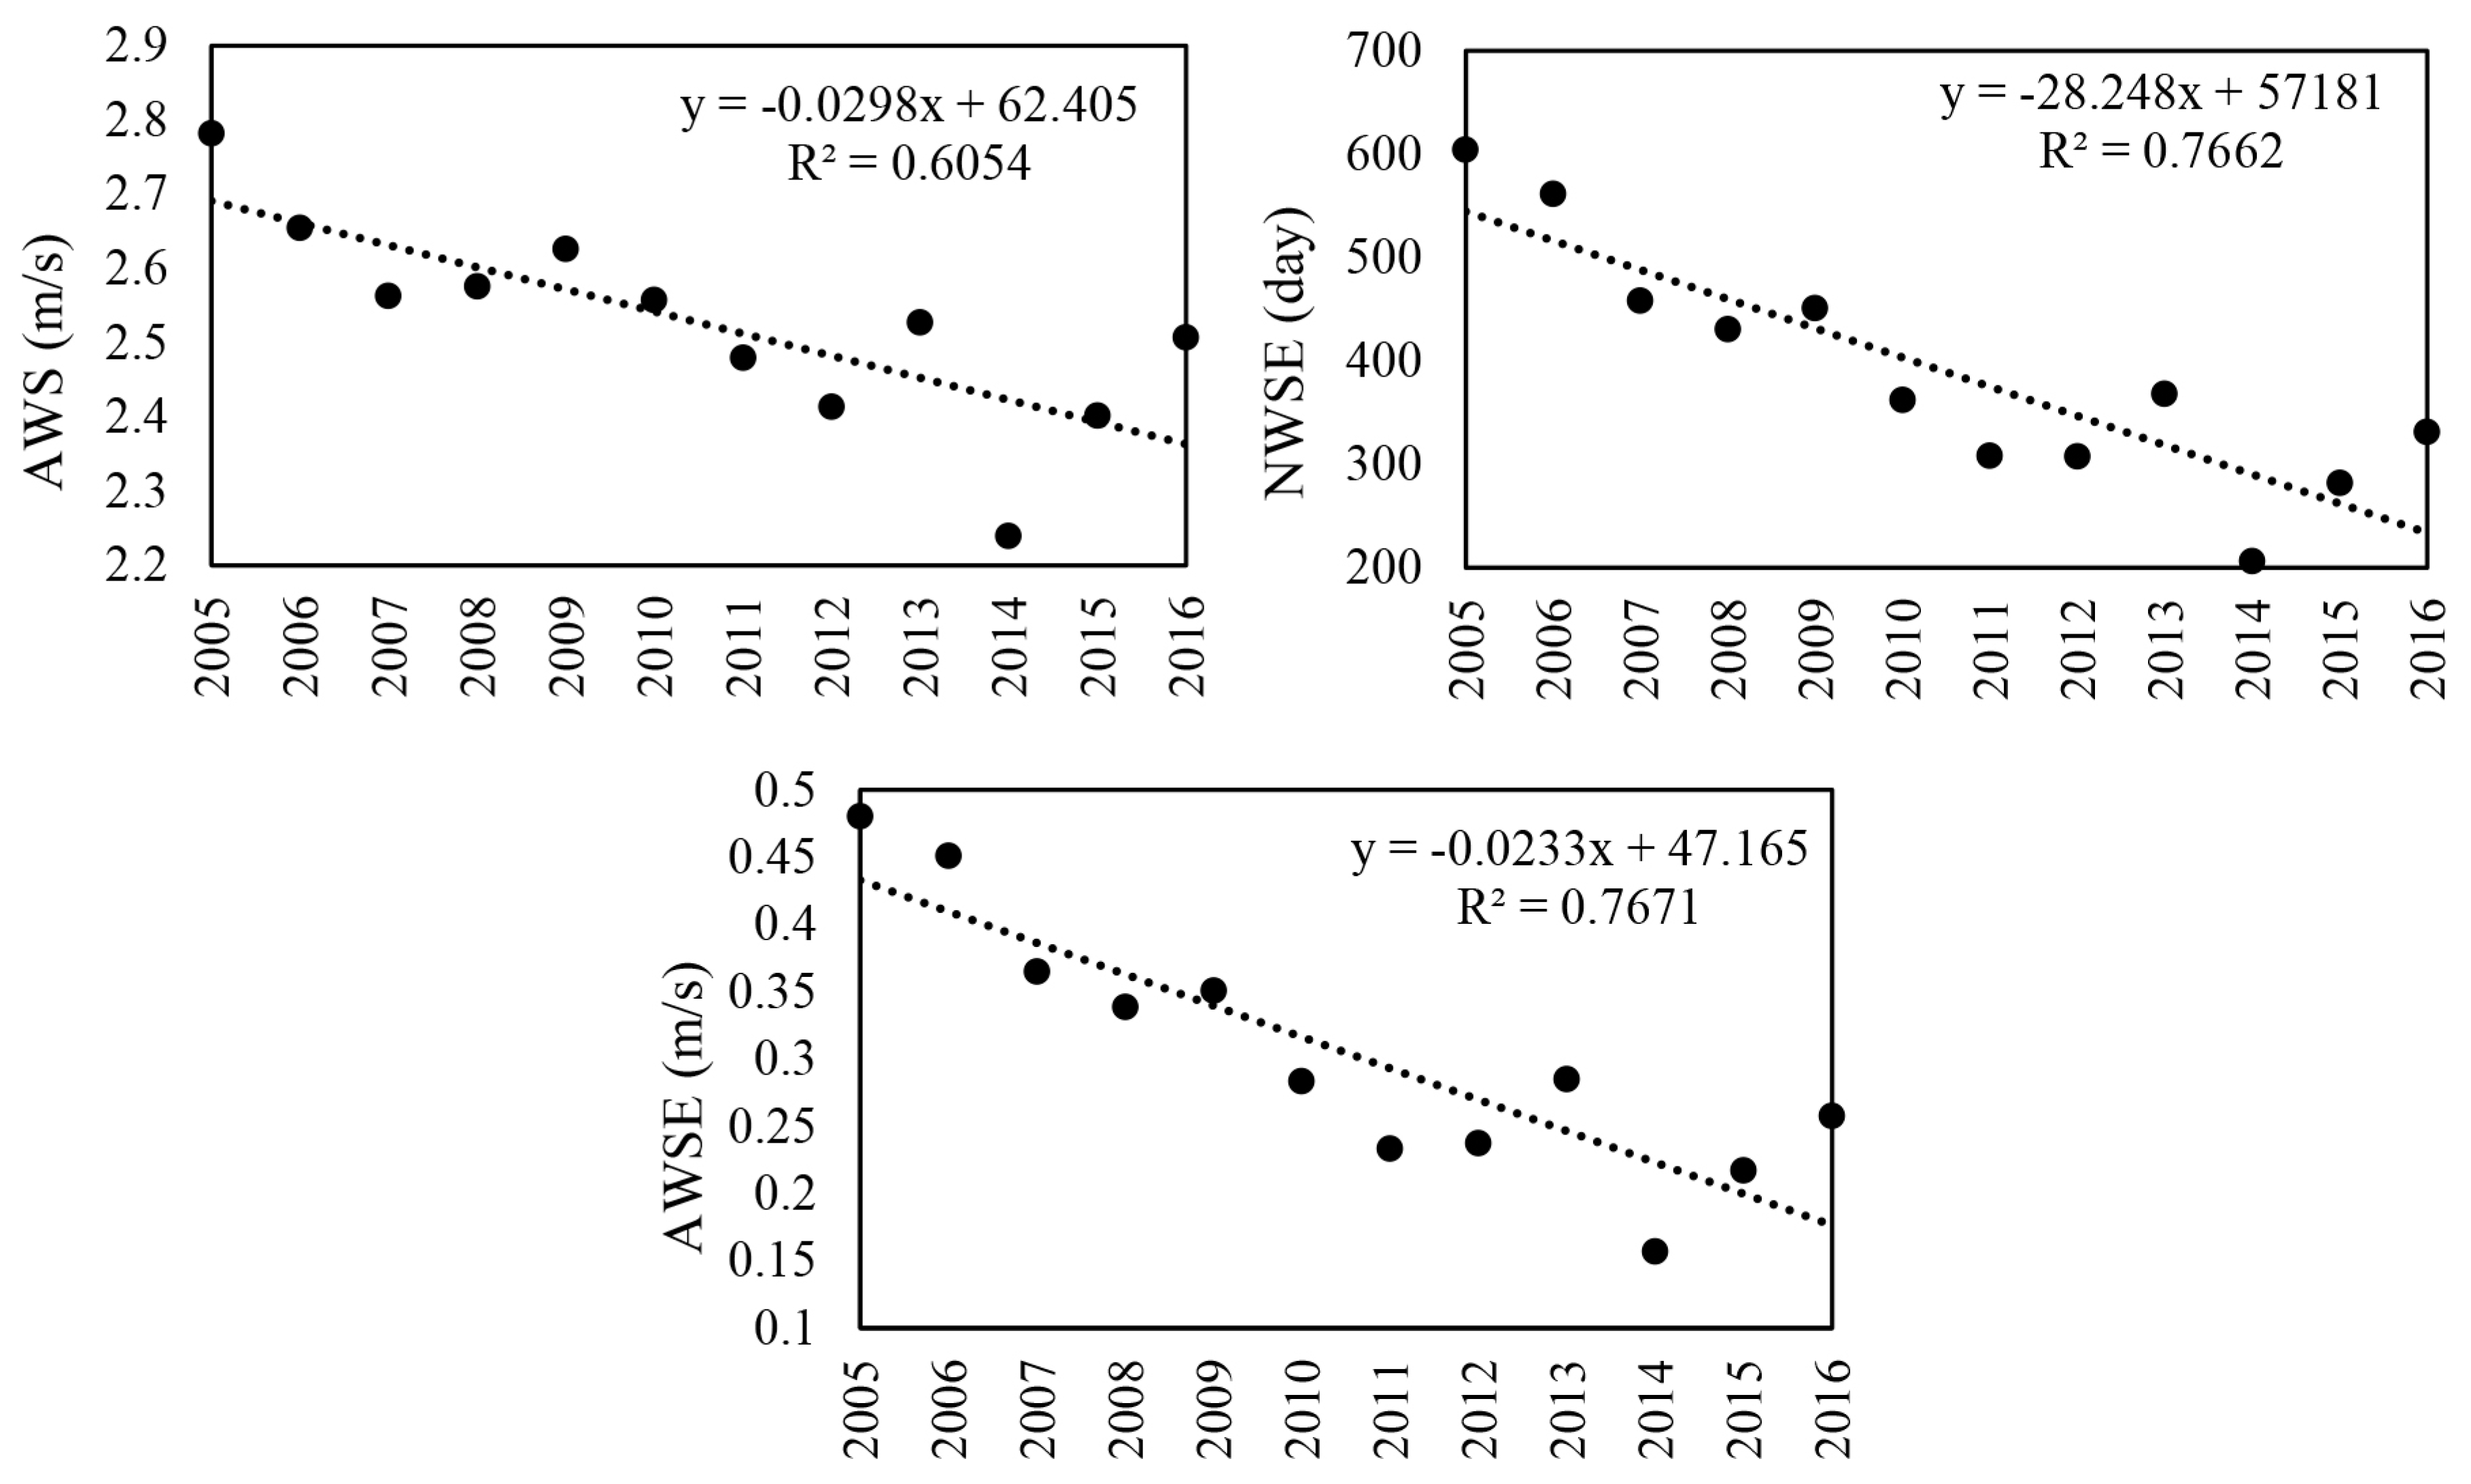
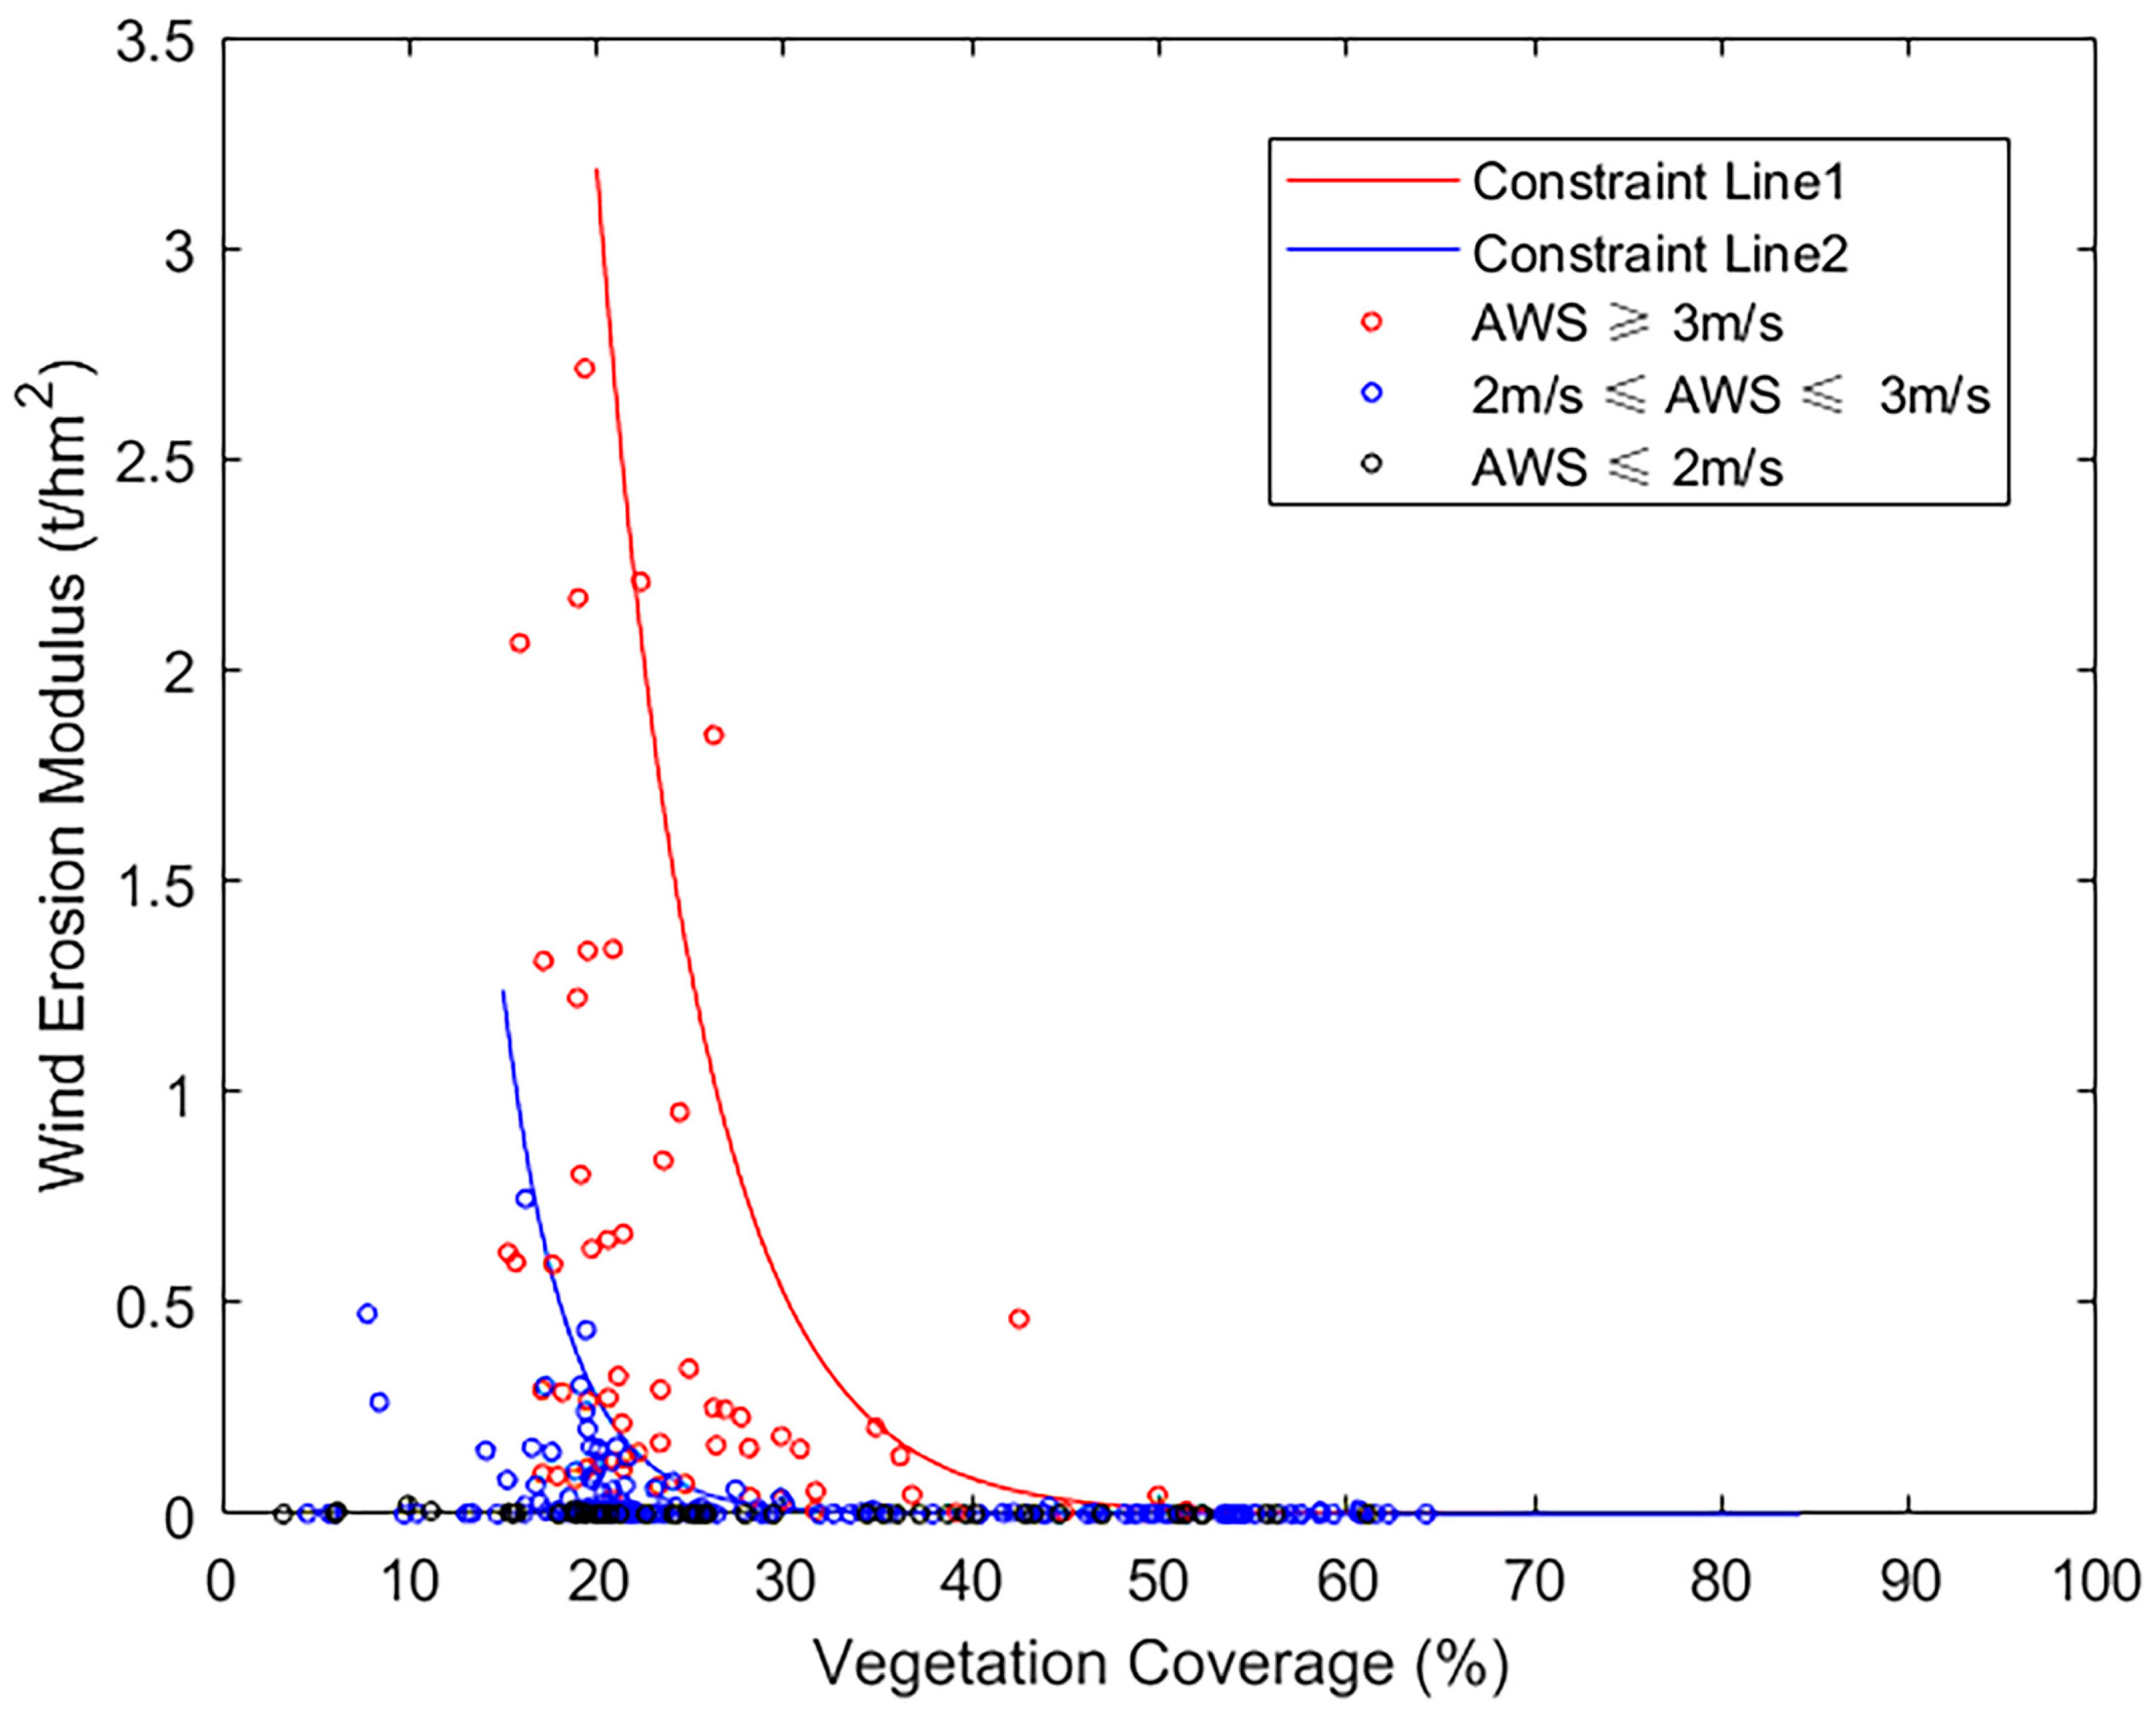
Wind speed exhibited a significant correlation with the wind erosion modulus. However, the correlation between the annual AWSE and NWSE, and the wind erosion modulus was higher than that between the annual AWS and the wind erosion modulus. Vegetation coverage had different thresholds for effective wind erosion mitigation at different wind speeds. The threshold of vegetation coverage was approximately 40% when the semi-monthly AWS was greater than 3 m/s. The threshold became approximately 20% when the semi-monthly AWS was between 2 m/s and 3 m/s.
(3)
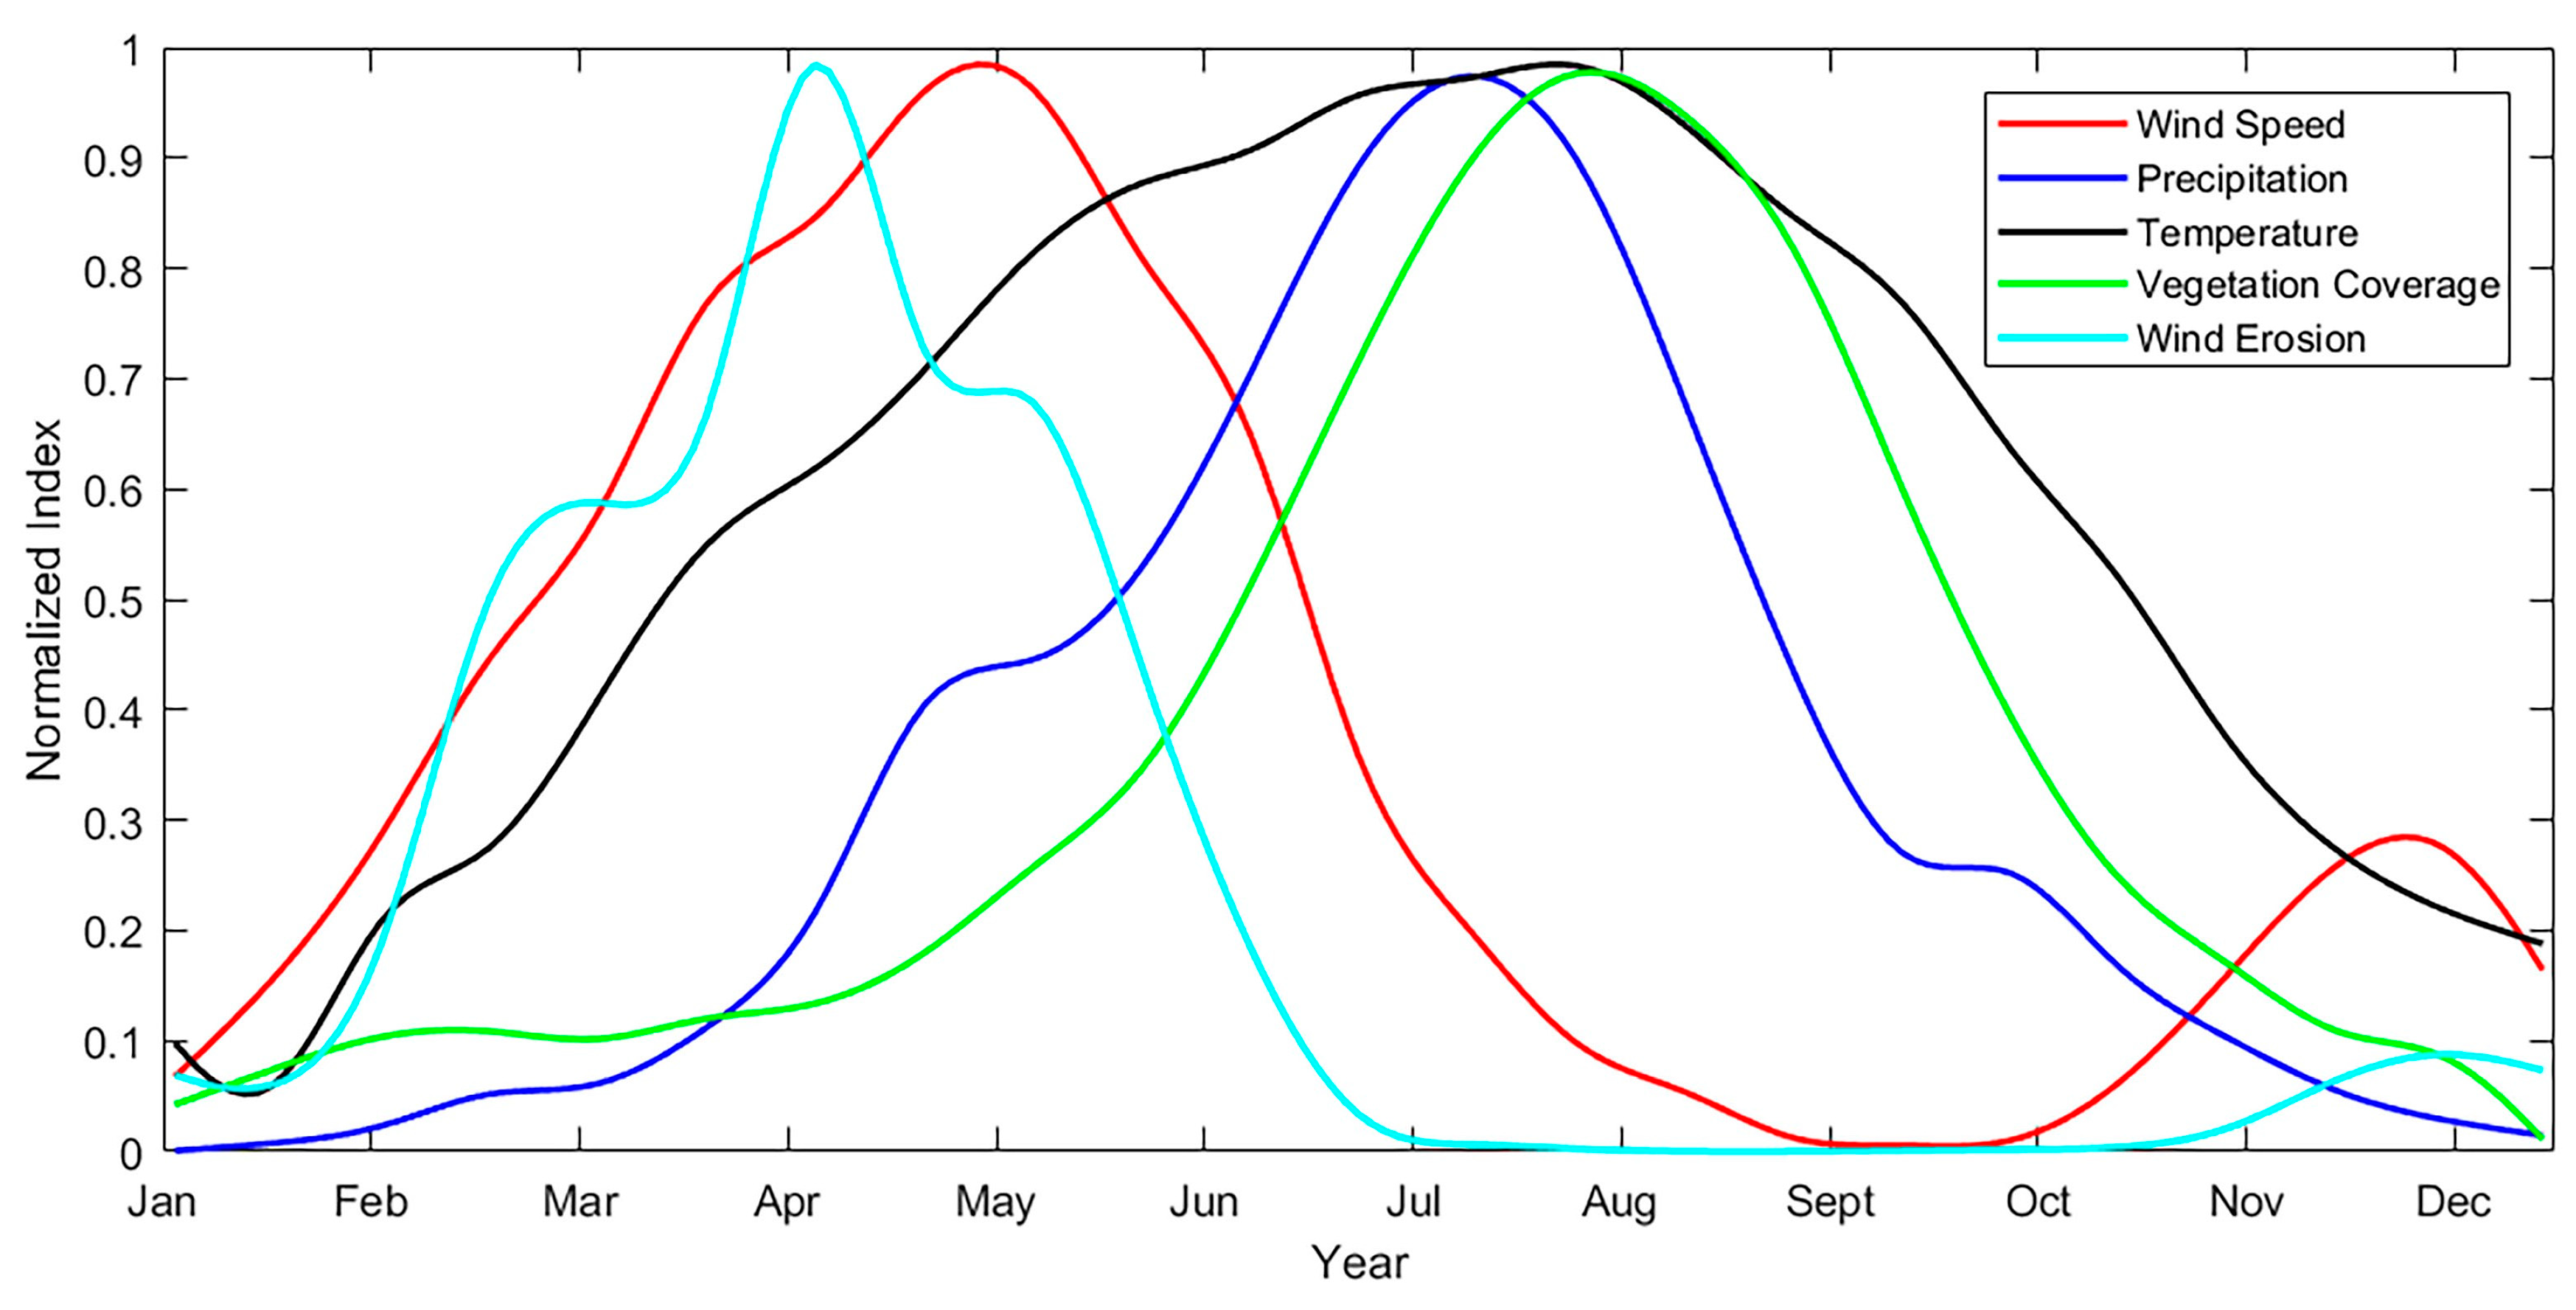
Wind erosion was mainly concentrated in mid-February to mid-June in HLBB because of the high wind speed, low precipitation, and low vegetation coverage. The temporal mismatch between wind speed and vegetation coverage was the main reason for the severe wind erosion in spring. Because of this mismatch, more targeted strategies need to be applied to mitigate the high spring wind erosion. Given that improving the vegetation coverage in spring in HLBB is very difficult, reducing the wind speed in spring by adding drought-tolerant windbreaks might be a more cost-effective method for wind erosion reduction.

Author Contributions

The study was designed and performed by Y.G. The data were collected by H.Z., Y.G., Y.C., and W.Z. The data was analyzed by H.Z. and Y.G. The paper was written by H.Z., Y.G. and L.L. The final checked and revised by D.S., Y.G. and H.Z. All authors read and approved the final manuscript.

Funding

This research was funded by the National Natural Science Foundation of China [41501087]. And the APC was funded by National Key R&D Program of China [2016YFD0800906].

Acknowledgments

The authors sincerely thank editors and all anonymous reviewers for their beneficial suggestions to improve the quality of this article.

Conflicts of Interest

The authors declare no conflicts of interest.

References

  1. Sivakumar, M.V.K. Interactions between climate and desertification. Agric. For. Meteorol. 2007, 142, 143–155. [Google Scholar] [CrossRef]
  2. Ravi, S.; Breshears, D.D.; Huxman, T.E.; D’Odorico, P. Land degradation in drylands: Interactions among hydrologic–aeolian erosion and vegetation dynamics. Geomorphology 2010, 116, 236–245. [Google Scholar] [CrossRef]
  3. Copeland, S.M.; Bradford, J.B.; Duniway, M.C.; Schuster, R.M. Potential impacts of overlapping land-use and climate in a sensitive dryland: A case study of the Colorado Plateau, USA. Ecosphere 2017, 8, 349–351. [Google Scholar] [CrossRef]
  4. Tanner, S.; Katra, I.; Haim, A.; Zaady, E. Short-term soil loss by eolian erosion in response to different rain-fed agricultural practices. Soil Tillage Res. 2016, 155, 149–156. [Google Scholar] [CrossRef]
  5. Van Pelt, R.S.; Hushmurodov, S.X.; Baumhardt, R.L.; Chappell, A.; Nearing, M.A.; Polyakov, V.O.; Strack, J.E. The reduction of partitioned wind and water erosion by conservation agriculture. Catena 2017, 148, 160–167. [Google Scholar] [CrossRef]
  6. Sharratt, B.; Feng, G.; Wendling, L. Loss of soil and PM10 from agricultural fields associated with high winds on the Columbia Plateau. Earth Surf. Proc. Land. 2007, 32, 621–630. [Google Scholar] [CrossRef]
  7. Griffin, D.W. Atmospheric movement of microorganisms in clouds of desert dust and implications for human health. Clin. Microbiol. Rev. 2007, 20, 459–477. [Google Scholar] [CrossRef] [PubMed]
  8. Watanabe, M.; Igishi, T.; Burioka, N.; Yamasaki, A.; Kurai, J.; Takeuchi, H.; Sako, T.; Yoshida, A.; Yoneda, K.; Fukuoka, Y.; et al. Pollen augments the influence of desert dust on symptoms of adult asthma patients. Allergol. Int. 2011, 60, 517–524. [Google Scholar] [CrossRef]
  9. Du, H.Q.; Wang, T.; Xue, X. Potential wind erosion rate response to climate and land-use changes in the watershed of the Ningxia–Inner Mongolia reach of the Yellow River, China, 1986–2013. Earth Surf. Proc. Land. 2017, 42, 1923–1937. [Google Scholar] [CrossRef]
  10. Cao, S.X.; Chen, L.; Shankman, D.; Wang, C.M.; Wang, X.B.; Zhang, H. Excessive reliance on afforestation in China’s arid and semi-arid regions: Lessons in ecological restoration. Earth-Sci. Rev. 2011, 104, 240–245. [Google Scholar] [CrossRef]
  11. National Development and Reform Commission. Planning for the Fourth Phase of the Construction of the Three-North Shelterbelt System. 2007. Available online: http://www.ndrc.gov.cn/fzgggz/fzgh/ghwb/gjjgh/ (accessed on 9 September 2018).
  12. China’s State Forestry Administration. Returning Farmland to Forests Regulations. 2002. Available online: http://www.forestry.gov.cn/main/3950/20170314/459878.html (accessed on 8 September 2018).
  13. China’s State Forestry Administration. Phase II Implementation Plan of Natural Forest Resources Protection Project. 2011. Available online: http://trlbh.forestry.gov.cn/trlbh/1851/48411/1.html (accessed on 8 August 2018).
  14. Jiang, L.; Xiao, Y.; Zheng, H.; Ouyang, Z.Y. Spatio-temporal variation of wind erosion in Inner Mongolia of China between 2001 and 2010. Chin. Geogr. Sci. 2016, 26, 155–164. [Google Scholar] [CrossRef] [Green Version]
  15. Tegen, I.; Werner, M.; Harrison, S.P.; Kohfeld, K.E. Reply to comment by NM Mahowald et al. on “Relative importance of climate and land use in determining present and future global soil dust emission”. Geophys. Res. Lett. 2004, 31, 325–341. [Google Scholar] [CrossRef]
  16. Ravi, S.; D’odorico, P.; Breshears, D.D.; Field, J.P.; Goudie, A.S.; Huxman, T.E.; Li, J.; Okin, G.S.; Swap, R.J.; Thomas, A.D.; et al. Aeolian processes and the biosphere. Rev. Geophys. 2011, 49, RG3001. [Google Scholar] [CrossRef]
  17. Ginoux, P.; Prospero, J.M.; Gill, T.E.; Hsu, N.C.; Zhao, M. Global-scale attribution of anthropogenic and natural dust sources and their emission rates based on MODIS Deep Blue aerosol products. Rev. Geophys. 2012, 50, RG3005. [Google Scholar] [CrossRef]
  18. Wang, X.; Zhao, X.L.; Zhang, Z.X.; Yi, L.; Zuo, L.J.; Wen, Q.K.; Liu, F.; Xu, J.Y.; Hu, S.G.; Liu, B. Assessment of soil erosion change and its relationships with land use/cover change in China from the end of the 1980s to 2010. Catena 2016, 137, 256–268. [Google Scholar] [CrossRef]
  19. Shi, P.J.; Yan, P.; Yuan, Y.; Nearing, M.A. Wind erosion research in China: Past, present and future. Prog. Phys. Geogr. 2004, 28, 366–386. [Google Scholar] [CrossRef]
  20. Meng, Z.J.; Dang, X.H.; Gao, Y.; Ren, X.M.; Ding, Y.L.; Wang, M. Interactive effects of wind speed, vegetation coverage and soil moisture in controlling wind erosion in a temperate desert steppe, Inner Mongolia of China. J. Arid Land. 2018, 10, 1–14. [Google Scholar] [CrossRef]
  21. Zhang, H.Y.; Fan, J.W.; Cao, W.; Harris, W.; Li, Y.Z.; Chi, W.F.; Wang, S.Z. Response of wind erosion dynamics to climate change and human activity in Inner Mongolia, China during 1990 to 2015. Sci. Total Environ. 2018, 639, 1038–1050. [Google Scholar] [CrossRef] [PubMed]
  22. Zhang, H.Y.; Fan, J.W.; Cao, W.; Zhong, H.P.; Harris, W.; Gong, G.L.; Zhang, Y.X. Changes in multiple ecosystem services between 2000 and 2013 and their driving factors in the Grazing Withdrawal Program, China. Ecol. Eng. 2018, 116, 67–79. [Google Scholar] [CrossRef]
  23. Li, D.J.; Xu, D.Y.; Wang, Z.Y.; You, X.G.; Zhang, X.Y.; Song, A. The dynamics of sand-Stabilization services in Inner Mongolia, China from 1981 to 2010 and its relationship with climate change and human activities. Ecol. Indic. 2018, 88, 351–360. [Google Scholar] [CrossRef]
  24. Wang, L.Y.; Xiao, Y.; Rao, E.M.; Jiang, L.; Xiao, Y.; Ouyang, Z.Y. An assessment of the impact of urbanization on soil erosion in Inner Mongolia. Int. J. Environ. Res. Public Health 2018, 15, 550. [Google Scholar] [CrossRef] [PubMed]
  25. Woodruff, N.P.; Siddoway, F.H.A. Wind Erosion Equation 1. Soil Sci. Soc. Am. J. 1965, 29, 602–608. Available online: https://infosys.ars.usda.gov/WindErosion/publications/Andrew_pdf/897.pdf (accessed on 9 August 2018). [CrossRef]
  26. Fryrear, D.W.; Saleh, A.; Bilbro, J.D. A single event wind erosion model. Trans. ASAE 1998, 41, 1369–1374. [Google Scholar] [CrossRef]
  27. Hagen, L.J. A wind erosion prediction system to meet user needs. J. Soil Water Conserv. 1991, 46, 106–111. Available online: http://www.jswconline.org/content/46/2/106.short (accessed on 9 August 2018).
  28. Du, H.Q.; Xue, X.; Wang, T.; Deng, X.H. Wind erosion modulus and quantity evaluation of aeolian sediment feed into river in watershed of Ningxia-Inner Mongolia Reach of Yellow River from 1986 to 2013. Trans. CSAE 2015, 31, 142–151. (In Chinese) [Google Scholar] [CrossRef]
  29. Zhou, J.; Zhang, F.R.; Xu, Y.; Gao, Y.; Xie, Z. Evaluation of land reclamation and implications of ecological restoration for agro-pastoral ecotone: Case study of Horqin Left Back Banner in China. Chin. Geogr. Sci. 2017, 27, 772–783. [Google Scholar] [CrossRef]
  30. Ma, Y.F.; Jie, D.M.; Yan, P.; Wang, G.Y.; Song, Y. Study on wind erodibility in soil under eastern Horqin sandy land. Glob. Geol. 2007, 26, 338–344. (In Chinese) [Google Scholar] [CrossRef]
  31. Sun, W.X. A Study on the Human Driving Mechanism of Desertification in Horqin Sandy Land during the Recent 20 Year-Setting Kezuohouqi Banner as an Example; Inner Mongolia Normal University: Inner Mongolia, China, 2010; Available online: http://cdmd.cnki.com.cn/Article/CDMD-10135-2010185287.htm (accessed on 9 August 2018). (In Chinese)
  32. Zhou, D.C.; Zhao, S.Q.; Zhu, C. The impact of the Grain for Green Project on the land use/cover change in the Northern farming-pastoral ecotone, China—A case study of Kezuohouqi County. Sci. Geogr. Sin. 2012, 32, 442–449. (In Chinese) [Google Scholar] [CrossRef]
  33. Zobeck, T.M.; Parker, N.C.; Haskell, S.; Guoding, K. Scaling up from field to region for wind erosion prediction using a field-scale wind erosion model and GIS. Agric. Ecosyst. Environ. 2000, 82, 247–259. [Google Scholar] [CrossRef]
  34. Youssef, F.; Visser, S.; Karssenberg, D.; Bruggeman, A.; Erpul, G. Calibration of RWEQ in a patchy landscape; a first step towards a regional scale wind erosion model. Aeolian Res. 2012, 3, 467–476. [Google Scholar] [CrossRef]
  35. Gong, G.L.; Liu, J.Y.; Shao, Q.Q.; Zhai, J. Sand-fixing function under the change of vegetation coverage in a wind erosion area in northern China. J. Resour. Ecol. 2014, 5, 105–114. [Google Scholar] [CrossRef]
  36. Du, H.Q.; Dou, S.T.; Deng, X.H.; Xue, X.; Wang, T. Assessment of wind and water erosion risk in the watershed of the Ningxia-Inner Mongolia Reach of the Yellow River, China. Ecol. Indicators 2016, 67, 117–131. [Google Scholar] [CrossRef]
  37. Fryrear, D.W.; Chen, W.N.; Lester, C. Revised wind erosion equation. Ann. Arid Zone 2001, 40, 265–279. [Google Scholar]
  38. Fryrear, D.W.; Saleh, A.; Bilbro, J.D.; Schomberg, H.M.; Stout, J.E.; Zobeck, T.M. Revised Wind Erosion Equation (RWEQ). Wind Erosion and Water Conservation Research Unit. USDA Tech. Bull. No.1. 1998. Available online: https://www.researchgate.net/publication/284372898_Revised_wind_erosion_equation (accessed on 9 August 2018).
  39. Van Donk, S.J.; Wagner, L.E.; Skidmore, E.L.; Tatarko, J. Comparison of the Weibull model with measured wind speed distributions for stochastic wind generation. Trans. ASAE 2005, 48, 503–510. [Google Scholar] [CrossRef]
  40. Yin, H.J. Research on Improvement and Application of Revised Wind Erosion Equation Model in the Windy and Sandy Regions; China Agricultural University: Beijing, China, 2007. (In Chinese) [Google Scholar]
  41. Fryrear, D.W.; Krammes, C.A.; Williamson, D.L.; Zobeck, T.M. Computing the wind erodible fraction of soils. J. Soil Water Conserv. 1994, 49, 183–188. Available online: http://www.jswconline.org/content/49/2/183.short (accessed on 9 August 2018).
  42. De Oro, L.A.; Colazo, J.C.; Buschiazzo, D.E. RWEQ–Wind erosion predictions for variable soil roughness conditions. Aeolian Res. 2016, 20, 139–146. [Google Scholar] [CrossRef]
  43. Mann, H.B. Nonparametric tests against trend. Econom. J. Econom. Soc. 1945, 245–259. [Google Scholar] [CrossRef]
  44. Kendall, M. Multivariate Analysis; Charles Griffin & Company Ltd.: Glasgow, UK, 1975; ISBN 0-85264-234-2. [Google Scholar]
  45. Yue, S.; Pilon, P.; Phinney, B.; Cavadias, G. The influence of autocorrelation on the ability to detect trend in hydrological series. Hydrol. Process. 2002, 16, 1807–1829. [Google Scholar] [CrossRef]
  46. Fan, J.L.; Wu, L.F.; Zhang, F.C.; Xiang, Y.Z.; Zheng, J. Climate change effects on reference crop evapotranspiration across different climatic zones of China during 1956–2015. J. Hydrol. 2016, 542, 923–937. [Google Scholar] [CrossRef]
  47. Yin, Y.H.; Wu, S.H.; Chen, G.; Dai, E.F. Attribution analyses of potential evapotranspiration changes in China since the 1960s. Theor. Appl. Climatol. 2010, 101, 19–28. [Google Scholar] [CrossRef]
  48. Thomson, J.D.; Weiblen, G.; Thomson, B.A.; Alfaro, S.; Legendre, P. Untangling multiple factors in spatial distributions: Lilies, gophers, and rocks. Ecology 1996, 77, 1698–1715. [Google Scholar] [CrossRef]
  49. Guo, Q.; Brown, J.H.; Enquist, B.J. Using constraint lines to characterize plant performance. Oikos 1998, 83, 237–245. [Google Scholar] [CrossRef]
  50. Wang, T.M.; Feng, L.M.; Mou, P.; Wu, J.G.; Smith, J.L.D.; Xiao, W.H.; Yang, H.T.; Dou, H.L.; Zhao, X.D.; Cheng, Y.C.; et al. Amur tigers and leopards returning to China: Direct evidence and a landscape conservation plan. Landsc. Ecol. 2016, 31, 491–503. [Google Scholar] [CrossRef]
  51. Zhao, Y.Y.; Wu, J.J.; He, C.Y.; Ding, G.D. Linking wind erosion to ecosystem services in drylands: A landscape ecological approach. Landsc. Ecol. 2017, 32, 2399–2417. [Google Scholar] [CrossRef]
  52. Wolfe, S.A.; Nickling, W.G. The protective role of sparse vegetation in wind erosion. Prog. Phys. Geogr. 1993, 17, 50–68. [Google Scholar] [CrossRef]
  53. Miri, A.; Dragovich, D.; Dong, Z.B. The response of live plants to airflow–Implication for reducing erosion. Aeolian Res. 2018, 33, 93–105. [Google Scholar] [CrossRef]
  54. Wu, D.H.; Zhao, X.; Liang, S.L.; Zhou, T.; Huang, K.C.; Tang, B.J.; Zhao, W.Q. Time-lag effects of global vegetation responses to climate change. Glob. Chang. Boil. 2015, 21, 3520–3531. [Google Scholar] [CrossRef]
  55. Dong, Z.B.; Gao, S.Y.; Fryrear, D.W. Drag coefficients, roughness length and zero-plane displacement height as disturbed by artificial standing vegetation. J. Arid Environ. 2001, 49, 485–505. [Google Scholar] [CrossRef]
  56. Li, R.L.; Hu, P.X. One of report of China’s Six Key Forestry Programs: Visiting of Sand Control Programs for areas in the vicinity of Beijing and Tianjin. For. Hum. 2001, 9, 14–18. Available online: http://mall.cnki.net/magazine/magadetail/SLRL200109.htm (accessed on 9 August 2018). (In Chinese).
  57. Cao, S. Why large-scale afforestation efforts in China have failed to solve the desertification problem. Environ. Sci. Technol. 2008, 42, 1826–1831. [Google Scholar] [CrossRef]
  58. Cao, S.X.; Chen, L.; Yu, X.X. Impact of China’s Grain for Green Project on the landscape of vulnerable arid and semi-arid agricultural regions: A case study in northern Shaanxi Province. J. Appl. Ecol. 2009, 46, 536–543. [Google Scholar] [CrossRef]
  59. Wang, X.M.; Zhang, C.X.; Hasi, E.; Dong, Z.B. Has the Three Norths Forest Shelterbelt Program solved the desertification and dust storm problems in arid and semiarid China? J. Arid Environ. 2010, 74, 13–22. [Google Scholar] [CrossRef]
  60. Wu, T.G.; Zhang, P.; Zhang, L.; Wang, J.Y.; Yu, M.K.; Zhou, X.H.; Wang, G.G. Relationships between shelter effects and optical porosity: A meta-analysis for tree windbreaks. Agric. For. Meteorol. 2018, 259, 75–81. [Google Scholar] [CrossRef]
  61. Pi, H.W.; Sharratt, B. Evaluation of the RWEQ and SWEEP in simulating soil and PM10 loss from a portable wind tunnel. Soil Tillage Res. 2017, 170, 94–103. [Google Scholar] [CrossRef]
  62. Guo, Z.L.; Zobeck, T.M.; Zhang, K.; Li, F. Estimating potential wind erosion of agricultural lands in northern China using the Revised Wind Erosion Equation and geographic information systems. J. Soil Water Conserv. 2013, 68, 13–21. [Google Scholar] [CrossRef]
Figure 1. The location of Horqin Left Wing Back Banner (HLBB), Inner Mongolia, China.
Sustainability 11 00188 g001
Figure 2. The land cover of HLBB, Inner Mongolia, China.
Sustainability 11 00188 g002
Figure 3. The spatial distribution of wind erosion per year in HLBB from 2005 to 2016.
Sustainability 11 00188 g003
Figure 4. The annual wind erosion from 2005 to 2016 in HLBB.
Sustainability 11 00188 g004
Figure 5. The spatial distribution of wind erosion change trends in HLBB from 2005 to 2016. (a) the slope of wind erosion (θ), (b) the relative slope of wind erosion (γ).
Sustainability 11 00188 g005
Figure 6. The proportion of different wind erosion intensity areas from 2005 to 2016 in HLBB. Note: TEI: tolerable erosion intensity; SEI: slight erosion intensity; MEI: moderate erosion intensity; SEEI: severe erosion intensity; VSEI: very severe erosion intensity.
Sustainability 11 00188 g006
Figure 7. The spatial distribution of the contribution of different factors to average annual wind erosion changes from 2005 to 2016; (a) contribution of wind speed factor, (b) contribution of vegetation coverage factor, (c) contribution of soil moisture factor, and (d) contribution of air density factor.
Sustainability 11 00188 g007
Figure 8. The distribution of driving factors to the average annual change of wind erosion in HLBB from 2005 to 2016.
Sustainability 11 00188 g008
Figure 9. The change in wind-related indicators from 2005 to 2016 in HLBB.
Sustainability 11 00188 g009
Figure 10. The average trend of annual changes of vegetation coverage in HLBB from 2005 to 2016.
Sustainability 11 00188 g010
Figure 11. The relationships between the wind erosion modulus and vegetation coverage under different semi-monthly average wind speed (AWS). Note: Constraint lines 1 and 2 are the relationship between the wind erosion modulus and the semi-monthly AWS above 3 m/s and between 2 and 3 m/s, respectively.
Sustainability 11 00188 g011
Figure 12. The semi-monthly temporal characteristics of wind erosion and four natural factors. Note: all factors are normalized by the maximum and minimum values.
Sustainability 11 00188 g012

