Land-Use/Cover Change and Driving Mechanism on the West Bank of Lake Baikal from 2005 to 2015—A Case Study of Irkutsk City


Abstract
1. Introduction
2. Materials and Methods
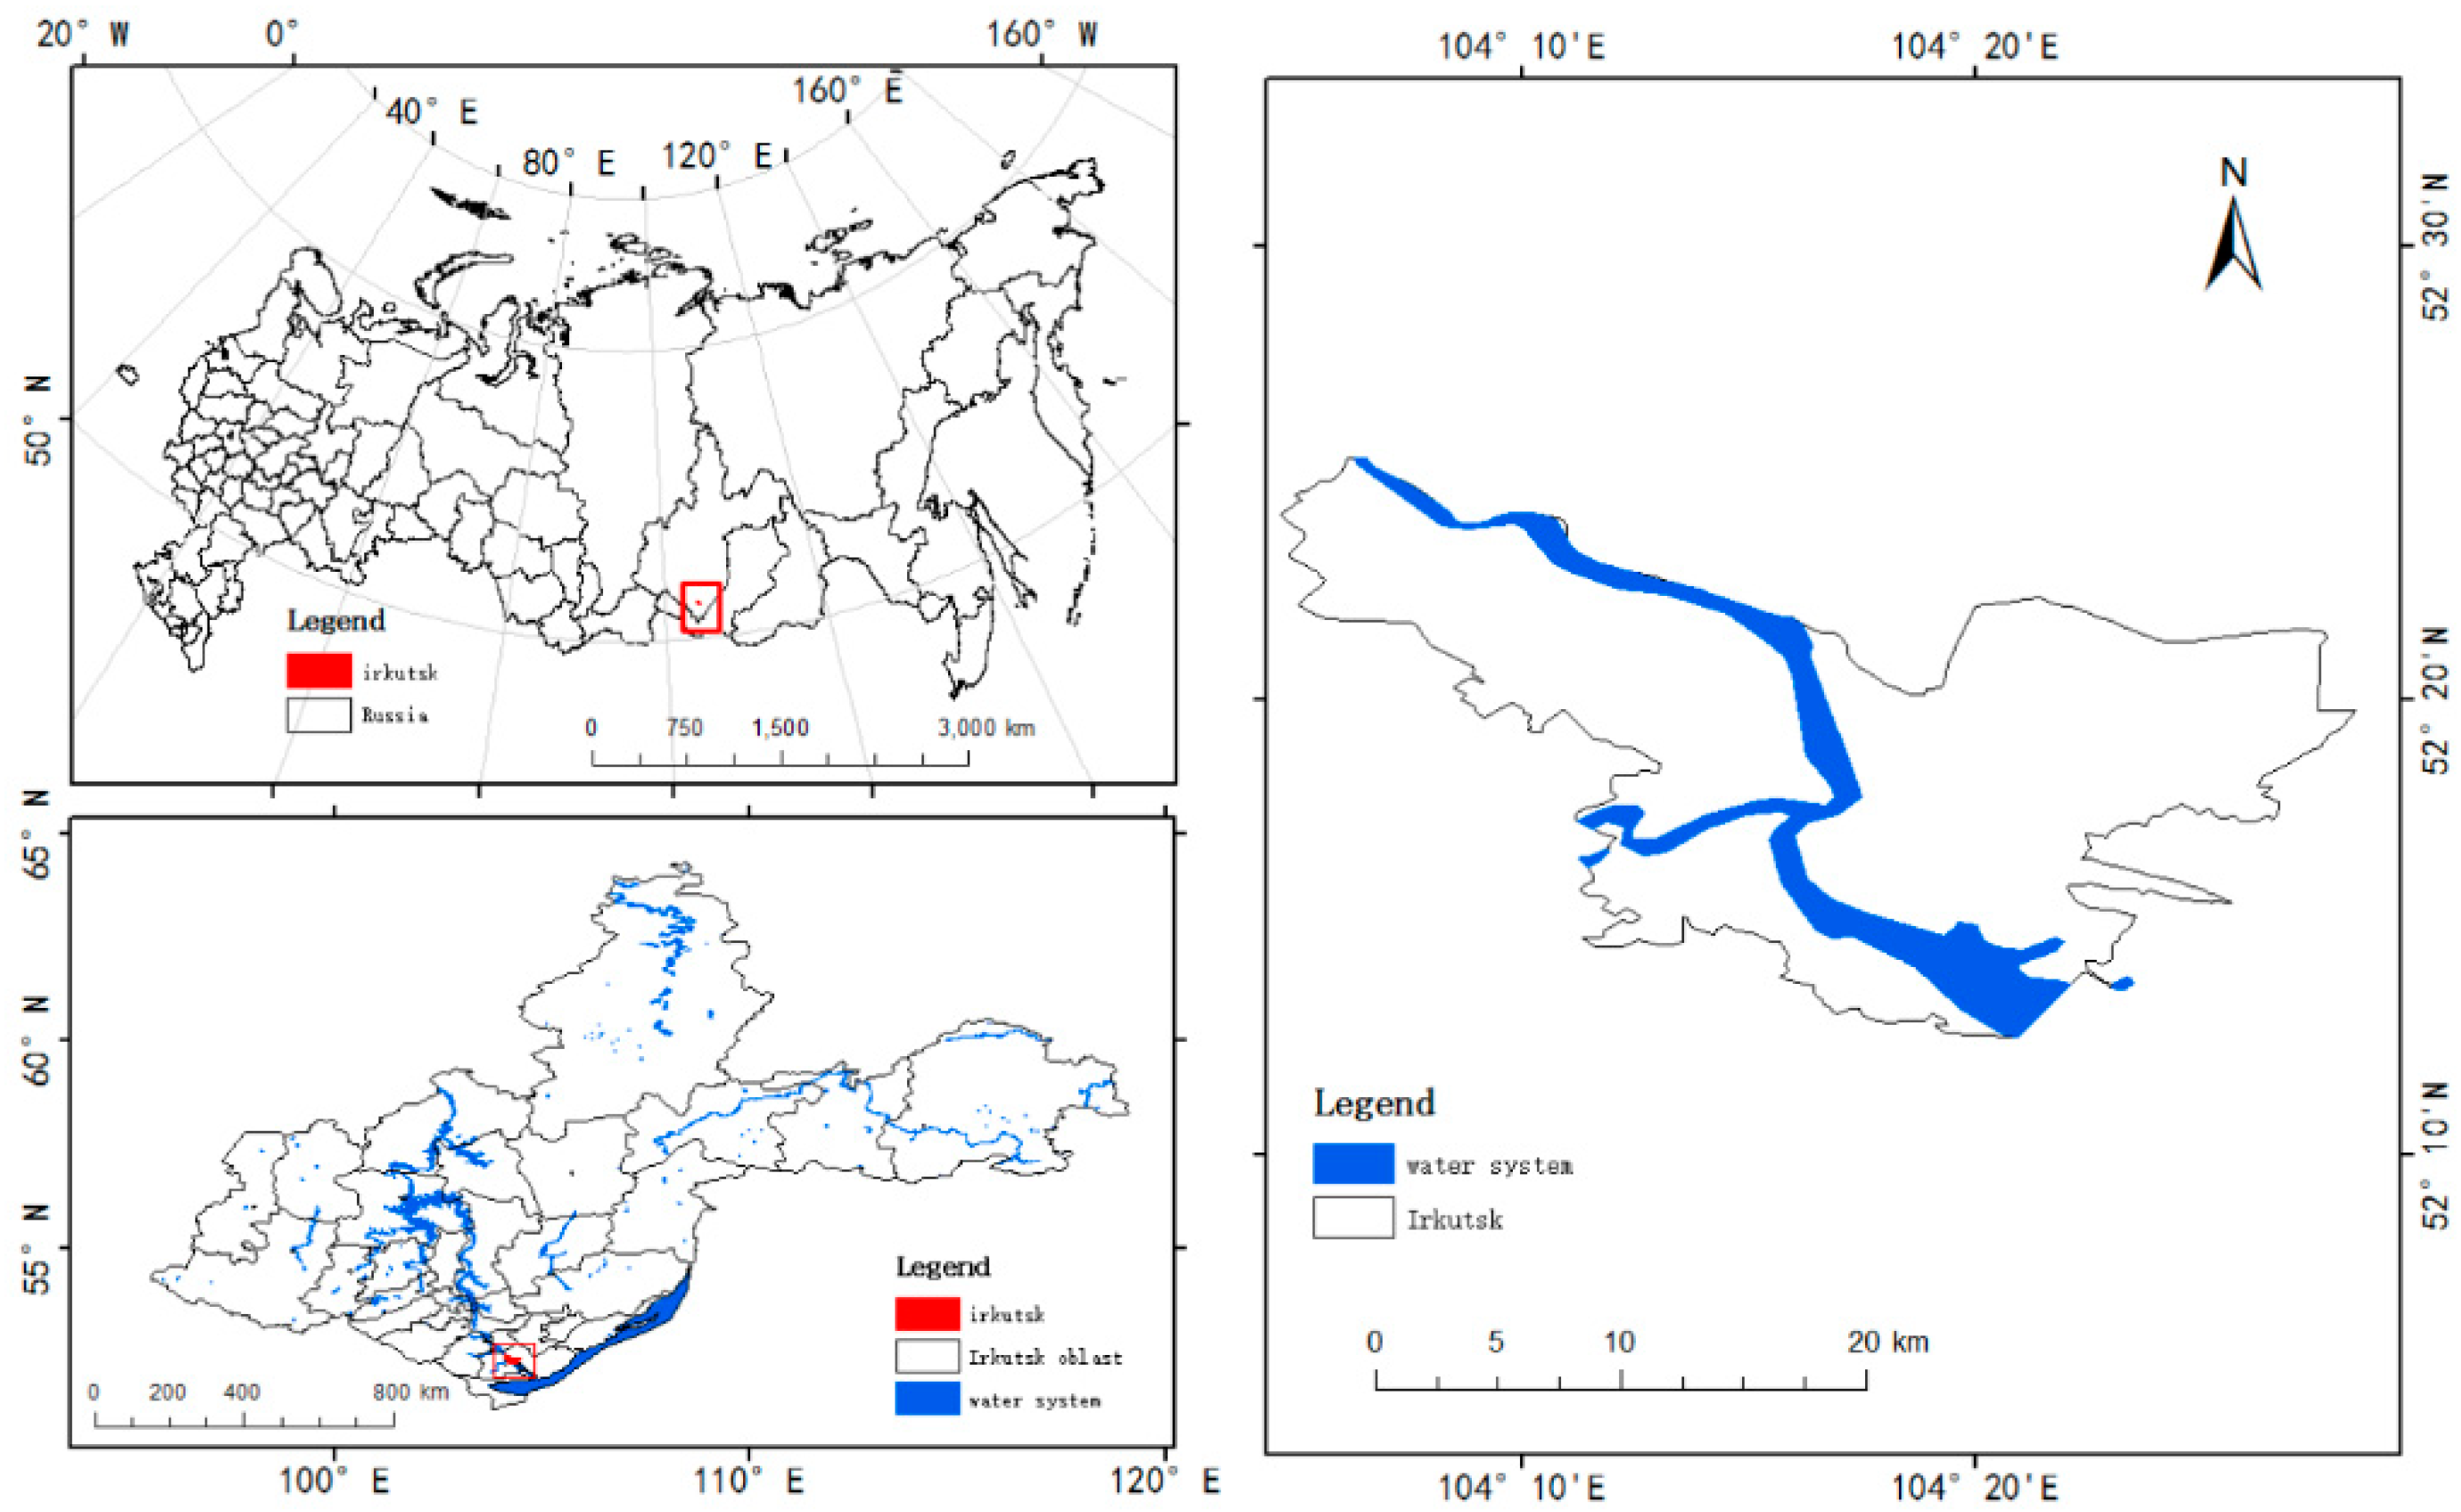
2.1. Overview of the Study Area
2.2. Methods and Data
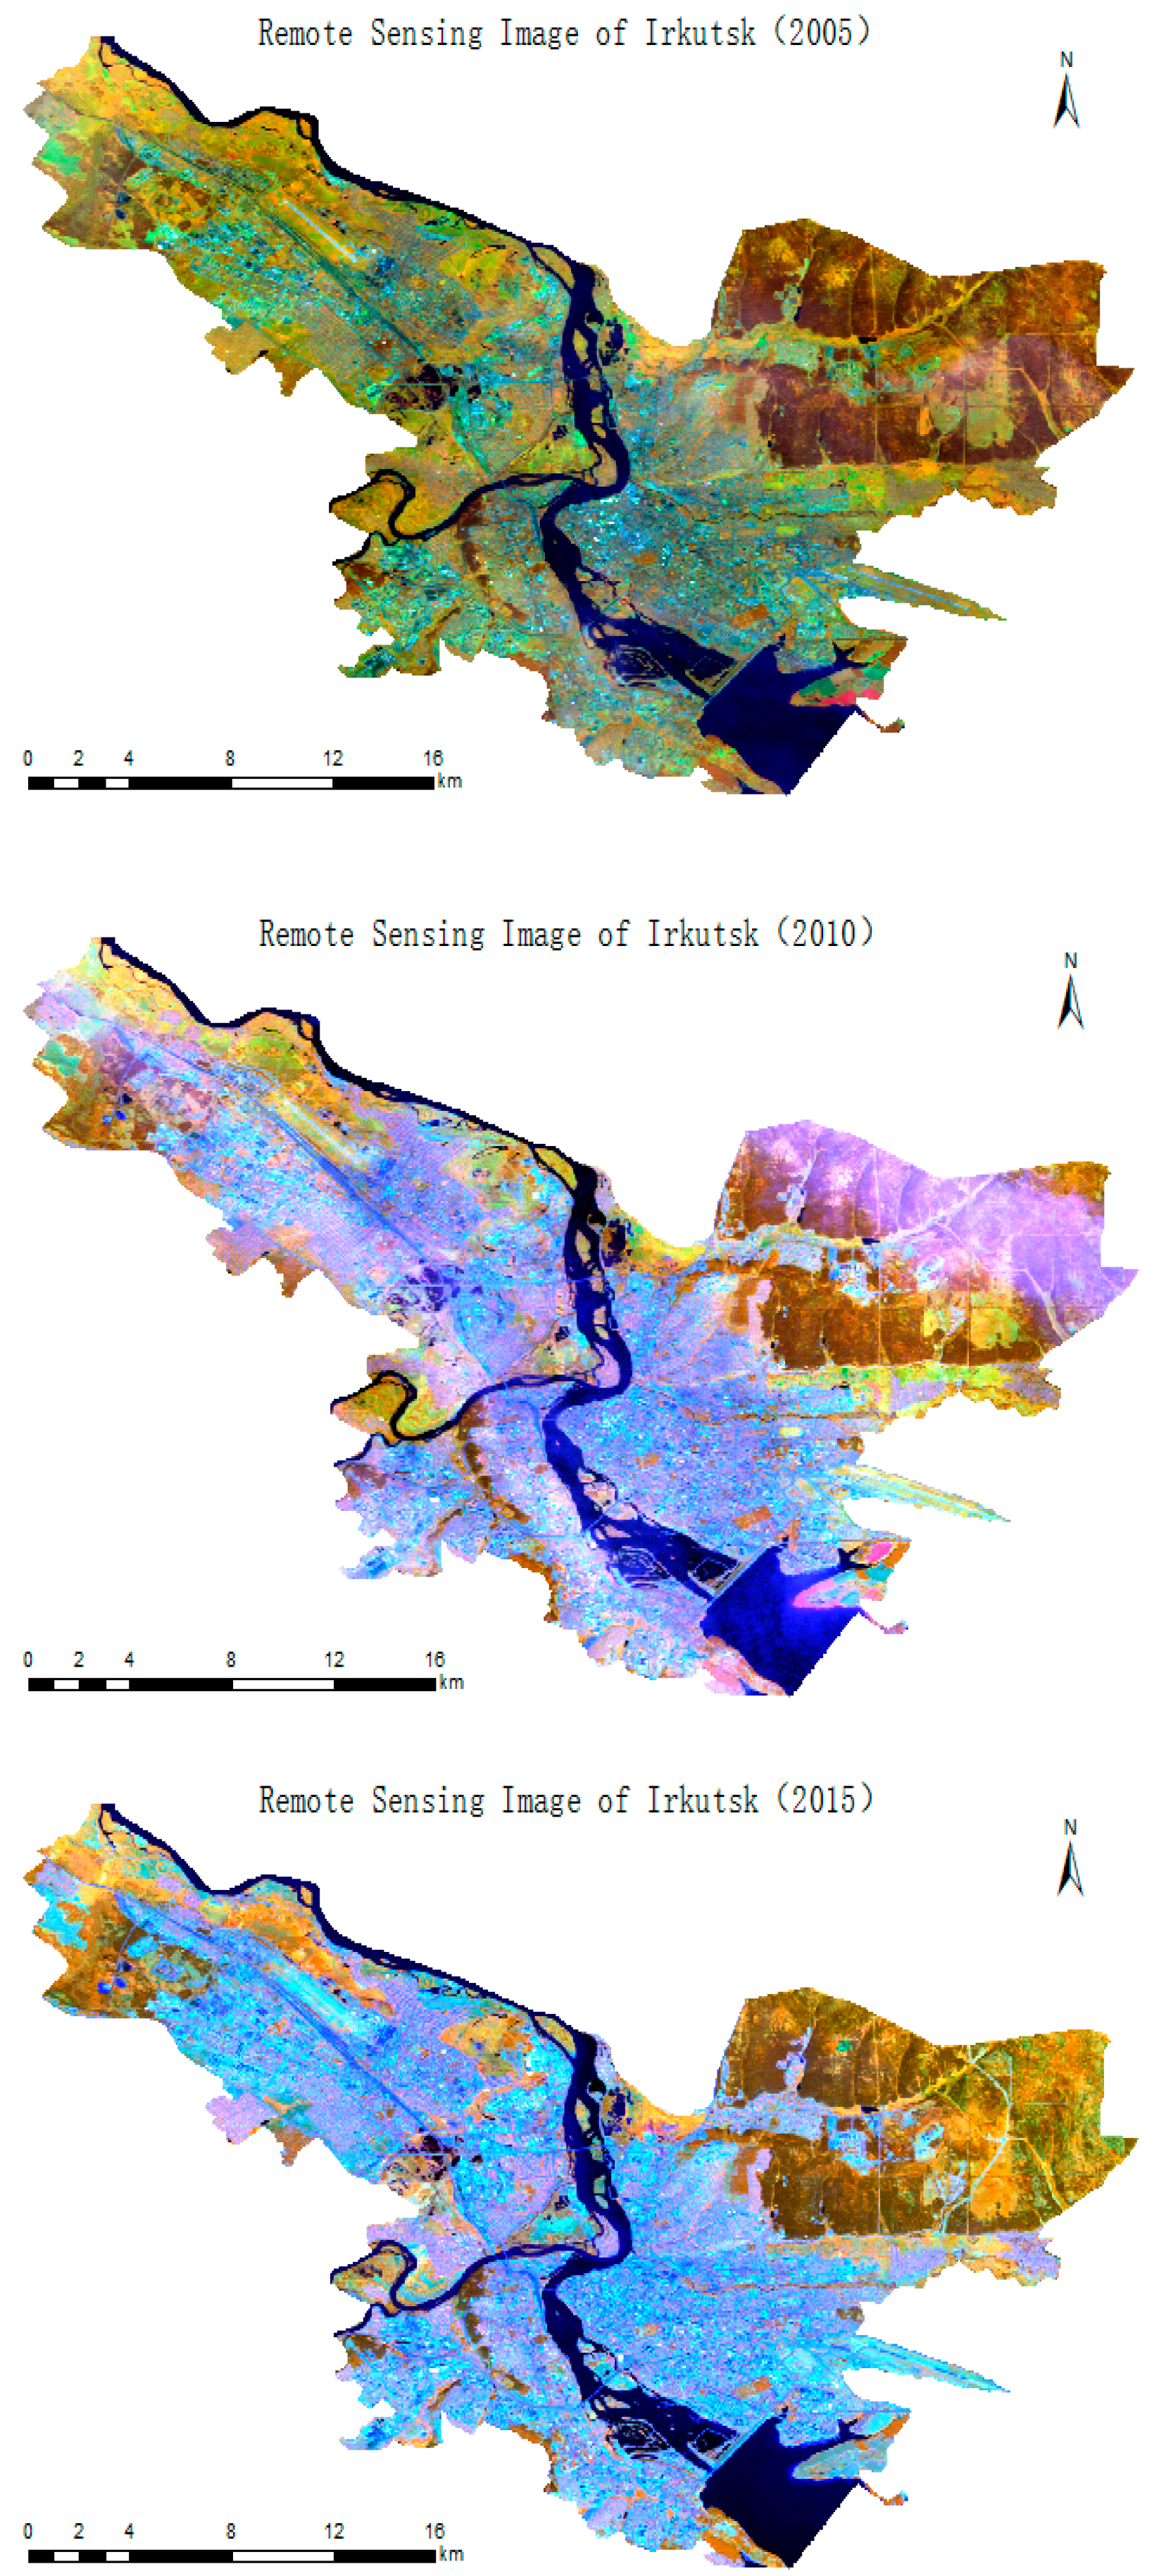
2.2.1. Data
2.2.2. Methods
3. Results and Discussion
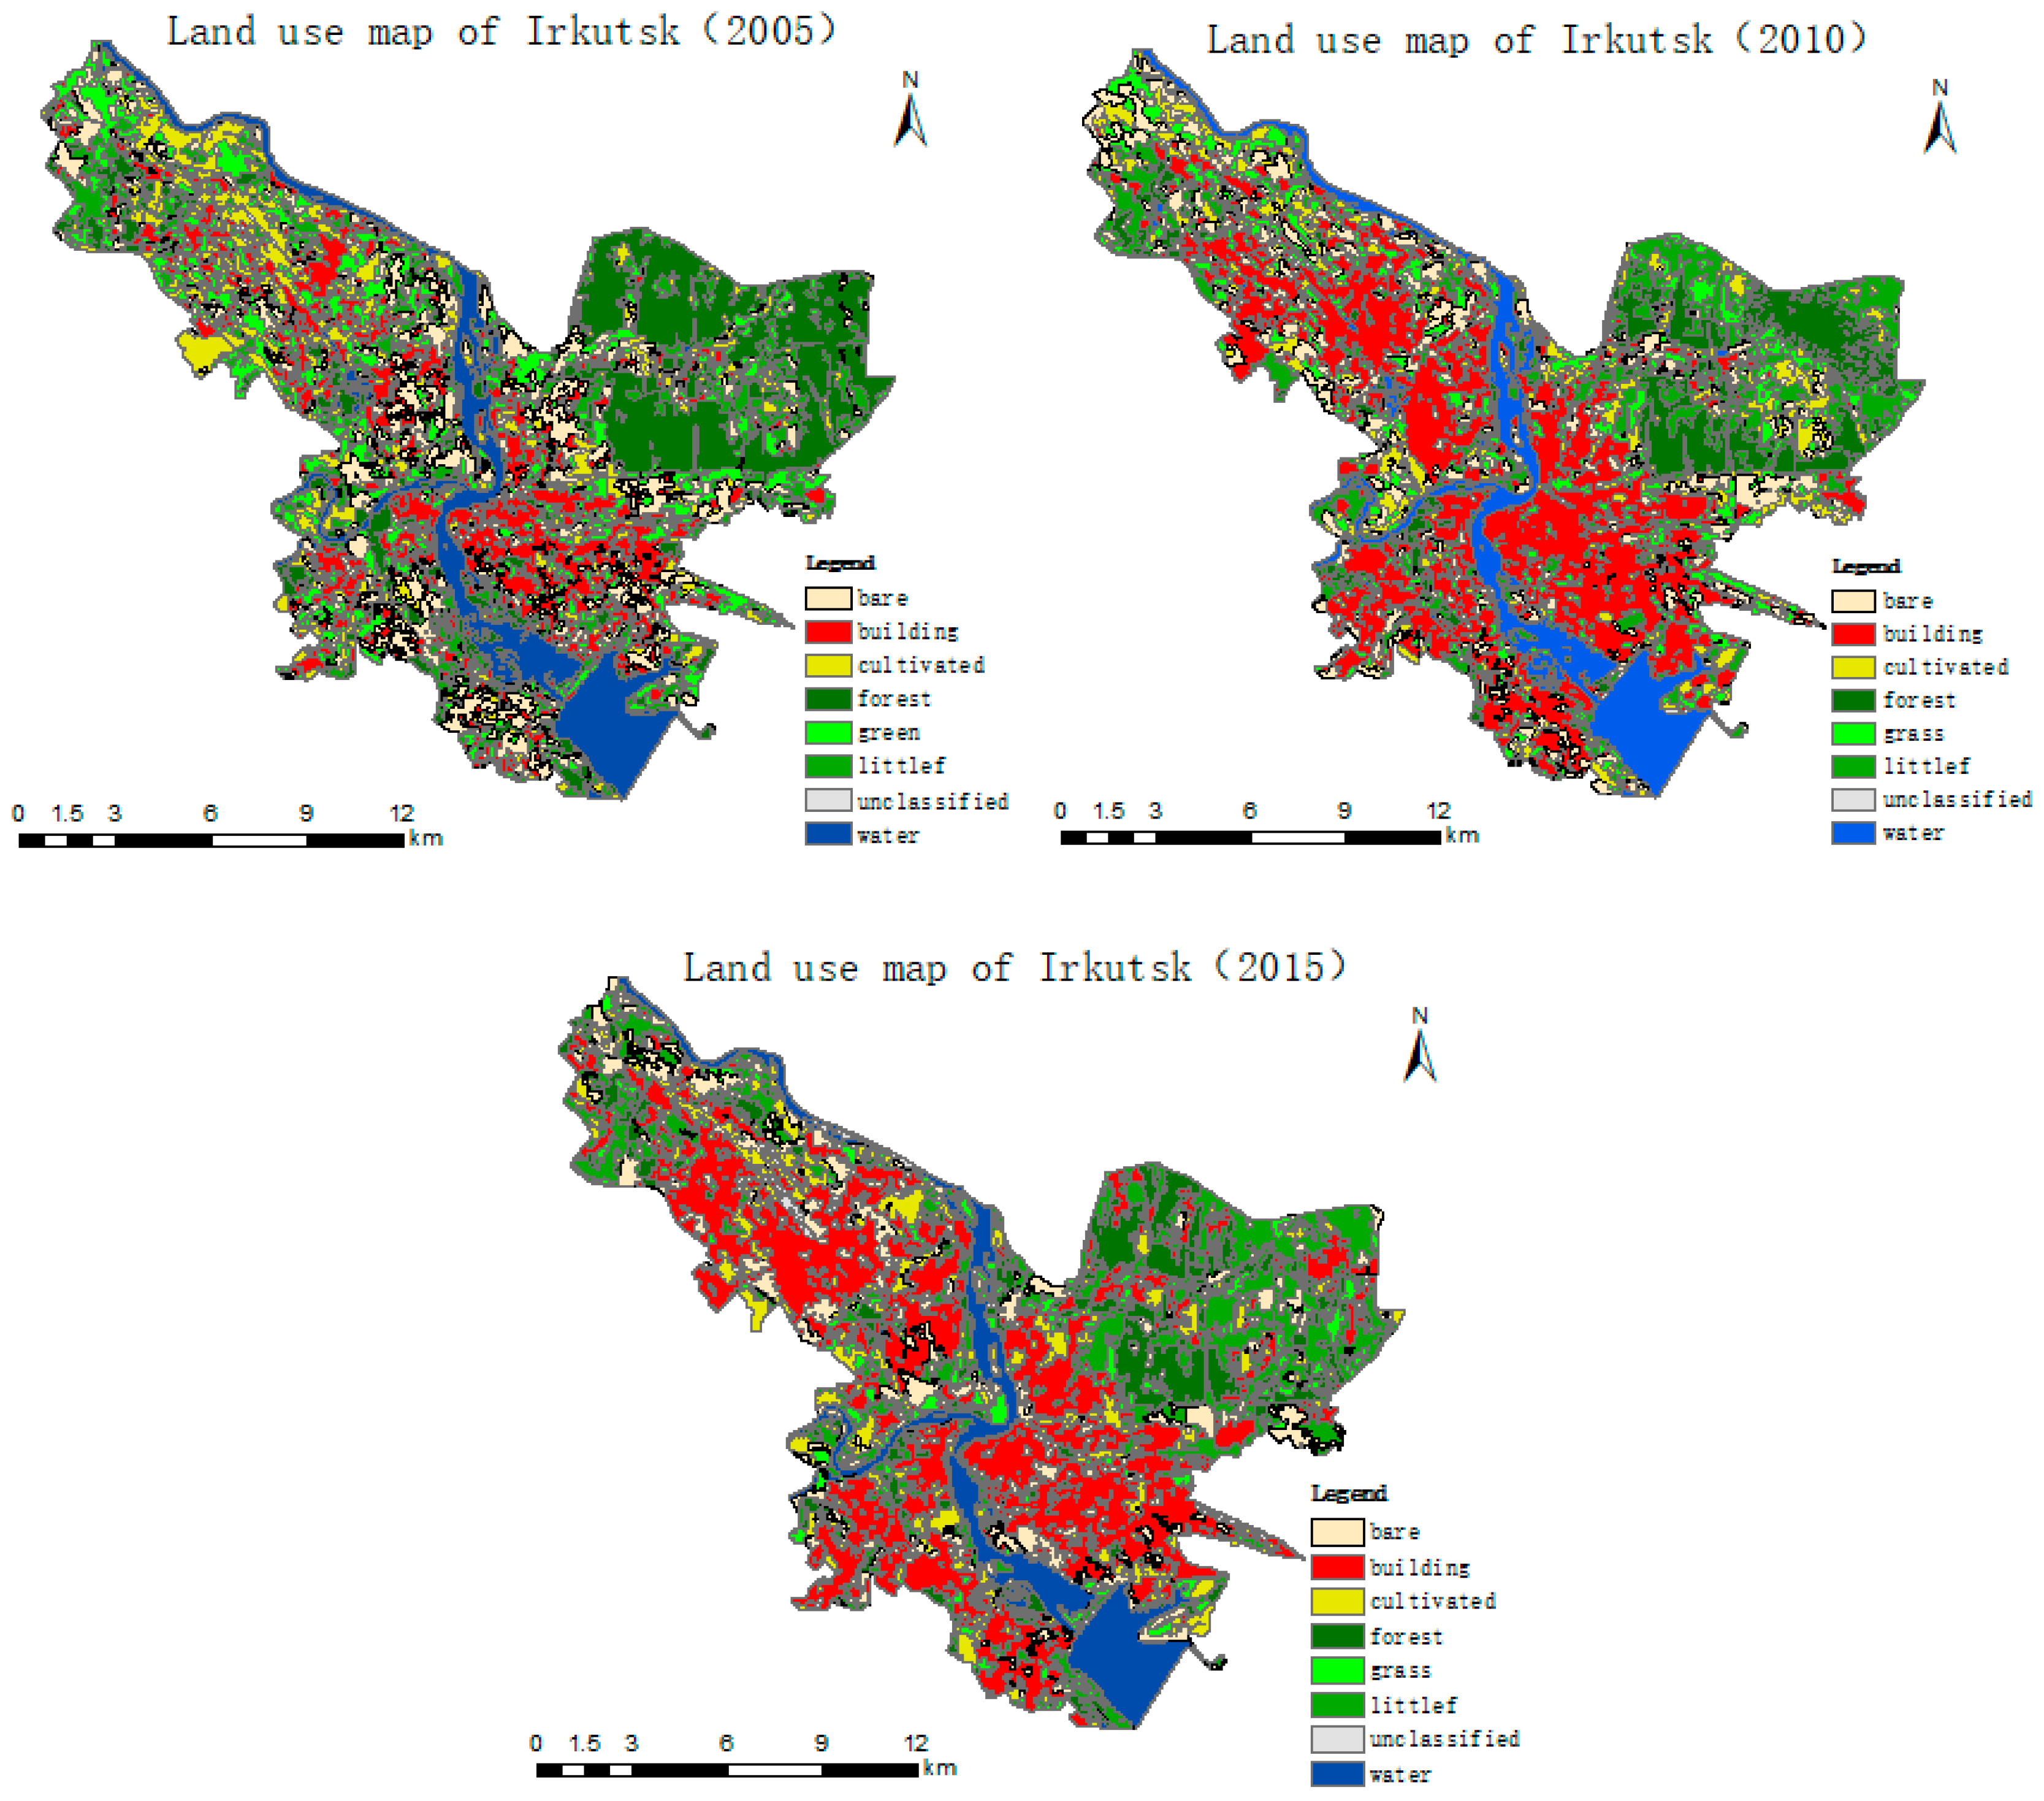
3.1. Land-Use/Cover Pattern
3.2. Land-Use/Cover Change
3.3. Analysis of Driving Factors of Major Land-type Changes
4. Conclusions
Author Contributions
Funding
Conflicts of Interest
References
- Turner, B.L., II; Skole, D.; Sanderson, S.; Fischer, G.; Fresco, L.; Leemans, R. Land-Use and Land-Cover Change Science/Research Plan; IGBP Report No. 35 and HDP Report No. 7; IGBP: Stockholm, Sweden, 1995. [Google Scholar]
- Li, X.B. A review of the international researches on land use/land cover change. Acta Geogr. Sin. 1996, 6, 553–558. [Google Scholar]
- Verburg, P.H.; Crossman, N.; Ellis, E.C.; Heinimann, A.; Hostert, P.; Mertz, O.; Nagendra, H.; Sikor, T.; Erb, K.H.; Golubiewski, N.; et al. Land system science and sustainable development of the earth system: A global land project perspective. Anthropocene 2015, 12, 29–41. [Google Scholar] [CrossRef]
- Seitzinger, S.P.; Gaffney, O.; Brasseur, G.; Broadgate, W.; Ciais, P.; Claussen, M.; Erisman, J.W.; Kiefer, T.; Lancelot, C.; Monks, P.S.; et al. International geosphere–biosphere programme and earth system science: Three decades of co-evolution. Anthropocene 2015, 12, 3–16. [Google Scholar] [CrossRef]
- IGBP/HDP. Land-Use and Land-Cover Change Science/Research Plan; IGBR: Stockholm, Sweden, 1995. [Google Scholar]
- Aнтипов, А.Н.; Cеменов, Ю.М. Ландшафтное планирование в прибайкалье. География и природные ресурсы 2006, 001, 11–18. [Google Scholar]
- Lambin, E.F.; Geist, H.J. Global land-use and land-cover change: What have we learned so far? Glob. Chang. Newsl. 2001, 46, 27–30. [Google Scholar]
- Moran, E.F.; Skole, D.L.; Ii, B.L.T. The development of the international land-use and land-cover change (LUCC) research program and its links to NASA’s land-use and land-cover change (LCLUC) initiative. In Land Change Science; Springer: Dordrecht, The Netherlands, 2012; Volume 6, pp. 1–15. ISBN 978-94-007-4306-9. [Google Scholar]
- Liu, J.Y.; Kuang, W.H.; Zhang, Z.X.; Xu, X.L.; Qin, Y.W.; Ning, J.; Zhou, W.C.; Zhang, S.W.; Li, R.D.; Yan, C.Z.; et al. Spatiotemporal characteristics, patterns, and causes of land-use changes in China since the late 1980s. J. Geogr. Sci. 2014, 24, 195–210. [Google Scholar] [CrossRef]
- Quintero-Gallego, M.E.; Quintero-Angel, M.; Vila-Ortega, J.J. Exploring land use/land cover change and drivers in Andean mountains in Colombia: A case in rural Quindío. Sci. Total Environ. 2018, 634, 1288–1299. [Google Scholar] [CrossRef] [PubMed]
- Turner, B.L. Toward integrated land-change science: Advances in 1.5 decades of sustained international research on land-use and land-cover change. In Challenges of a Changing Earth; Springer: Berlin/Heidelberg, Germany, 2002; pp. 21–26. [Google Scholar]
- Zhang, Y.; Chen, J.; Chen, L.; L, R.; Zhang, W.W.; Lu, N.; Liu, J.Y. Characteristics of land cover change in Siberia based on Globe Land 30, 2000–2010. Prog. Geogr. 2015, 34, 1324–1333. [Google Scholar]
- Feranec, J.; Soukup, T.; Taff, G.N.; Stych, P.; Bicik, I. Overview of changes in land use and land cover in Eastern Europe. In Land-Cover and Land-Use Changes in Eastern Europe after the Collapse of the Soviet Union in 1991; Springer International Publishing: Cham, Switzerland, 2017. [Google Scholar]
- Gao, Z.Q.; Deng, X.Z. Analysis on spatial features of LUCC based on remote sensing and GIS in China. Chin. Geogr. Sci. 2002, 12, 107–113. [Google Scholar] [CrossRef]
- Sabr, A.; Moeinaddini, M.; Azarnivand, H.; Guinot, B. Assessment of land use and land cover change using spatiotemporal analysis of landscape: Case study in south of Tehran. Environ. Monit. Assess. 2016, 188, 691. [Google Scholar] [CrossRef] [PubMed]
- Aguejdad, R.; Houet, T.; Hubert-Moy, L. Spatial validation of land use change models using multiple assessment techniques: A case study of transition potential models. Environ. Monit. Assess. 2017, 4, 1–16. [Google Scholar]
- Pontius, R.G.; Castella, J.C.; de Nijs, T.; Duan, Z.Q.; Fotsing, E.; Goldstein, N.; Kok, K.; Koomen, E.; Lippitt, C.D.; McConnell, W.; et al. Lessons and challenges in land change modeling derived from synthesis of cross-case comparisons. In Trends in Spatial Anaysis and Modelling; Behnisch, M., Meinel, G., Eds.; Springer: Cham, Switzerland, 2018. [Google Scholar]
- Rомбоев, Б.О. Аграрное землепользование внутренней азии; Издательство СО РАН.: Новосибирск, Russia, 2006; 228p, ISBN 5-7692-0865-1. [Google Scholar]
- Zhang, H.; Fan, J.; Shao, Q. Land use/land cover change in the grassland restoration program areas in China, 2000–2010. Prog. Geogr. 2015, 34, 840–853. [Google Scholar]
- Anputhas, M.; Janmaat, J.; Nichol, C.F.; Wei, X.H. Modelling spatial association in pattern based land use simulation models. J. Environ. Manag. 2016, 181, 465. [Google Scholar] [CrossRef] [PubMed]
- Ramankutty, N.; Foley, J.A. Estimating historical changes in global land cover: Croplands from 1700 to 1992. Glob. Biogeochem. Cycles 1999, 13, 997–1027. [Google Scholar] [CrossRef]
- Manganelli, B.; Palma, F.D.; Amato, F.; Nolè, G.; Murgante, B. The effects of socio-economic variables in urban growth simulations. Procedia Soc. Behav. Sci. 2016, 223, 371–378. [Google Scholar] [CrossRef]
- Wold, S.; Sjöström, M.; Eriksson, L. PLS-regression: A basic tool of chemometrics. Chemom. Intell. Lab. Syst. 2001, 58, 109–130. [Google Scholar] [CrossRef]
- Zhang, Y.; Zhou, C.H.; Dai, J.F.; Ma, R.H. An application of partial least-squares regression method to the study of land use patterns. J. Nat. Resour. 2004, 19, 804–810. [Google Scholar]
- Guebel, D.V.; Torres, N.V. Partial Least-Squares Regression (PLSR). In Encyclopedia of Systems Biology; Springer: New York, NY, USA, 2013; pp. 1646–1648. [Google Scholar]
- Mouazen, A.M.; Kuang, B.; De Baerdemaeker, J.; Ramon, H. Comparison among principal component, partial least squares and back propagation neural network analyses for accuracy of measurement of selected soil properties with visible and near infrared. Comparison between principal component, partial least squares and back propagation neural network analyses for accuracy of measurement of selected soil properties with visible and near infrared spectroscopy. Geoderma 2010, 158, 23–31. [Google Scholar]
- Wu, D.; Shi, H.; Wang, S.; He, Y.; Bao, Y.; Liu, K. Rapid prediction of moisture content of dehydrated prawns using online hyperspectral imaging system. Anal. Chim. Acta 2012, 726, 57–66. [Google Scholar] [CrossRef] [PubMed]
- Quezada, M.L.; Arroyo-Rodríguez, V.; Pérez-Silva, E.; Aide, T.M. Land cover changes in the Lachuá region, Guatemala: Patterns, proximate causes, and underlying driving forces over the last 50 years. Reg. Environ. Chang. 2014, 14, 1139–1149. [Google Scholar] [CrossRef]
- СЫcoeba, Н.М.; СЫcoeba, О.В. Problems of entrepreneurship development in the coastal zone of Baikal. Geografiya i Prirodnye Resursy 2016, 5, 144–150. [Google Scholar]
- РОГОВА, М.В.; ХАВИНА, Л.А. Territorial Characteristics of development of the land market of Irkutsk Oblast during 2011–2016. Geogr. Nat. Resour. 2017, 4, 162–169. [Google Scholar]
- Kelarestaghi, A.; Jeloudar, Z.J. Land use/cover change and driving force analyses in parts of northern Iran using RS and GIS techniques. Arabian J. Geosci. 2011, 4, 401–411. [Google Scholar] [CrossRef]
- Başnou, C.; Álvarez, E.; Bagaria, G.; Guardiola, M.; Isern, R.; Vicente, P.; Pino, J. Spatial patterns of land use changes across a Mediterranean metropolitan landscape: Implications for biodiversity management. Environ. Manag. 2013, 52, 971–980. [Google Scholar] [CrossRef] [PubMed]
- Freitas, M.W.D.D.; Santos, J.R.D.; Alves, D.S. Land-use and land-cover change processes in the Upper Uruguay Basin: Linking environmental and socioeconomic variables. Landsc. Ecol. 2013, 28, 311–327. [Google Scholar] [CrossRef]
- Yang, Y.Y.; Liu, Y.S.; Xu, D.; Zhang, S.W. Use of intensity analysis to measure land use changes from 1932 to 2005 in Zhenlai County, Northeast China. Chin. Geogr. Sci. 2017, 27, 441–455. [Google Scholar] [CrossRef]


| ID | Cloud % | Date | Band |
|---|---|---|---|
| LT51340242005235BJC00 | 43.09 | 2005.08.23 | 7 |
| LT51340242010249MOR01 | 0.05 | 2010.09.06 | 7 |
| LC81340242015231LGN01 | 0.02 | 2015.08.19 | 9 |
| Class | Description |
|---|---|
| Construction land | Mainly includes urban and rural areas, mining, transportation and other construction lands. |
| Cultivated land | Land covered mainly by crops that do not require irrigation or seasonal irrigation or periodic irrigation, including indistinguishable types of vegetation mosaics containing farmland. |
| Forestland | Forestland coverage > 60% |
| Woodland | 15% < Forestland coverage < 60% |
| Grass land | Herbaceous land coverage > 15% |
| Bare land | Land with almost no vegetation coverage or sparse vegetation. |
| Water | Mainly includes rivers, lakes, reservoirs and wet and flat zones that are periodically submerged in water. |
| Year | Segmentation Scale | Classification Features | Method |
|---|---|---|---|
| 2005 | 5 | Brightness, layer1, layer2, layer3, layer4, layer5, layer6, layer7, layer8, Max.diff, Length/Width, shape index, NDVI [(L4 − L3)/ (L4 + L3)] | Nearest Neighbor |
| 2010 | 5 | ||
| 2015 | 150 | Brightness, layer1, layer2, layer3, layer4, layer5, layer6, layer7, layer8, layer9, layer10, layer11, layer12, Max.diff, Length/Width, shape index, NDVI [(L5 − L4)/ (L5 + L4)] |
| Variable Name | Variable Definition | Unit | |
|---|---|---|---|
| Y1 | Construction land | km2 | |
| Y2 | Forestland | km2 | |
| Y3 | Woodland | km2 | |
| Y4 | Grass land | km2 | |
| Population | X1 | Population density | people/km2 |
| X2 | Immigration rate | % | |
| X3 | Percentage of working-age population | % | |
| X4 | Natural population growth rate | % | |
| Urban construction | X5 | Urban per capita residential area | m2 |
| X6 | Fixed asset investment (actual price) | million rubles | |
| X7 | Passenger traffic | thousands | |
| X8 | Passenger turnover | 103 km | |
| X9 | Car availability statistics | - | |
| Economic development | X10 | Retail turnover | million rubles |
| X11 | Average monthly income | ruble | |
| X12 | Consumer price composite index (December to December of the previous year) | % | |
| X13 | Industrial production index (for companies that do not involve small business entities) | % | |
| X14 | Public catering turnover (percentage of last year) | % | |
| X15 | Number of primary industry companies | - | |
| X16 | Number of second industry enterprises | - | |
| X17 | Number of tertiary industry companies | - | |
| Climate | X18 | Precipitation | mm |
| X19 | Absolute minimum temperature | °C | |
| Class | Year | |||||
|---|---|---|---|---|---|---|
| 2005 | 2010 | 2015 | ||||
| Area | Percentage | Area | Percentage | Area | Percentage | |
| Bare land | 43.78 | 0.16 | 35.47 | 0.13 | 32.26 | 0.12 |
| Construction land | 49.15 | 0.18 | 85.68 | 0.31 | 95.98 | 0.35 |
| Cultivated land | 34.10 | 0.12 | 25.29 | 0.09 | 29.17 | 0.11 |
| Forestland | 54.96 | 0.20 | 28.72 | 0.10 | 28.85 | 0.10 |
| Grass land | 44.47 | 0.16 | 37.96 | 0.14 | 15.72 | 0.06 |
| Woodland | 23.00 | 0.08 | 34.08 | 0.12 | 47.80 | 0.17 |
| Water | 26.59 | 0.10 | 27.02 | 0.10 | 24.19 | 0.09 |
| Unclassified | 1.61 | 0.01 | 3.43 | 0.01 | 3.34 | 0.01 |
| Class | Year | ||||||||
|---|---|---|---|---|---|---|---|---|---|
| 2005 | 2010 | 2015 | |||||||
| Sample Points | Producer Accuracy % | User Accuracy % | Sample Points | Producer Accuracy % | User Accuracy % | Sample Points | Producer Accuracy % | User Accuracy % | |
| Bare | 52 | 73.08 | 64.41 | 43 | 72.09 | 60.78 | 50 | 72.00 | 72.00 |
| Construction land | 99 | 71.72 | 91.03 | 95 | 81.05 | 87.50 | 54 | 77.78 | 79.25 |
| Cultivated | 40 | 75 | 61.22 | 24 | 75.00 | 60.00 | 31 | 81 | 65.79 |
| Forest | 50 | 94 | 88.68 | 55 | 70.91 | 76.47 | 51 | 75 | 80.85 |
| Grass | 50 | 82 | 69.49 | 55 | 70.91 | 66.10 | 46 | 80 | 75.51 |
| Woodland | 53 | 73.58 | 79.59 | 34 | 70.59 | 61.54 | 46 | 73.91 | 68.00 |
| Water | 50 | 94 | 100 | 45 | 73.33 | 100 | 53 | 83.02 | 100 |
| Overall accuracy % | 76.14 | 74.36 | 77.34 | ||||||
| Kappa | 0.76 | 0.70 | 0.74 | ||||||
| Land-Use Type Change | Conversion Area/km2 | Percentage of Total Conversion Area/% |
|---|---|---|
| No change | 97.98 | 35.26 |
| bare-->construction land | 21.99 | 7.91 |
| forest-->woodland | 17.03 | 6.13 |
| grass-->construction land | 17.00 | 6.12 |
| cultivated-->construction land | 13.39 | 4.82 |
| grass-->woodland | 8.46 | 3.04 |
| grass-->bare | 7.18 | 2.58 |
| bare-->cultivated | 6.84 | 2.46 |
| forest-->construction land | 6.60 | 2.38 |
| grass-->cultivated | 6.11 | 2.20 |
| cultivated-->woodland | 6.05 | 2.18 |
| construction land-->bare | 5.82 | 2.10 |
| bare-->woodland | 5.60 | 2.02 |
| cultivated-->bare | 5.45 | 1.96 |
| Others | 52.37 | 18.85 |
| 2005 | Bare | Construction Land | Cultivated | Forest | Grass | Woodland | Unclassified | Water | Total | |
|---|---|---|---|---|---|---|---|---|---|---|
| 2010 | ||||||||||
| Bare | 8.47 | 4.78 | 7.30 | 1.73 | 8.72 | 4.37 | 0.03 | 0.05 | 35.45 | |
| Construction land | 21.04 | 33.16 | 9.78 | 2.71 | 14.83 | 3.05 | 0.36 | 0.63 | 85.56 | |
| Cultivated | 4.17 | 1.84 | 5.82 | 2.98 | 6.02 | 4.38 | 0.03 | 0.04 | 25.28 | |
| Forest | 0.36 | 0.71 | 0.72 | 23.10 | 1.60 | 1.37 | 0.06 | 0.65 | 28.57 | |
| Grass | 7.92 | 6.48 | 7.79 | 3.94 | 7.95 | 3.79 | 0.18 | 0.08 | 38.13 | |
| Woodland | 1.52 | 1.17 | 2.28 | 18.58 | 4.48 | 5.85 | 0.09 | 0.22 | 34.18 | |
| Unclassified | 0.17 | 0.34 | 0.43 | 0.71 | 0.73 | 0.17 | 0.54 | 0.31 | 3.41 | |
| Water | 0.08 | 0.73 | 0.09 | 1.07 | 0.15 | 0.06 | 0.26 | 24.63 | 27.07 | |
| Total | 43.72 | 49.20 | 34.22 | 54.81 | 44.48 | 23.05 | 1.55 | 26.61 | 277.65 | |
| 2010 | Bare | Construction Land | Cultivated | Forest | Grass | Woodland | Unclassified | Water | Total | |
|---|---|---|---|---|---|---|---|---|---|---|
| 2015 | ||||||||||
| Bare | 6.92 | 9.49 | 5.01 | 1.02 | 6.40 | 2.84 | 0.17 | 0.36 | 25.29 | |
| Construction land | 12.26 | 55.13 | 5.44 | 3.05 | 14.13 | 4.97 | 0.65 | 0.32 | 95.94 | |
| Cultivated | 6.03 | 9.63 | 3.40 | 1.27 | 5.32 | 2.77 | 0.55 | 0.18 | 29.15 | |
| Forest | 1.24 | 1.48 | 1.17 | 13.83 | 1.28 | 7.42 | 0.16 | 2.25 | 28.83 | |
| Grass | 2.72 | 3.25 | 1.99 | 1.90 | 2.60 | 2.83 | 0.16 | 0.24 | 15.70 | |
| Woodland | 6.07 | 5.07 | 8.01 | 6.91 | 7.69 | 12.98 | 0.69 | 0.32 | 47.74 | |
| Unclassified | 0.06 | 1.16 | 0.16 | 0.03 | 0.56 | 0.05 | 0.61 | 0.70 | 3.33 | |
| Water | 0.08 | 0.26 | 0.02 | 0.55 | 0.06 | 0.21 | 0.41 | 22.58 | 24.16 | |
| Total | 28.47 | 85.46 | 25.21 | 28.55 | 38.04 | 34.07 | 3.39 | 26.95 | 270.14 | |
| Class | Rate of Change from 2005 to 2010 (%) | Rate of Change from 2010 to 2015 (%) |
|---|---|---|
| Bare | −3.79 | −1.81 |
| Construction land | 14.86 | 2.4 |
| Cultivated | −5.17 | 3.07 |
| Forest | −9.56 | 0.09 |
| Grass | −2.93 | −11.72 |
| Woodland | 9.63 | 8.05 |
| Water | 0.33 | −2.1 |
| Unclassified | 22.58 | −0.57 |
| District | 6.06 | 5.63 |
| Variable Name | Latent Factors | Y Variance |
|---|---|---|
| Y1 Construction land | 1 | 0.947 |
| 2 | 0.053 | |
| Y2 Forestland | 1 | 0.849 |
| 2 | 0.151 | |
| Y3 Woodland | 1 | 0.995 |
| 2 | 0.005 | |
| Y4 Grass land | 1 | 0.933 |
| 2 | 0.067 |
| Y1 Construction Land | Y2 Forest | Y3 Woodland | Y4 Grass | ||
|---|---|---|---|---|---|
| (Constant Term) | −8.402 × 10⁻¹⁷ | 3.474 × 10⁻¹⁶ | 3.098 × 10⁻¹⁶ | −6.659 × 10⁻¹⁶ | |
| Population | X1 | 0.0693 | −0.0695 | 0.0596 | −0.0493 |
| X2 | 0.1189 | −0.1618 | 0.0121 | 0.0547 | |
| X3 | −0.0421 | 0.0282 | −0.0660 | 0.0757 | |
| X4 | 0.0731 | −0.0754 | 0.0583 | −0.0447 | |
| Urban construction | X5 | 0.0457 | −0.0338 | 0.0655 | −0.0729 |
| X6 | 0.0761 | −0.0803 | 0.0511 | −0.1204 | |
| X7 | 0.0907 | −0.1039 | 0.0500 | −0.0213 | |
| X8 | 0.0751 | −0.0783 | 0.0576 | −0.0426 | |
| X9 | 0.0300 | −0.0105 | 0.0675 | −0.0853 | |
| Economic development | X10 | −0.0677 | 0.1193 | 0.0571 | −0.0410 |
| X11 | 0.0612 | −0.0567 | 0.0622 | −0.0582 | |
| X12 | 0.0398 | −0.0247 | 0.0665 | −0.0777 | |
| X13 | 0.1188 | −0.1602 | 0.0146 | 0.0505 | |
| X14 | −0.0231 | 0.0005 | −0.0680 | 0.0904 | |
| X15 | −0.0603 | 0.0552 | −0.0624 | 0.0593 | |
| X16 | 0.0159 | 0.0095 | 0.0680 | −0.0950 | |
| X17 | 0.0519 | −0.0428 | 0.0643 | −0.0670 | |
| Climate | X18 | −0.0979 | 0.1164 | −0.0453 | 0.0095 |
| X19 | 0.0194 | 0.0048 | 0.0679 | −0.0930 | |
© 2018 by the authors. Licensee MDPI, Basel, Switzerland. This article is an open access article distributed under the terms and conditions of the Creative Commons Attribution (CC BY) license (http://creativecommons.org/licenses/by/4.0/).
Share and Cite
Li, Z.; Ren, Y.; Li, J.; Li, Y.; Rykov, P.; Chen, F.; Zhang, W. Land-Use/Cover Change and Driving Mechanism on the West Bank of Lake Baikal from 2005 to 2015—A Case Study of Irkutsk City. Sustainability 2018, 10, 2904. https://doi.org/10.3390/su10082904
Li Z, Ren Y, Li J, Li Y, Rykov P, Chen F, Zhang W. Land-Use/Cover Change and Driving Mechanism on the West Bank of Lake Baikal from 2005 to 2015—A Case Study of Irkutsk City. Sustainability. 2018; 10(8):2904. https://doi.org/10.3390/su10082904
Chicago/Turabian StyleLi, Zehong, Yang Ren, Jingnan Li, Yu Li, Pavel Rykov, Feng Chen, and Wenbiao Zhang. 2018. "Land-Use/Cover Change and Driving Mechanism on the West Bank of Lake Baikal from 2005 to 2015—A Case Study of Irkutsk City" Sustainability 10, no. 8: 2904. https://doi.org/10.3390/su10082904
APA StyleLi, Z., Ren, Y., Li, J., Li, Y., Rykov, P., Chen, F., & Zhang, W. (2018). Land-Use/Cover Change and Driving Mechanism on the West Bank of Lake Baikal from 2005 to 2015—A Case Study of Irkutsk City. Sustainability, 10(8), 2904. https://doi.org/10.3390/su10082904