Article

Supply Chain Efficiency Measurement to Maintain Sustainable Performance in the Automobile Industry

1
College of Business Administration, Seoul National University, Seoul 08826, Korea
2
College of Business Administration, Incheon National University, Incheon 22012, Korea
*
Author to whom correspondence should be addressed.
Sustainability 2018, 10(8), 2852; https://doi.org/10.3390/su10082852
Submission received: 11 July 2018 / Revised: 1 August 2018 / Accepted: 5 August 2018 / Published: 10 August 2018

Abstract

:
The automobile industry is set to undergo a structural transformation in the progress toward next-generation industries that involve autonomous vehicles and connected cars. Thus, supply chain management has become increasingly important for corporate competitiveness. This study aims to identify opportunities for improving supply chain performance by quantifying the impact of suppliers on the supply chain. An analysis was conducted in two phases. First, the efficiency of 139 partners that supply automobile components to the Hyundai Motor Company was measured using the Charnes–Cooper–Rhodes model, while the efficiency of Hyundai Motor Company’s 540 supply chains comprising partners, subsidiaries, and parent companies was measured using the network epsilon-based measure model. Second, the relationship between the partner efficiency and the supply chain efficiency was analyzed using the Mann–Whitney U test and the Tobit regression model. The results showed that efficient operation of partners hampers the efficiency of the total supply chain. Thus, there may be several partners that are not committed to quality improvement, while the Hyundai Motor Company seeks to promote quality management through win–win cooperation with partners. Consequently, automakers must review their partner management system, including their performance measurement and incentive systems.

1. Introduction

The current automobile industry is undergoing structural changes because of its convergence with cutting-edge information and communication technologies—such as artificial intelligence and the Internet of Things, along with big data—in order to produce next-generation automobiles. To achieve sustainable competitiveness and maximize operational efficiency, the importance of the supply chain has been further emphasized [1]. The systematic management of the supply chain requires activities such as demand forecasting, production planning and scheduling, procurement, inventory management, and logistics to be managed at an integrated supply chain level, rather than an individual company level [2].
Over the last three decades, studies on supply chain management have traditionally focused on a cooperative supply chain and analyzed the effects of cooperation within the supply chain on the performance improvement. Such research has covered transaction cost theory, resource-based theory, knowledge-based theory, and game theory [1] for case studies on Toyota, Hewlett Packard Enterprise, and Walmart among others [3,4,5]. In addition, studies on the establishment of an efficient and sustainable supply chain have been actively conducted [6,7,8,9].
Most of the extant literature has examined the supply chain in its simplest form and identified the relationship between the buyer–supplier partnership and the supply chain performance. Nevertheless, they are limited in their evaluation of supply chain performance using the efficiency and effectiveness of individual companies. The measurement of supply chain performance must be holistically conducted, rather than being focused on the individual level. This is because in conditions where a conflict of interests arises between supply chain players, an efficient operation for one player may lead to an inefficient operation for another player in the supply chain. This would ultimately hamper the efficiency of the entire supply chain [10]. Therefore, to assess the supply chain performance, the nature of and interactions within the supply chain network all need to be taken into consideration in order to adjust and integrate the performance of supply chain players [11].
The automobile industry in Korea has a top-down (vertical) structure, where automakers exercise power over partners, which is unlike that in the U.S., where automobile suppliers have grown independently [12]. Hyundai and Kia Motors occupied over 80% of the domestic automobile market, and it leads to a heightened awareness that large conglomerates’ opportunistic practices for short-term interests pose serious threats to the survival of small- and medium-sized enterprises (SMEs). As an alternative to this status quo, policies on win–win cooperation that seek to promote mid- to long-term (sustainable) relationship and mutual growth of automakers and partners have been put forward [13].
The present study aims to empirically analyze the effects of improved competitiveness of the partners (through win–win cooperation) on the efficiency of the total supply chain. The Hyundai Motor Company has provided financial and technological assistance to its partners, leading them to actively participate in the quality improvement process. However, without integrating the supply chain, such policies are likely to cause inefficiency in the overall supply chain. We hypothesized that an efficient partner with high profitability might maintain quality only to the minimum requirement, and thereby disrupt the supply chain performance. This hypothesis was tested through a three-tier supply chain of partners, subsidiaries, and parent companies in the automobile industry. The rest of the paper is organized as follows. Section 2 examines the literature on supply chain management in the automobile industry. Section 3 describes the data envelopment analysis (DEA) model that we build. Section 4 presents data and criteria for variable selection, and summarizes the results from two DEA models that we use to evaluate the efficiency of partners and supply chains, respectively. Section 5 applies the Mann–Whitney U test and the Tobit regression model to the DEA results, and discusses the relationship between these two efficiency scores. Section 6 concludes the paper and suggests future directions.

2. Literature Review

Owing to unstable demand and excessive supply, automakers have faced immense competitive pressure. In light of the increasing need for sustainable supply chain management that allows an optimized material flow, various studies have been conducted on performance evaluation and benchmarking of supply chains [14].
The supply chain is a complex network in which multiple companies interact with one another in a business process. The evaluation of its performance can be defined as a process that measures its efficiency [15]. The most commonly used method to analyze supply chain efficiency is DEA, a non-parametric approach that estimates the relative efficiency of decision-making units (DMU) with multiple inputs and outputs [16]. DEA, unlike a typical supply chain optimization model, has an advantage—it does not require unrealistic prior consumption for variables [
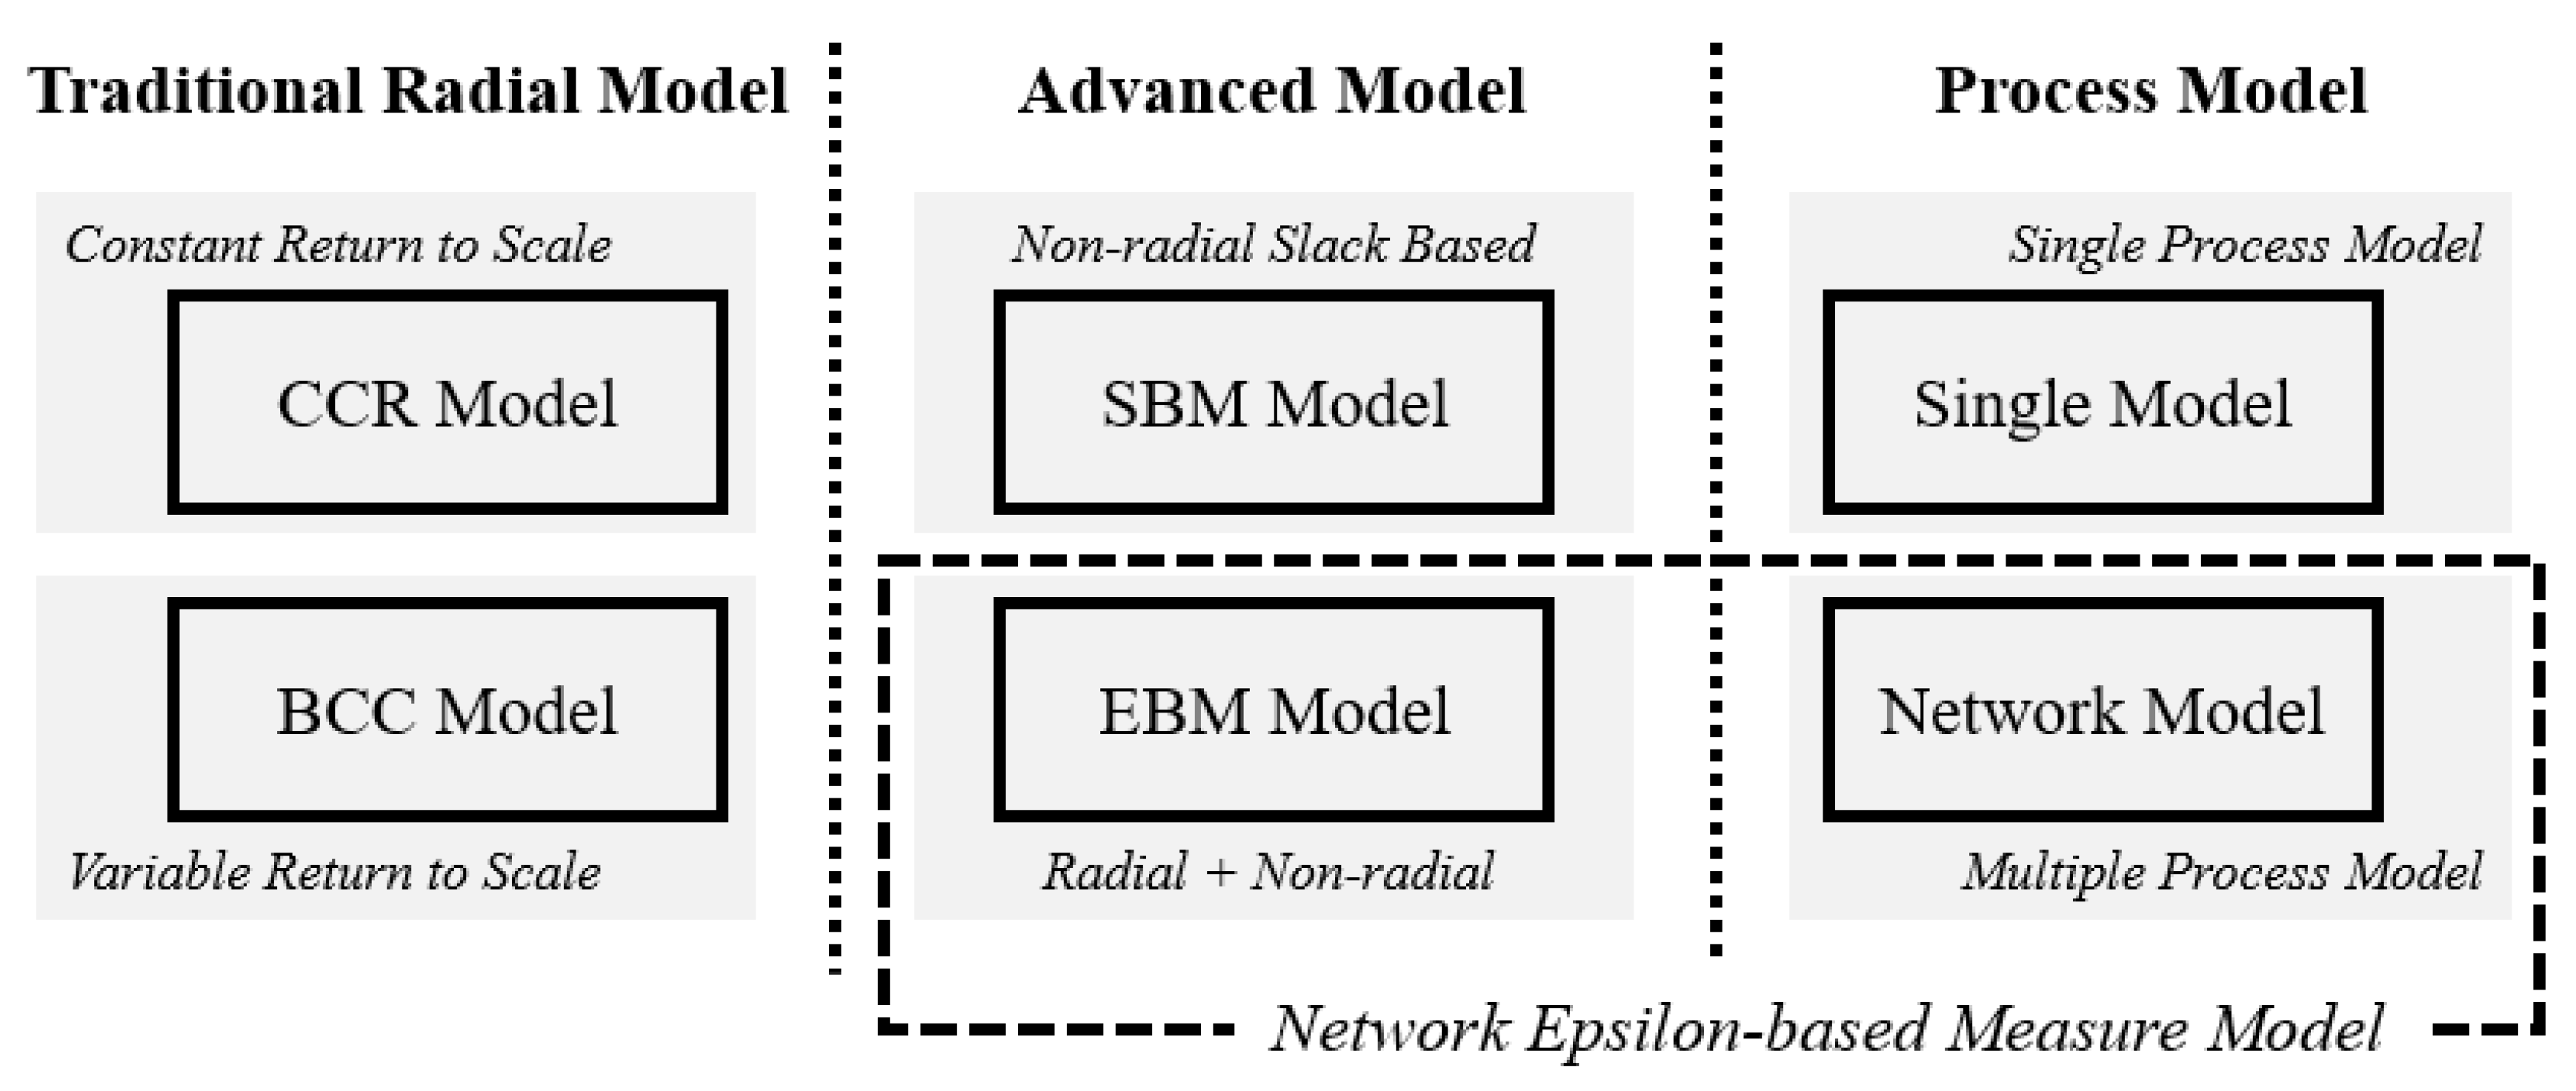
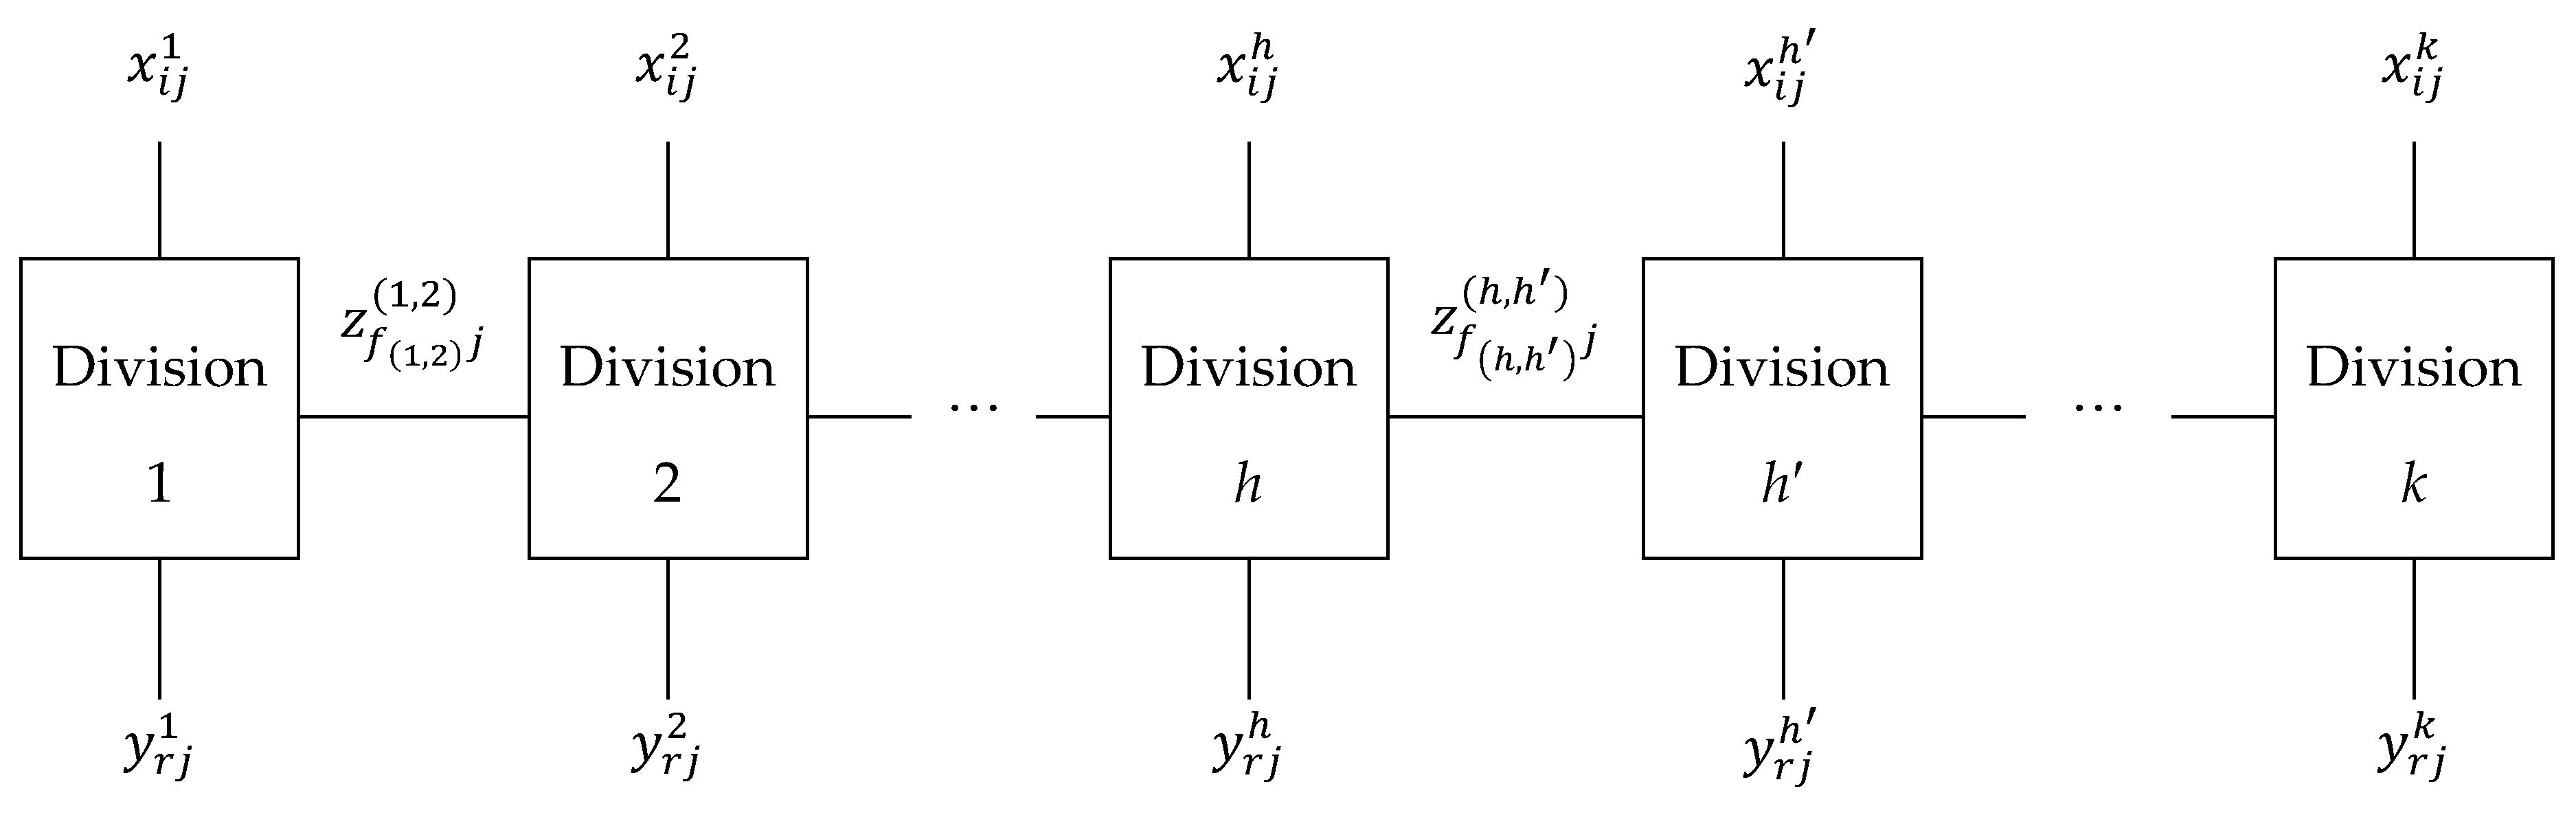
17]. However, traditional DEA models, such as Charnes–Cooper–Rhodes (CCR) and Banker–Charnes–Cooper (BCC) models, treat the production process of the DMU as a black box and have been criticized for not clearly identifying the relationship between inputs and outputs. To address this limitation, a network DEA model was developed to divide the production process of the DMU into multiple processes between the divisions and then calculate the efficiency of the entire networked system [18]. The network DEA model can deal with processes in various forms, including serial, parallel, mixed, hierarchical, and dynamic systems [19]. It can be also extended to hybrid models by combining it with other decision-making methods, such as analytic hierarchy process (AHP), stochastic programming, goal programming, and neural networks. Thus, the network DEA model is used in the banking, aviation, transport, manufacturing, and sports industries; furthermore, the scope of its application continues to gradually expand [20].
In the automobile industry, studies that utilize DEA for supply chain management have primarily evaluated the efficiency of auto parts manufacturers in relation to supplier selection. Zeydan et al. [21] used a fuzzy AHP on trunk panel manufacturers to obtain qualitative variables that were then converted into quantitative variables. These were designated as the outputs of the DEA model to measure the efficiency of suppliers and exclude inefficient suppliers. Ha and Krishnan [22] operated a supplier portfolio by conducting a cluster analysis based on qualitative and quantitative factors obtained from AHP, neural networks, and DEA in order to select competitive suppliers among automatic transmission manufacturers. Çelebi and Bayraktar [23] employed neural networks to process incomplete supplier data of a local auto assembly plant that imports components from overseas suppliers to establish evaluation criteria shared by all the DMUs. They applied DEA to form a partnership with suppliers classified as efficient DMUs to improve operational efficiency.
Several studies have identified the cause of the differences in efficiency of automobile suppliers. Talluri et al. [24] estimated the efficiency of 150 primary suppliers for three major automakers in the U.S.—GM, Ford, and Chrysler—and categorized them into three groups of high, medium, and low according to their efficiency scores. Then, they utilized a Kruskal–Wallis test to detect between-group differences in cost, quality, on-time delivery, flexibility, and innovation variables. The most efficient and least efficient groups showed a significant difference only in cost, indicating that efficient suppliers were successful in cost reduction. Manello et al. [25] examined changes in the total factor productivity of numerous companies in the Italian automobile supply chain over a four-year period after the financial crisis. They used a bootstrapped Malmquist index and reported that firms concentrating on their core business were more efficient than the others. Moreover, in contrast with SMEs, large conglomerates were located near the efficient frontier, which hindered them from benefiting from catching-up effects (emulating other companies), and thus allowed productivity improvement only by technological innovation.
Meanwhile, some studies have discussed a correlation between the supplier–automaker relationship and the supply chain efficiency. Saranga [14] investigated the Indian automobile industry; the author described a case in which a small-scale manufacturer at a low level of the supply chain had to make advanced payments for raw materials and receive after-payment for supplied components. Owing to this difficult financing environment, instead of using automated equipment, the manufacturing process was undertaken manually, which caused inefficiency in the operation of automobile suppliers. The study further suggested that, to ensure an efficient supply chain, automakers at high levels of the supply chain must provide those suppliers with financial and technological support, as well as long-term supply contracts. This would affect the cost reduction and quality improvement of the automobile supply chain. Sadjadi and Bayati [26] applied game theory to the relationship between raw material producers and auto parts manufacturers in a three-tier supply chain (raw material producers, auto parts manufacturers, and automakers). They computed supply chain efficiency in a cooperative game, where all suppliers made efforts to promote overall efficiency, and then in a non-cooperative game, where a leader maximized its efficiency and a follower made decisions sequentially, taking the efficiency of the leader as a fixed value (Stackelberg model). The results showed that the optimal efficiency of the cooperative game was greater than or equivalent to that of the non-cooperative game.
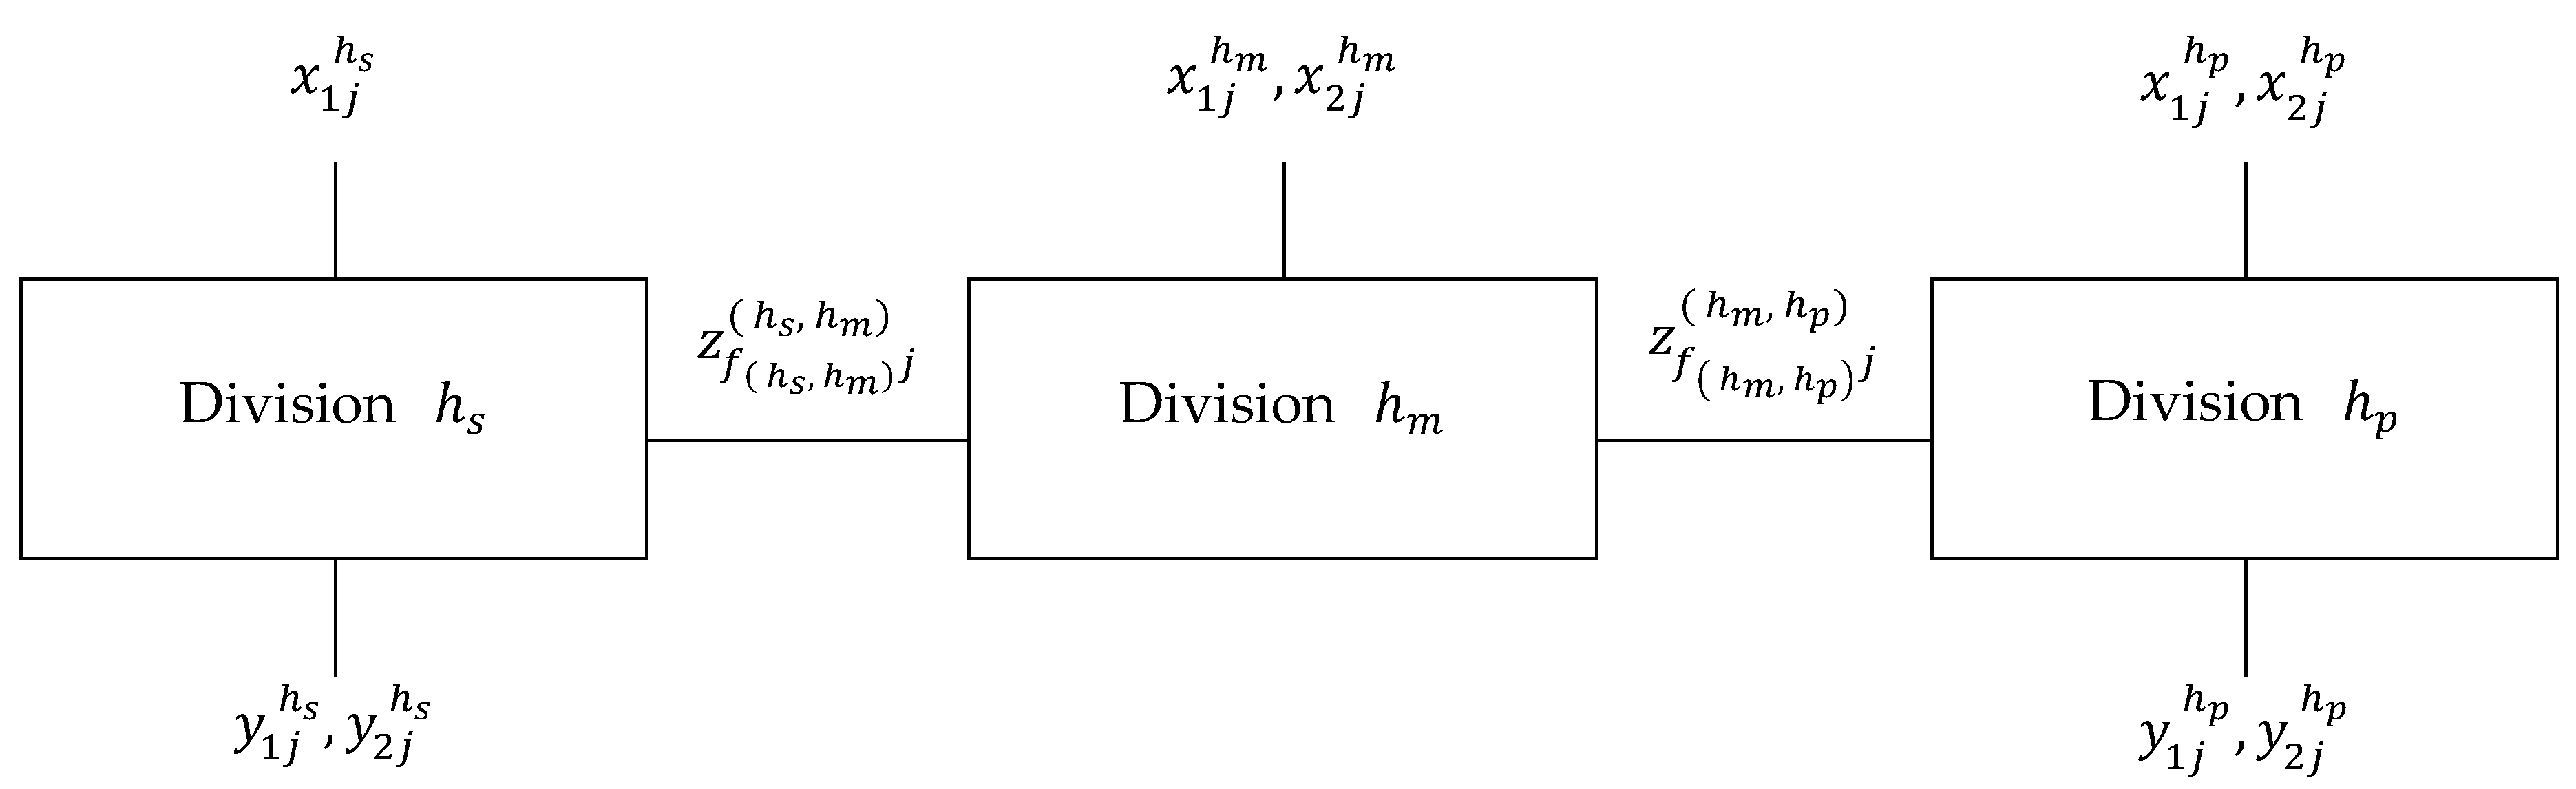
In supply chain management, decision-making by individual entities affects not only those entities, but also their counterparts, which ultimately determines the efficiency of the total supply chain. However, most previous studies on automobile supply chain have mainly focused on the individual suppliers. In addition, many studies have examined the two-tier supply chain comprising automobile suppliers and automakers. Few studies have considered a three-tier or higher supply chain. Thus, this study sets a three-tier supply chain comprising partners, subsidiaries, and parent companies. The individual and overall efficiencies of the supply chain are analyzed to verify the impact of individual entities on the supply chain.

3. Methodology

3.1. CCR Model

DEA, introduced by Charnes et al. [27], is a linear programming approach that measures the relative efficiency of the homogeneous DMU using the distance from DMU to an efficient frontier. It establishes the efficient frontier, which is a combination of optimal inputs and outputs, based on the observed data. The efficiency score of the DMU is defined as the ratio of a total weighted output to a total weighted input. The weight of inputs and outputs is estimated as a value that maximizes the efficiency score of the DMU for evaluation, under the constraint that the efficiency score of all DMUs is less than or equivalent to 1.
DEA is generally separated into two models—an input-oriented model that minimizes the input at a given output level and an output-oriented model that maximizes the output at a given input level. When a supply contract is signed between automakers and partners, the unit price, quantity, quality standards, and other details of the components to be produced by the partners are pre-determined. Therefore, we measure the partner efficiency using an input-oriented model. The DMU of the CCR model is a partner, and the efficiency score of an input-oriented CCR model with a certain number of DMUs, n, is calculated as follows:
θ * = m i n   θ , s . t . j = 1 n x i j λ j + s i = θ x i o j = 1 n y r j λ j y r o λ j 0 , s i 0 i = 1 , , m ;   r = 1 , , q ;   j = 1 , , n
where θ * is the efficiency score of the DMU0 for evaluation; x i j and y r j are the ith input (i = 1, …, m) and the rth output (r = 1, …, q) of the jth DMU (j = 1, …, n), respectively; λ is the intensity vector and s is the input slacks; m and q are the number of inputs and outputs, respectively.
The efficiency score of the CCR model θ is computed by considering all inputs and outputs of different divisions that exist in the DMUs. However, the CCR model presents a problem—as it regards the production process within the DMU as a black box, it is inadequate to capture the internal activities among divisions.

3.2. NEBM Model

The network DEA model, unlike traditional DEA models, measures the efficiency of the DMUs by reflecting the production process of converting inputs into outputs in the network structure. In the network DEA model, an output from a process that is used as an input for another process is referred to as an intermediate measure; the overall efficiency is calculated through an optimization process [19].
DEA features two models—a radial model that assumes a proportionate change of inputs and outputs and a non-radial model that assumes a non-proportionate change of inputs and outputs. However, the CCR model, which is the most typical radial model, does not consider non-radial slacks, while the slack-based measure (SBM) model, which is the most typical non-radial model, does not consider radial slacks [28]. Therefore, Tone and Tsutsui [29] suggested an epsilon-based measure (EBM) model that integrates both radial and non-radial approaches.
Tone and Tsutsui [30] developed a network slack-based measure (NSBM) model by extending the SBM model to a network structure, while Tavana et al. [15] proposed a network epsilon-based measure (NEBM) model which applied the EBM model to the network structure. The NEBM model considers all the radial and non-radial slacks. Thus, it can reflect a complex nature of a multilayered supply chain in which multiple divisions interact with one another. Moreover, as only the DMUs in which all divisions are efficient achieve an NEBM efficiency score of 1, this model can effectively discriminate between efficient and inefficient DMUs. Figure 1 summarizes the categorization with respect to the DEA approaches we utilize in this study.
In the supply chain, the partners produce and deliver automobile components to the subsidiaries according to the supply contract. Then, the subsidiaries semi-assemble the components to manufacture a module, and the parent companies assemble the modules into a finished vehicle. As the supply chain would maximize productivity with the supplied components, we measure the supply chain efficiency using an output-oriented model. The DMU of the NEBM model is a supply chain, and its structure is described in Figure 2. The efficiency score of an output-oriented NEBM model, with n DMUs consisting of k divisions, is calculated as follows:
1 / γ * = m a x θ , λ , s + h = 1 k W h ( θ h + ϵ y h r = 1 q h w r h + s r h + y r o h ) , s . t . j = 1 n x i j h λ j h x i o h ,     i = 1 , , m h ;   h = 1 , , k j = 1 n y r j h λ j h s r h + = θ h y r o h ,    r = 1 , , q h ;   h = 1 , , k j = 1 n z f ( h , h ) j ( h , h ) λ j h = z f ( h , h ) 0 ( h , h ) j = 1 n z f ( h , h ) j ( h , h ) λ j h = z f ( h , h ) 0 ( h , h ) ,    f ( h , h ) = 1 , , F ( h , h ) , ( h , h ) θ h 1 ,      h = 1 , , k λ j h 0 , s r h + 0 ,      r = 1 , , q h ;   h = 1 , , k ;   j = 1 , , n
where γ * is the efficiency score of the DMU0 for evaluation; x i j h and y r j h are the ith input (i = 1, …, m h ) and the rth output (r = 1, …, q h ) of division h (h = 1, …, k) within the jth supply chain (j = 1, …, n), respectively; λ h is the intensity vector and s h + is the output slacks corresponding to division h; m h and q h are the number of inputs and outputs of division h, respectively; z f ( h , h ) j ( h , h ) is the intermediate measure from division h to division h′ within the jth supply chain; and F ( h , h ) is the number of intermediate measures from division h and to division h′.
w r h + is the weight of the rth output in division h that satisfies r = 1 q h w r h + = 1 . ϵ y h is a parameter dependent on the degree of dispersion of the outputs in division h. W h is the weight of division h imposed by decision-makers. This study assigns W h equally to take into account the significance of partners, subsidiaries, and parent companies in a balanced manner.
The first and second constraints are for the inputs and outputs of division h, respectively. The third and fourth constraints are linking constraints for the intermediate measures between division h and division h′; they are classified into a free link where the linking activities are freely determined and a fixed link where the linking activities are kept unchanged [30]. In this study, as the divisions of the supply chain are independently operated companies, the fixed link is appropriate where all intermediate measures are determined outside the discretion of managers in each company.
ϵ y h is estimated from the dispersion of the outputs—the greater the dispersion, the greater the ϵ y h value. If the degree of dispersion between the outputs is very low, ϵ y h becomes 0, and the NEBM model changes into the network Charnes-Cooper-Rhodes (NCCR) model below.
1 / θ * = m a x θ , λ , s + h = 1 k W h θ h , s . t . j = 1 n x i j h λ j h x i o h ,     i = 1 , , m h ;   h = 1 , , k j = 1 n y r j h λ j h s r h + = θ h y r o h , r = 1 , , q h ;   h = 1 , , k j = 1 n z f ( h , h ) j ( h , h ) λ j h = z f ( h , h ) 0 ( h , h ) j = 1 n z f ( h , h ) j ( h , h ) λ j h = z f ( h , h ) 0 ( h , h ) ,    f ( h , h ) = 1 , , F ( h , h ) , ( h , h ) θ h 1 ,      h = 1 , , k λ j h 0 , s r h + 0 ,     r = 1 , , q h ;   h = 1 , , k ;   j = 1 , , n
On the contrary, if the degree of dispersion between the outputs is very high, ϵ y h becomes 1, and the NEBM model changes into the NSBM model below [30].
1 / ρ * = m a x λ , s + h = 1 k W h ( 1 + 1 q h r = 1 q h s r h + y r o h ) , s . t . j = 1 n x i j h λ j h x i o h ,     i = 1 , , m h ;   h = 1 , , k j = 1 n y r j h λ j h s r h + = y r o h ,     r = 1 , , q h ;   h = 1 , , k j = 1 n z f ( h , h ) j ( h , h ) λ j h = z f ( h , h ) 0 ( h , h ) j = 1 n z f ( h , h ) j ( h , h ) λ j h = z f ( h , h ) 0 ( h , h ) ,     f ( h , h ) = 1 , , F ( h , h ) , ( h , h ) . λ j h 0 , s r h + 0 ,     r = 1 , , q h ;   h = 1 , , k ;   j = 1 , , n
The efficiency score of the NEBM model is between the efficiency scores of the NSBM and NCCR models ( ρ N S B M * γ N E B M * θ N C C R * ). In this study, the NEBM model assumes constant returns to scale, which leads to a lower number of efficient divisions than the variable returns to scale assumption. For a particular DMU to be NEBM-efficient, all divisions must be NEBM-efficient; this increases the discriminatory power of the NEBM model [15].

4. Data and Variables

Next, we applied the CCR model to 139 partners and the NEBM model to 540 supply chains. Section 4.1 addresses the source of data. Section 4.2 selects the variables of each model to set the network structure. Section 4.3 presents the results.

4.1. Data

Based on the available data from 2015, 139 partners, six subsidiaries, and two parent companies that participate in a supply chain of the Hyundai Motor Company are selected as the sample; the total number of supply chains which they create is 540. The partners are classified into the Hyundai Motor Group’s affiliated and non-affiliated partners. They produce engines, transmission, car seats, automatic control systems, and semiconductors for vehicles. Then, the subsidiaries, which are the Hyundai Motor Group’s affiliated companies, semi-assemble the components from the partners to manufacture modules and deliver them to the parent companies. The parent companies, Hyundai Motor Company and Kia Motors, install a completed module onto the body frame of automobiles to produce finished vehicles. The two parent companies share major components and produce different lines of automobiles.
The data used in this study are collected from the Data Analysis, Retrieval and Transfer System of the Financial Supervisory Service of Korea (dart.fss.or.kr), Korea Investor’s Network for Disclosure (kind.krx.co.kr), KISLINE (www.kisline.com), job posting websites such as Career Catch (www. catch.co.kr) and Job Korea (www.jobkorea.co.kr), the Hyundai Motor Company (www.hyundai.com), Korea Auto Industries Coop. Association (www.kaica.or.kr), research reports of various securities firms, and finally, official corporate websites and newsletters.

4.2. Variables

DEA sets an efficient frontier and evaluates the relative efficiency of DMUs based only on observed data without any initial assumption for the production function. This makes the selection of adequate inputs and outputs a highly important process. The validity and discriminatory power of a DEA model exhibit a trade-off. The higher the number of inputs and outputs, the greater the amount of data involved in performance evaluation. However, as more DMUs are positioned near the efficient frontier, the discriminatory power in evaluating DMUs decreases [31]. The methods of minimizing the loss of data and addressing the issue of the discriminatory power have been discussed. One of these methods analyzes the correlation between variables to exclude the variables with a strong positive correlation [32,33].
The DMUs of the CCR model are 139 partners. To choose the inputs and outputs, we examine the extant literature on corporate performance evaluation that has applied DEA to the automobile industry. Table 1 presents the inputs and outputs used in these studies. With reference to these data, a correlation analysis is carried out to identify the relationship between the number of employees, operating cost, cost of goods sold (COGS), total assets, fixed assets, and net worth and the relationship between total gross sales, pre-tax profit, and operating profit. The variables with a strong correlation are excluded from the inputs and outputs. The inputs for the CCR model comprise the number of employees, operating cost, and fixed assets, while the output is the total gross sales. The number of employees includes regular workers, non-regular workers, and administrative staff. The operating cost is the selling, general and administrative (SG&A) expenses. The fixed assets are property, plant, and equipment. The descriptive statistics of the inputs and outputs are provided in Table 2.
The DMUs of the NEBM model are 540 supply chains that comprise 139 partners, six subsidiaries, and two parent companies, as shown in Figure 3. The inputs, outputs, and intermediate measures of the supply chain should be selected from a comprehensive perspective of the supply chain, not from a perspective of the individual company. Most partners are non-affiliated to Hyundai Motor Group; that is, they operate independently, unlike subsidiaries and parent companies that cooperate with each other. As the partners are not part of the Hyundai Motor Group, we measure the efficiency of the division h s in terms of supplier selection.
Weber et al. [38] revealed that price, quality, and delivery performance are key criteria for supplier selection. As reported in Table 3, the studies that have used DEA for supplier selection generally take the price to be the input and the quality to be the output. For delivery performance, delivery time is the input, while order fill rate is the output. In addition, other factors are taken into consideration in evaluating suppliers, including finance, relationship, flexibility, technological capability, and service [39]. However, since the partners are SMEs with a limited scope of administration, the price is selected as the input, while the quality and delivery performance are selected as the outputs. For the price, the operating profit ratio is used, which indicates the sales margin of the partners. For the quality, the score of the quality rating system managed by Hyundai Motor Company on its partners is used. For the delivery performance, the reciprocal value of the finished inventory turnover ratio is used, which is one of the efficiency metrics for delivery in the North American automotive supplier supply chain performance study [40]. A low inventory turnover ratio of the partners which signifies excessive inventory enables stable supply of automobile components.
For the subsidiaries and parent companies, the number of employees and operating cost are selected as the inputs, while the total gross sales are selected as the output, with reference to Table 1. As the parent companies are automobile export companies, the income from export sales is added as the output for the parent companies. Material flow is selected as the intermediate measure. The parameters of the supply chain are defined as below, and the descriptive statistics are displayed in Table 4.
x 1 j   h s :Operating profit ratio of the h s th partner in the jth supply chain;
y 1 j   h s :Hyundai Motor Company’s five-star quality rating system score of the h s th partner in the jth supply chain;
y 2 j   h s :Finished inventory turnover ratio of the h s th partner in the jth supply chain;
h s :Numerator of the division in the partners level ( h s = 1 , , 139 );
x 1 j   h m :Number of employees of the h m th subsidiary in the jth supply chain;
x 2 j   h m :SG&A expenses of the h m th subsidiary in the jth supply chain;
h m :Numerator of the division in the subsidiaries level ( h m = 140 , , 145 );
x 1 j   h p :Number of employees of the h p th parent company in the jth supply chain;
x 2 j   h p :SG&A expenses of the h p th parent company in the jth supply chain;
y 1 j   h p :Total gross sales of the h p th parent company in the jth supply chain;
y 2 j   h p :Export sales of the h p th parent company in the jth supply chain;
h p :Numerator of the division in the parent companies level ( h p = 146 ,   147 );
z f ( h , h ) j ( h , h ) :Material flow from division h to division h ( ( h ,   h ) ) .

4.3. Efficiency Analysis

Table 5 summarizes the efficiency scores of the CCR model for 139 partners and of the NSBM, NEBM, and NCCR models for 540 supply chains. Table 6 also presents descriptive statistics of the divisional efficiency scores of the NSBM, NEBM, and NCCR models for division h s . The result of the CCR model shows that only two of the 139 partners obtain a CCR efficiency score of 1. The best practice DMUs are S083 and S139, which form a reference set for other inefficient DMUs. The CCR efficiency score is generally low; 88 partners have a score below the average (0.3011); S018, S034, and S040 have a score less than 0.1.
The NEBM model is based on the assumptions of (a) constant returns to scale, (b) fixed links, and (c) identical weight for all divisions. In the NEBM model, only the DMUs where all divisions are efficient can be overall efficient [15]. As a result, there is no supply chain with an overall efficiency score of 1. N043, N0245, and N0281 have the highest efficiency score (0.9866); we can attribute their high overall efficiency score to the high divisional efficiency score of h s within the supply chain. The divisional efficiency scores of the NEBM model for partner S010 within supply chain N043, partner S081 within supply chain N0281, and partner S088 within supply chain N0245 are all 1. However, these partners are evaluated as inefficient DMUs in the CCR model. The CCR efficiency scores are 0.1827 for S010, 0.1507 for S081, and 0.1263 for S088, which are all below the median value (0.2387).
Unlike the NSBM and NEBM models with zero efficient supply chains, 92 of the 540 supply chains have the NCCR efficiency score of 1. This is because a radial model has a lower discriminatory power than a non-radial model [46]. As described earlier, the ϵ y h of some divisions has a positive value because of the dispersion of the outputs. The overall efficiency score of the NEBM model is between the overall efficiency scores of the NSBM and NCCR models ( ρ N S B M * γ N E B M * θ N C C R * ); the divisional efficiency score of the NEBM model is also between the divisional efficiency scores of the NSBM and NCCR models ( ρ N S B M h * γ N E B M h * θ N C C R h * ). Meanwhile, the divisional efficiency scores of 81 h s s and one h p in the NEBM and NCCR models are the same. This suggests that the ϵ y h of these divisions equals 0. As such, the NEBM model is sensitive to the dispersion of data; it evaluates DMUs considering both radial and non-radial properties [29].

5. Determinant Factors of Automobile Supply Chain Efficiency

The Hyundai Motor Company promotes quality management through win–win cooperation with its partners. It provides both financial support (raising the unit prices of components from suppliers and paying for their labor costs) as well as non-financial support (investment in research and development (R&D) and quality control of manufacturing process) to raise its partners’ competitiveness and ensure the supply of quality components. This ultimately enhances the quality competitiveness of its finished automobiles.
As the partnership with the Hyundai Motor Company strengthens, the unit prices the partner receives increase compared to the raw material cost. Thus, this allows the partner to benefit from high rates of return and improved efficiency. However, this leads to an increase in the cost of finished vehicles, which causes inefficiency in the overall supply chain [10]. When a supply contract that stipulates the terms and conditions for the supply of auto parts concludes, the partner maximizes efficiency by reducing costs of the expected revenue. However, from a total supply chain perspective, it is efficient to maximize the expected revenue by producing the maximum amount of high quality automobiles with prepaid costs. The components produced by partners are intermediate measures that are used as inputs for the next production process; therefore, their quality affects the driving performance and durability of the finished vehicles. If partners compromise the quality of their products to reduce costs, efficiency may increase at an individual company level, but it would decrease at an entire supply chain level. In this context, the following hypothesis is established.
Hypothesis. 
The partner efficiency has a negative impact on the supply chain efficiency.

5.1. Mann–Whitney U Test

As DEA is a non-parametric method in which the efficiency score does not comply with normal distribution, Golany [47] suggested applying the Mann–Whitney U test to the DEA results. The Mann–Whitney U test is thus conducted to verify the existence of statistically significant difference between the two groups divided in accordance with the aforementioned hypothesis. The results in Table 7 reveal that the NEBM efficiency score is lower in the supply chain with partners that have a CCR efficiency score of 1 than in the supply chain without such partners, at a significance level of 0.05.

5.2. Tobit Regression Model

Section 5.1 confirmed the difference in efficiency between supply chain groups with and without efficient partners. Therefore, we must clearly identify the cause of this difference. Many studies have used a regression analysis to examine the variables that affect the DEA efficiency scores [48]. However, as the DEA efficiency score (a dependent variable) is limited to a value in [0,1] and exhibits a truncated distribution from both sides, the ordinary least squares model generates biased and inconsistent estimations [49]. The Tobit regression model is thus suggested to prevent this problem. It is used when the dependent variables are bounded from below, above, or both [50]. The following equation illustrates this model:
y i * = β x i + ε i ,   y i = { y i *   i f   0 y i * 1 0   i f   y i * < 0   1   i f   y i * > 1  
where y i is the DEA efficiency score; y i * is a latent variable; x i is a vector of explanatory variables and β is a vector of estimated parameters; ε i refers to error term independent and identically distributed as N(0, σ 2 ).
We now estimate β and σ , which maximize the likelihood function L based on observations. Hence,
  L = 0 < y i < 1   P ( y i | 0 < y i < 1 ) y i = 0   P ( y i = 0 ) y i = 1   P ( y i = 1 )  
where
  P ( y i | 0 < y i < 1 ) = 1 2 π σ 2 e ( y i β x i ) 2 2 σ 2 ,
  P ( y i = 0 ) = 1 2 π σ 2 β x i e t 2 2 σ 2 d t ,  
  P ( y i = 1 ) = 1 2 π σ 2 ( 1 β x i ) e t 2 2 σ 2 d t  
In the Tobit regression model, the CCR efficiency score is an independent variable and the NEBM efficiency score is a dependent variable. The results are consistent with those of the Mann–Whitney U test. As Table 8 indicates, the CCR efficiency score of the partner has a negative impact on the NEBM efficiency score of the supply chain. In other words, the efficiency of the partner within the supply chain reduces the efficiency of the supply chain.

6. Conclusions

The main purpose of this study was to identify the impact of the partner efficiency on the overall supply chain efficiency. Under the assumption that a supply contract that specifies the unit price and quantity is signed between automakers and partners, an input-oriented CCR model was used to measure the efficiency of the individual partner, while an output-oriented NEBM model was used to measure the efficiency of the overall supply chain. Then, the relationship between the partner efficiency and the supply chain efficiency was analyzed using the Mann–Whitney U test and the Tobit regression model.
In the first phase, two types of DEA models were used. The CCR model was applied to assess the competitiveness of the individual partner. The inputs comprised the number of employees, operating cost, and fixed assets, while the output was the total gross sales. According to the results, only two of the 139 partners were identified as efficient DMUs. The CCR efficiency scores are low in general, and 63% of all partners (88 of 139) have a CCR efficiency score below the average. The NEBM model was applied to a three-tier supply chain comprising partners, subsidiaries, and parent companies. The inputs and outputs of the partners (non-affiliates of the Hyundai Motor Group) were selected based on the vendor selection criteria. The input of the partners was price, whereas the outputs were quality and delivery performance. The inputs of the subsidiaries and parent companies were the number of employees and operating cost, while the outputs were the total gross sales and export sales. The intermediate measure was material flow. The result of the NEBM model reveals that none of the 540 supply chains was located at the efficient frontier. As only the supply chains with all divisions being efficient have an NEBM efficiency score of 1, the NEBM model has higher discriminatory power than the NCCR model. In addition, the NEBM model was suitable for measuring the efficiency of a complex supply chain as its similarity to the NSBM or NCCR models increased according to the dispersion of data. It evaluated efficiency using both radial and non-radial measures.
Under a circumstance in which the unit price, quantity, quality standards, and other details are set, we suppose that partners would maintain quality only to the minimum requirement to reduce the production cost. However, as the quality of components corresponds to the output of the supply chain, a hypothesis was established—the partner efficiency at cost reduction would have a negative impact on the overall supply chain efficiency. This hypothesis was verified through non-parametric and parametric methods.
In the second phase, the Mann–Whitney U test and the Tobit regression model were used. Two groups were created: a supply chain with partners achieving a CCR efficiency score of 1 and a supply chain without such partners. Then, the Mann–Whitney U test was conducted to verify the difference in the distribution of the NEBM efficiency scores between the two groups. The Tobit regression analysis was also conducted to identify the causal relationship between the CCR efficiency score and the NEBM efficiency score. The supply chain comprising the partners with a CCR efficiency score of 1 was less efficient than the supply chain without such partners. That is, the more efficient the partner, the less efficient the total supply chain would be.
This finding implied a conflict of interests within a supply chain consisting of independent companies and therefore supported similar studies reporting the lower performance of a supply chain under non-cooperative assumption [10,26]. Moreover, the quality score of efficient partners was not higher than that of inefficient partners, which is consistent with previous studies demonstrating that efficient suppliers focus on cost reduction, not on quality improvement [24].
In contrast to the results reported here, a previous study claimed that automakers’ financial and technical support to partners would reduce supply chain inefficiency [14]. This discrepancy could be explained by differences in the industry environment. In the Indian automobile industry, manual labor was a poor substitute for automated equipment, while manufacturing processes in the Korean automobile industry were mostly automated to eliminate such inefficiencies.
The Hyundai Motor Company has increasingly pursued win–win cooperation with its partners because of political pressure and labor-management conflicts. Thus, its business strategy aims to increase its partners’ competitiveness and ultimately enhance the quality competitiveness of its finished vehicles. However, as our study reveals, the efficient operation of partners impairs the efficiency of the total supply chain. This suggests that the effects of quality improvement on the partners are lower than the support provided by the Hyundai Motor Company. Considering our findings, the automobile industry must review its partner management system (performance measurement and incentive systems) to establish a truly efficient supply chain. From a managerial point of view, this could give managers a deeper insight on designing and implementing supply chain integration. This approach also leads policymakers to a more realistic assessment for developing evaluation criteria in the automobile industry.
Even though this study utilized sharper efficiency estimates of a three-tier supply chain by applying the NEBM model, it has some limitations. In evaluating suppliers within the supply chain, a wider criterion can be adopted, while we only examined the key indices because of limited data. This would involve intangible factors such as information sharing, technological innovation, and partnership, aside from price, quality, and delivery performance. In addition, potential risks always exist in the supply chain, including the demand, production and logistics risks, and such risks may lead to data uncertainties. Thus, in future studies, methods such as fuzzy model can be used to deal with uncertainties and establish an efficient supply chain.

Author Contributions

I.K. conceived and designed the experiments and data collection. Finally, the paper was written by I.K. and revised by C.K. All authors read and approved the final manuscript.

Funding

This research received no external funding.

Conflicts of Interest

The authors declare no conflict of interest.

References

  1. Soosay, C.A.; Hyland, P. A decade of supply chain collaboration and directions for future research. Supply Chain Manag. Int. J. 2015, 20, 613–630. [Google Scholar] [CrossRef]
  2. Tavana, M.; Kaviani, M.A.; Di Caprio, D.; Rahpeyma, B. A two-stage data envelopment analysis model for measuring performance in three-level supply chains. Measurement 2016, 78, 322–333. [Google Scholar] [CrossRef]
  3. Spekman, R.E.; Kamauff, J.W., Jr.; Myhr, N. An empirical investigation into supply chain management: A perspective on partnerships. Supply Chain Manag. Int. J. 1998, 3, 53–67. [Google Scholar] [CrossRef]
  4. Handfield, R.B.; Bechtel, C. The role of trust and relationship structure in improving supply chain responsiveness. Ind. Mark. Manag. 2002, 31, 367–382. [Google Scholar] [CrossRef]
  5. Liker, J.K.; Choi, T.Y. Building deep supplier relationships. Harv. Bus. Rev. 2004, 82, 104–113. [Google Scholar]
  6. Attaran, M.; Attaran, S. Collaborative supply chain management: The most promising practice for building efficient and sustainable supply chains. Bus. Process. Manag. J. 2007, 13, 390–404. [Google Scholar] [CrossRef]
  7. Kanda, A.; Deshmukh, S.G. Supply chain coordination: Perspectives, empirical studies and research directions. Int. J. Prod. Econ. 2008, 115, 316–335. [Google Scholar]
  8. Cao, M.; Zhang, Q. Supply chain collaboration: Impact on collaborative advantage and firm performance. J. Oper. Manag. 2011, 29, 163–180. [Google Scholar] [CrossRef]
  9. Ramanathan, U.; Gunasekaran, A. Supply chain collaboration: Impact of success in long-term partnerships. Int. J. Prod. Econ. 2014, 147, 252–259. [Google Scholar] [CrossRef]
  10. Liang, L.; Yang, F.; Cook, W.D.; Zhu, J. DEA models for supply chain efficiency evaluation. Ann. Oper. Res. 2006, 145, 35–49. [Google Scholar] [CrossRef]
  11. Chen, C.; Yan, H. Network DEA model for supply chain performance evaluation. Eur. J. Oper. Res. 2011, 213, 147–155. [Google Scholar] [CrossRef]
  12. Whitley, R. East-Asian and Anglo-American business systems. In Economic Dynamism in the Asia-Pacific; Routledge: Abingdon, UK, 1998; Chapter 9; pp. 213–249. [Google Scholar]
  13. Lee, S.-Y. Win-win collaboration and supplier manufacturing performance: The mediating effects of relational social capital accumulation. Korean Manag. Rev. 2013, 42, 1105–1130. [Google Scholar]
  14. Saranga, H. The Indian auto component industry–Estimation of operational efficiency and its determinants using DEA. Eur. J. Oper. Res. 2009, 196, 707–718. [Google Scholar] [CrossRef]
  15. Tavana, M.; Mirzagoltabar, H.; Mirhedayatian, S.M.; Saen, R.F.; Azadi, M. A new network epsilon-based DEA model for supply chain performance evaluation. Comput. Ind. Eng. 2013, 66, 501–513. [Google Scholar] [CrossRef]
  16. Rajesh, G.; Mallinga, P. Supplier selection based on AHP QFD methodology. Procedia Eng. 2013, 64, 1283–1292. [Google Scholar] [CrossRef]
  17. Wong, W.P.; Jaruphongsa, W.; Lee, L.H. Supply chain performance measurement system: A Monte Carlo DEA-based approach. Int. J. Ind. Syst. Eng. 2008, 3, 162–188. [Google Scholar] [CrossRef]
  18. Färe, R.; Grosskopf, S. Network DEA. Socio-Econ. Plan. Sci. 2000, 34, 35–49. [Google Scholar] [CrossRef]
  19. Kao, C. Network data envelopment analysis: A review. Eur. J. Oper. Res. 2014, 239, 1–16. [Google Scholar] [CrossRef]
  20. Lozano, S.; Gutiérrez, E.; Moreno, P. Network DEA approach to airports performance assessment considering undesirable outputs. Appl. Math. Model. 2013, 37, 1665–1676. [Google Scholar] [CrossRef]
  21. Zeydan, M.; Çolpan, C.; Çobanoğlu, C. A combined methodology for supplier selection and performance evaluation. Expert Syst. Appl. 2011, 38, 2741–2751. [Google Scholar] [CrossRef]
  22. Ha, S.H.; Krishnan, R. A hybrid approach to supplier selection for the maintenance of a competitive supply chain. Expert Syst. Appl. 2008, 34, 1303–1311. [Google Scholar] [CrossRef]
  23. Çelebi, D.; Bayraktar, D. An integrated neural network and data envelopment analysis for supplier evaluation under incomplete information. Expert Syst. Appl. 2008, 35, 1698–1710. [Google Scholar] [CrossRef]
  24. Talluri, S.; Vickery, S.K.; Droge, C.L. Transmuting performance on manufacturing dimensions into business performance: An exploratory analysis of efficiency using DEA. Int. J. Prod. Res. 2003, 41, 2107–2123. [Google Scholar] [CrossRef]
  25. Manello, A.; Calabrese, G.G.; Frigero, P. Technical efficiency and productivity growth along the automotive value chain: Evidence from Italy. Ind. Corp. Chang. 2015, 25, 245–259. [Google Scholar] [CrossRef]
  26. Sadjadi, S.; Bayati, M.F. Two-tier supplier base efficiency evaluation via network dea: A game theory approach. Int. J. Eng.-Trans. A Basics 2016, 29, 931–938. [Google Scholar]
  27. Charnes, A.; Cooper, W.W.; Rhodes, E. Measuring the efficiency of decision making units. Eur. J. Oper. Res. 1978, 2, 429–444. [Google Scholar] [CrossRef]
  28. Xu, X.; Cui, Q. Evaluating airline energy efficiency: An integrated approach with network epsilon-based measure and network slacks-based measure. Energy 2017, 122, 274–286. [Google Scholar] [CrossRef]
  29. Tone, K.; Tsutsui, M. An epsilon-based measure of efficiency in DEA–A third pole of technical efficiency. Eur. J. Oper. Res. 2010, 207, 1554–1563. [Google Scholar] [CrossRef]
  30. Tone, K.; Tsutsui, M. Network DEA: A slacks-based measure approach. Eur. J. Oper. Res. 2009, 197, 243–252. [Google Scholar] [CrossRef] [Green Version]
  31. Hollingsworth, B.; Parkin, D. The efficiency of Scottish acute hospitals: An application of data envelopment analysis. Math. Med. Boil. A J. IMA 1995, 12, 161–173. [Google Scholar] [CrossRef]
  32. Kao, C.; Chang, P.L.; Hwang, S.N. Data envelopment analysis in measuring the efficiency of forest management. J. Environ. Manag. 1993, 38, 73–83. [Google Scholar] [CrossRef]
  33. Saen, R.F.; Memariani, A.; Lotfi, F.H. The effect of correlation coefficient among multiple input vectors on the efficiency mean in data envelopment analysis. Appl. Math. Comput. 2005, 162, 503–521. [Google Scholar] [CrossRef]
  34. Maritz, A.; Shieh, C.J. Performance analysis of automobile industry in Taiwan with data envelopment analysis. Int. J. Appl. Math. Stat. 2013, 38, 84–95. [Google Scholar]
  35. Bhaskaran, E. The productivity analysis of Chennai automotive industry cluster. J. Inst. Eng. (India) Ser. C 2014, 95, 239–249. [Google Scholar] [CrossRef]
  36. Wang, C.N.; Nguyen, X.T.; Wang, Y.H. Automobile industry strategic alliance partner selection: The application of a hybrid DEA and grey theory model. Sustainability 2016, 8, 173. [Google Scholar] [CrossRef]
  37. Sahoo, P.K.; Rath, B.N. Productivity growth, efficiency change and source of inefficiency: Evidence from the Indian automobile industry. Int. J. Automot. Technol. Manag. 2018, 18, 59–74. [Google Scholar] [CrossRef]
  38. Weber, C.A.; Current, J.R.; Benton, W.C. Vendor selection criteria and methods. Eur. J. Oper. Res. 1991, 50, 2–18. [Google Scholar] [CrossRef]
  39. Choi, T.Y.; Hartley, J.L. An exploration of supplier selection practices across the supply chain. J. Oper. Manag. 1996, 14, 333–343. [Google Scholar] [CrossRef]
  40. North American Automotive Supplier Supply Chain Performance Study; PricewaterhouseCoopers: London, UK, 2013; Available online: https://www.pwc.com/gx/en/automotive/assets/automotive-supplier-supply-chain.pdf/ (accessed on 29 October 2016).
  41. Liu, J.; Ding, F.Y.; Lall, V. Using data envelopment analysis to compare suppliers for supplier selection and performance improvement. Supply Chain Manag. Int. J. 2000, 5, 143–150. [Google Scholar] [CrossRef]
  42. Talluri, S.; Narasimhan, R.; Nair, A. Vendor performance with supply risk: A chance-constrained DEA approach. Int. J. Prod. Econ. 2006, 100, 212–222. [Google Scholar] [CrossRef]
  43. Ramanathan, R. Supplier selection problem: Integrating DEA with the approaches of total cost of ownership and AHP. Supply Chain Manag. Int. J. 2007, 12, 258–261. [Google Scholar] [CrossRef]
  44. Hasan, M.A.; Shankar, R.; Sarkis, J. Supplier selection in an agile manufacturing environment using data envelopment analysis and analytical network process. Int. J. Logist. Syst. Manag. 2008, 4, 523–550. [Google Scholar] [CrossRef]
  45. Dotoli, M.; Epicoco, N.; Falagario, M.; Sciancalepore, F. A stochastic cross-efficiency data envelopment analysis approach for supplier selection under uncertainty. Int. Trans. Oper. Res. 2016, 23, 725–748. [Google Scholar] [CrossRef]
  46. Zhou, P.; Poh, K.L.; Ang, B.W. A non-radial DEA approach to measuring environmental performance. Eur. J. Oper. Res. 2007, 178, 1–9. [Google Scholar] [CrossRef]
  47. Brockett, P.L.; Golany, B. Using rank statistics for determining programmatic efficiency differences in data envelopment analysis. Manag. Sci. 1996, 42, 466–472. [Google Scholar] [CrossRef]
  48. Banker, R.D.; Zheng, Z.E.; Natarajan, R. DEA-based hypothesis tests for comparing two groups of decision making units. Eur. J. Oper. Res. 2010, 206, 231–238. [Google Scholar] [CrossRef]
  49. Tariq, Y.B.; Abbas, Z. Compliance and multidimensional firm performance: Evaluating the efficacy of rule-based code of corporate governance. Econ. Model. 2013, 35, 565–575. [Google Scholar] [CrossRef]
  50. Hoff, A. Second stage DEA: Comparison of approaches for modelling the DEA score. Eur. J. Oper. Res. 2007, 181, 425–435. [Google Scholar] [CrossRef]
Figure 1. Data envelopment analysis (DEA) method categorization. CCR: Charnes–Cooper–Rhodes; BCC: Banker–Charnes–Cooper; SBM: slack-based measure; EBM: epsilon-based measure.
Sustainability 10 02852 g001
Figure 2. General structure of the supply chain.
Sustainability 10 02852 g002
Figure 3. Supply chain structure.
Sustainability 10 02852 g003
Table 1. Inputs and outputs of previous studies on the automobile industry. DMUs: decision-making units.
Authors (year)DEA Model InputsDEA Model OutputsNumber of DMUs
Saranga (2009) [14]1. Raw material1. Gross income34
1. Labor
3. Capital
4. Sundry expenses
Maritz (2013) [34]1. Number of employees1. Operating income6
1. Operating cost
3. Gross asset
Bhaskaran (2014) [35]1. Net worth1. Annual sales100
1. Employment
3. Fixed assets
Wang et al. (2016) [36]1. COGS1. Revenues20
1. Operating expenses1. Total equity
3. Fixed assets3. Net incomes
4. Long-term investment
Sahoo and Rath (2018) [37]1. Raw materials cost1. Total gross sales20
1. Labor cost
3. Net fixed Asset
4. Energy cost
Table 2. Descriptive statistics of inputs and outputs.
Input MeasuresOutput Measures
Number of EmployeesOperating CostFixed AssetsTotal Gross Sales
Average47435,044,057146,943,202446,351,875
Median35015,043,37672,218,825211,426,813
St. dev.49466,448,508236,959,190769,312,993
Max4,307501,529,1081,784,196,5685,558,080,871
Min471,836,1845,688,21125,172,709
Table 3. Inputs and outputs for supplier selection.
Authors (year)DEA Model InputsDEA Model Outputs
Liu et al. (2000) [41]1. Price index1. Quality
1. Delivery performance1. Supplier variety
3. Distance factor
Talluri et al. (2006) [42]1. Price1. Quality
1. Delivery performance
Ramanathan (2007) [43]1. Total cost1. Quality
1. Service
3. Technology
Hasan et al. (2008) [44]1. Net price1. Quality
1. Lead time1. Quality benefits
3. Service
Dotoli et al. (2016) [45]1. Price1. Quality
1. Lead time1. Reliability
3. Distance
Table 4. Descriptive statistics of inputs, outputs, and intermediate measures.
DMUDivision h s Division h m
InputOutputsInputs
  x 1 j   h s   y 1 j   h s   y 2 j   h s   x 1 j   h m   x 2 j   h m
Average0.03324830.03741172,014,454
Median0.03125810.033133426,982
St. dev.0.0291330.02421535,833,982
Max0.09906900.1288677479,056,091
Min−0.19030800.001191617
DMUDivision h p Intermediate
InputsOutputs
  x 1 j   h p   x 2 j   h p   y 1 j   h p   y 2 j   h p   z f (   h s ,   h m ) j (   h s ,   h m )   z f (   h m ,   h p ) j (   h m ,   h p )
Average233,137,13513,739,9468,292,15910,560,03145,280,252
Median5765,0462,905,4421,716,1362,235,82013,664,184
St. dev.618,564,54039,287,72623,319,97730,030,282101,100,765
Max605106,978,039518,284,069292,719,924389,460,5161,104,962,541
Min11,8554,3552,7893,43257,931
Table 5. Descriptive statistics of the CCR, network SBM (NSBM), network EBM (NEBM), and network CCR (NCCR) efficiency scores.
Efficiency ScoreCCRNSBMNEBMNCCR
Average0.301100.072240.092410.96253
Median0.238690.033220.046050.98801
St. dev.0.180460.125170.145120.03683
Max1.00000.954240.986571.0000
Min0.059760.000370.000410.90500
The number of efficient DMU20091
Table 6. Descriptive statistics of the hs divisional efficiency scores of the NSBM, NEBM, and NCCR models.
Efficiency ScoreNSBMNEBMNCCR
Average0.045920.058190.05901
Median0.016930.023580.02421
St. dev.0.117140.127320.12812
Max1.00001.00001.0000
Min0.000190.000200.00021
Table 7. Mann–Whitney U test.
VariableMann–Whitney U
MeanZ Ratiop-Value
Involved CCR efficient partners0.012143.4570.001 **
Not involved0.09393
Note: ** statistically significant at the 0.05 level.
Table 8. Tobit regression model result.
VariableCoefficientStandard ErrorZp-Value
Const.0.1530.01212.8150.000
CCRI−0.2010.034−5.8850.000 **
Log(scale)1.7180.3105.5360.000 **
Note: ** statistically significant at the 0.05 level.

