Article

Niche Evolution of China’s Provincial Social–Economic–Natural Complex Ecosystems, 2005–2015

1
Key Laboratory of Urban Environment and Health, Institute of Urban Environment, Chinese Academy of Sciences, Xiamen 361021, China
2
University of Chinese Academy of Sciences, Beijing 100049, China
*
Author to whom correspondence should be addressed.
Sustainability 2018, 10(8), 2824; https://doi.org/10.3390/su10082824
Submission received: 11 July 2018 / Revised: 5 August 2018 / Accepted: 7 August 2018 / Published: 9 August 2018
(This article belongs to the Section Sustainable Urban and Rural Development)

Abstract

:
The ecological niche of a complex regional ecosystem reflects the fit of various human activities and the advantages and disadvantages of the environment in the region. This study examined China’s comprehensive niches of the compound social–economic–natural ecological system during the “11th Five-Year” and “12th Five-Year” periods using a Full Permutation Polygon Synthetic Indicator method. The results showed that before the 11th Five-Year period, the levels of comprehensive niches in the country were generally low, and, by the end of the 11th Five-Year period, the comprehensive niche levels in Beijing, Tianjin, and the eastern coastal regions each exceeded 0.40. During the 12th Five-Year period, after the ecological civilization construction plans were implemented, the average national comprehensive ecological level reached 0.57, the comprehensive ecological niche levels in eastern coastal areas reached more than 0.84, those in southern regions and some developed middle and western regions were greater than 0.72, and, in central regions, the levels were between 0.50–0.70. This shows that the concept of compound sustainable natural–societal–economic ecosystem development was incorporated into planning and used to guide local policies and assessment criteria for regional development. This paper compares the advantages and disadvantages of regional development plans through time, and can be used to promote coordinated and sustainable regional development.

1. Introduction

While providing material wealth and comfortable living conditions for people, rapid urbanization in China also brings environmental problems, including pollution, resource shortages, energy consumption, and so on [1,2,3]. Therefore, sustainable development is urgently needed for China’s urbanization [4]. The niche of a regional compound ecosystem refers to the overall collection of various ecological factors and relationships that are provided for and can be used by people [5]. It reflects the fit of various human activities and the advantages and disadvantages of a region in terms of its resources and environment. In addition, it determines the attractiveness of a region for different types of economic activities and people [6]. Therefore, studies of niches in complex ecosystems can help guide human activities and promote the sustainable development of a region.
Human society is essentially a population-resource-environment complex ecosystem with human behavior as the dominant factor, the natural environment as a supporting factor, resource flow as a lifeline, and the social system as the meridian [5,7]. Analysis of an ecological niche involves many elements such as resources, environment, economy, and society [8,9,10]. To better evaluate the ecological niche of a complex regional ecosystem, it is necessary to establish a suitable index system and adopt an appropriate evaluation method. Thus, we propose two categories to evaluate the ecological niche of a compound ecosystem. The first category focuses on evaluation index systems for sustainable urban development, and the second category concentrates on evaluation methods.
To date, many studies have focused on developing evaluation index systems for sustainable urban development at home and abroad. Early index systems pay most attention to constructing theoretical frameworks for sustainable development, as seen in the “Driving Force-State-Response” model proposed by The United Nations Commission on Sustainable Development [11], the ”Society-Economy-Environment” framework developed by United Nations Environment Program [12], and the “Pressure-State-Response” model employed by the Organization for Economic Cooperation and Development [13]. These frameworks have been used as references for many countries and communities to develop their own systems to meet actual demands at different scales (national, regional, urban, or local), including for European Union countries [14,15,16,17,18], Singapore [19], the United States (US) [20], Iran [21], Caribbean nations [22], and so on. Based on China’s specific conditions and goals, different agencies in China also built index systems with Chinese characteristics [23,24,25]. At the same time, many scholars began to study sustainable development in China [26,27,28,29,30,31,32,33,34,35,36,37,38]. As an important development mode, the growth of urban agglomerations and regions have also garnered attention from researchers [39,40,41,42]. Previous studies that evaluated ecological civilization construction in China, a developing country, have mainly focused on static research based on cross-sectional data, single sample dynamic research based on time series data, and single index variable research based on panel data. Few studies have been based on multi-sample, multi-time span, and multi-index variables in China. The study would be a good supplement to the existing literature.
In recent years, even though various methods have been proposed, an appropriate evaluation method has still not been established [43]. For example, Cai and Shang used a principal component analysis to evaluate the urban sustainable development of Harbin city in China [44]; Wu et al. put forward a super-efficiency Data Envelopment Analysis window analytical method to dynamically evaluate the circular economy efficiency of 30 regions in China from 2005 to 2010 [45]; and Li et al. used a super-efficiency slacks-based measure model with undesirable outputs to measure regional environmental efficiency in China [46]. However, all of these methods are greatly influenced by sample size and structure. In addition, there are other evaluation methods that should be considered, such as the analytic hierarchy process, ecological footprint analysis, Delphi method, and the Technique for Order Performance by Similarity to Idea Solution method [47,48,49]. Most of these evaluation methods start from a single viewpoint and lack a time dimension; therefore, the resulting evaluation indexes do not reflect dynamic changes. Moreover, the results obtained using these methods depend on weighting, leading to the lack of an objective scientific basis for the evaluation and results that do not reflect the actual situation. To overcome the above deficiencies, our study adopted a comprehensive “Full Permutation Polygon Synthetic Indicator” method [50]. This approach combines a large number of individual indicators into a single sustainability index that allows both static analysis (comparisons within a single year) and dynamic analysis (trends over time). The method offers both simplicity (these data are usually readily available) and comprehensiveness (the method combines many factors). This method not only can be presented in a geometric intuitionistic diagram, it also has algebraic analytical value. In addition, it reduces subjective randomness relative to that in the traditional simple weighting method.
The goal of this study was to compare the advantages and disadvantages of regional development through time. Therefore, a three-level social-economic-natural compound niche evaluation index system that includes target, sub-target, and indicator layers was established to evaluate provincial resources, as well as environmental, economic, and societal subsystem niches and the comprehensive niches of compound ecological systems during the 11th Five-Year and 12th Five-Year periods. The findings of this study can be used to promote coordinated and sustainable regional development.
This paper is organized as follows: Section 2 introduces the materials and methods, including the study area and data sources, the construction of an index system, and the Full Permutation Polygon Synthetic Indicator method. Section 3 presents the results of the spatio-temporal dynamic analysis of each subsystem’s niche and the comprehensive niche. The discussion is elaborated in Section 4. Finally, conclusions, a discussion of study limitations, and proposed future work are presented in Section 5.

2. Materials and Methods

2.1. Study Area and Data Sources

This study included 31 provinces, municipalities, and autonomous regions in mainland China (excluding Hong Kong, Macao, and Taiwan) (Figure 1) for an analysis of the regional spatial-temporal evolution and driving forces of resource, environmental, economic, and social niches, as well as the natural-economic-social complex niche, during the 11th Five-Year (2006–2010) and 12th Five-Year periods (2011–2015). To ensure the availability, authority, consistency, and sustainability of the research data, these data were obtained mainly from the Chinese Statistical Yearbook, the China Environmental Statistics Yearbook, the Chinese Urban Statistical Yearbook, the China Energy Statistics Yearbook, and other official statistics yearbooks. We ranked the individual indicator values of different provinces in China in 2005–2015 from large to small, using 5%, 50% (the median), and 95%, in turn, as the upper, critical, and lower thresholds of the corresponding indicator. Using 5% and 95% as the upper and lower limit values, respectively, can eliminate the influence of extreme values [51].

2.2. Construction of An Index System

Human society is essentially a population-resource-environment complex ecosystem with human behavior as the dominant factor, the natural environment as a supporting factor, resource flow as a lifeline, and the social system as the meridian [5,7]. Analysis of an ecological niche involves many elements such as resources, environment, economy, and society [8,9,10]. This study incorporated domestic and foreign indicators that have been used to evaluate sustainable cities and ecological cities, following the principles of science, feasibility, independence, completeness, simplicity, hierarchy, acceptability, and stability [52,53]. A three-level social-economic-natural compound niche evaluation index comprised of target, sub-target, and indicator layers and representing the resources, environment, economy, and society was then constructed. The target layer is the comprehensive niche of the compound ecosystem, the sub-target layer includes the niches of the resources, environment, economy, and society, and the indicator layer comprises the individual indicators for the corresponding niches. The resource niche includes nine indicators that reflect the advantages and disadvantages of the region in terms of resource endowments and utilization, and mainly includes improving resource use efficiency, promoting energy revolution, and facilitating resource recycling. The environmental niche includes 11 indicators that reflect the advantages and disadvantages of the region in terms of natural ecosystem protection and restoration, as well as environmental governance and protection, and mainly includes ecology protection, pollutant emission reduction, and pollution control. The economic niche includes 10 indicators that indicate the advantages and disadvantages of the region in terms of new economic developments such as technological innovation, economic structural adjustment and optimization, and an open economy. The social niche mainly includes 12 indicators that reflect the advantages and disadvantages of a region regarding education, medical service, health, social security, quality of life, urban and rural living facilities, and green travel. The indicators are divided into two types: positive indicators and negative indicators. For a positive indicator, the larger the value, the better the niche; for a negative indicator, the smaller, the better (Table 1).

2.3. A Full Permutation Polygon Synthetic Indicator Method

The definition of the Full Permutation Polygon Synthetic Indicator method is as follows. There are a total of n indicators (normalized values) that form a central n-sided polygon with the upper limit of these indicators as its radius. The line of each indicator forms an irregular n-sided polygon, and its vertex is a head-to-tail full arrangement of n indicators. The n indicators can collectively constitute (n−1)!/2 different irregular n-sided polygons. The composite index is defined as the ratio of the mean of all irregular polygonal areas to the area of the central polygon [26,50,54,55].
Index values were standardized as follows:
F ( x ) = a x + b x + c , a 0 , x 0
F (x) satisfies:
F ( x ) | x = L = 1 ,   F ( x ) | x = T = 0 ,   F ( x ) | x = U = 1
In the formula, L, T, and U are the lower limit, critical value, and upper limit, respectively, of X. In accordance with the three conditions above, it is possible to use the normalization function F(x), shown in the calculation below, to map the index value of the interval [L, U] to the [−1, 1] interval to change the growth rate of the index:
F ( x ) = ( U L ) ( x T ) ( U + L 2 T ) x + U T + L T 2 U L , x [ L , U ]
When the index value is below the critical value, the growth rate of the standardized index gradually decreases. When the index is above the threshold, the growth rate of the standardized index gradually increases.
For the i-th indicator, the normalized calculation formula is as follows:
S i = ( U i L i ) ( x i T i ) ( U i + L i 2 T i ) x i + U i T i + L i T i 2 U i L i
Using n indicators, we can construct a central positive n-sided polygon. The n vertices of the polygon are the values when Si = 1, the central point is the value when Si = −1, and the line segment from the center point to the vertex is in the interval [−1, +1] of the normalized value of each indicator. The polygon is the critical region of the index when Si = 0. When the value of the internal area of the critical region is negative, the standardized value of each indicator is below the critical value; when the value of the external region is positive, the standardized value of each indicator is above the critical value (Figure 2).
The formula for calculating the composite index of the full permutation polygon is as follows:
S = i j i , j ( S i + 1 ) ( S j + 1 ) 2 n ( n 1 )
In the formula, Si and Sj are the index values of the i-th and j-th sub-index values, respectively, and S is the comprehensive index value. According to the principle of the Full Permutation Polygon Synthetic Indicator method, the value of S is between [0−1], and the larger the S value, the better.
To qualitatively characterize the ecological niche level, the composite indicator values were divided into the four levels shown in Table 2 [50].

3. Results

The study covers the 11th Five-Year and 12th Five-Year periods, which were important historical stages when the “ecological civilization” concepts were proposed and sublimated, respectively. We considered 2005 to be the base year of ecological civilization construction during the 11th Five-Year period, 2010 to be the achievement year of the 11th Five-Year period and the base year of the 12th Five-Year ecological civilization construction, and 2015 to be the achievement year of the 12th Five-Year period of ecological civilization construction. In addition, combined with national and local five-year development plans, the policy drivers and concrete reasons for the evolution of niches were analyzed to provide a basis for decisions in regional coordination and sustainable development for ecological civilization construction.

3.1. Spatio-Temporal Dynamic Analysis of Each Subsystem’s Niche

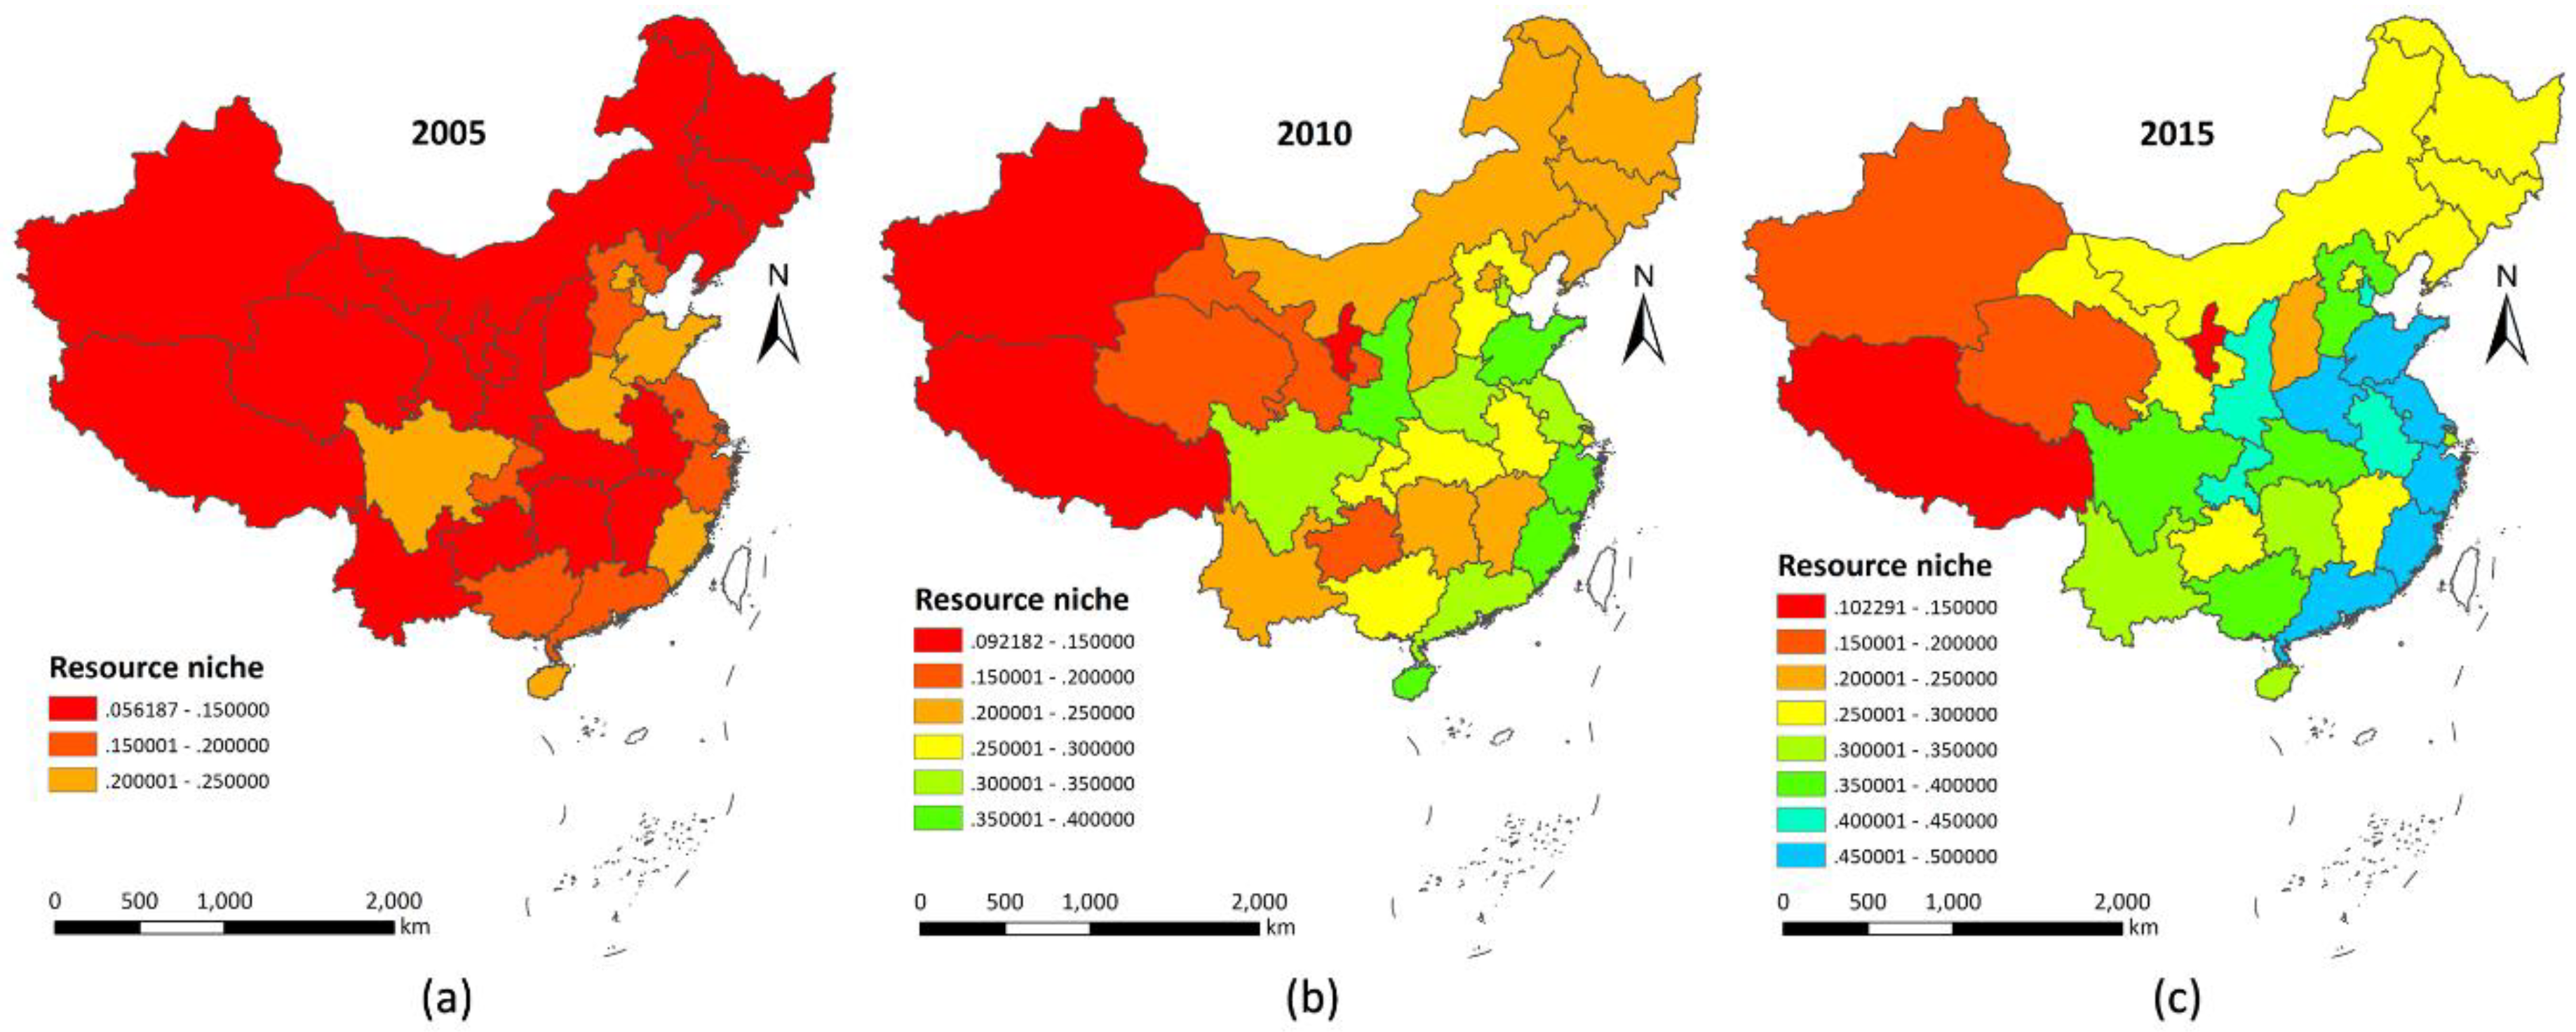
3.1.1. Resource Niche

In the base year of the 11th Five-Year period (2005), the country’s resource niche indexes were generally low, and the regions with high resource niche indexes were mainly concentrated in Beijing, Tianjin, Shandong, Jiangsu, Zhejiang, and Fujian (Figure 3a). By the end of the 11th Five-Year period (2010), after the National Environmental Protection Plan and the National Economic and Social Development Plan both reevaluated resource utilization efficiency and environmental protection to change economic growth, the resource niche index of the eastern coastal region had reached 0.30 or more for the first time. With the adjustment in resource utilization and industrial transformation, the resource niches in the central and western regions showed obvious improvements and enhancements (Figure 3b). The 18th National Congress of the Communist Party of China named ecological civilization construction as the foundation for social progress and economic development. By the end of the 12th Five-Year period (2015), the country’s regional resource niches had improved significantly. Specifically, the resource niche indexes of coastal provinces such as Shandong, Jiangsu, Zhejiang, Fujian, Guangdong, and Guangxi, and developed inland regions such as Shaanxi and Chongqing, surpassed 0.40 for the first time. In addition, the ecological niche indexes of the central regions such as Hunan, Hubei, and Jiangxi also improved significantly. They were nearly double that of the base year of the 12th Five-Year period (2010) (Figure 3c).

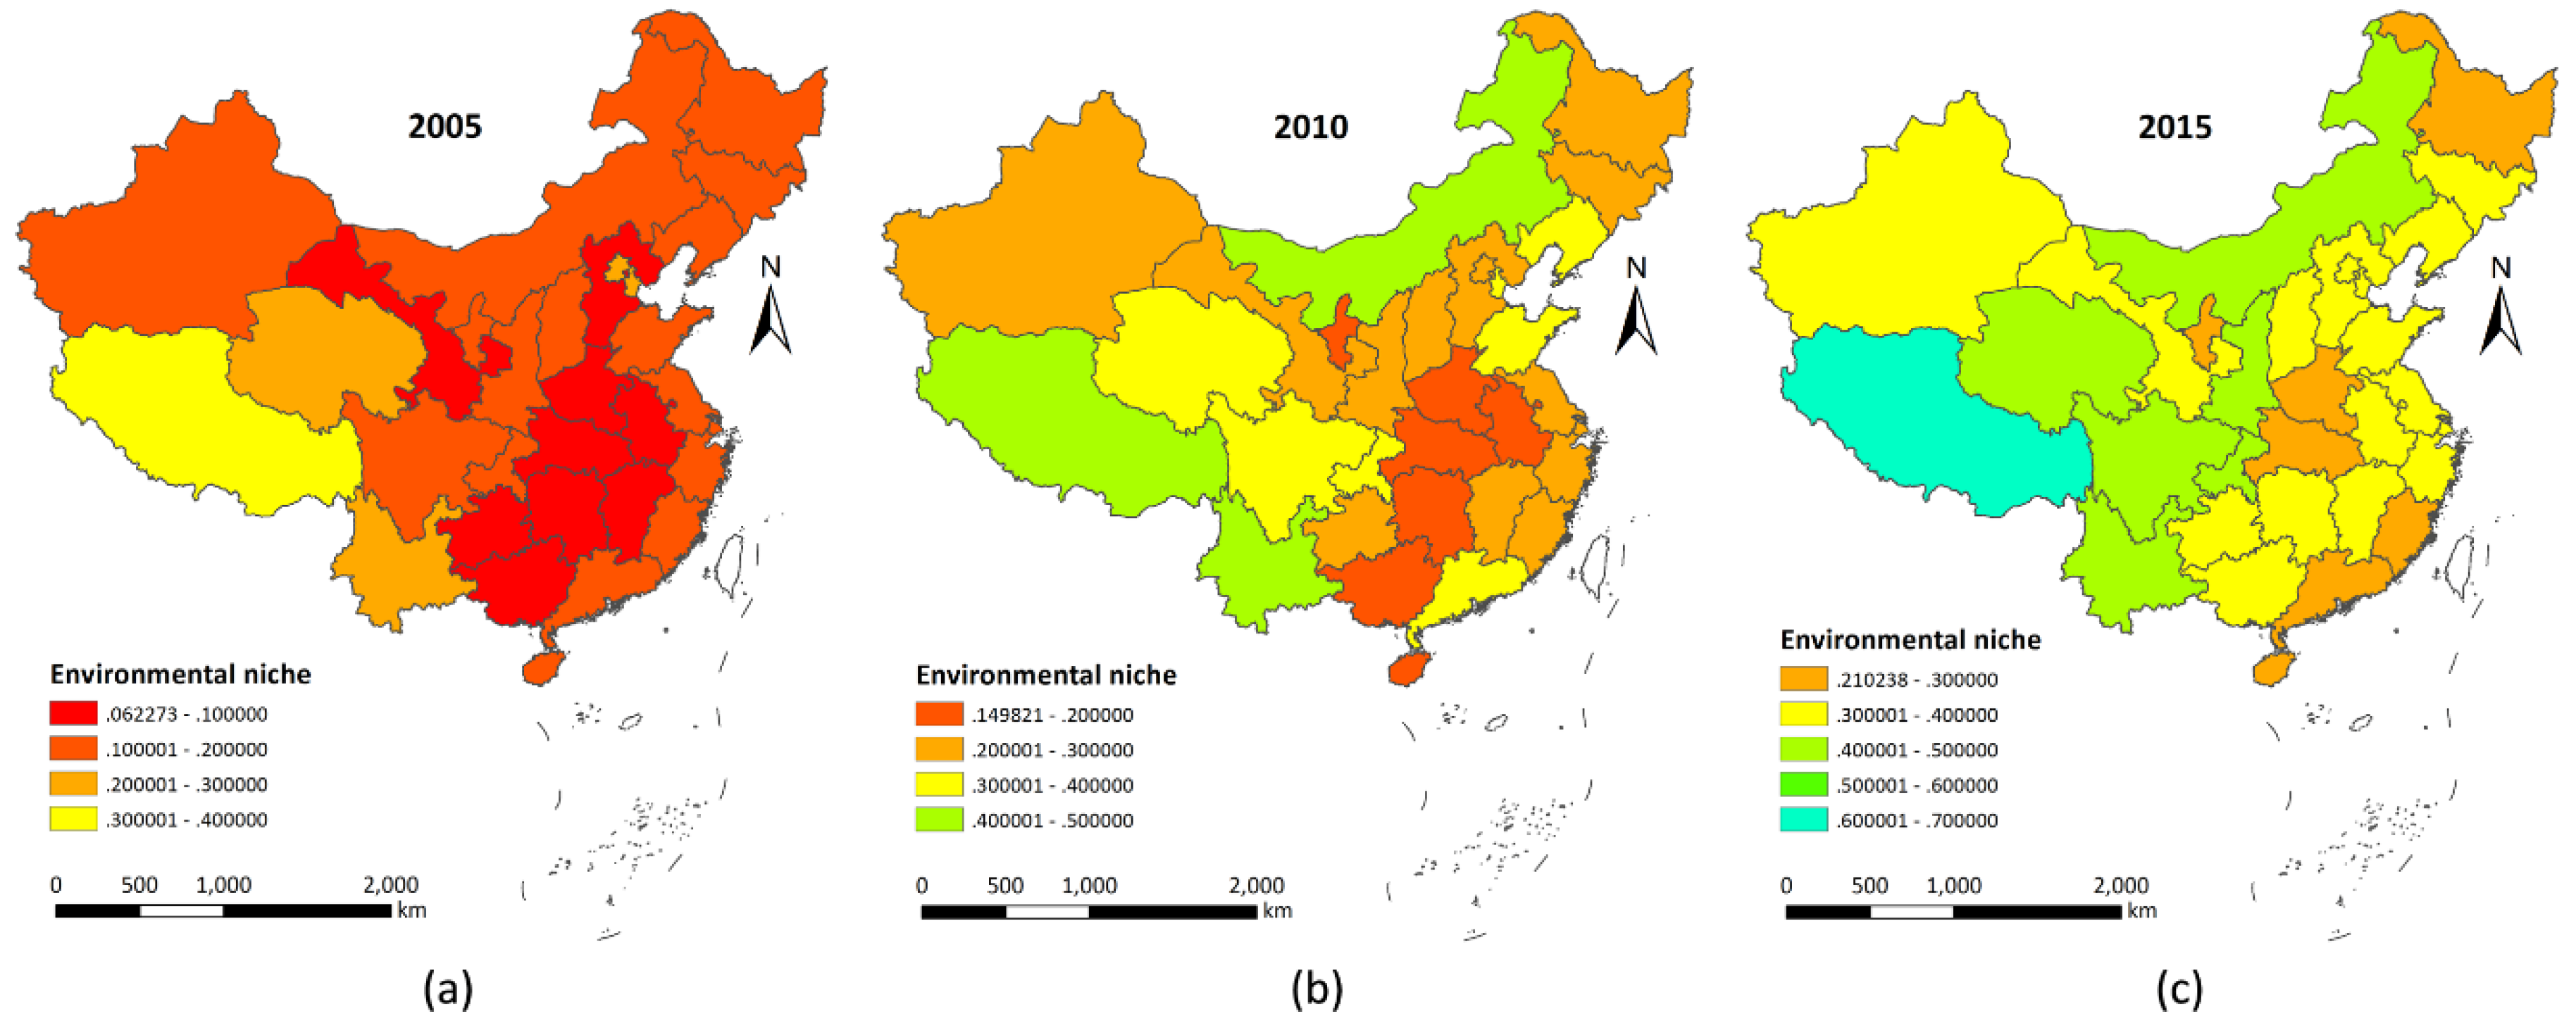
3.1.2. Environmental Niche

In the base year of the 11th Five-Year period (2005), the levels of regional environmental niche indexes in the country were generally low, and there were about 20 provinces and cities with environmental niche indexes that were less than the average of 0.15. Tibet, Beijing, Tianjin, and Qinghai were the few regions with overall environmental niche indexes greater than 0.23 (Figure 4a). During the 11th Five-Year period, the country’s regional environment niche was fully upgraded, with outstanding performance in ecological environment restoration and environmental pollution control. The national average environmental niche level reached 0.27, which was twice the level in the base year of the 11th Five-Year period; the environmental niche index of Tibet exceeded 0.45; and environmental niche indexes of Inner Mongolia and Yunnan exceeded 0.40. These were the highest regional environmental niche levels in the country. At the same time, the ecological niche levels in central regions such as Henan, Anhui, Hubei, Hunan, and Ningxia were all below 0.20, representing the lowest regional environmental niche levels in the country (Figure 4b). During the 12th Five-Year period, which showed an overall advance in ecological civilization construction, the country issued major ecological engineering policies, and the average level of regional environmental niches reached 0.35. The regional niche levels in Tibet, Inner Mongolia, Shaanxi, Qinghai, Sichuan, and Chongqing all exceeded 0.40, and only Henan had a niche level below 0.25 (Figure 4c).

3.1.3. Economic Niche

In the base year of the 11th Five-Year period (2005), the national level of regional economic niches was generally low, and the average level of economic niches was only 0.15. Beijing was the only region that had an economic niche level higher than 0.50. The levels of economic niches in the northern region and central–western regions were generally lower than 0.10 (Figure 5a). During the 11th Five-Year period, the country made great efforts to transform its economic development mode and structure. It markedly increased the demand for domestic products, continued improvements in industry structure, significantly increased the level of urbanization, enhanced coordination for regional development, and significantly improved the levels of regional economic niches across the country. By the end of the 11th Five-Year period, the average level of national economic niches reached 0.26, with the levels of economic niches in Beijing and Tianjin reaching 0.54 or more, and economic niches in the eastern coastal regions generally reached 0.40 or more (Figure 5b). During the 12th Five-Year period, some major economic development measures were implemented, including upgrading industrial core competitiveness through transformation and upgrading, optimizing coordinated development between regions, and promoting healthy urbanization. Further, the basic concept of inclusive development was established. As a result, the national regional economic niche level greatly increased to approximately 0.42. The economic niche levels in Beijing, Tianjin, and eastern coastal regions were all higher than the national average of 0.40, and the economic niche level in Jiangsu, Tianjin, and Zhejiang were all higher than 0.60. Regional differences in the levels of economic niches across the country were significantly reduced, reflecting the concept of coordinated economic development in urban agglomerations and economic belts (Figure 5c).

3.1.4. Social Niche

In the base year of the 11th Five-Year period, social niche levels were generally low across the country; the average level was only 0.15. The social niches in Shanghai, Beijing, and Tianjin ranked highest, with social niche levels of 0.60, 0.56, and 0.40, respectively. The levels of social niches in the central and western regions were generally lower than the national average level of 0.15 (Figure 6a). During the 11th Five-Year period, the state made important advances by expanding employment, upgrading the social security system, improving the skills and quality of workers, increasing government investments and policy support, implementing major engineering projects and institutional reform, strengthening labor security system capacity, and improving the social niche level of the whole country. By the end of the 11th Five-Year period, the national average social niche level reached 0.26. The social niche levels in Beijing, Shanghai, and Tianjin were the highest in the country, at 0.73, 0.61, and 0.49, respectively. However, the social niche levels in some regions in the northwest were still below 0.1. There were obvious regional differences in regional social niche levels in the country (Figure 6b). During the 12th Five-Year period, the state vigorously promoted the construction of the social security system, accelerated overall urban and rural social security planning, expanded the scope of social security coverage, gradually increased the level of security standards, and greatly improved national social niche levels. At the end of the 12th Five-Year period, the levels of regional social niches in the country averaged approximately 0.43, with the levels in the eastern coastal areas higher than the national average. In addition, the level in Beijing reaching 0.77, and the levels in the central regions also greatly improved (Figure 6c).

3.2. Spatio-Temporal Dynamics of the Comprehensive Niche

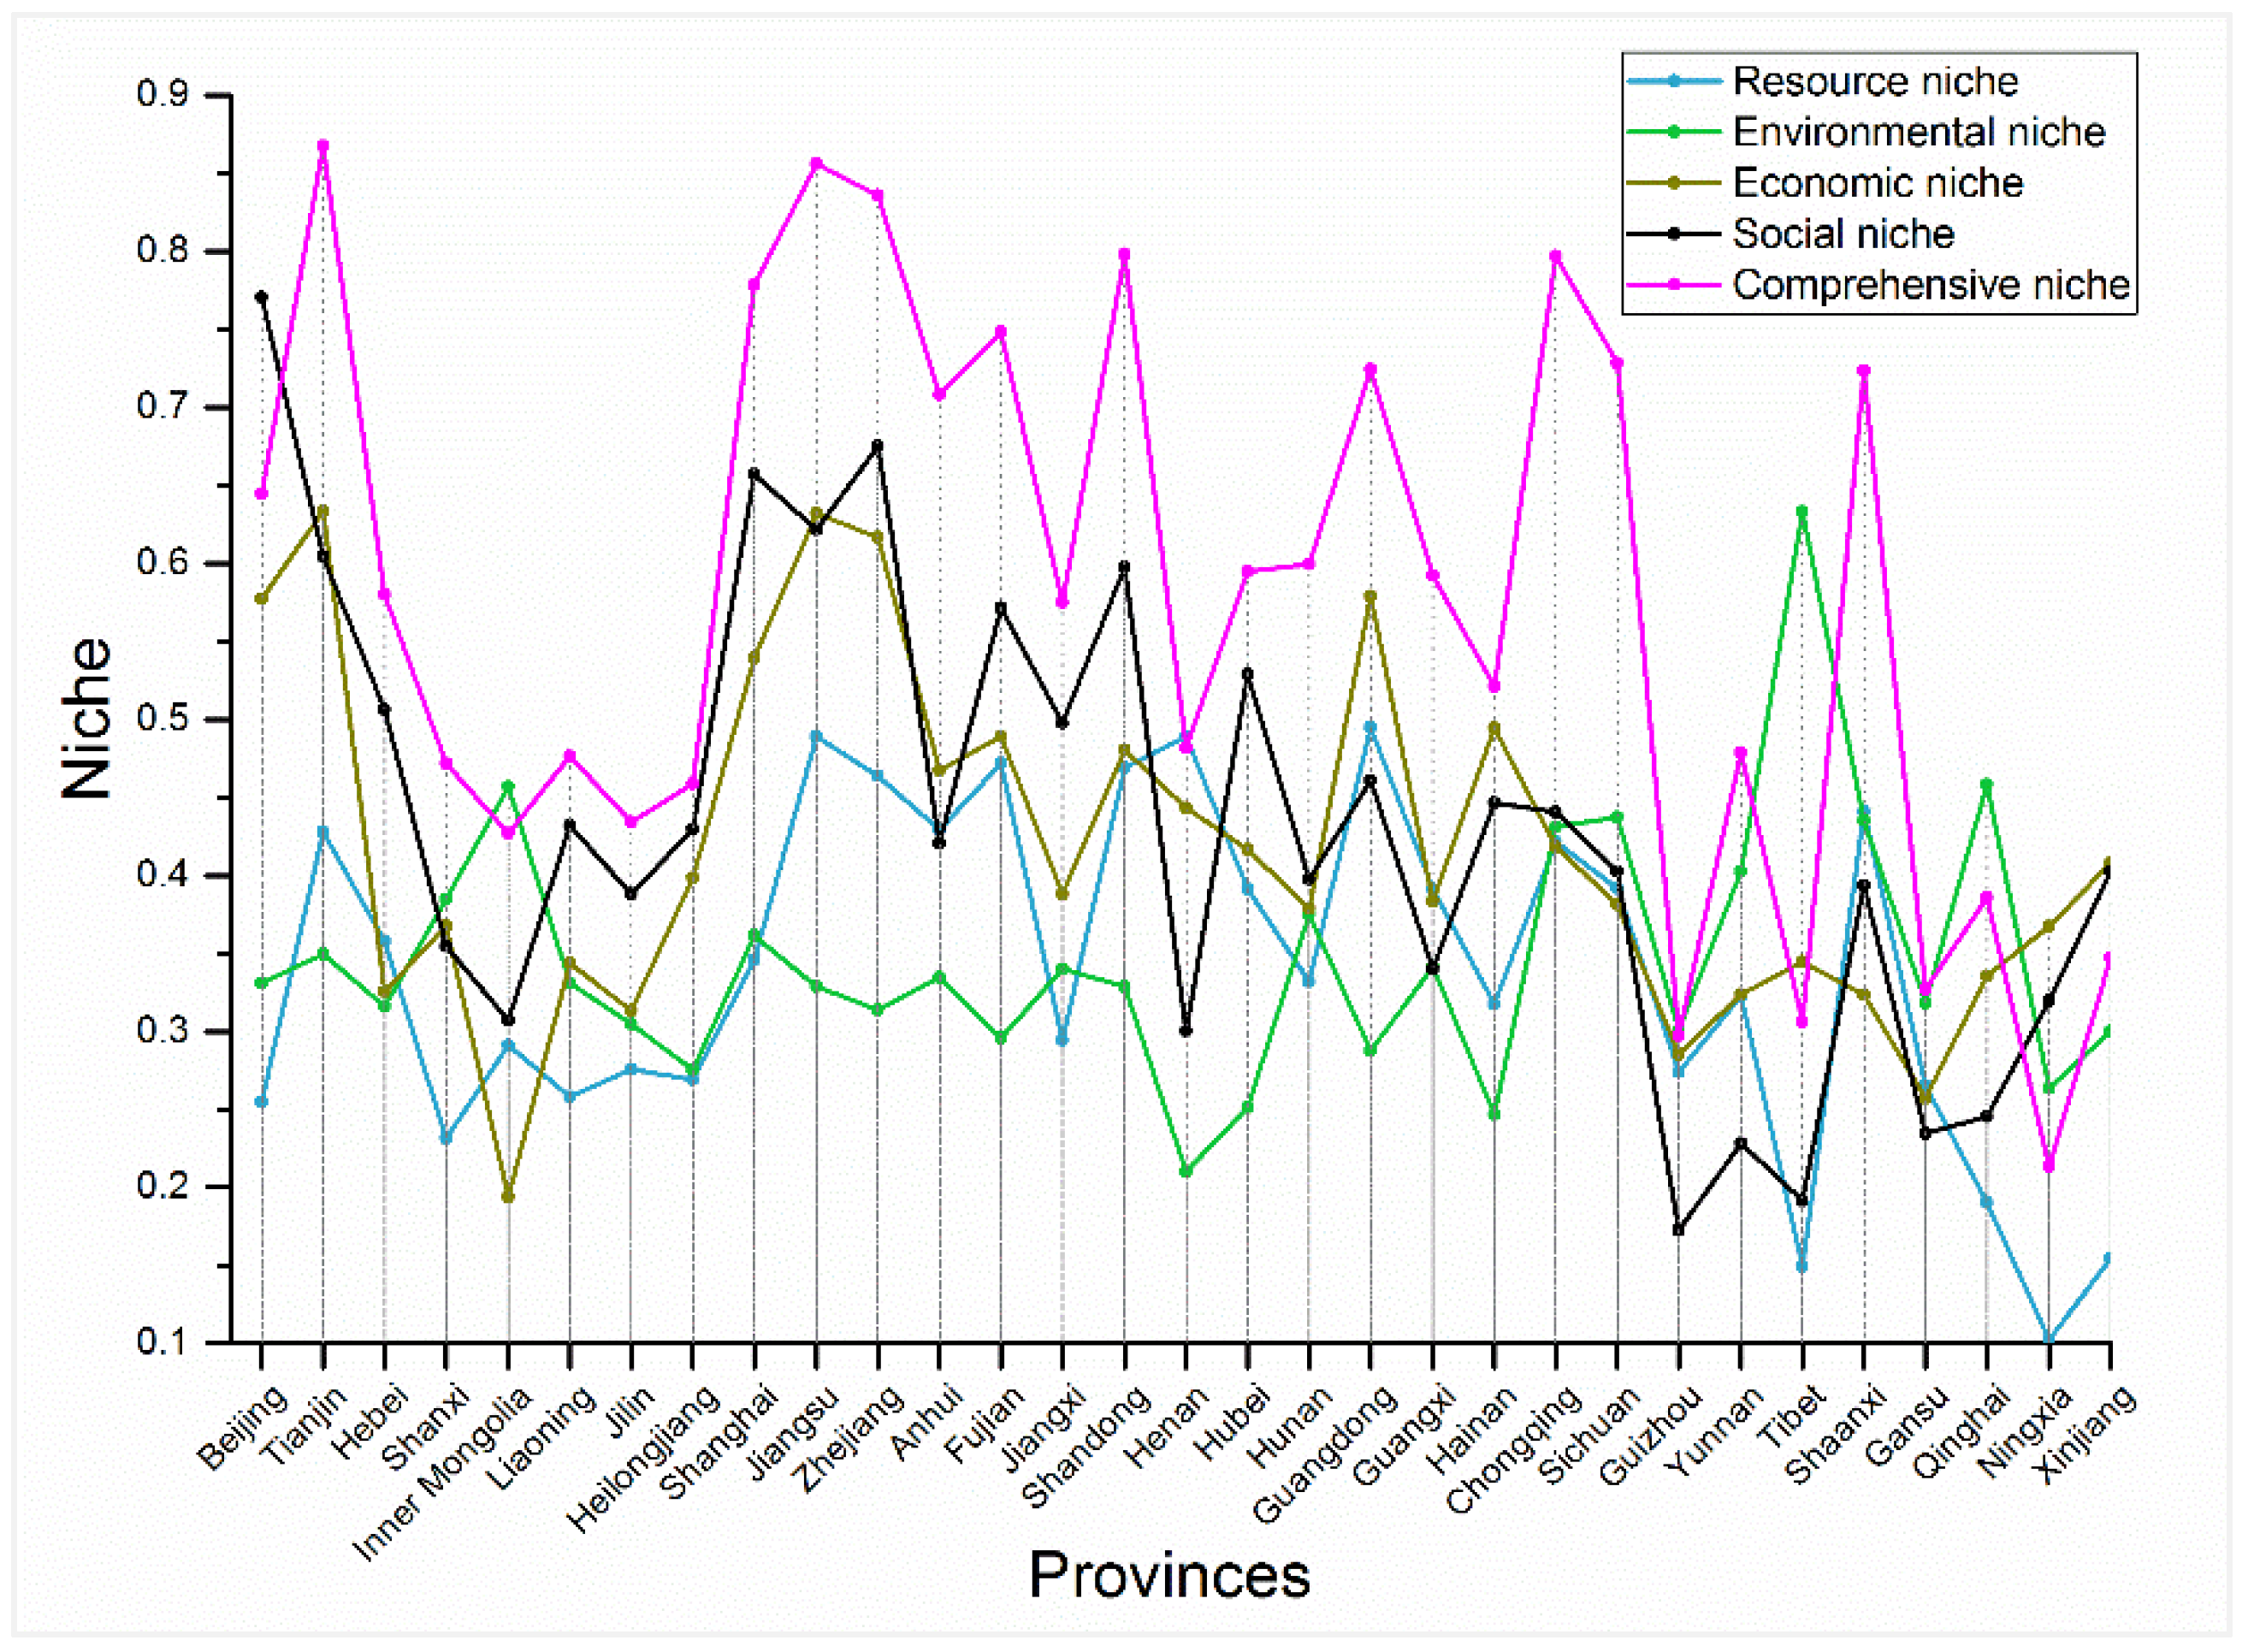
3.2.1. Regional Comprehensive Niche Evolution

In the base year of the 11th Five-Year period, the levels of comprehensive regional ecological niches in the country were generally low, with the average comprehensive niche level at 0.07, and only the comprehensive niche level of Beijing higher than 0.49. The comprehensive niche levels of more than 20 other provinces were less than 0.10, whereas those of some coastal provinces and cities ranged from 0.10 to 0.49 (Figure 7a).
During the 11th Five-Year period, the State Council’s decision on implementing the “Scientific Outlook on Development” to strengthen environmental protection and social development established the need to protect the ecological environment, speeding up the construction of a resource-saving and environment-friendly society, and promoting the coordination of economic development through interventions on the population, resources, and environment. By the end of the 11th Five-Year period, the level of comprehensive ecological niches in the country had significantly increased, and the national average ecological level was 0.28. The overall ecological niche levels in Beijing, Tianjin, and the eastern coastal regions were more than 0.40, and the comprehensive niche levels in the central region were generally above 0.10; however, the comprehensive niche levels in most western regions were still below 0.10, indicating large regional differences (Figure 7b).
During the 12th Five-Year period, when the foundation of ecological civilization construction was established and various regional ecological civilization construction plans were implemented, the average levels of comprehensive ecological niches in the country reached 0.57, which was twice that in the late 11th Five-Year period. The levels of comprehensive niches in coastal areas such as Shandong, Jiangsu, and Zhejiang reached more than 0.84, and the comprehensive niche levels in southern regions such as Fujian and Guangdong and in central and western developed regions such as Chongqing, Sichuan, and Shaanxi reached more than 0.72. The levels of comprehensive niches in the central region, including Hubei, Hunan, and Jiangxi, reached more than 0.50, and the comprehensive niche levels in the northwest region, including Qinghai, Gansu, Xinjiang, and Tibet, were generally higher than 0.30. The regionalized nature of comprehensive niches in the country was obvious (Figure 7c).

3.2.2. Coordinated Development of the Natural–Social–Economic System

In the base year of the 11th Five-Year period (2005), except for levels in Beijing, Shanghai, and Tianjin, the levels of niches and comprehensive niches in various regions of the country were relatively low, and regional imbalances were prominent. In addition, comprehensive ecological niche levels were generally lower than the levels of individual niches, suggesting that no comprehensive effects had emerged for various types of ecological subsystems in the early 11th Five-Year period (Figure 8).
During the 11th Five-Year period, with the optimization and upgrading of industrial structures, implementation of a basic strategy to promote regional coordinated development, and construction of a resource-conserving and environmentally friendly society, the levels of subsystem ecological niches and comprehensive ecological niches greatly increased. The comprehensive niche levels in Tianjin, Shandong, Zhejiang, and Guangdong surpassed the niche levels of each subsystem, indicating the integration and development of various subsystems, as well as their synergy, in the above-mentioned regions. However, the levels of comprehensive niches in Henan, Hunan, Guizhou, Gansu, Xinjiang, and other regions were still lower than the niche levels of various subsystems, indicating that sustainable development with integrated natural, social, and economic development was not established in these regions (Figure 9).
During the 12th Five-Year period, with the establishment of ecological civilization construction as a founding principle, ecological protection was strengthened by optimizing spatial patterns, guiding coordinated economic development and ecological protections, and building ecological supervision capacity. In the process, natural-social-economic development capacities in all of the regions of the country were augmented. In the end of the 12th Five-Year period (2015), the comprehensive ecological niches of coastal cities such as Tianjin, Jiangsu, and Zhejiang exceeded 0.80, and the comprehensive ecological niches in the middle and western regions such as Chongqing and Shaanxi were between 0.70–0.80. The comprehensive niche level of each region in the country was generally higher than the niche level of each subsystem, indicating that the concept of coordinated development was implemented regionally. However, in some central and western regions such as Henan, Tibet, Xinjiang, Ningxia, and Qinghai, the levels of comprehensive ecological niches did not exceed the ecological niche levels of various subsystems, indicating that, in these regions, natural-social-economic compound ecosystems were still not well understood, sustainable natural-social-economic coordinated development needed to be implemented, and green development and ecological civilization construction required promotion (Figure 10).

4. Discussion

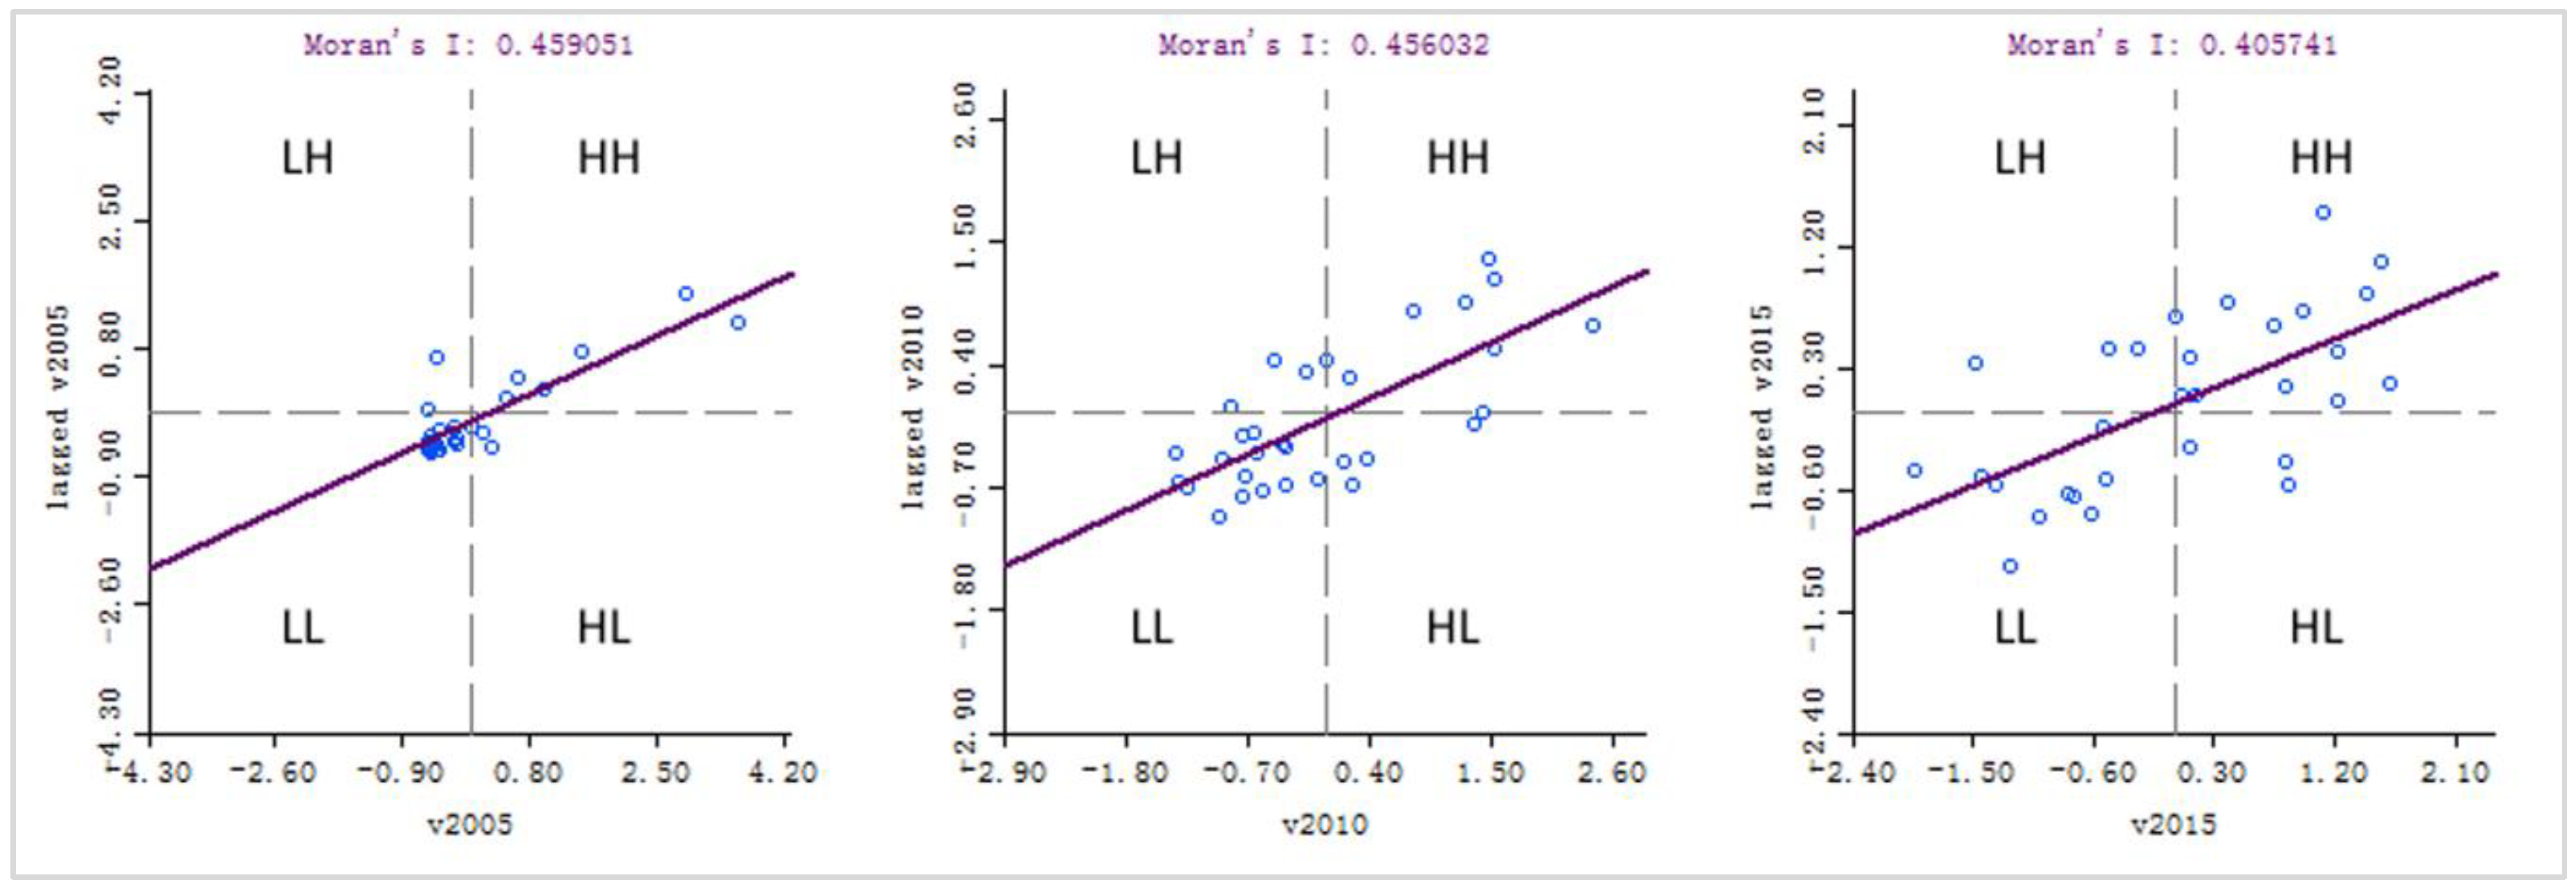
4.1. Global Spatial Autocorrelation of Regional Comprehensive Niche Indexes

In our study, we found a correlation between the comprehensive ecological niche indexes of various regions in China. To further explore the spatial distribution and evolving characteristics of China’s provincial comprehensive niches, a spatial autocorrelation analysis method was used to determine the global autocorrelation of the comprehensive niches in China’s provinces during the study period.
Using GeoDa and rook first-order adjacency matrices, a global spatial autocorrelation analysis of the comprehensive niche levels in 31 provinces (Hainan, Guangdong, and Guangxi were treated as neighbors) was conducted, and the overall Moran index of comprehensive niche levels was obtained at each stage. These values were tested for significance (Table 3).
As can be seen in the table, the overall Moran index of the comprehensive niche levels in China’s provinces was significantly positive, indicating a spatial correlation in the comprehensive niche levels of China’s provinces. The areas with similar levels of comprehensive niche indexes were spatially agglomerated, showing regional geographical development advantages and linkages in the development of urban agglomerations.
During the 12th Five-Year period, the spatial agglomeration effect was basically flat, followed by a downward trend, indicating that regional differences in the levels of comprehensive niches were shrinking, and that balanced regional development was emerging. These patterns are inseparable from the overall optimization of industry; the promotion of regional coordinated development, healthy urbanization, and green development; and the construction of a resource-saving and environmentally friendly society; as well as other means of promoting the construction of a comprehensive ecological civilization. In the process of studying rural economic development in the eastern coastal region of China from 1978 to 2012, Wang et al. also found [56] a significant positive spatial autocorrelation with a trend toward an increase for the regional economy, and that the neighbor effect of regional economic growth was found to be strengthened by certain policies.

4.2. Local Spatial Autocorrelation of Regional Comprehensive Niche Indexes

To further explore the spatial relationships between provinces and cities in China, GeoDa was used to obtain Moran scatter plots at each stage (Figure 11), and each province and city was divided into four types of agglomerations based on scatter plots.
In the base year of the 11th Five-Year period (2005), High-High type(HH) agglomeration areas were mainly found in Beijing, Tianjin, Shanghai, Jiangsu, Zhejiang, Fujian, and other eastern coastal provinces. Most of the provinces in central and western regions were located in the Low-Low type (LL) agglomeration area. This indicated the regional location, economic development, technology, politics, and talents of these provinces. This finding was consistent with those of some previous studies [27,57].
During the 11th Five-Year period, a series of important measures such as the national main functional zone strategy and overall regional development strategy were successively promulgated. The comprehensive niche level of each region in the country gradually increased, and the radiation diffusion effect of the eastern region also led to the development of the central region. Ding et al. [27] also found a strong promoting influence of core cities in the eastern coastal region of the surrounding cities. As a result, the number of regions in the LL agglomeration area continued to decrease, and the number in the HH agglomeration area continued to increase. Therefore, the gap between the regions in the country gradually narrowed.
During the 12th Five-Year Plan period, with the promotion of the concept of "ecological civilization construction," some regions in the LL gathering district moved to the Low-High type (LH) gathering district, and some have continued on from the LH agglomeration area to the HH and even the High-Low type (HL) areas. For regions in the LH agglomeration area, the radiation and diffusion effects of neighboring provinces should be used to improve their niche levels. For provinces and cities in the HL agglomeration area, ecological civilization was effectively constructed. In the future, we should strengthen cooperation with surrounding areas to promote their coordinated development.
As a whole, during the 11th Five-Year and 12th Five-Year periods, the spatial radiation and driving effects of regional development increased. The comprehensive ecological niche index of the country also increased, and the geographical advantage began to narrow. The construction of the ecological civilization and implementation of sustainable development have moved economic development and social progress indicators, and increasing recognition of the value of ecological and environmental welfare has changed the comprehensive ecological niche patterns of the whole country.

5. Conclusions

Based on an analysis of the spatio-temporal dynamics of the four subsystems of resources, environment, economy, and society in the provinces of China during the 11th Five-Year and 12th Five-Year Plan period, we conclude the following. (1) The spatio-temporal differences in resource, environmental, economic, and social niches in each region increased greatly during this period. The levels of niches in most of the provinces and cities in the central and western regions rose from poor to average or above. (2) In terms of the spatial and temporal evolution of comprehensive niches, the comprehensive niche levels of each region in the country increased significantly during this period. At the beginning of the period (2005), only comprehensive niche levels in Beijing and Tianjin were at the average level, whereas by the end of the period (2015), the comprehensive niche levels in all of the provinces and cities were higher than the average. (3) In terms of changes in subsystem and comprehensive niches, in the base year of the 11th Five-Year period, the subsystem niche levels and comprehensive niche levels were both relatively low, and the comprehensive niche levels were generally lower than those of the subsystems, indicating that coordination of the various subsystems had not yet been established. By the end of the 12th Five-Year period, the comprehensive niche levels of all of the regions in the country were generally higher than those of each subsystem, indicating that the concept of coordinated development of compound ecosystems had been implemented in regional development. However, the comprehensive niche levels in Henan, Tibet, Xinjiang, Ningxia, Qinghai, and other parts of the midwest still did not exceed the maximum niche levels of each subsystem. In the future, it will be necessary to strengthen our understanding of the natural–social–economic compound ecosystem in order to improve the coordinated sustainable development of nature, society, and the economy.
In short, with the overall advancement of ecological civilization construction, the region will no longer continue its gross domestic product (GDP)-only development mode. Ecological welfare, social welfare, and sustainable development have become the new metrics for regional development. The concept of coordinated and sustainable natural-social-economic development is now accepted. The regional ecological niches of compound ecosystems can better reflect the suitability of a region for various human activities, as well as the advantages and disadvantages of a population, resources, environment, economy, and society, and provide more accurate and comprehensive information for regional ecological civilization construction and sustainable development.
Although some insights have been gathered from this exploratory study, there are some limitations and room for further investigation. Ecological civilization is a complex term rooted in the economy, society, politics, culture, and the ecological environment that determines the diversity and systematization of ecological civilization construction. Correspondingly, the construction of an ecological civilization should include economic, social, political, cultural, resource, and environmental aspects. The evaluation indicators that are used to measure levels of political and cultural construction often involve institutional and conceptual dimensions, are difficult to quantify, and lack the support of authoritative statistical data at the national level. Thus, we did not incorporate these aspects into our index system for provincial compound niche evaluation. The level of ecological political and cultural construction can be reflected to some extent in the economy, society, resources, and environment; however, the existing evaluation suggests that ecological civilization construction may not play a leading role in strengthening ecological political and cultural construction. Therefore, in future research, if we can supplement the statistical data with statistical methods, national statistical departments can establish indicators that are directly related to ecological politics and culture and incorporate them into the evaluation system to achieve a more comprehensive evaluation of the level of ecological civilization construction and further promote the construction of ecological politics and culture.

Author Contributions

Y.J. conceived and performed the research. S.Z. conceived and maked valuable comments and suggestions on the writing and revision of the paper. S.S. and Y.W. participated in data collection and processing. All authors have read and approved this manuscript.

Acknowledgments

This research was funded by the Science and Technology Service Programs of the Chinese Academy of Sciences(Grant No.Y7I0051G30) and National Science and Technology Support Program(Grant No. 2016YFC0501101). The authors would like to thank Jingzhu Zhao at the Institute of Urban Environment, Chinese Academy of Sciences for the insightful and helpful comments, which improved the manuscript. The authors also thank the anonymous referees for their comments.

Conflicts of Interest

The authors declare no conflict of interest.

Appendix A

The following are detailed descriptions of “resource niche,” ”environmental niche,” ”economic niche,” and “social niche,” as used in the paper.
Resource niche: A resource niche reflects the advantages and disadvantages of a region in resource endowments and utilization. This study evaluated the following aspects of this niche. (1) Resource endowments. The indicators per capita arable land area and per capita water resources were mainly used to indicate the relative abundance of resources in the area. Per capita arable land area indicates the situation of land resources, and per capita water resources indicates water resource conditions. (2) Resource utilization. Resources conservation is China’s basic national policy. To save and intensify the use of resources, it is necessary to improve resource use efficiency, promote energy revolution, and facilitate resource recycling. The indicators energy consumption per unit of GDP, water consumption per unit of GDP, and output per unit of land were used to represent the intensity of energy, water, and land resource consumption for the improvement of resource use efficiency. The clean energy use ratio and rural biogas production rate were used to represent the promotion of new energy development. The indicators industrial water reuse rate and industrial solid waste comprehensive utilization rate included the amount of resource recycling.
Environmental niche: The environmental niche reflects the advantages and disadvantages of the region in terms of natural ecosystem protection and restoration, as well as environmental governance and protection. This study mainly analyzed the following two aspects. (1) Ecology protection. A good ecological environment is the foundation for the sustainable development of people and society. It is essential to prioritize conservation and natural resource restoration, strengthen the protection and management of key ecological function areas, implement major ecological restoration projects, enhance conservation of water resources, maintain water and soil, prevent wind and sand, and protect forest vegetation, rivers, lakes, wetlands, and biodiversity. At the same time, it is necessary to build a comprehensive disaster prevention and reduction system to develop resilience to natural disasters. To this end, the four indicators forest stock volume, wetland coverage, proportion of natural reserves in jurisdiction, and proportion of investments in geological disaster prevention and control of GDP were used to represent ecological protection. The last of these indicates the ability of the ecological environment to withstand and resist disasters. (2) Environmental governance and protection. This aspect can be divided into two sub-aspects. The first of these is pollutant emission reduction. The sulfur dioxide emission intensity per unit of GDP, chemical oxygen demand emission intensity per unit of GDP, regional environmental noise quality, and amount of pesticides per unit of cultivated land were indicators chosen to reflect the regional emission of pollutants in the atmosphere, water, sound, soil, and other components of an ecosystem. The second of these is pollution control. The centralized sewage treatment rate, harmless consumer waste treatment rate, and proportion of investments in environmental pollution control of GDP all represent pollution control. Of these, the first two indicators were used to show the level of wastewater and waste residue treatment in the region, and the last indicator was used to show the strength of economic feedback and environmental governance.
Economic niche: The economic niche indicates the advantages and disadvantages of the region in terms of new economic developments such as technological innovation, economic structural adjustment and optimization, and an open economy. This study reviewed the following aspects. (1) Economic level. Per capita GDP is an important indicator representing regional economic development; therefore, it was selected for this purpose. (2) Technological innovation. Technological innovation is the ultimate decisive force for the development and progress of human society. It is also the main driving force for the transformation of economies. Here, the fiscal expenditure on science and technology as a proportion of GDP and patents authorized per 10,000 persons were chosen to reflect regional innovation capacity. (3) Economic structural adjustment and optimization. This is the main means of accelerating economic development. It includes three aspects: industrial structure, urban-rural structure, and demand structure. Adjusting and optimizing the industrial structure, accelerating transformation and upgrading of traditional industries, and improving the modern industrial system are needed for development. The ratio of the tertiary industry added value and high and new technology industry output value both represent the degree of regional economic development. Therefore, these two indicators were selected to indicate the optimization of industrial structure in a region. In terms of urban-rural structure, increasing overall development of urban and rural areas and the vitality of rural development, modernizing agriculture, and promoting the integration of urban and rural development are needed. Here, agricultural mechanization level and dual contrast coefficient were selected to characterize adjustment and optimization of the urban-rural structure. The agricultural mechanization level refers to the comprehensive status of various power machines used in agriculture, forestry, livestock, and fishery, and reflects the level of industrialization and modernization of rural areas. The dual contrast coefficient is an important index to measure the urban-rural dual economic structure. It is also reflects the integration of urban and rural development in the region, as well as urban-rural economic coordination. In terms of the demand structure, it is important to firmly grasp the strategic basis of expanding domestic demand. We used the two indicators of final consumption rate and capital formation rate to represent this. (4) Open economy. To adapt to new economic globalization, a more proactive and open strategy must be implemented. Total import and export trade per capita were used here to reflect the degree of foreign economic openness of a region.
Social niche: social niche reflects the advantages and disadvantages of a region regarding public service, social security, and green life. This article analyzes the following aspects of social niches. (1) Education. The proportion of educational investment in GDP reflects the educational development of a region. (2) Medical service. Health technicians per 1000 persons was selected to indicate the development of health and medical services in the region. (3) Health. Average life expectancy was used to reflect residents’ health levels. (4) Social security. The proportion of spending on social security and employment of total government financial expenditure was used to indicate social security, social insurance availability, and employment security. (5) Quality of life. The urban-rural resident income ratio was used to reflect the income distribution in a region, and the per capita housing area of rural residents and green space rate in urban built-up areas were used to reflect the living conditions and environments of residents; (6) Urban and rural living facilities. The rate of urban gas usage and urban water usage, cumulative rural water diversion, and rate of rural sanitary toilet usage were included to reflect the status of residential living facilities in a region. (7) Green travel. Public transport vehicles per 10,000 people was the indicator used to reflect the level of green traffic in an area.

References

  1. Kuang, W.; Liu, J.; Dong, J.; Chi, W.; Zhang, C. The rapid and massive urban and industrial land expansions in china between 1990 and 2010: A clud-based analysis of their trajectories, patterns, and drivers. Landsc. Urban Plan. 2016, 145, 21–33. [Google Scholar] [CrossRef]
  2. Jiang, Y.; Tian, Y.; Zheng, S. A study on urban ecosecurity pattern of island city:A case study of pingtan island. Acta Ecol. Sin. 2018, 38, 769–777. [Google Scholar]
  3. Yun, G.; Zuo, S.; Dai, S.; Song, X.; Xu, C.; Liao, Y.; Zhao, P.; Chang, W.; Chen, Q.; Li, Y. Individual and interactive influences of anthropogenic and ecological factors on forest pm2. 5 concentrations at an urban scale. Remote Sensing 2018, 10, 521. [Google Scholar] [CrossRef]
  4. Wang, Y.; Deng, X.; Marcucci, D.J.; Le, Y. Sustainable development planning of protected areas near cities: Case study in china. J. Urban Plan. Dev. 2012, 139, 133–143. [Google Scholar] [CrossRef]
  5. Wang, R.; Li, F.; Hu, D.; Larry Li, B. Understanding eco-complexity: Social-economic-natural complex ecosystem approach. Ecol. Complex. 2011, 8, 15–29. [Google Scholar] [CrossRef]
  6. Wang, J.; Song, P.; Zhang, B.; Liu, W.; Zhang, J. An ecological niche evaluation model of social, economic, and natural complex ecosystems: A case study in sichuan province. Acta Ecol. Sin. 2016, 20, 6628–6635. [Google Scholar] [CrossRef]
  7. Wang, R.; Ouyang, Z. Social-economic-natural complex ecosystem and sustainability. Bull. Chin. Acad. Sci. 2012, 27, 337–345. [Google Scholar]
  8. Han, B.; Wang, R.; Tao, Y.; Gao, H. Urban population agglomeration in view of complex ecological niche: A case study on chinese prefecture cities. Ecol. Indic. 2014, 47, 128–136. [Google Scholar] [CrossRef]
  9. Zhao, J.; Jia, H. Strategies for the sustainable development of lugu lake region. Int. J. Sustain. Dev. World Ecol. 2008, 15, 71–79. [Google Scholar] [CrossRef]
  10. Poveda, C.A. The theory of dimensional balance of needs. Int. J. Sustain. Dev. World Ecol. 2017, 24, 97–119. [Google Scholar] [CrossRef]
  11. Commission on Sustainable Development. Indicators of Sustainable Development: Guidelines and Methodologies; United Nations Department of Economic and Social Affairs: New York, NY, USA, 2001. [Google Scholar]
  12. Global Reporting Initiative (GRI). Sustainability Reporting Guidelines; Global Reporting Initiative: Amsterdam, The Netherlands, 2002. [Google Scholar]
  13. Organization for Economic Cooperation and Development (OECD). OECD Environmental Indicators: Towards Sustainable Development; OECD: Paris, France, 2001. [Google Scholar]
  14. Bolcárová, P.; Kološta, S. Assessment of sustainable development in the eu 27 using aggregated sd index. Ecol. Indic. 2015, 48, 699–705. [Google Scholar] [CrossRef]
  15. Grzebyk, M.; Stec, M. Sustainable development in eu countries: Concept and rating of levels of development. Sustain. Dev. 2015, 23, 110–123. [Google Scholar] [CrossRef]
  16. Palme, U.; Tillman, A.-M. Sustainable development indicators: How are they used in swedish water utilities? J. Clean. Prod. 2008, 16, 1346–1357. [Google Scholar] [CrossRef]
  17. Steurer, R.; Hametner, M. Objectives and indicators in sustainable development strategies: Similarities and variances across europe. Sustain. Dev. 2013, 21, 224–241. [Google Scholar] [CrossRef]
  18. Ledoux, L.; Mertens, R.; Wolff, P. EU sustainable development indicators: An overview. In Natural Resources Forum; Blackwell Publishing Ltd.: Oxford, UK, 2005. [Google Scholar]
  19. Wong, T.; Yuen, B.; Goldblum, C. Spatial Planning for a Sustainable Singapore; Springer: Dordrecht, The Netherlands, 2008. [Google Scholar]
  20. Sharifi, A.; Murayama, A. Neighborhood sustainability assessment in action: Cross-evaluation of three assessment systems and their cases from the us, the uk, and japan. Build. Environ. 2014, 72, 243–258. [Google Scholar] [CrossRef]
  21. Zinatizadeh, S.; Azmi, A.; Monavari, S.M.; Sobhanardakani, S. Evaluation and prediction of sustainability of urban areas: A case study for kermanshah city, iran. Cities. 2017, 66, 1–9. [Google Scholar] [CrossRef]
  22. Beynen, P.V.; Akiwumi, F.A.; Beynen, K.V. A sustainability index for small island developing states. Int. J. Sustain. Dev. World Ecol. 2017, 1–18. [Google Scholar] [CrossRef]
  23. Institute of Urban Environment (IUE). Report of China’s Sustainable Urban Development in 2010; Press of Social Science: Beijing, China, 2010. [Google Scholar]
  24. National Development and Reform Commission (NDRC). National and Regional Outline of the Twelfth Five-Year Plan for Economic and Social Development; People’s Publishing House: Beijing, China, 2011.
  25. Beijing Municipal Commission Development and Reform (BMCDR). Green Beijing Construction Planning during the Twelve Five-Year Plan; Beijing Municipal Commission Development and Reform: Beijing, China, 2011.
  26. Sun, X.; Liu, X.; Li, F.; Tao, Y.; Song, Y. Comprehensive evaluation of different scale cities’ sustainable development for economy, society, and ecological infrastructure in china. J. Clean. Prod. 2015. [Google Scholar] [CrossRef]
  27. Ding, L.; Shao, Z.; Zhang, H.; Xu, C.; Wu, D. A comprehensive evaluation of urban sustainable development in china based on the topsis-entropy method. Sustainability. 2016, 8, 746. [Google Scholar] [CrossRef]
  28. Wu, H.; Yu, Y.; Li, S.; Huang, K. An empirical study of the assessment of green development in beijing, China: Considering resource depletion, environmental damage and ecological benefits simultaneously. Sustainability. 2018, 10, 719. [Google Scholar] [CrossRef]
  29. Yu, L. Low carbon eco-city: New approach for chinese urbanisation. Habitat Int. 2014, 44, 102–110. [Google Scholar] [CrossRef]
  30. Phillis, Y.A.; Kouikoglou, V.S.; Verdugo, C. Urban sustainability assessment and ranking of cities. Comput. Environ. Urban Syst. 2017, 64, 254–265. [Google Scholar] [CrossRef]
  31. Liu, L. A sustainability index with attention to environmental justice for eco-city classification and assessment. Ecol. Indic. 2018, 85, 904–914. [Google Scholar] [CrossRef]
  32. Liu, M.C.; Liu, X.C.; Yang, Z.S. An integrated indicator on regional ecological civilization construction in china. Int. J. Sustain. Dev. World Ecol. 2016, 23, 53–60. [Google Scholar] [CrossRef]
  33. Shi, L.; Vause, J.; Gao, L.; Li, Q.; Tang, L. Temporal changes in sustainable development level for lijiang city: 2003–2008. Int. J. Sustain. Dev. World Ecol. 2011, 18, 474–479. [Google Scholar] [CrossRef]
  34. Yan, Y.; Wang, C.; Quan, Y.; Wu, G.; Zhao, J. Urban sustainable development efficiency towards the balance between nature and human well-being: Connotation, measurement, and assessment. J. Clean. Prod. 2018, 178, 67–75. [Google Scholar] [CrossRef]
  35. Lu, C.; Xue, B.; Lu, C.; Wang, T.; Jiang, L.; Zhang, Z.; Ren, W. Sustainability investigation of resource-based cities in northeastern china. Sustainability 2016, 8, 1058. [Google Scholar] [CrossRef]
  36. Deng, H.; Liu, T.; Zhao, J. Strategic measures for an integrated approach to sustainable development in lijiang city. Int. J. Sustain. Dev. World Ecol. 2011, 18, 559–562. [Google Scholar] [CrossRef]
  37. Zhang, M.; Tan, F.; Lu, Z. Resource-based cities (rbc): A road to sustainability. Int. J. Sustain. Dev. World Ecol. 2014, 21, 465–470. [Google Scholar] [CrossRef]
  38. Fernandes, I.D.; Ferreira, F.A.; Bento, P.; Jalali, M.S.; António, N.J. Assessing sustainable development in urban areas using cognitive mapping and mcda. Int. J. Sustain. Dev. World Ecol. 2018, 25, 216–226. [Google Scholar] [CrossRef]
  39. Zhou, D.; Xu, J.; Wang, L.; Lin, Z. Assessing urbanization quality using structure and function analyses: A case study of the urban agglomeration around hangzhou bay (uahb), China. Habitat Int. 2015, 49, 165–176. [Google Scholar] [CrossRef]
  40. Wang, Q.; Yuan, X.; Cheng, X.; Mu, R.; Zuo, J. Coordinated development of energy, economy and environment subsystems—A case study. Ecol. Indic. 2014, 46, 514–523. [Google Scholar] [CrossRef]
  41. Tan, F.; Lu, Z. Assessing regional sustainable development through an integration of nonlinear principal component analysis and gram schmidt orthogonalization. Ecol. Indic. 2016, 63, 71–81. [Google Scholar] [CrossRef]
  42. Zhan, S.F.; Zhang, X.C.; Ma, C.; Chen, W.P. Dynamic modelling for ecological and economic sustainability in a rapid urbanizing region. Procedia Environ. Sci. 2012, 13, 242–251. [Google Scholar] [CrossRef]
  43. Singh, R.K.; Murty, H.R.; Gupta, S.K.; Dikshit, A.K. An overview of sustainability assessment methodologies. Ecol. Indic. 2012, 15, 281–299. [Google Scholar] [CrossRef]
  44. Cai, C.; Shang, J. Comprehensive evaluation on urban sustainable development of harbin city in northeast china. Chin. Geogr. Sci. 2009, 19, 144–150. [Google Scholar] [CrossRef]
  45. Wu, H.-Q.; Shi, Y.; Xia, Q.; Zhu, W.-D. Effectiveness of the policy of circular economy in china: A dea-based analysis for the period of 11th five-year-plan. Resour. Conserv. Recycl. 2014, 83, 163–175. [Google Scholar] [CrossRef]
  46. Li, H.; Fang, K.; Yang, W.; Wang, D.; Hong, X. Regional environmental efficiency evaluation in china: Analysis based on the super-sbm model with undesirable outputs. Math. Comput. Model. 2013, 58, 1018–1031. [Google Scholar] [CrossRef]
  47. Jia, J.; Fan, Y.; Guo, X. The low carbon development (lcd) levels’ evaluation of the world’s 47 countries (areas) by combining the fahp with the topsis method. Expert Syst. Appl. 2012, 39, 6628–6640. [Google Scholar] [CrossRef]
  48. Geng, Y.; Zhang, L.; Chen, X.; Xue, B.; Fujita, T.; Dong, H. Urban ecological footprint analysis: A comparative study between shenyang in china and kawasaki in japan. J. Clean. Prod. 2014, 75, 130–142. [Google Scholar] [CrossRef]
  49. Musa, H.D.; Yacob, M.R.; Abdullah, A.M.; Ishak, M.Y. Delphi method of developing environmental well-being indicators for the evaluation of urban sustainability in malaysia. Procedia Environ. Sci. 2015, 30, 244–249. [Google Scholar] [CrossRef]
  50. Li, F.; Liu, X.; Hu, D.; Wang, R.; Yang, W.; Li, D.; Zhao, D. Measurement indicators and an evaluation approach for assessing urban sustainable development: A case study for china’s jining city. Landsc. Urban Plan. 2009, 90, 134–142. [Google Scholar] [CrossRef]
  51. Tao, Y.; Li, F.; Crittenden, J.C.; Lu, Z.; Sun, X. Environmental impacts of china’s urbanization from 2000 to 2010 and management implications. Environ. Manage. 2016, 57, 498–507. [Google Scholar] [CrossRef] [PubMed]
  52. Choon, S.-W.; Siwar, C.; Pereira, J.J.; Jemain, A.A. A sustainable city index for malaysia. Int. J. Sustain. Dev. World Ecol. 2011, 18, 28–35. [Google Scholar] [CrossRef]
  53. Ghalib, A.; Qadir, A.; Ahmad, S.R. Evaluation of developmental progress in some cities of punjab, pakistan, using urban sustainability indicators. Sustainability. 2017, 9. [Google Scholar]
  54. Wan, N.F.; Zhang, M.Y.; Jiang, J.X.; Ji, X.Y.; Hao-Zhang. An ecological method to understand agricultural standardization in peach orchard ecosystems. Sci. Rep. 2016, 6, 21675. [Google Scholar] [CrossRef] [PubMed] [Green Version]
  55. Xu, C.; Wang, S.; Zhou, Y.; Wang, L.; Liu, W. A comprehensive quantitative evaluation of new sustainable urbanization level in 20 chinese urban agglomerations. Sustainability. 2016, 8, 91. [Google Scholar] [CrossRef]
  56. Wang, G.; Wang, M.; Wang, J.; Yang, C. Spatio-temporal characteristics of rural economic development in eastern coastal china. Sustainability 2015, 7, 1542–1557. [Google Scholar] [CrossRef]
  57. Yin, K.; Wang, R.; An, Q.; Yao, L.; Liang, J. Using eco-efficiency as an indicator for sustainable urban development: A case study of chinese provincial capital cities. Ecol. Indic. 2014, 36, 665–671. [Google Scholar] [CrossRef]
Figure 1. Study area.
Sustainability 10 02824 g001
Figure 2. A schematic diagram of a Full Permutation Polygon Synthetic Indicator method.
Sustainability 10 02824 g002
Figure 3. Regional resource niche evolution of China in 2005–2015.
Sustainability 10 02824 g003
Figure 4. Regional environment niche evolution of China in 2005–2015.
Sustainability 10 02824 g004
Figure 5. Regional economic niche evolution of China in 2005–2015.
Sustainability 10 02824 g005
Figure 6. Regional social niche evolution of China in 2005–2015.
Sustainability 10 02824 g006
Figure 7. Regional comprehensive niche evolution of China in 2005–2015.
Sustainability 10 02824 g007
Figure 8. Regional niche indexes in 2005.
Sustainability 10 02824 g008
Figure 9. Regional niche indexes in 2010.
Sustainability 10 02824 g009
Figure 10. Regional niche indexes in 2015.
Sustainability 10 02824 g010
Figure 11. Moran I scatter plot of comprehensive niche indexes at each stage in the study area.
Sustainability 10 02824 g011
Table 1. Social-economic-natural compound niche evaluation index system.
Target LayerSub-Target LayerIndicator LayerProperties
Comprehensive ecological niche of a complex ecosystemResource nichePer capita arable land area (hm²/person)Positive
Per capita water sources (m3/person)Positive
Energy consumption per unit of gross domestic product (GDP) (t standard coal/10,000 yuan)Negative
Water consumption per unit of GDP (m3/10,000 yuan)Negative
Unit land output value (100 million yuan/km²)Positive
Clean energy use proportion (%)Positive
Biogas production in rural areaPositive
Industrial water reuse rate (%)Positive
Comprehensive utilization of industrial solid waste (%)Positive
Environmental nicheForest reserve (m³/ person)Positive
Wetland coverage (%)Positive
Natural reserves as a percentage of area (%)Positive
Investment in prevention and control of geological disasters as a percentage of GDP (%)Positive
Sulfur dioxide emission intensity per unit of GDP (t/ten thousand yuan)Negative
Chemical oxygen demand emission intensity per unit of GDP (t/ten thousand yuan)Negative
Regional ambient noise quality (dB)Negative
Pesticide use per unit of cultivated land area (t/hm²)Negative
Sewage centralized treatment rate (%)Positive
Innocuous treatment rate of domestic waste (%)Positive
Proportion of investment in environmental pollution control of GDP (%)Positive
Economical nichePer capita GDP (Million yuan/person)Positive
Proportion of fiscal expenditure on science and technology of GDP (%)Positive
Patents authorized per 10000 person (item/10,000 person)Positive
Tertiary industry added value of GDP (%)Positive
High and new technology industry output of GDP (%)Positive
Agricultural mechanization level (10,000 kW/10,000 ha)Positive
Dual contrast coefficientPositive
Final consumption rate (%)Positive
Capital formation rate (%)Positive
Total value of import and export trade per capita (dollar/person)Positive
Social nicheEducational investment of GDP (%)Positive
Health technician per 1000 persons (person)Positive
Average life expectancy (year)Positive
Proportion of social security and employment expenditure of total government financial expenditure (%)Positive
Urban–rural resident income ratioNegative
Per capita housing area of rural residents (m²/person)Positive
Green space rate of urban built-up region (%)Positive
Urban gas usage rate (%)Positive
Urban water usage rate (%)Positive
Cumulative benefit rate of rural water diversion (%)Positive
Usage rate of sanitary latrines in rural areas (%)Positive
Public transport use (vehicles per 10,000 persons)Positive
Table 2. Classification of niche level.
LevelRange of ValuesNiche Level
I>0.75Excellent
II0.5−0.75Better
III0.25−0.5General
IV<0.25Poor
Table 3. Global Moran indexes of comprehensive ecological niches in China.
Year200520102015
Moran’s Index0.4590.4560.406
Z Score4.9314.1783.721
P Value0.0010.0010.002

