A Framework for Spatiotemporal Analysis of Regional Economic Agglomeration Patterns
Abstract
1. Introduction
2. Literature Review
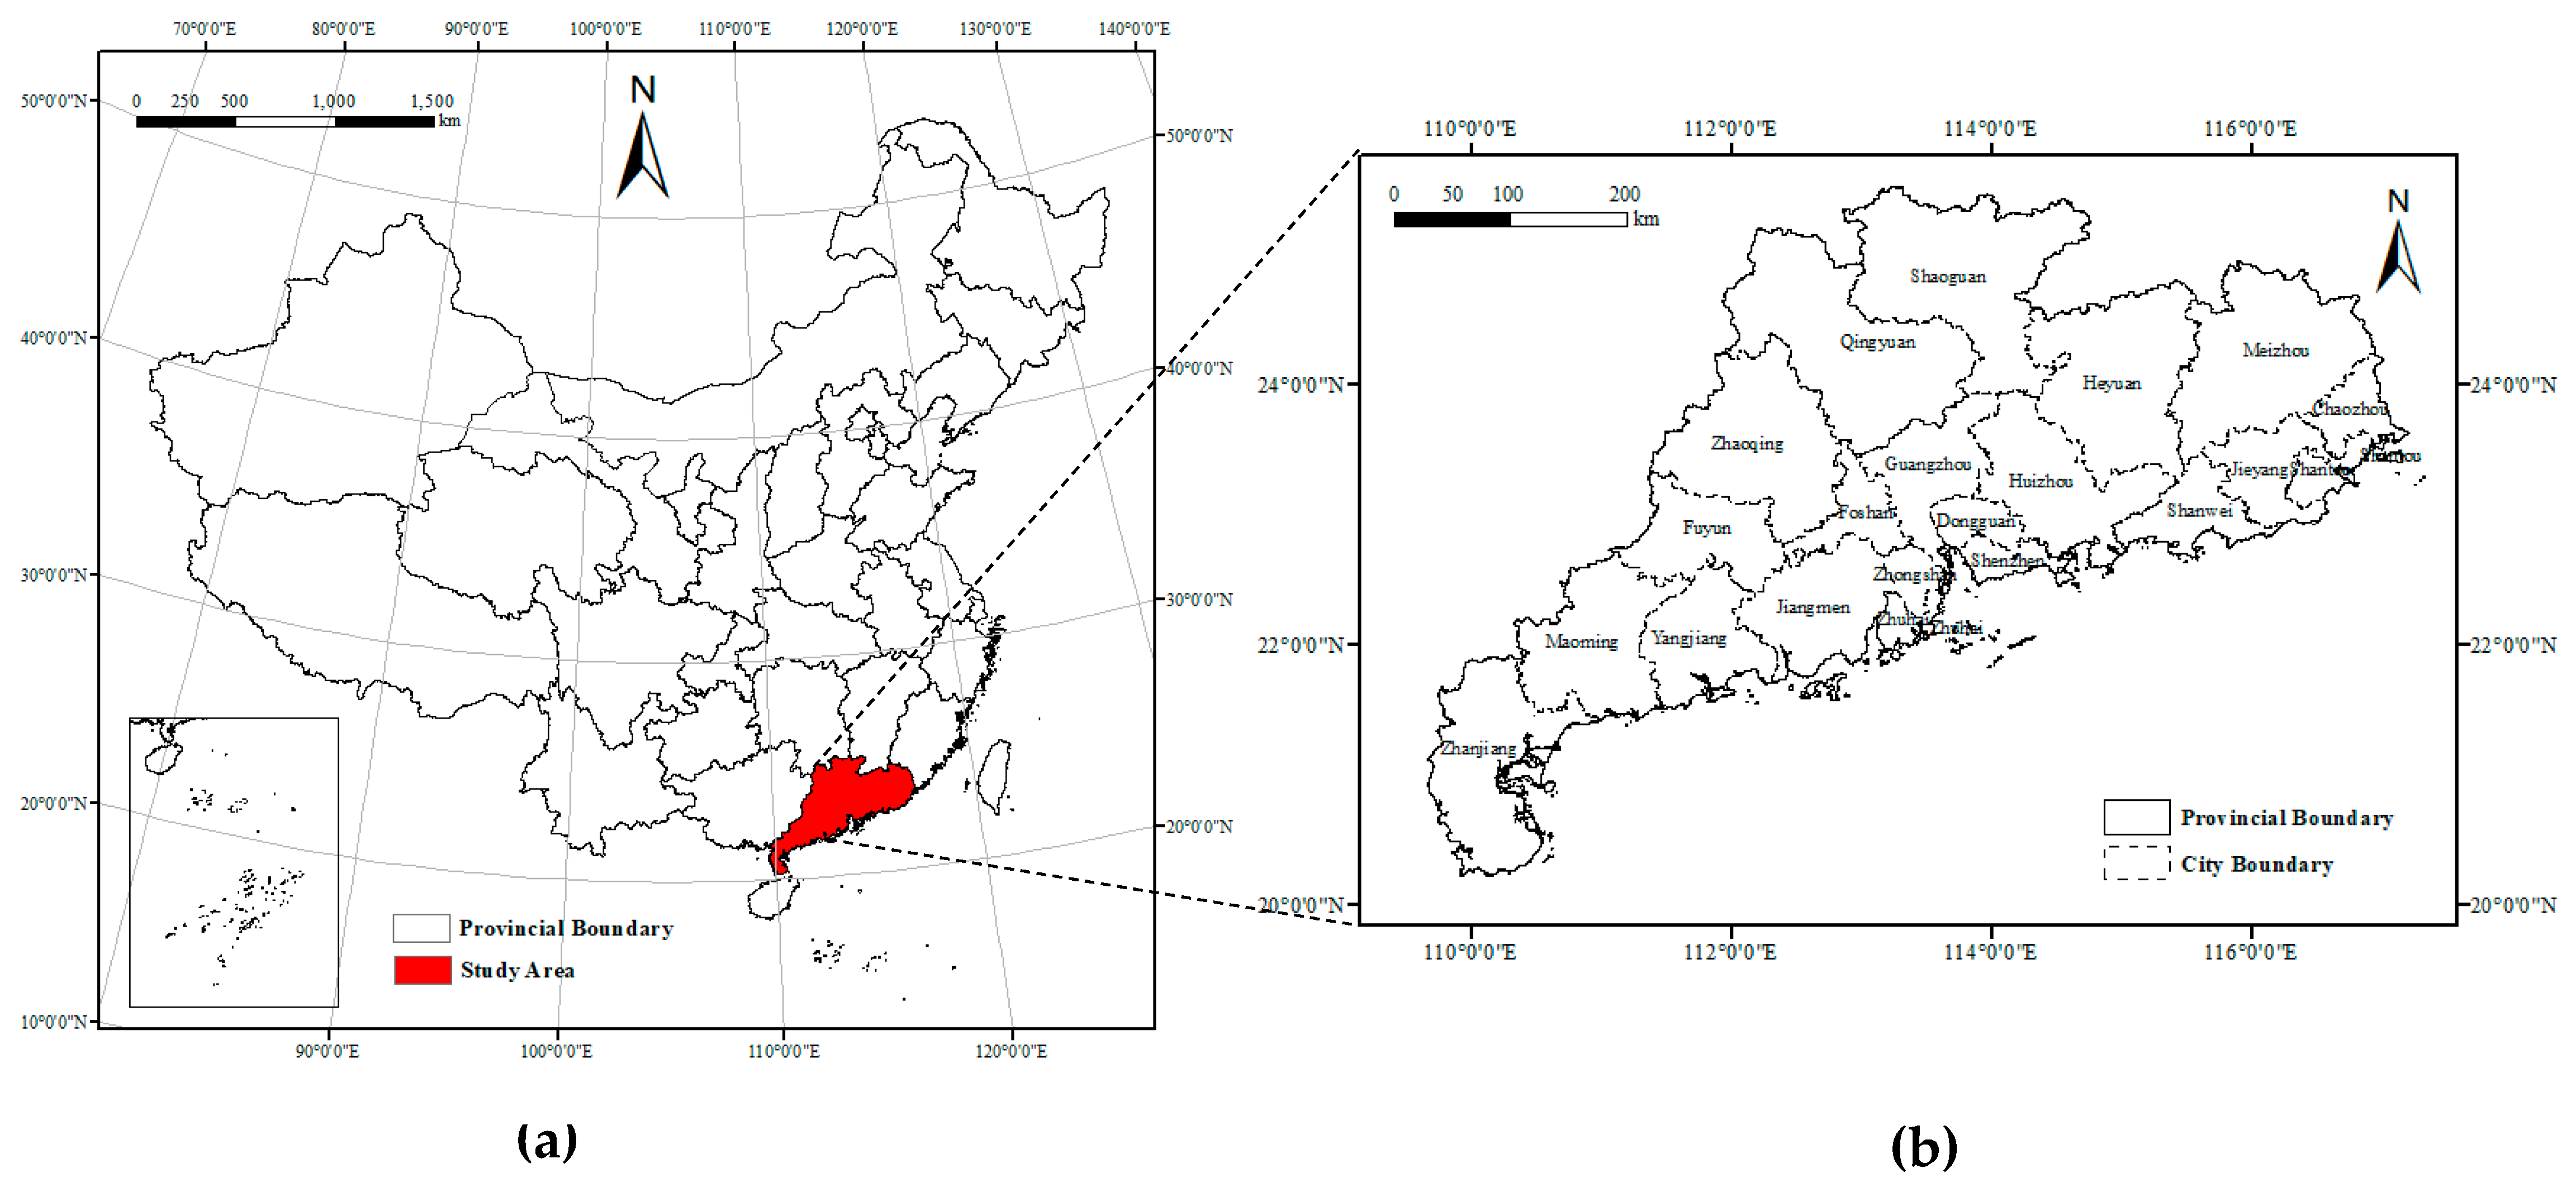
3. Study Area and Data
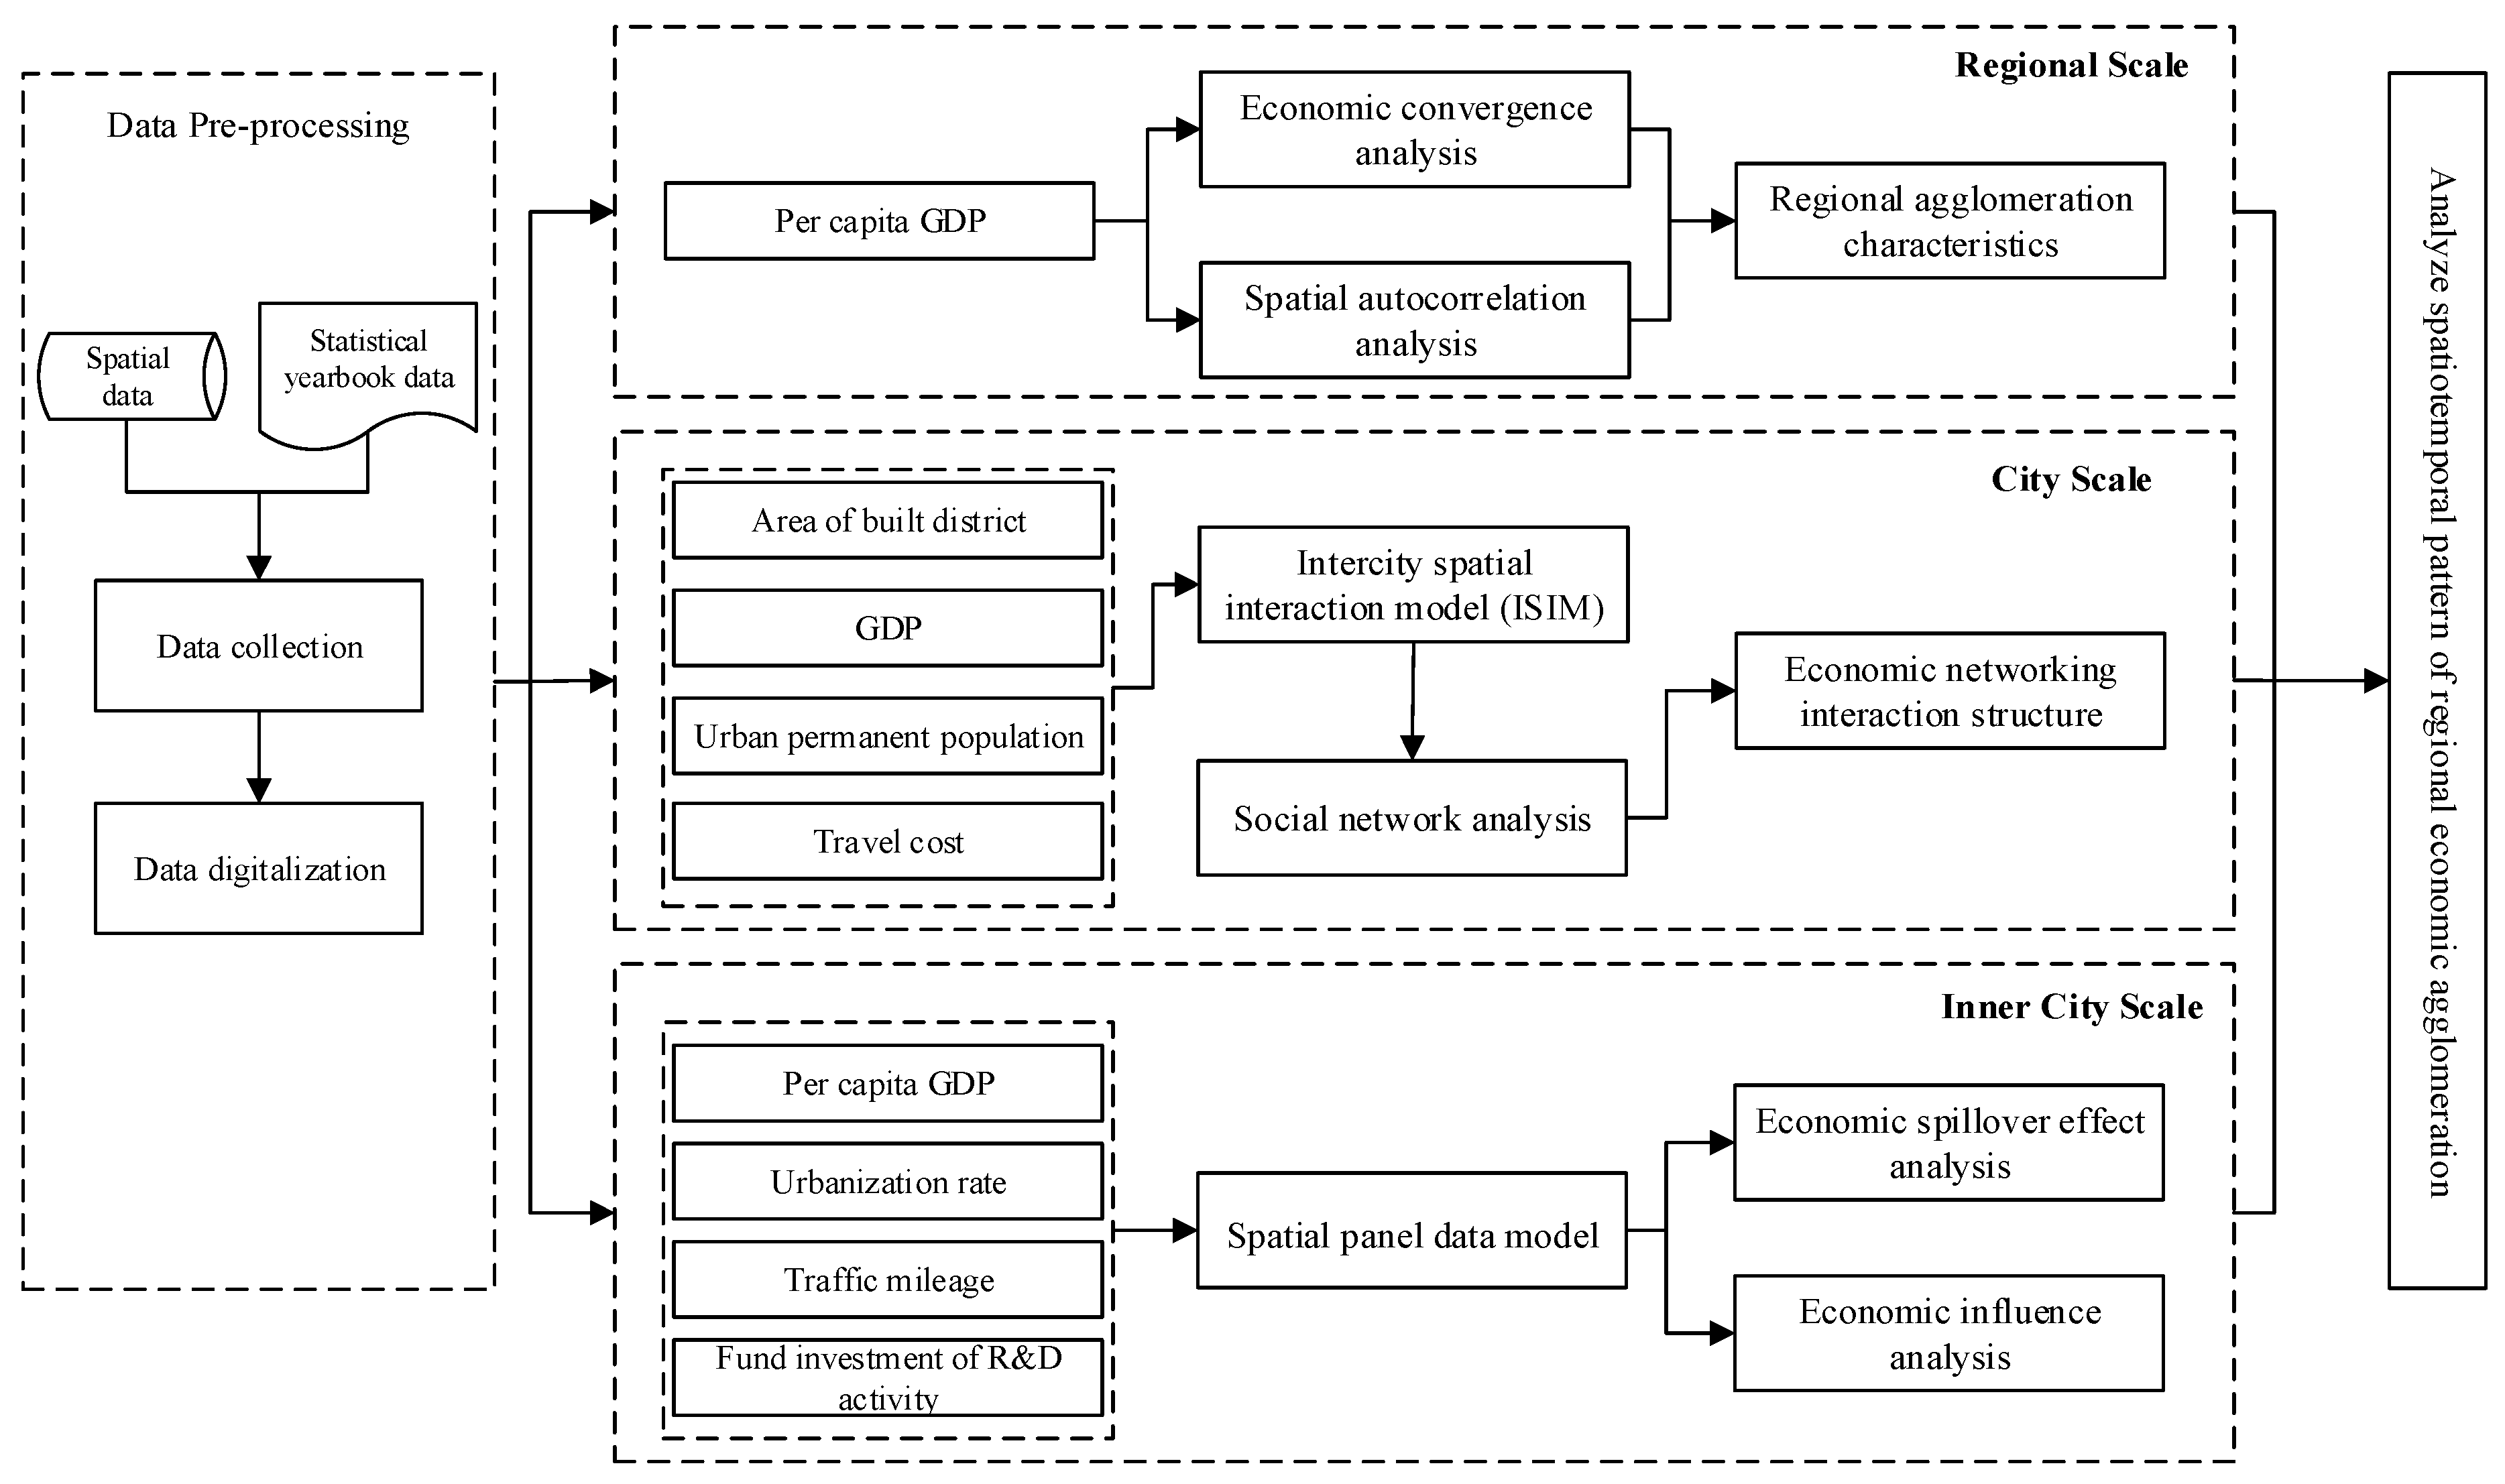
4. Methods
4.1. Economic Growth Convergence
4.2. Global Spatial Autocorrelation Analysis
4.3. Intercity Spatial Interaction Model
4.4. Social Network Analysis Method
4.5. Spatial Panel Data Model
- (1)
- If λ = 0 and α = 0, the mixed autoregressive-regressive model is created and considers spatial dependence across the observations on the dependent variable. Hence, the SLM defined by Anselin [17] accounts for spatial autocorrelation, which can also be called the spatial autoregressive model (SAR); the model is shown as follows:
- (2)
- If ρ = 0 and α = 0, the SEM is created, which can also be called the spatial autocorrelation model (SAC) [50]. The SEM considers spatial dependence across the error terms. The model is defined as follows:
5. Results
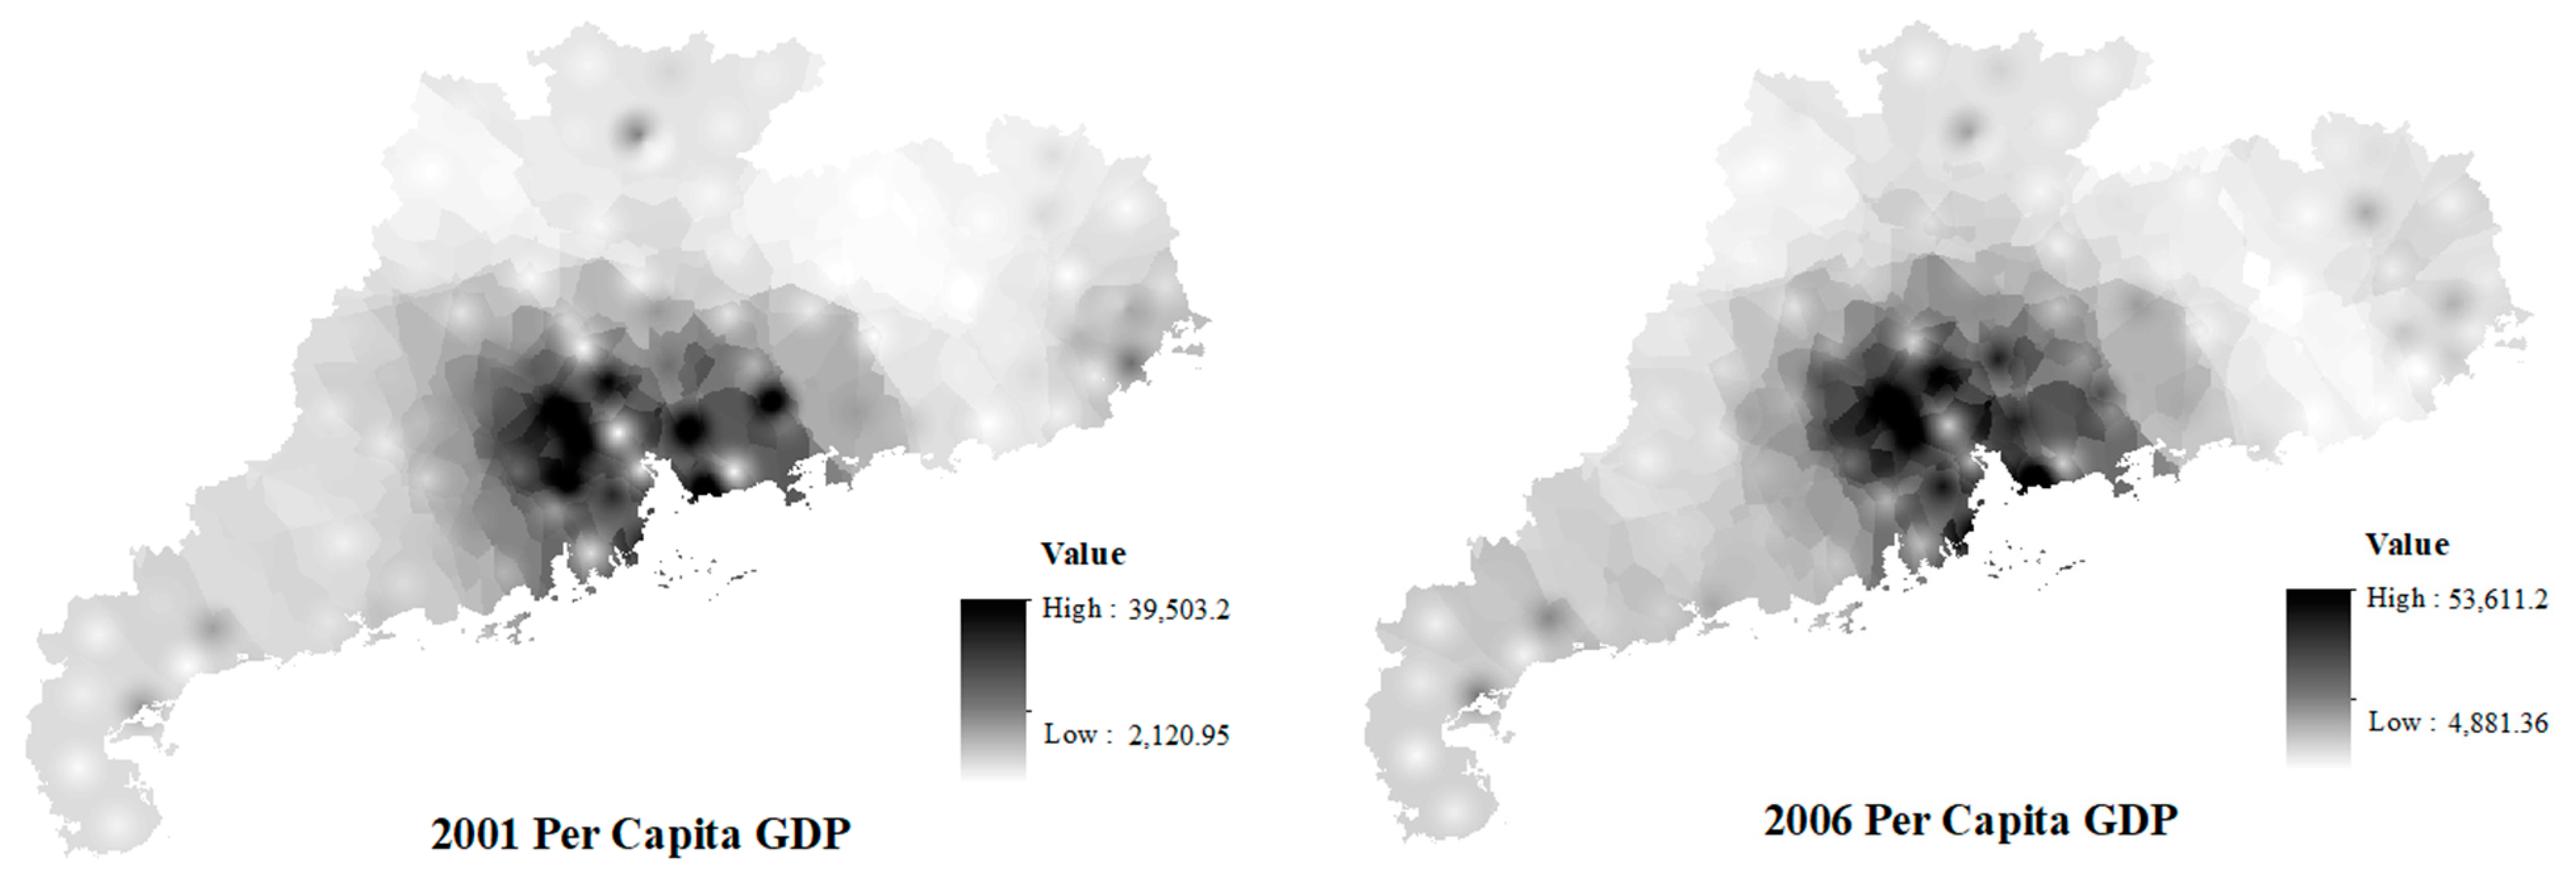
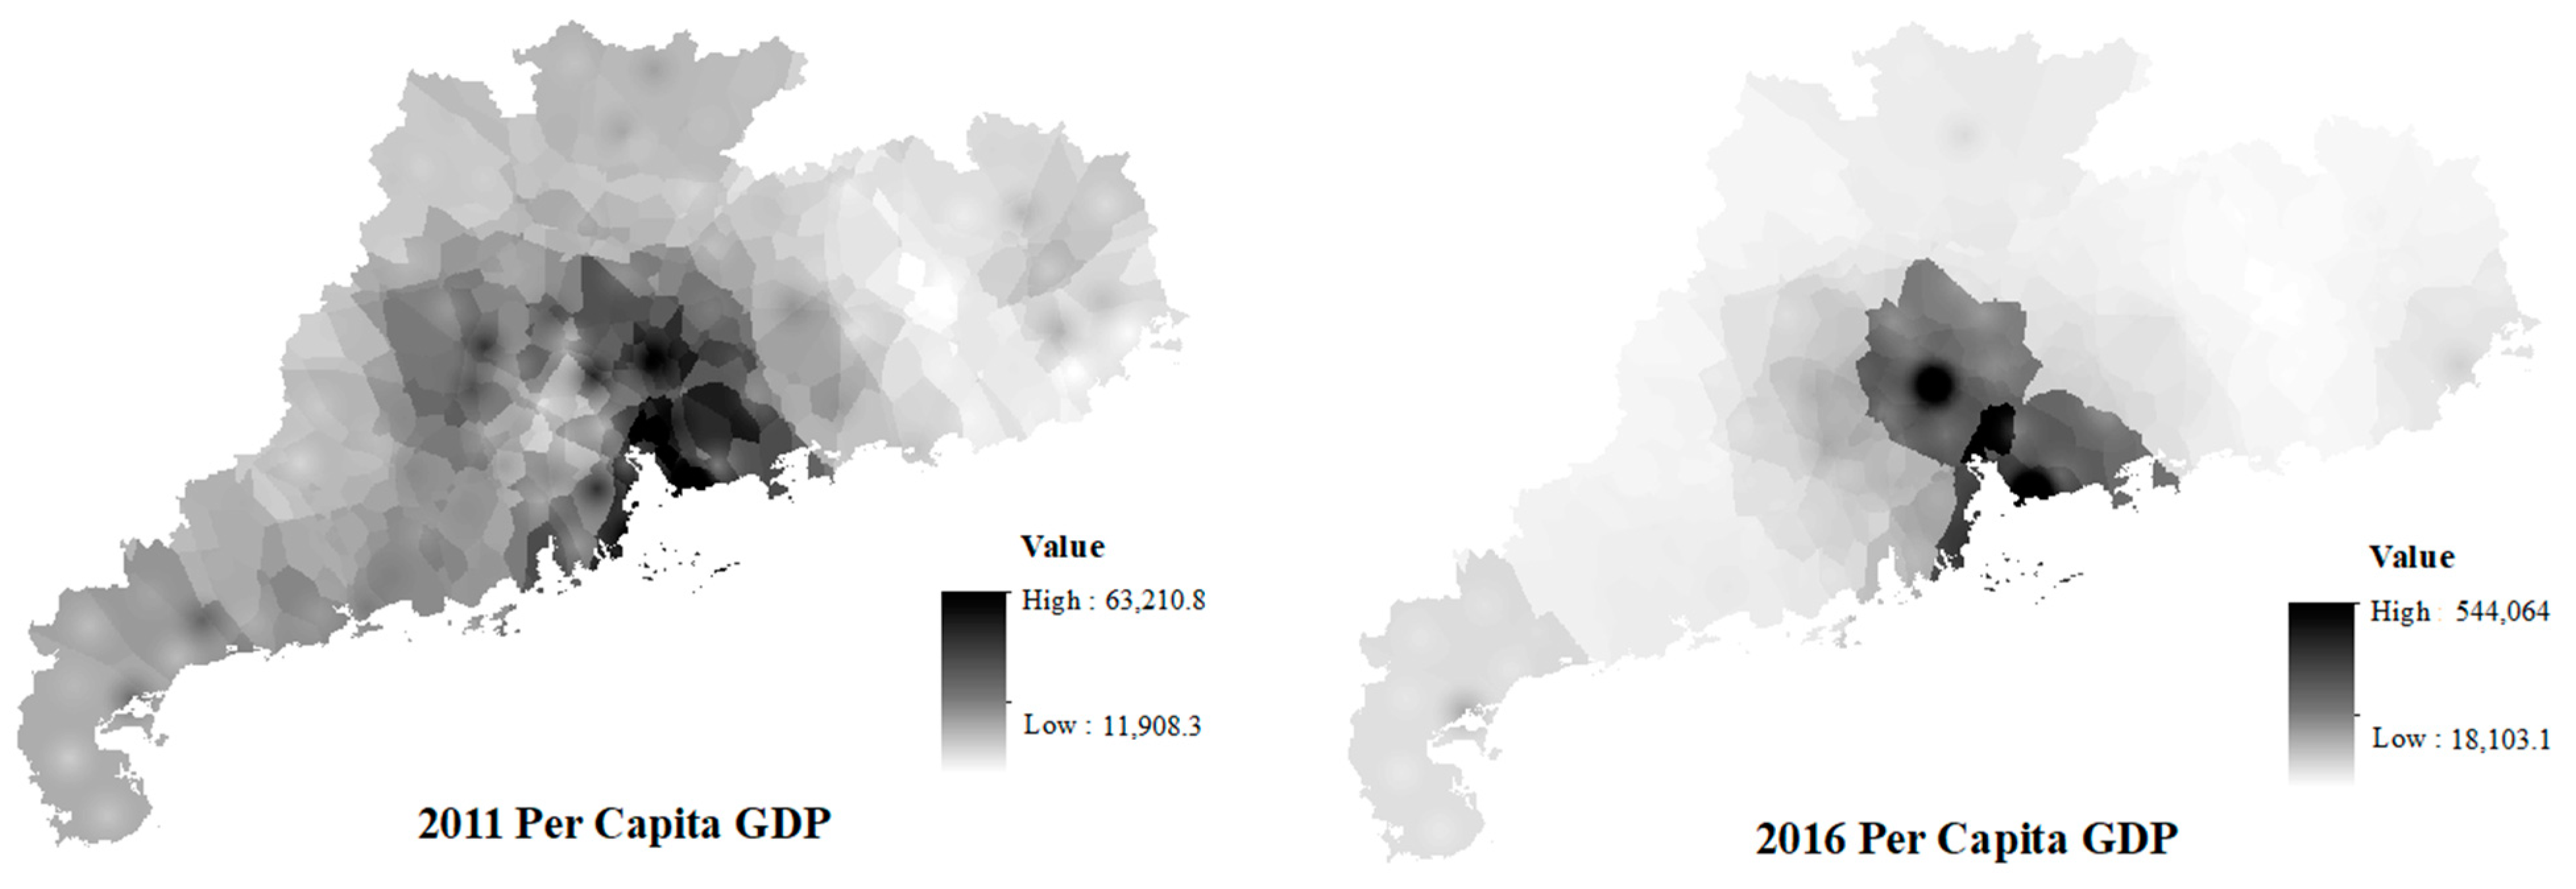
5.1. Economic Convergence and Spatial Autocorrelation Structure
5.2. Analysis of the Networking Structure of Spatial Economic Associations
5.2.1. Network Cohesion Analysis
5.2.2. Structural Centrality Analysis
5.2.3. Subgroup Analysis
5.3. Analysis of Influential Elements in the Spatial Economy
6. Discussion
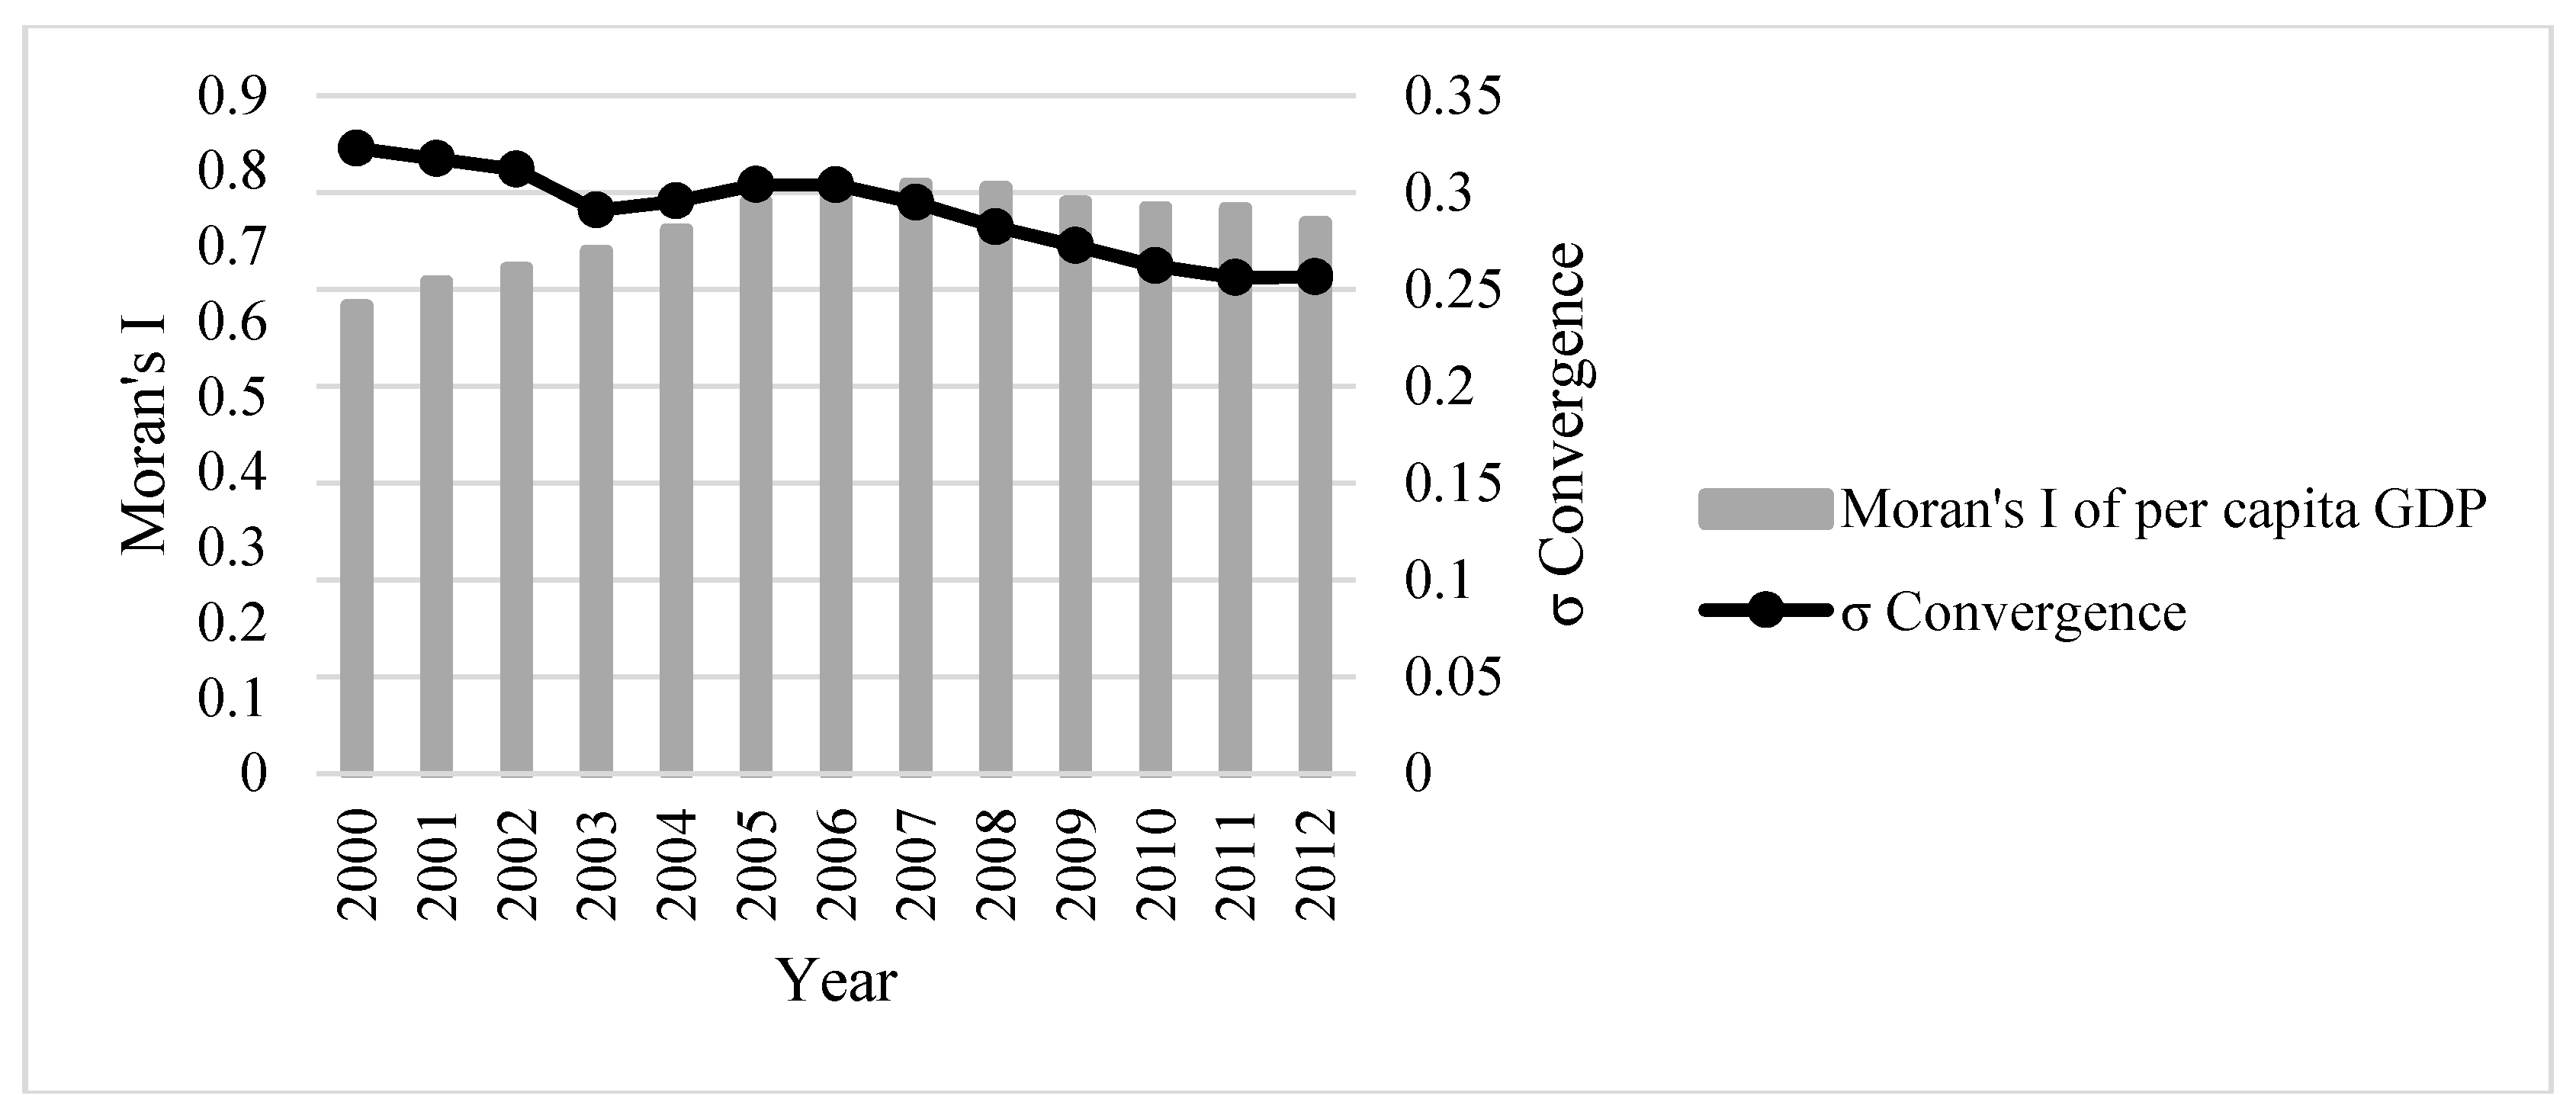
- From 2001 to 2016, with the rapid development of the economy and urbanization, the development level of Guangdong Province continually increased towards that of developed countries; the economics showed a double-core/peripheral (i.e., the Guangzhou–Shenzhen peripheral pattern of convergence), and the degree of agglomeration maintained a relatively high level and reached its highest value in 2007. Similarly, Liang [61] verified that a rapid growth is the main feature of Guangdong which has still not reached the optimal sustainable state due to the lack of efficiency.
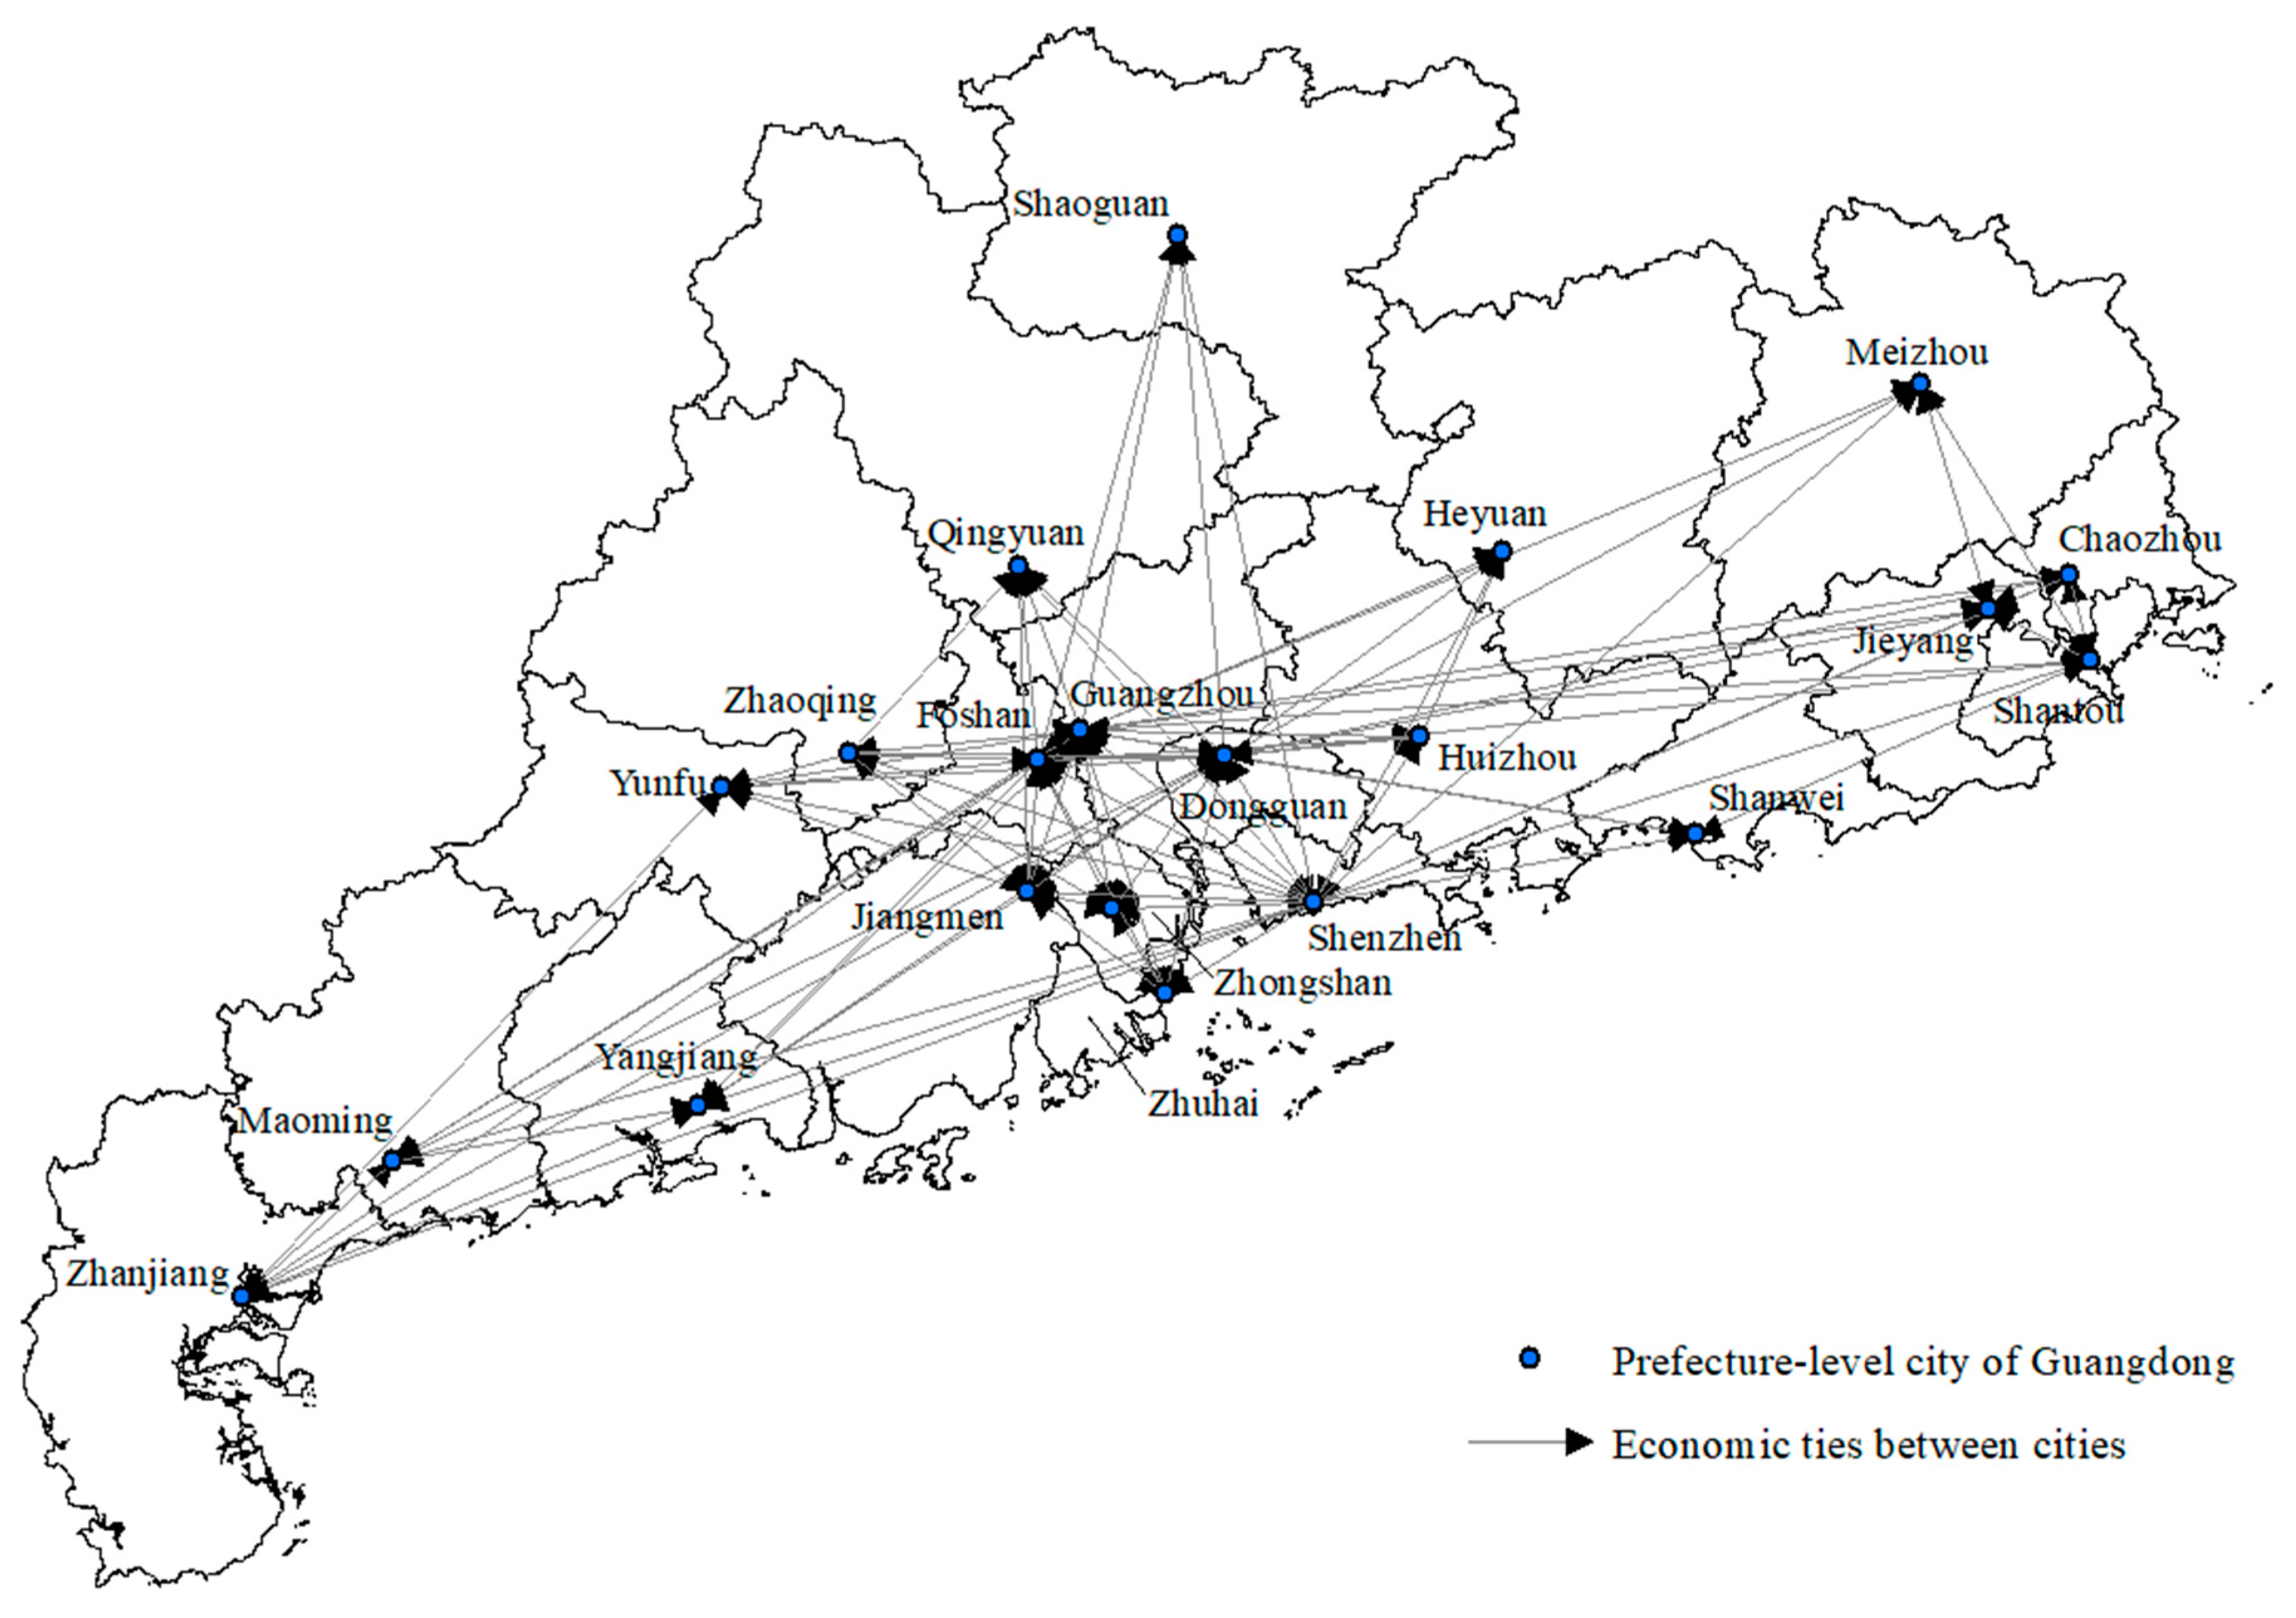
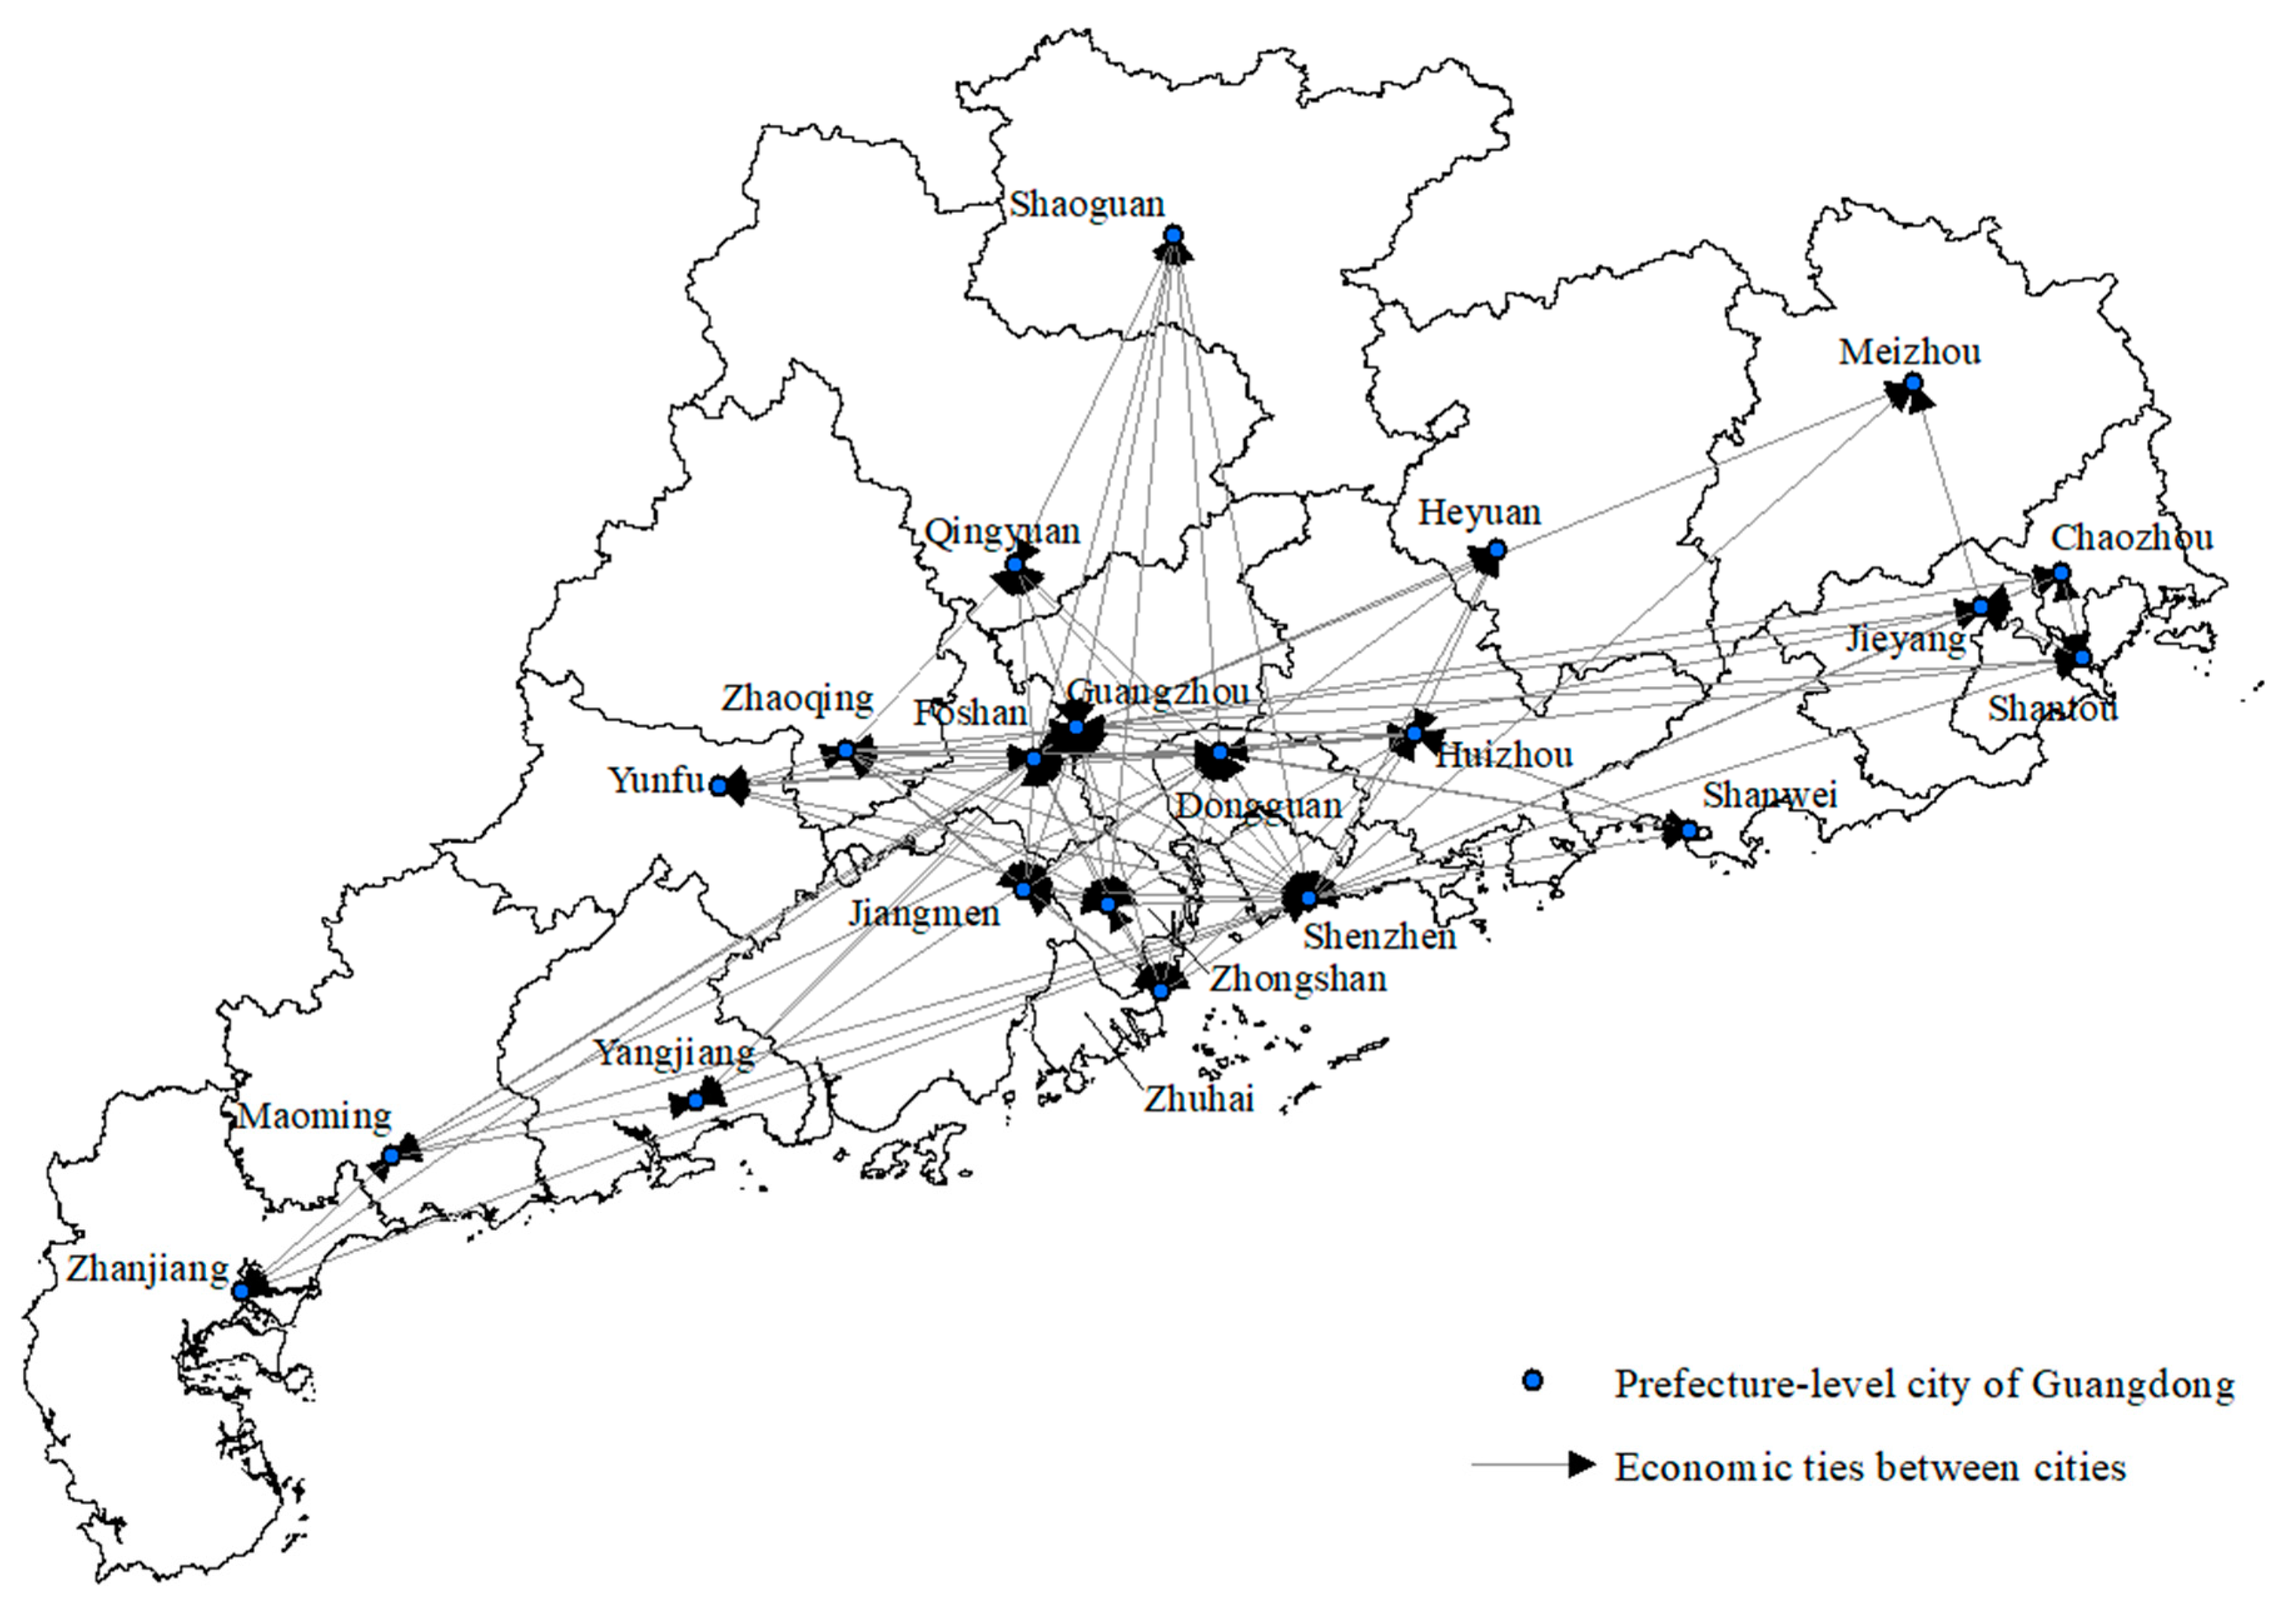
- From the perspective of the whole network, moderate economic ties in this network formed, which implied that this region had a complete network with smooth communications and exchanges. From a regional perspective, the radiation strength and effective central attraction effects of Guangzhou and Shenzhen continuously increased, especially for peripheral cities in the Pearl River Delta. The increase in the centrality of Shenzhen obviously accelerated, with an economic strength that was expected to advance that of Guangzhou. Meanwhile, associations among cities within the Pearl River Delta gradually strengthened. However, Heyuan and Yangjiang had weak ties with other cities and fewer external economic interactions. In addition, among the cities in the Pearl River Delta, Foshan and Dongguan had relatively strong absorptive abilities. The central state of Dongguan has declined, and the importance of Foshan and Zhongshan had improved. Huizhou and Foshan played very important betweenness roles, with exchange and cooperation statuses that had improved.
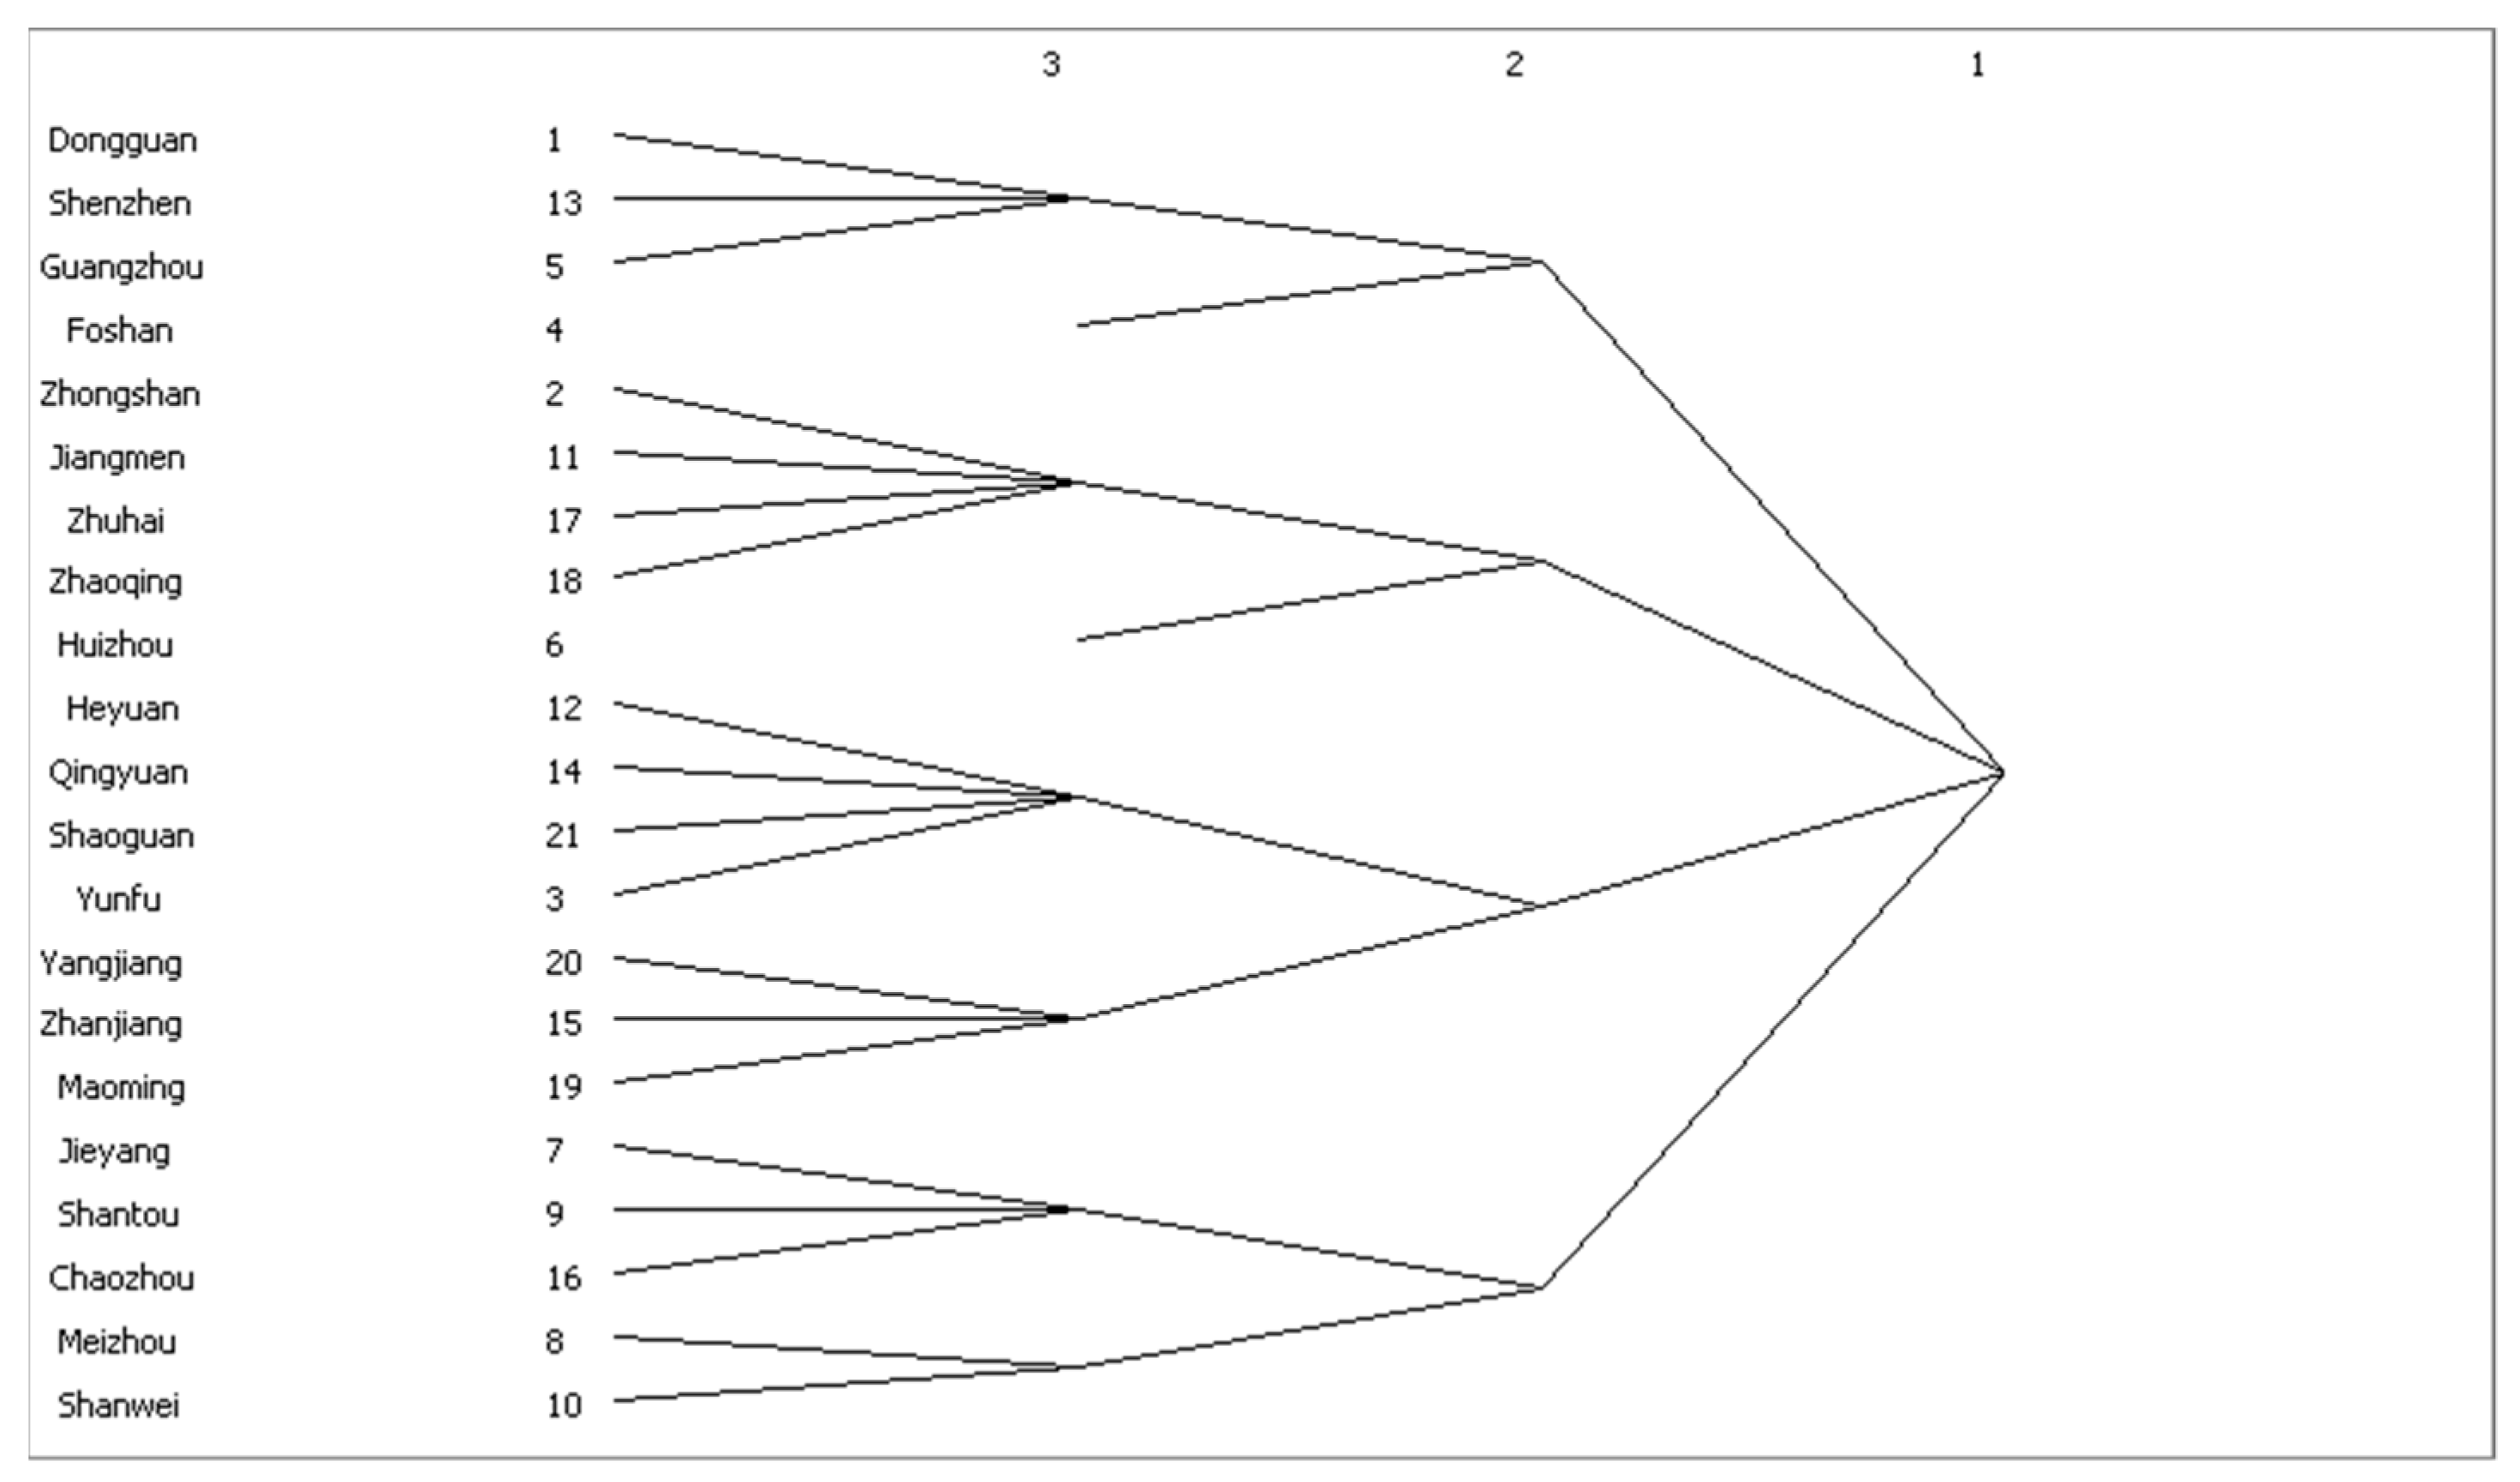
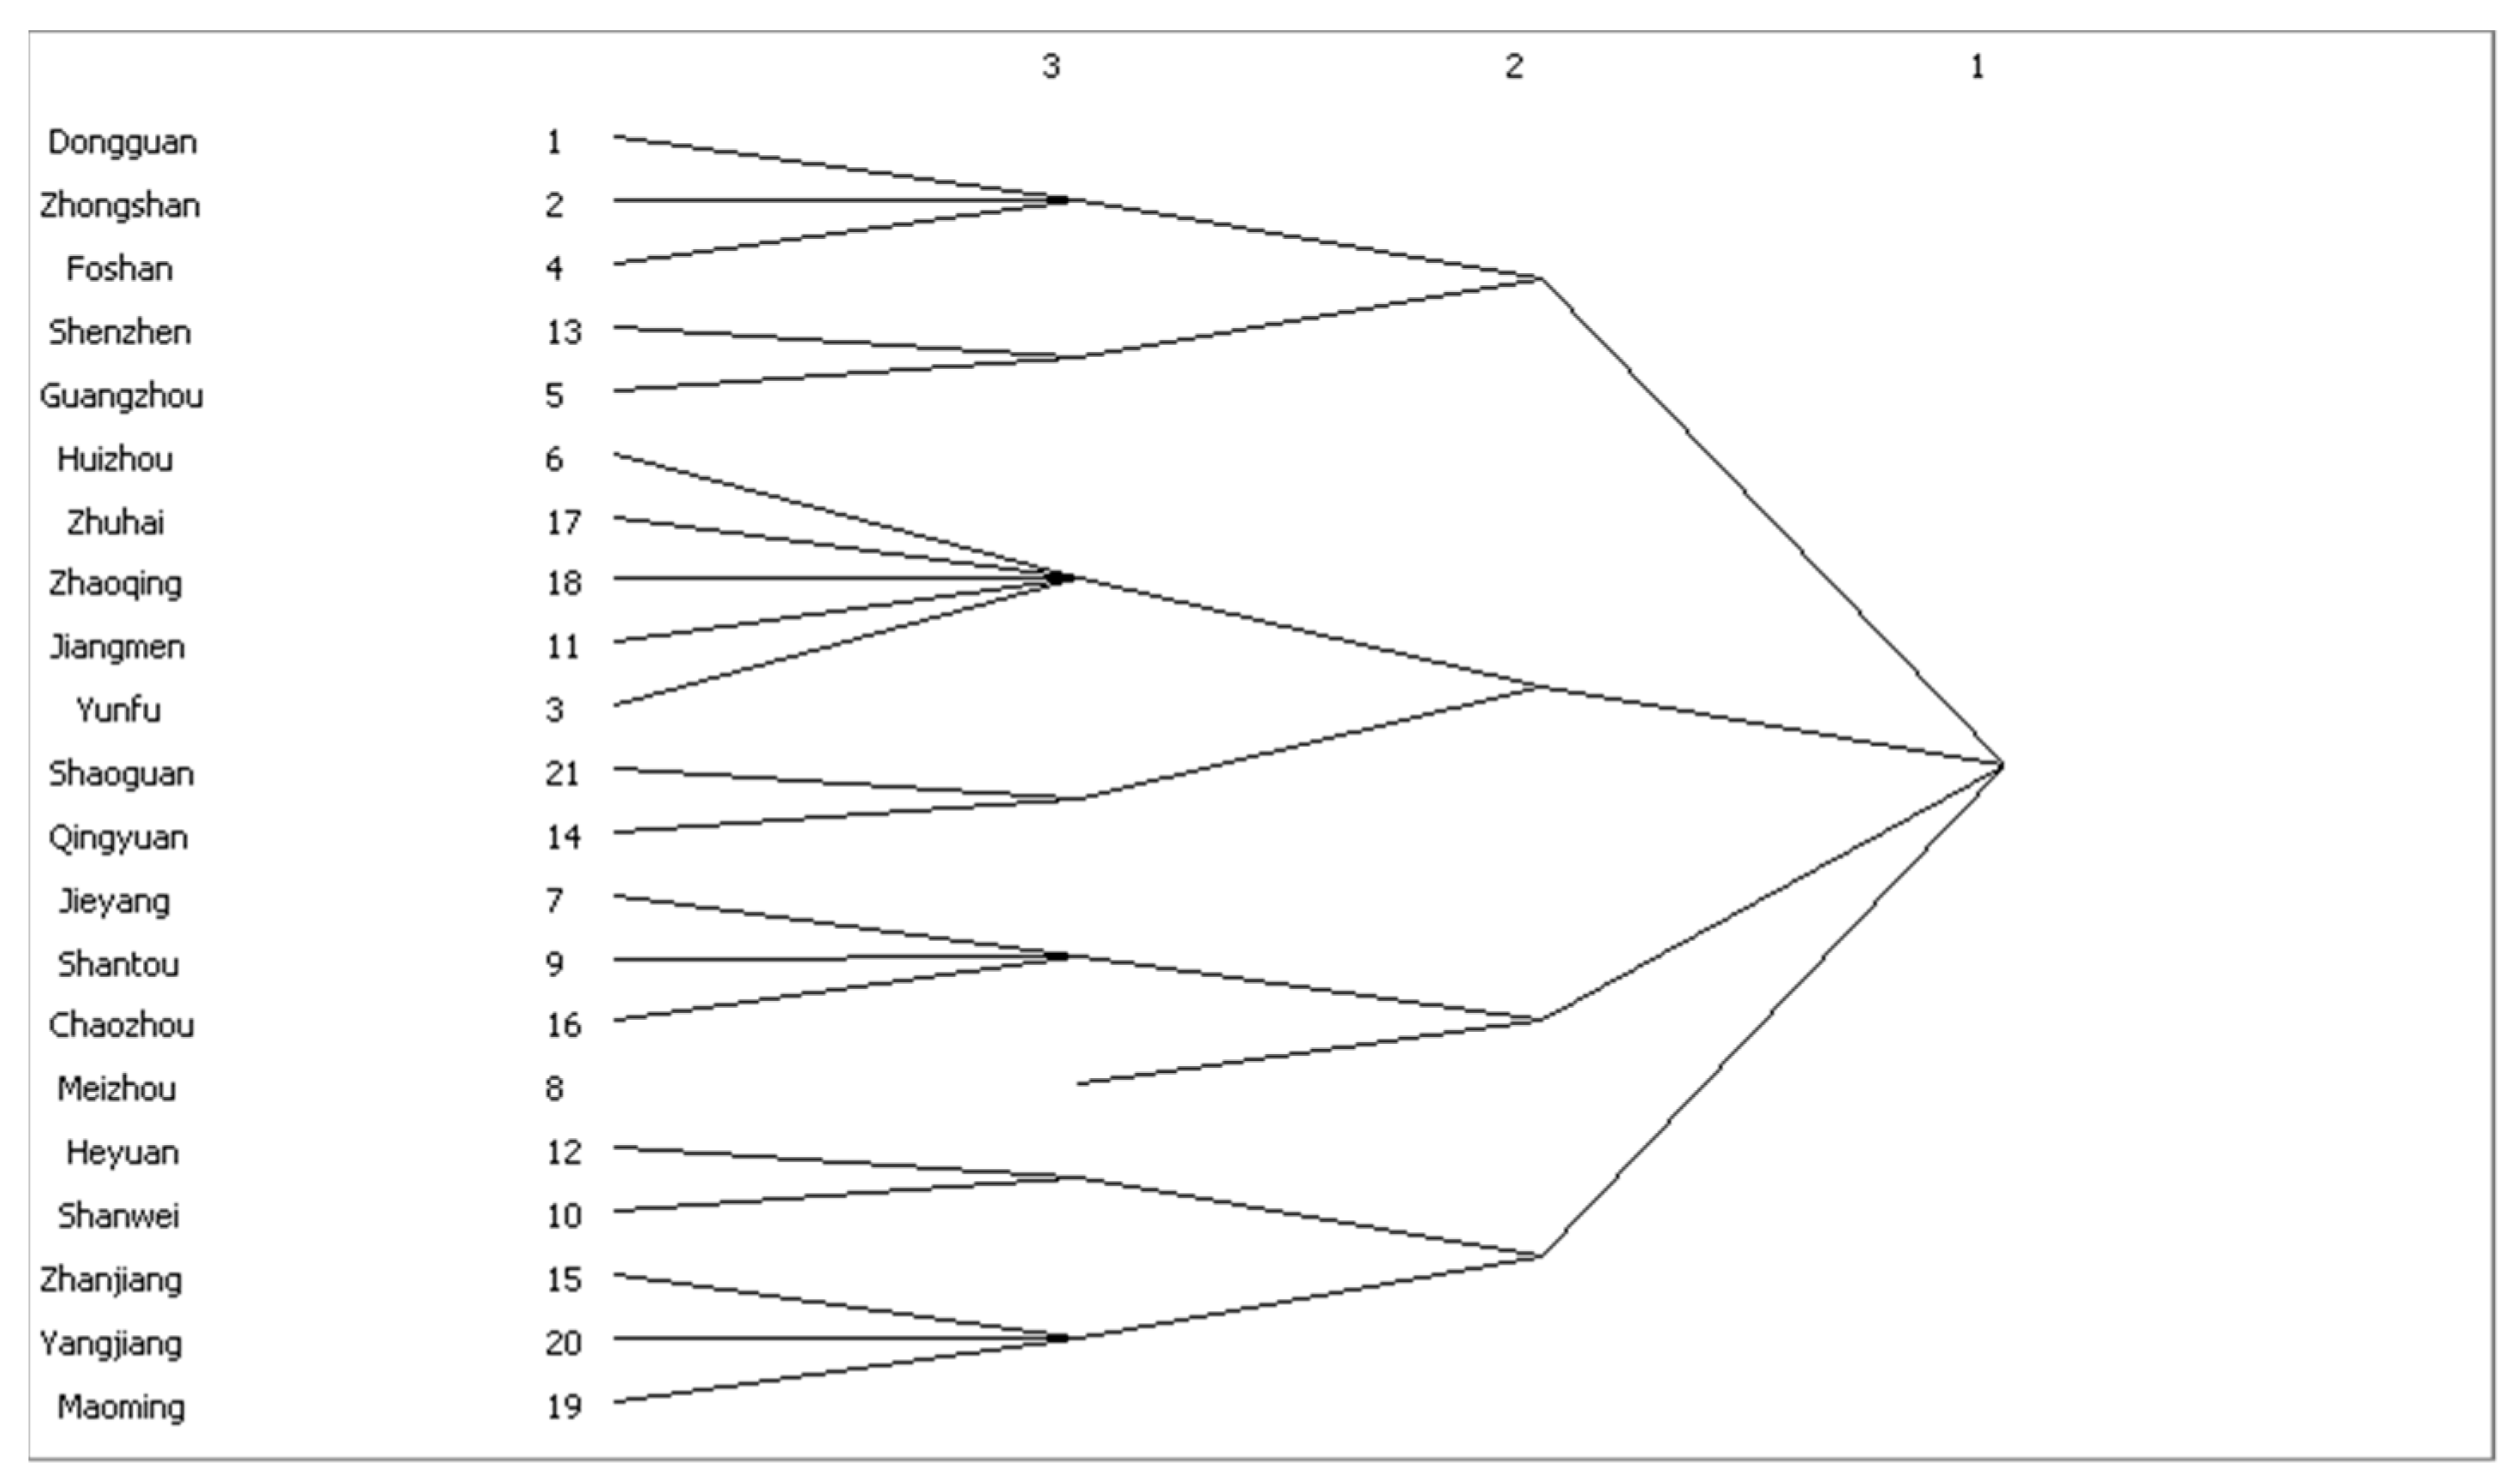
- Guangdong could be divided into eight significant subgroups in 2001 and 2016, with obvious heterogeneity and several changes in composition when compared with the subgroups in 2001, particularly in the western, eastern and northern mountainous areas of Guangdong. From the perspective of subgroup interactions, the economic patterns driven by the subgroups of central cities were formed, and exchanges and cooperation among subgroups needed to be denser.
- From the perspective of the city itself from 2001 to 2016, regional economic growth had obvious spatial spillover effects, and low-value clusters had been constantly impacted by high-value clusters. The traffic mileage and fund investment of R&D activity had relatively great impacts on economic agglomeration and networking interactions. The urbanization rate contributed to the local economic development, while it had a negative impact on neighboring cities’ economy, due to the siphon effect of the large cities. Urban quality improvements, road construction and technological development could make the exchange of commodities and the work force more frequently and constantly facilitate localized spillovers via local networks. Many empirical studies have verified that economic growth is closely correlated with urbanization, the traffic mileage and fund investment of R&D activity. For example, Xu Zhang [62] studies links between technology level and economy growth. Lee [63] examines the relation between urbanization and economic growth in India.
7. Conclusions
Author Contributions
Funding
Acknowledgments
Conflicts of Interest
References
- World Bank. GDP (Current US$). In World Development Indicators [Database] 2018. Available online: http://databank.worldbank.org/data/reports.aspx?source=world-development-indicators (accessed on 6 August 2018).
- UN-HABITAT. Urbanization and Development: Emerging Futures; United Nations: New York, NY, USA, 2016. [Google Scholar]
- Fujita, M.; Thisse, J.-F. New economic geography: An appraisal on the occasion of Paul Krugman’s 2008 nobel prize in economic sciences. Reg. Sci. Urban Econ. 2009, 39, 109–119. [Google Scholar] [CrossRef]
- Er, D. 2016 China urban agglomeration development status and trends. Constr. Inf. China 2016, 9, 14–17. [Google Scholar]
- Baldwin, R.E.; Martin, P. Agglomeration and regional growth. In Handbook of Regional and Urban Economics; Henderson, J.V., Thisse, J.-F., Eds.; Elsevier: New York, NY, USA, 2004; Volume 4, Chapter 60; pp. 2671–2711. [Google Scholar]
- Long, G.Y. Measuring the spillover effects: Some Chinese evidence. Pap. Reg. Sci. 2000, 79, 75–89. [Google Scholar]
- Fujita, M.; Thisse, J.-F. Economics of Agglomeration: Cities, Industrial Location, and Globalization; Cambridge University Press: Cambridge, UK, 2013. [Google Scholar]
- Lessmann, C. Spatial inequality and development—Is there an inverted-U relationship? J. Dev. Econ. 2014, 106, 35–51. [Google Scholar] [CrossRef]
- Armeanu, D.Ş.; Vintilă, G.; Gherghina, Ş.C. Empirical study towards the drivers of sustainable economic growth in EU-28 countries. Sustainability 2017, 10, 4. [Google Scholar] [CrossRef]
- Borowczyk, J. Sustainable urban development: Spatial analyses as novel tools for planning a universally designed city. Sustainability 2018, 10, 1407. [Google Scholar] [CrossRef]
- Li, B.; Chen, C.; Hu, B. Governing urbanization and the new urbanization plan in China. Environ. Urban. 2016, 28, 515–534. [Google Scholar] [CrossRef]
- Tabuchi, T. Agglomeration in world cities. Procedia Soc. Behav. Sci. 2013, 77, 299–307. [Google Scholar] [CrossRef]
- Antonio Ricci, L. Economic geography and comparative advantage: Agglomeration versus specialization. Eur. Econ. Rev. 1999, 43, 357–377. [Google Scholar] [CrossRef]
- Liu, Q.; Mi, Y. The effect of agglomeration economy of city group on employment: Evidence from ten city groups in China. Mod. Econ. 2017, 8, 643–654. [Google Scholar] [CrossRef]
- Martin, P.; Ottaviano Gianmarco, I.P. Growth and agglomeration. Int. Econ. Rev. 2001, 42, 947–968. [Google Scholar] [CrossRef]
- Geneletti, D.; La Rosa, D.; Spyra, M.; Cortinovis, C. A review of approaches and challenges for sustainable planning in urban peripheries. Landsc. Urban Plan. 2017, 165, 231–243. [Google Scholar] [CrossRef]
- Anselin, L. Lagrange multiplier test diagnostics for spatial dependence and spatial heterogeneity. Geogr. Anal. 1988, 20, 1–17. [Google Scholar] [CrossRef]
- Zipf, G.K. The P1P2/D hypothesis: On the intercity movement of persons. Am. Sociol. Rev. 1946, 11, 677–686. [Google Scholar] [CrossRef]
- Reilly, W.J. The Law of Retail Gravitation; Pilsbury: New York, NY, USA, 1931. [Google Scholar]
- Ullman, E.L.; Boyce, R.R. Geography as Spatial Interaction; University of Washington Press: Washington, DC, USA, 1980; pp. 13–27. [Google Scholar]
- Krugman, P. Increasing returns and economic geography. J. Political Econ. 1990, 99, 483–499. [Google Scholar] [CrossRef]
- Krugman, P.; Elizondo, R.L. Trade policy and the third world metropolis. J. Dev. Econ. 2000, 49, 137–150. [Google Scholar] [CrossRef]
- Feldman, M.P. Location and innovation: The new economic geography of innovation, spillovers, and agglomeration. In Oxford Handbook of Economic Geography; Oxford Press: Oxford, UK, 2000; Volume 1, pp. 373–395. [Google Scholar]
- Quigley, J.M. Urbanization, agglomeration, and economic development. In Urbanization and Growth: Commission on Growth and Development Working Paper; Buckley, R.M., Patricia, C.A., Michael, S., Eds.; World Bank: Washington, DC, USA, 2008; pp. 1–36. [Google Scholar]
- LeSage, J.; Pace, R.K. An Introduction to Spatial Econometrics; CRC Press: Boca Raton, FL, USA, 2009. [Google Scholar]
- Anselin, L.; Florax, R.; Rey, S.J. Advances in Spatial Econometrics: Methodology, Tools and Applications; Springer: Berlin, Germany, 2013. [Google Scholar]
- Jackson, M.O. Social and Economic Networks; Princeton University Press: Princeton, NJ, USA, 2010. [Google Scholar]
- Zhong, C.; Arisona, S.M.; Huang, X.; Batty, M.; Schmitt, G. Detecting the dynamics of urban structure through spatial network analysis. Int. J. Geogr. Inf. Sci. 2014, 28, 2178–2199. [Google Scholar] [CrossRef]
- Ducruet, C.; Beauguitte, L. Spatial science and network science: Review and outcomes of a complex relationship. Netw. Spat. Econ. 2014, 14, 297–316. [Google Scholar] [CrossRef]
- Scott, J. Social Network Analysis; Sage: Newcastle upon Tyne, UK, 2017. [Google Scholar]
- World Bank. East Asia’s Changing Urban Landscape: Measuring a Decade of Spatial Growth. Available online: http://www.worldbank.org/en/topic/urbandevelopment/publication/east-asias-changing-urban-landscape-measuring-a-decade-of-spatial-growth (accessed on 13 May 2018).
- Solow, R.M. A contribution to the theory of economic growth. Q. J. Econ. 1956, 70, 65–94. [Google Scholar] [CrossRef]
- Swan, T.W. Economic growth and capital accumulation. Econ. Rec. 1956, 32, 334–361. [Google Scholar] [CrossRef]
- Barro, R.J. Economic growth and convergence, applied to China. China World Econ. 2016, 24, 5–19. [Google Scholar] [CrossRef]
- Sala-i-Martin, X.X. The classical approach to convergence analysis. Econ. J. 1996, 106, 1019–1036. [Google Scholar] [CrossRef]
- LeSage, J.P. Spatial econometrics: Statistical foundations and applications to regional convergence. J. Reg. Sci. 2007, 47, 646–648. [Google Scholar]
- Anselin, L. Local indicators of spatial association—Lisa. Geogr. Anal. 1995, 27, 93–115. [Google Scholar] [CrossRef]
- Liu, C.; Yu, R.; Xiong, J.; Zhu, J.; Zhang, H. The spatial structure of economic linkage of Wuhan metropolitan area. Geogr. Res. 2007, 26, 197–209. [Google Scholar]
- United Nations. State of the World’s Cities 2012/2013; United Nations Human Settlements: New York, NY, USA, 2012. [Google Scholar]
- Yue, W.; Liu, Y.; Fan, P. Measuring urban sprawl and its drivers in large Chinese cities: The case of Hangzhou. Land Use Policy 2013, 31, 358–370. [Google Scholar] [CrossRef]
- Egger, P.; Pfaffermayr, M. The proper panel econometric specification of the gravity equation: A three-way model with bilateral interaction effects. Empir. Econ. 2003, 28, 571–580. [Google Scholar] [CrossRef]
- Anderson, J.E. The gravity model. Annu. Rev. Econ. 2011, 3, 133–160. [Google Scholar] [CrossRef]
- Yin, M.; Bertolini, L.; Duan, J. The effects of the high-speed railway on urban development: International experience and potential implications for China. Prog. Plan. 2015, 98, 1–52. [Google Scholar] [CrossRef]
- Burt, R.S. The network structure of social capital. Res. Org. Behav. 2000, 22, 345–423. [Google Scholar] [CrossRef]
- Marin, A.; Wellman, B. Social network analysis: An introduction. In The Sage Handbook of Social Network Analysis; Scott, J., Carrington, P.J., Eds.; Sage: London, UK, 2011; pp. 11–25. [Google Scholar]
- Oliveira, M.; Gama, J. An overview of social network analysis. Wiley Interdiscip. Rev. Data Min. Knowl. Discov. 2012, 2, 99–115. [Google Scholar] [CrossRef]
- Boorman, S.A.; White, H.C. Social structure from multiple networks. II. Role structures. Am. J. Sociol. 1976, 81, 1384–1446. [Google Scholar] [CrossRef]
- Ramos, R. Advances in spatial econometrics. Methodology, tools and applications. Investig. Reg. 2005, 45, 866–870. [Google Scholar]
- Baltagi, B.H. The Oxford handbook of panel data. In Oxford Handbooks; Oxford Press: Oxford, UK, 2015. [Google Scholar]
- Cho, G. Spatial Processes: Models and Applications; Cliff, A.D., Ord, J.K., Eds.; Pion Limited: London, UK, 2018. [Google Scholar]
- Zhen, F.; Wang, B.; Yingxue, C. China’s city network characteristics based on social network space: An empirical analysis of sina micro-blog. Acta Geogr. Sin. 2012, 67, 1031–1043. [Google Scholar]
- Freeman, L.C. Centrality in social networks conceptual clarification. Soc. Netw. 1978, 1, 215–239. [Google Scholar] [CrossRef]
- Breiger, R.L.; Boorman, S.A.; Arabie, P. An algorithm for clustering relational data with applications to social network analysis and comparison with multidimensional scaling. J. Math. Psychol. 1975, 12, 328–383. [Google Scholar] [CrossRef]
- Elhorst, J.P. Specification and estimation of spatial panel data models. Int. Reg. Sci. Rev. 2003, 26, 244–268. [Google Scholar] [CrossRef]
- Sun, X.; Chen, F.; Hewings, G.J.D. Spatial perspective on regional growth in China: Evidence from an extended neoclassic growth model. Emerg. Mark. Financ. Trade 2017, 53, 2063–2081. [Google Scholar] [CrossRef]
- Lv, K.; Yu, A.; Gong, S.; Wu, M.; Xu, X. Impacts of educational factors on economic growth in regions of China: A spatial econometric approach. Technol. Econ. Dev. Econ. 2017, 23, 827–847. [Google Scholar] [CrossRef]
- Jiang, X.; He, X.; Zhang, L.; Qin, H.; Shao, F. Multimodal transportation infrastructure investment and regional economic development: A structural equation modeling empirical analysis in China from 1986 to 2011. Transp. Policy 2017, 54, 43–52. [Google Scholar] [CrossRef]
- Henderson, J.V. Urbanization, Economic Geography, and Growth. In Handbook of Economic Growth; Elsevier: New York, NY, USA, 2003. [Google Scholar]
- Chybowska, D.; Chybowski, L.; Souchkov, V. R&D in poland: Is the country close to a knowledge-driven economy? Manag. Syst. Prod. Eng. 2018, 26, 99–105. [Google Scholar]
- Liu, X.H.; Zhang, X.L.; Peng, M.M. Traffic infrastructure investment and regional economic growth—An empirical analysis on the case of west China development. Areal Res. Dev. 2009, 4, 57–61. [Google Scholar]
- Liang, J.; Hu, K.; Dai, T. Ecological network analysis quantifying the sustainability of regional economies: A case study of Guangdong Province in China. Chin. Geogr. Sci. 2018, 28, 127–136. [Google Scholar] [CrossRef]
- Zhang, X. The impact of industrial agglomeration on firm employment and productivity in Guangdong Province, China. Asian Econ. Financ. Rev. 2014, 4, 1389–1408. [Google Scholar]
- Lee, S.; Cho, O.J. The analysis of the relationship between urbanization and economic growth in India. Ordo Econ. J. 2018, 20, 97–120. [Google Scholar] [CrossRef]
- Fang, C.; Wang, Z.; Ma, H. The theoretical cognition of the development law of China’s urban agglomeration and academic contribution. Acta Geogr. Sin. 2018, 73, 651–665. [Google Scholar]
| Network Cohesion | 2001 | 2016 |
|---|---|---|
| Density | 0.2929 | 0.3119 |
| Average distance (among reachable pairs) | 1.866 | 1.618 |
| Distance-based cohesion (ranging from 0 to 1; larger values indicate greater cohesiveness) | 0.449 | 0.497 |
| Distance-weighted fragmentation (i.e., breadth) | 0.551 | 0.503 |
| 2001 | 2016 | ||||||||
|---|---|---|---|---|---|---|---|---|---|
| Degree Centrality | Betweenness Centrality | Degree Centrality | Betweenness Centrality | ||||||
| City | Out | In | City | Centrality | City | Out | In | City | Centrality |
| Guangzhou | 112.613 | 35.384 | Guangzhou | 57.767 | Guangzhou | 8430.782 | 3784.54 | Shenzhen | 56.488 |
| Shenzhen | 37.715 | 16.27 | Zhaoqing | 51.333 | Shenzhen | 4473.179 | 2591.381 | Guangzhou | 48.271 |
| Dongguan | 32.977 | 52.928 | Dongguan | 38.767 | Foshan | 1668.467 | 2654.536 | Huizhou | 23.286 |
| Foshan | 31.186 | 42.796 | Yunfu | 34 | Dongguan | 1279.92 | 2819.572 | Foshan | 18.793 |
| Jiangmen | 9.602 | 17.724 | Zhanjiang | 18 | Zhongshan | 492.96 | 957.691 | Dongguan | 17.121 |
| Zhongshan | 6.127 | 15.07 | Shenzhen | 13.783 | Huizhou | 379.487 | 1244.801 | Zhaoqing | 7.907 |
| Shantou | 5.349 | 5.368 | Foshan | 12.517 | Jiangmen | 284.538 | 709.019 | Zhongshan | 3.267 |
| Huizhou | 4.641 | 9.572 | Jiangmen | 5.183 | Zhaoqing | 203.754 | 920.344 | Jieyang | 2.583 |
| Jieyang | 4.356 | 5.585 | Shantou | 3.5 | Jieyang | 140.247 | 108.024 | Maoming | 1.867 |
| Zhuhai | 3.973 | 8.927 | Jieyang | 3.5 | Qingyuan | 89.22 | 818.273 | Zhuhai | 0.833 |
| Zhaoqing | 3.797 | 10.877 | Zhongshan | 0.4 | Zhuhai | 89.021 | 262.459 | Shantou | 0.25 |
| Maoming | 3.141 | 3.876 | Huizhou | 0.25 | Shantou | 81.747 | 76.95 | Shaoguan | 0.167 |
| Zhanjiang | 2.702 | 3.99 | Heyuan | 0 | Chaozhou | 71.285 | 156.055 | Qingyuan | 0.167 |
| Chaozhou | 2.314 | 5.308 | Qingyuan | 0 | Shaoguan | 39.41 | 229.943 | Shanwei | 0 |
| Qingyuan | 1.763 | 10.87 | Shanwei | 0 | Yunfu | 24.29 | 162.414 | Yunfu | 0 |
| Yunfu | 1.361 | 6.11 | Chaozhou | 0 | Shanwei | 22.847 | 164.357 | Chaozhou | 0 |
| Meizhou | 1.201 | 3.199 | Zhuhai | 0 | Maoming | 22.533 | 35.037 | Zhanjiang | 0 |
| Shaoguan | 1.058 | 3.947 | Meizhou | 0 | Zhanjiang | 17.867 | 26.93 | Meizhou | 0 |
| Yangjiang | 1.033 | 3.946 | Maoming | 0 | Heyuan | 11.257 | 61.897 | Heyuan | 0 |
| Shanwei | 0.629 | 3.018 | Yangjiang | 0 | Yangjiang | 8.521 | 30.367 | Yangjiang | 0 |
| Heyuan | 0.433 | 3.205 | Shaoguan | 0 | Meizhou | 7.859 | 24.6 | Jiangmen | 0 |
| Centralization | 15.640% | 6.291% | 12.82% | Centralization | 17.577% | 6.805% | 13.23% | ||
| Variable | Description | Mean | S.D. | Max | Min |
|---|---|---|---|---|---|
| PCGDP | The per capita GDP in area i in year t (ten thousand yuan) | 30,264.24 | 24,460.85 | 123,247 | 5061.545 |
| URBit | The urbanization rate of area i during year t (%) | 64.495 | 22.35231 | 100 | 32.47 |
| Lit | Traffic mileage in area i during year t (km) | 7602.31 | 5256.47 | 21,502.00 | 853.30 |
| RDit | Fund investment of R&D activity in area i during year t (hundred million yuan) | 262,598.6 | 603,115.5 | 4,618,655 | 336 |
| Variable | Coefficient | t-Statistic | t-Probability |
|---|---|---|---|
| Highway mileage (Lit) | 183.202017 | 7.678411 | 0.000001 |
| R&D expenditures (RDit) | 0.012096 | 5.099947 | 0.000000 |
| Urbanization rate (URBit) | 288.359512 | 15.578614 | 0.000000 |
| R2 | 0.6902 | Rbar-squared | 0.6872 |
| 188,053,646.8194 | Nobs, Nvars | 210, 3 |
| Spatial Error Model (SEM) | Spatial Lag Model (SLM) | Spatial Durbin Model (SDM) | ||||
|---|---|---|---|---|---|---|
| Estimate | t-Value | Estimate | t-Value | Estimate | t-Value | |
| Highway mileage (Lit) | 168.688411 *** | 8.866673 | 127.024685 *** | 8.390077 | 155.173311 *** | 9.682629 |
| R&D expenditures (RDit) | 0.011458 *** | 6.059708 | 0.006999 *** | 4.316084 | 0.007686 *** | 4.757182 |
| Urbanization rate (URBit) | 118.303907 *** | 4.644702 | 430.487542 *** | 12.861100 | 516.475463 *** | 11.946469 |
| (rho) | 0.404981 *** | 8.929087 | 0.439970 *** | 6.211054 | ||
| W × Lit | 33.059956 | 0.832881 | ||||
| W × RDit | 0.007355 * | 1.698768 | ||||
| W × URBit | 43.1724 *** | 7.243728 | ||||
| (lambda) | 0.765975 *** | 18.484891 | ||||
| R-squared | 0.7589 | 0.8425 | 0.8496 | |||
| Rbar-squared | 0.7566 | 0.8410 | 0.8451 | |||
| Log-likelihood | −2182.1324 | −2172.1397 | −2135.7666 | |||
| Variable | Direct Effect | Indirect Effect | Total Effect |
|---|---|---|---|
| Highway mileage (Lit) | 167.433037 *** | 164.883100 * | 332.316138 *** |
| R&D expenditures (RDit) | 0.008977 *** | 0.018187 * | 0.027164 ** |
| Urbanization rate (URBit) | 472.558033 *** | −315.518797 *** | 157.039236 * |
© 2018 by the authors. Licensee MDPI, Basel, Switzerland. This article is an open access article distributed under the terms and conditions of the Creative Commons Attribution (CC BY) license (http://creativecommons.org/licenses/by/4.0/).
Share and Cite
Jin, R.; Gong, J.; Deng, M.; Wan, Y.; Yang, X. A Framework for Spatiotemporal Analysis of Regional Economic Agglomeration Patterns. Sustainability 2018, 10, 2800. https://doi.org/10.3390/su10082800
Jin R, Gong J, Deng M, Wan Y, Yang X. A Framework for Spatiotemporal Analysis of Regional Economic Agglomeration Patterns. Sustainability. 2018; 10(8):2800. https://doi.org/10.3390/su10082800
Chicago/Turabian StyleJin, Rui, Jianya Gong, Min Deng, Yiliang Wan, and Xuexi Yang. 2018. "A Framework for Spatiotemporal Analysis of Regional Economic Agglomeration Patterns" Sustainability 10, no. 8: 2800. https://doi.org/10.3390/su10082800
APA StyleJin, R., Gong, J., Deng, M., Wan, Y., & Yang, X. (2018). A Framework for Spatiotemporal Analysis of Regional Economic Agglomeration Patterns. Sustainability, 10(8), 2800. https://doi.org/10.3390/su10082800


