Article

A Bus Service Evaluation Method from Passenger’s Perspective Based on Satisfaction Surveys: A Case Study of Beijing, China

1
Beijing Key Laboratory of Traffic Engineering, Beijing University of Technology, Beijing 100124, China
2
China Aerospace Science & Industry Corp., Beijing 100000, China
3
Beijing Municipal Commission of Transport, Beijing Municipal Transportation Operations Coordination Center, Beijing 100000, China
*
Author to whom correspondence should be addressed.
Sustainability 2018, 10(8), 2723; https://doi.org/10.3390/su10082723
Submission received: 10 July 2018 / Revised: 24 July 2018 / Accepted: 26 July 2018 / Published: 2 August 2018

Abstract

:
As an important part of urban public transport, bus service quality is an important factor affecting the choice of passenger travel mode. This paper constructs a set of satisfaction evaluation indicator systems from the perspective of passenger perception, covering the whole travel process. It is composed of 6 first-level indexes (timeliness, safety, convenience, comfort, reliability and economy) and 21 second-level indexes. Considering the scale of bus service in Beijing, this research carried out a stratified sampling on 100 bus lines and collected 3012 field questionnaire surveys. The basic information of the bus routes investigated, demographic questions and their opinions of the satisfaction of the bus service were all recorded in the questionnaire. After testing the reliability and validity of the indicator system, the paper proposes a satisfaction evaluation model weighted by the related coefficient. The results show that overall satisfaction score is 78.2 and the proportion of bus passengers who are satisfied with the bus service nearly 70%. Multivariate analysis of variance methods were employed to evaluate the satisfaction influencing factors. Conclusions can be drawn that the satisfaction score of timeliness is lowest, which is mainly influenced by three factors: the passenger’s age, travel purpose and time. The research provides positive contributions toward normalizing performance evaluation for public transportation and enhancing the sustainable development of bus.

1. Introduction

Customer satisfaction with the public transport system has practical significance for the related decision-making departments. As a public service in Beijing, the bus service needs to provide better mobility for non-drivers and meet their satisfaction through outstanding performance. Therefore, it is necessary to grasp the key factors in the trip process of public transit through bus passenger satisfaction evaluation and improve the public transport service level, enhancing the attraction of public transportation and promoting the sustainable development of urban traffic.
Accurate passenger satisfaction surveys could assist in decision-making and public transport operational planning. Many studies have focused on the satisfaction evaluation and performance assessment of public transportation. Some related studies have been conducted on the topics of the index system construction [1,2], the method of evaluation [2,3] and the analysis of the influencing factors [4,5].
For analysis purpose, studies often establish a satisfaction matrix from several perspectives, such as comfort, convenience, and safety. Jiang et al. [6] selected the ticket price, speed, comfort, convenience, and security to set up a railway passenger satisfaction evaluation system. To study the user satisfaction levels of public transportation, Das and Pandit [7] used the ticket price, the distance from the trip origin to the destination, the waiting time at the platform, and the general cost. Kesten and Öğüt [8] used 22 indicators with six measurements, time, cost, accessibility and transfer, comfort, safety-security and quality of service, to develop a passenger-oriented performance index (POPIX) for public rail transportation systems. Craig Morton et al. [9] identified three latent constructs associated with attitudes towards the perceived quality of bus service, covering convenience, cabin environment and ease of use issues by factor analysis. Juan et al. [10] proposed a structural equation model for investigating on the relationship among some aspects such as “Satisfaction”, “Perceived costs”, “Attractive alternatives” and so on influencing passengers’ behavioral intentions towards the use of transit services. Public transport service quality is measured from the customer’s perspective. Therefore, evaluation indicators included in the questionnaire should reflect the focus of passengers’ attention as far as possible.
Many intelligent algorithm methods, including the structural equation [11,12] and fuzzy comprehensive evaluation [13], have been used in studies of satisfaction evaluation. Feng et al. [14] used the structural equation method to establish a model to analyze the relationship among urban rail transit service quality, passenger satisfaction, and loyalty. Based on data from customer satisfaction surveys of the public bus conducted by the Transport Consortium of Granada, Rocio and Juan [15] used classification tree techniques to clarify the factors that have a noteworthy impact on service quality. A method of interval type-2 fuzzy multiple-criteria decision-making (MCDM) was proposed by Celik et al. [16] that aimed to evaluate customer satisfaction with Istanbul public transportation. David Verbich and El-Geneidy [17] indicated that improving waiting area conditions and providing information at the stop could increase the satisfaction of riders with encumbrances and disabilities respectively by using logistic regressions.
In studies of the influencing factors of satisfaction evaluation, regression analysis, factor analysis and decision trees are frequently used. Kuo and Tang [18] investigated elderly passengers’ demand for the Taiwan high-speed rail and studied the correlation of service quality, corporate image, customer satisfaction, and behavioral intention. Qian et al. [19] took the Suzhou public bicycle as the research object and used confirmatory factor analysis to show the influencing factors of the residents’ satisfaction with public bicycles. Min et al. [20] surveyed seven intermodal travel groups related to the Metro in Nanjing, China and used binary logistic models on each group to analyze the main factors affecting the satisfaction level. Abdullah et al. [21] utilized the service performance (SERVPERF) measurement approach to find that tangibility, reliability, and assurance are the most important in the evaluation of service quality by airline passengers. Many previous studies considered customer satisfaction with transit services in a cross-sectional manner only, thus Eboli et al. [22] suggested spatial regression models for treating spatial variation of service quality attributes to cover this gap. In the process of evaluating the quality of service, classification and regression tree approach [23] or decision trees and neural networks [24] are useful tools for identifying the characteristics that most influence the overall service quality from a customer satisfaction survey.
The existing research doubtlessly has vital reference value to this paper’s study, but it provided relatively few details about the construction of a systematic evaluation matrix for bus passenger satisfaction and an in-depth discussion of the evaluation results. Beyond that, a highly effective evaluation method for a normalized satisfaction survey also needs to be considered.
This paper has two primary objectives: one is to establish a bus satisfaction evaluation matrix according to the passengers’ demands and opinions; and the other is to use Beijing as an example to carry out a field survey and research. The design process of the survey is introduced in detail. In the process, correlation coefficient weights are adopted in the quantification of customer satisfaction with the various indicators. By testing the reliability and validity of the data, this paper analyzes the relationship between the satisfaction rating and different types of buses or passenger attribute. Improving the service quality of bus and enhancing the sustainability of bus in urban transport development are our ultimate target.

2. Satisfaction Evaluation Indicator System

The rationality of the indicator system has a direct relationship with the evaluation result of the public traffic service quality. Therefore, the indicator system should reflect the main factors that affect the public transport service quality objectively and scientifically. Combined with previous research, both locally and internationally, as well as methods of bus passenger satisfaction evaluation developed for other cities, this paper takes the principle of “Timeliness, Security, Convenience, Comfort, Reliability and Economy” as the six first-level indicators that influence passenger satisfaction to construct a three-level basic evaluation matrix. A systematic, practical and forward-looking satisfaction indicator system will satisfy the need for a satisfaction evaluation of different types of buses.
We recruited 75 volunteers who often travel by bus, including industry experts, operating companies, transport managers and bus fans. From the perspective of passengers, the second- and third-level indexes were built gradually. This paper uses 6 first-level indexes, 21 second-level indexes, and 77 third-level indexes. The purpose of setting third-level indicators is mainly to clarify an improving direction for second-level indicators whose satisfaction is low. The partial satisfaction evaluation index system for bus passengers is shown in Table 1 and a complete construction of index system is shown in Appendix A.

3. Survey Design

This paper uses a stratified sampling method to investigate the bus passengers’ satisfaction based on the satisfaction indicator system construction. The survey design has three steps: survey sample size determination, sample selection, and questionnaire design.

3.1. Sample Size Determination

The survey adopted the stratified random sampling survey method. The survey extracted samples from the overall pool of potential survey respondents to ensure that the survey sample is representative of the overall situation.
The accuracy and efficiency of the survey should be considered while determining the scale of the sample. In statistics, it is generally believed that result with confidence ( α = 0.05 ) greater than 95% is reliable. Z α / 2 is Z statistic corresponding to the confidence level. The 95% confidence level was used in this study, and the value of Z statistic was 1.96. The sampling error (E) was assumed to be 2% to ensure accuracy. In addition, the degree of dispersion (p) was presumed to be 0.5. Accordingly, the overall minimum effective sample size is
n = Z α / 2       2 ( 1 p ) p E 2 = 2401
At the same time, the size of each stratified sampling should be greater than or equal to 30 (a requirement of the minimum sample size for a normal distribution). This research adjusted the overall sample size to 3000 and selected 100 bus lines to survey the passenger satisfaction of Beijing in accordance with the minimum sample size requirements.

3.2. Types of Bus and Line

The sample survey should consider different types of buses and lines to ensure the objects of satisfaction surveys are more comprehensive. According to the related standards and references, the lines included three types in Beijing: Normal bus, BRT (Bus Rapid Transit) and Customized buses (regular bus service that follows demand response). In addition, this research divided the Normal bus of Beijing into four types: Express bus, Common bus, Branch bus and Microcirculatory bus.
  • Express bus: Travel speed is higher than 20 km/h, and the bus takes a large volume of passengers along transit corridors.
  • Common bus: Carries the majority of the bus passenger traffic volume in Beijing and can satisfy various requirements of functions, such as it travels on the arterial road at speeds less than the express bus.
  • Branch bus: Fulfills vital functions close to the end of a trip for passengers to solve the last few kilometers problem. The length of the line is often less than 10 km.
  • Microcirculatory bus: Mainly distributed on branch roads and residential areas. In addition, the route is more flexible, and the length of the line is less than 6 km.
According to the scale of passenger flows in different types of bus lines, the sample proportion of Express bus, Common bus, Branch bus, Microcirculatory bus, BRT and the Customized bus is 51:37:4:4:2:2. At the same time, the sample distribution in different types of stops (hub stops, common roadside stops, harbor-shaped stops, large stops or small stops) and buses (Double-decker buses, Articulated buses, and Non- articulated bus) were considered in this survey. It is necessary to ensure the survey area covers six central urban area of Beijing.

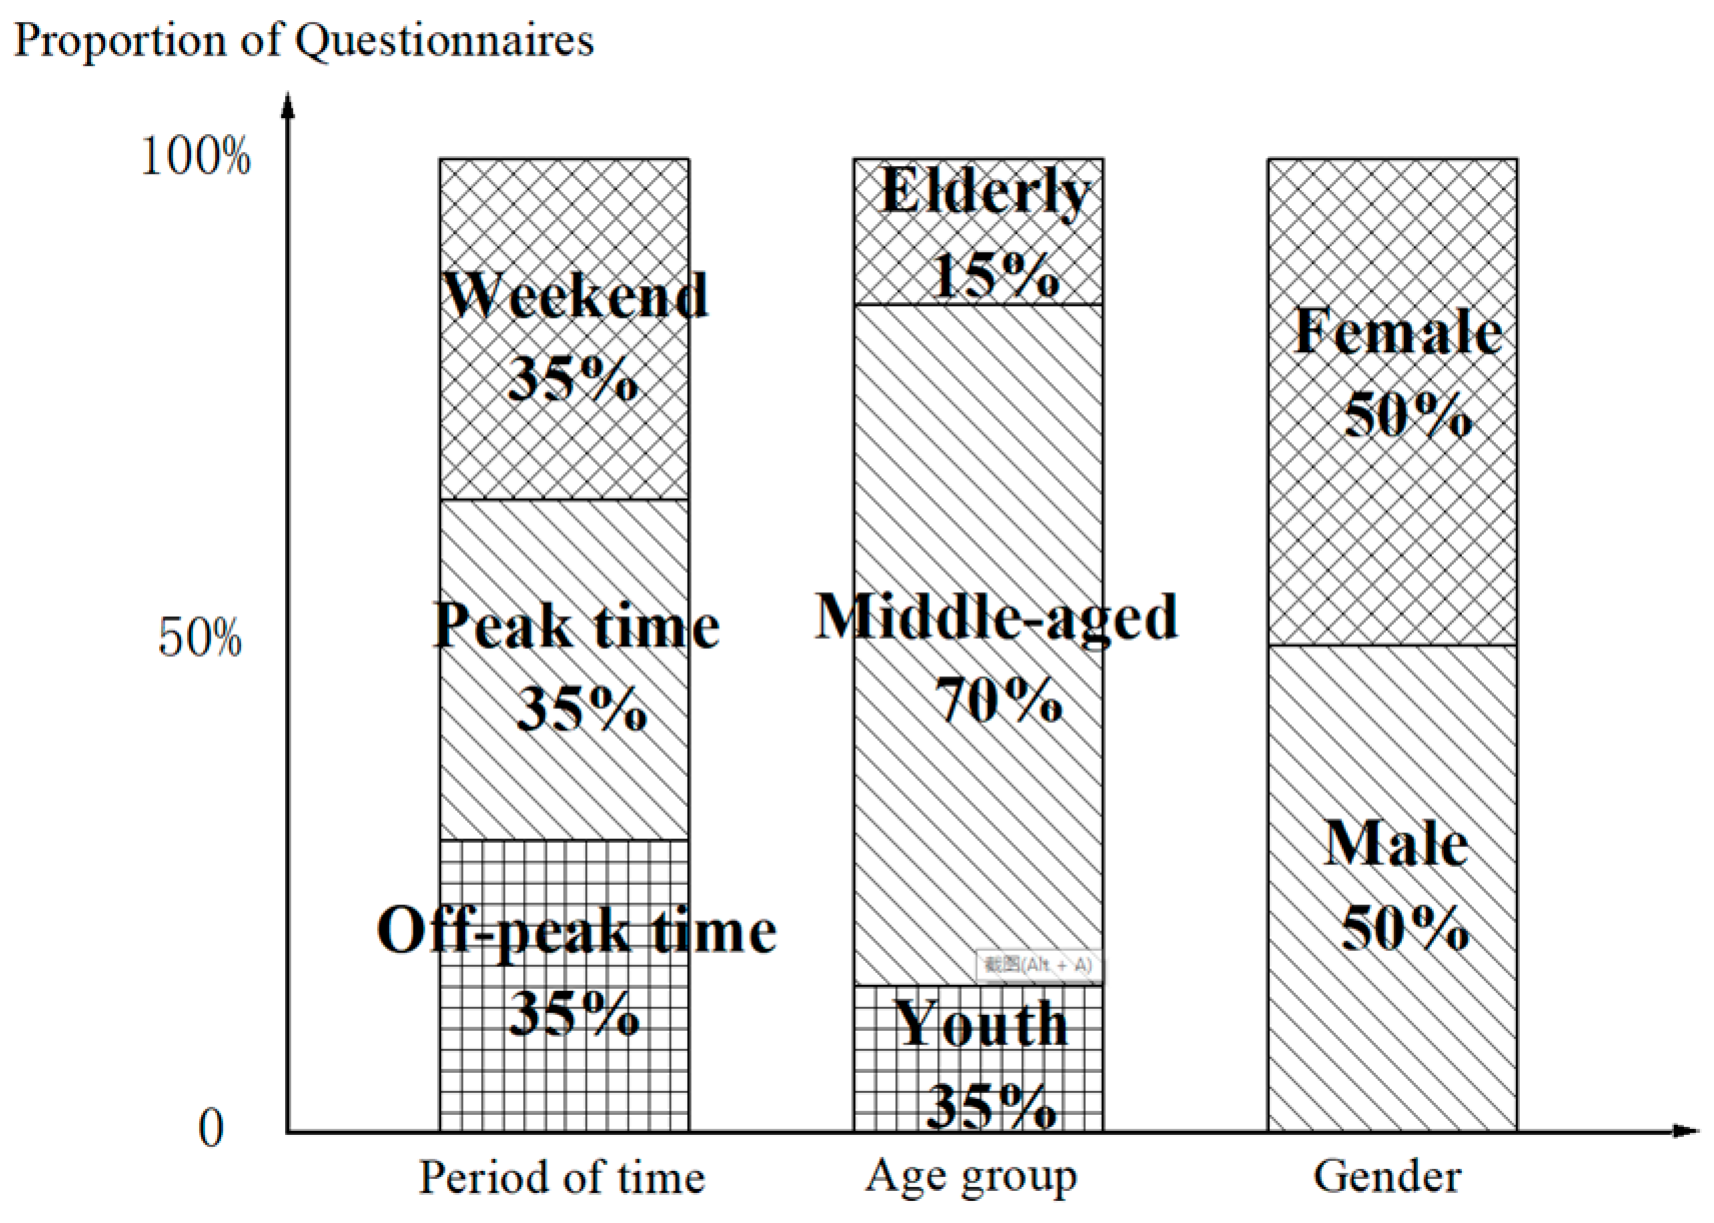
3.3. Survey Object and Time

The bus service quality on weekends and workdays (peak time and off-peak time) are different, and the passenger travel perception is not the same for different genders and ages. Therefore, according to the passenger compositions of the different periods and the general demographic characteristics of Beijing [25], the sample size distribution for each layer is shown in Figure 1. The peak time refers to 7:00–9:00 and 17:00–19:00, and the off-peak time refers to 9:00–17:00. The age division is mainly considered due to varying travel characteristics. Youth-aged is 15–24 (student), middle-aged is 25–59 (commuter), and elderly is ≥60 years old (entertainment group). At the same time, the sample selection was also decided by the respondents’ travel purpose, including travel for home, work, official business, school, personal affairs, entertainment or shopping.

3.4. Questionnaire Design

The research data were collected using tablets to help respondents to fill in the questionnaires. The questionnaire was structured into two main sections. The first section gathered passengers’ opinion about the bus service quality. In the survey, people’s satisfaction level about the overall bus service and 21 indicators at second-level were asked. They were evaluated on a ten-point scale, where 1 is the worst feelings towards service quality and 10 is the best. If the score of an indicator at second-level was 6 or lower, investigators would continue to ask for the satisfaction of the corresponding third-level indicators. The second section of the questionnaire was about investigator information (e.g., name, survey date, survey time, and survey area), bus information (e.g., bus line number, the name of boarding station, type of boarding stop, type of bus, and type of line) and respondent information (e.g., sex, income, age, availability of a private vehicle, and travel purpose).

4. Survey Data Analysis

This research carried out a one-week investigation at the end of March 2016 by recruiting professional investigators. A total of 3012 questionnaires were administered. After the survey data integration and pretreatment, which included replacing the abnormal data and unifying the format of the fields, this research applied statistical methods to evaluate the reliability and validity to determine whether the evaluation matrix and questionnaire are reliable to evaluate the bus service system [26]. The sample characteristics of the survey were also analyzed.

4.1. Reliability Analysis

Reliability refers to whether the data from a survey truly reflect the actual situation of the research object. This research used Cronbach’s Alpha reliability coefficient to estimate the reliability of the satisfaction questionnaire. The reliability coefficient of Cronbach’s Alpha is used to evaluate the internal consistency of the questionnaire.
The bus passenger satisfaction evaluation matrix is a multi-level index system of comprehensive evaluations. Therefore, the reliability analysis should be performed individually for each subaspect. Research on the reliability analysis was carried out on the data collected from the survey. The Table 2 shows that the Cronbach’s Alpha of each index from the questionnaire was higher than 0.7. Therefore, the questionnaire shows high dependability on collecting data and the data can reflect the satisfaction of the bus passengers in Beijing accurately.

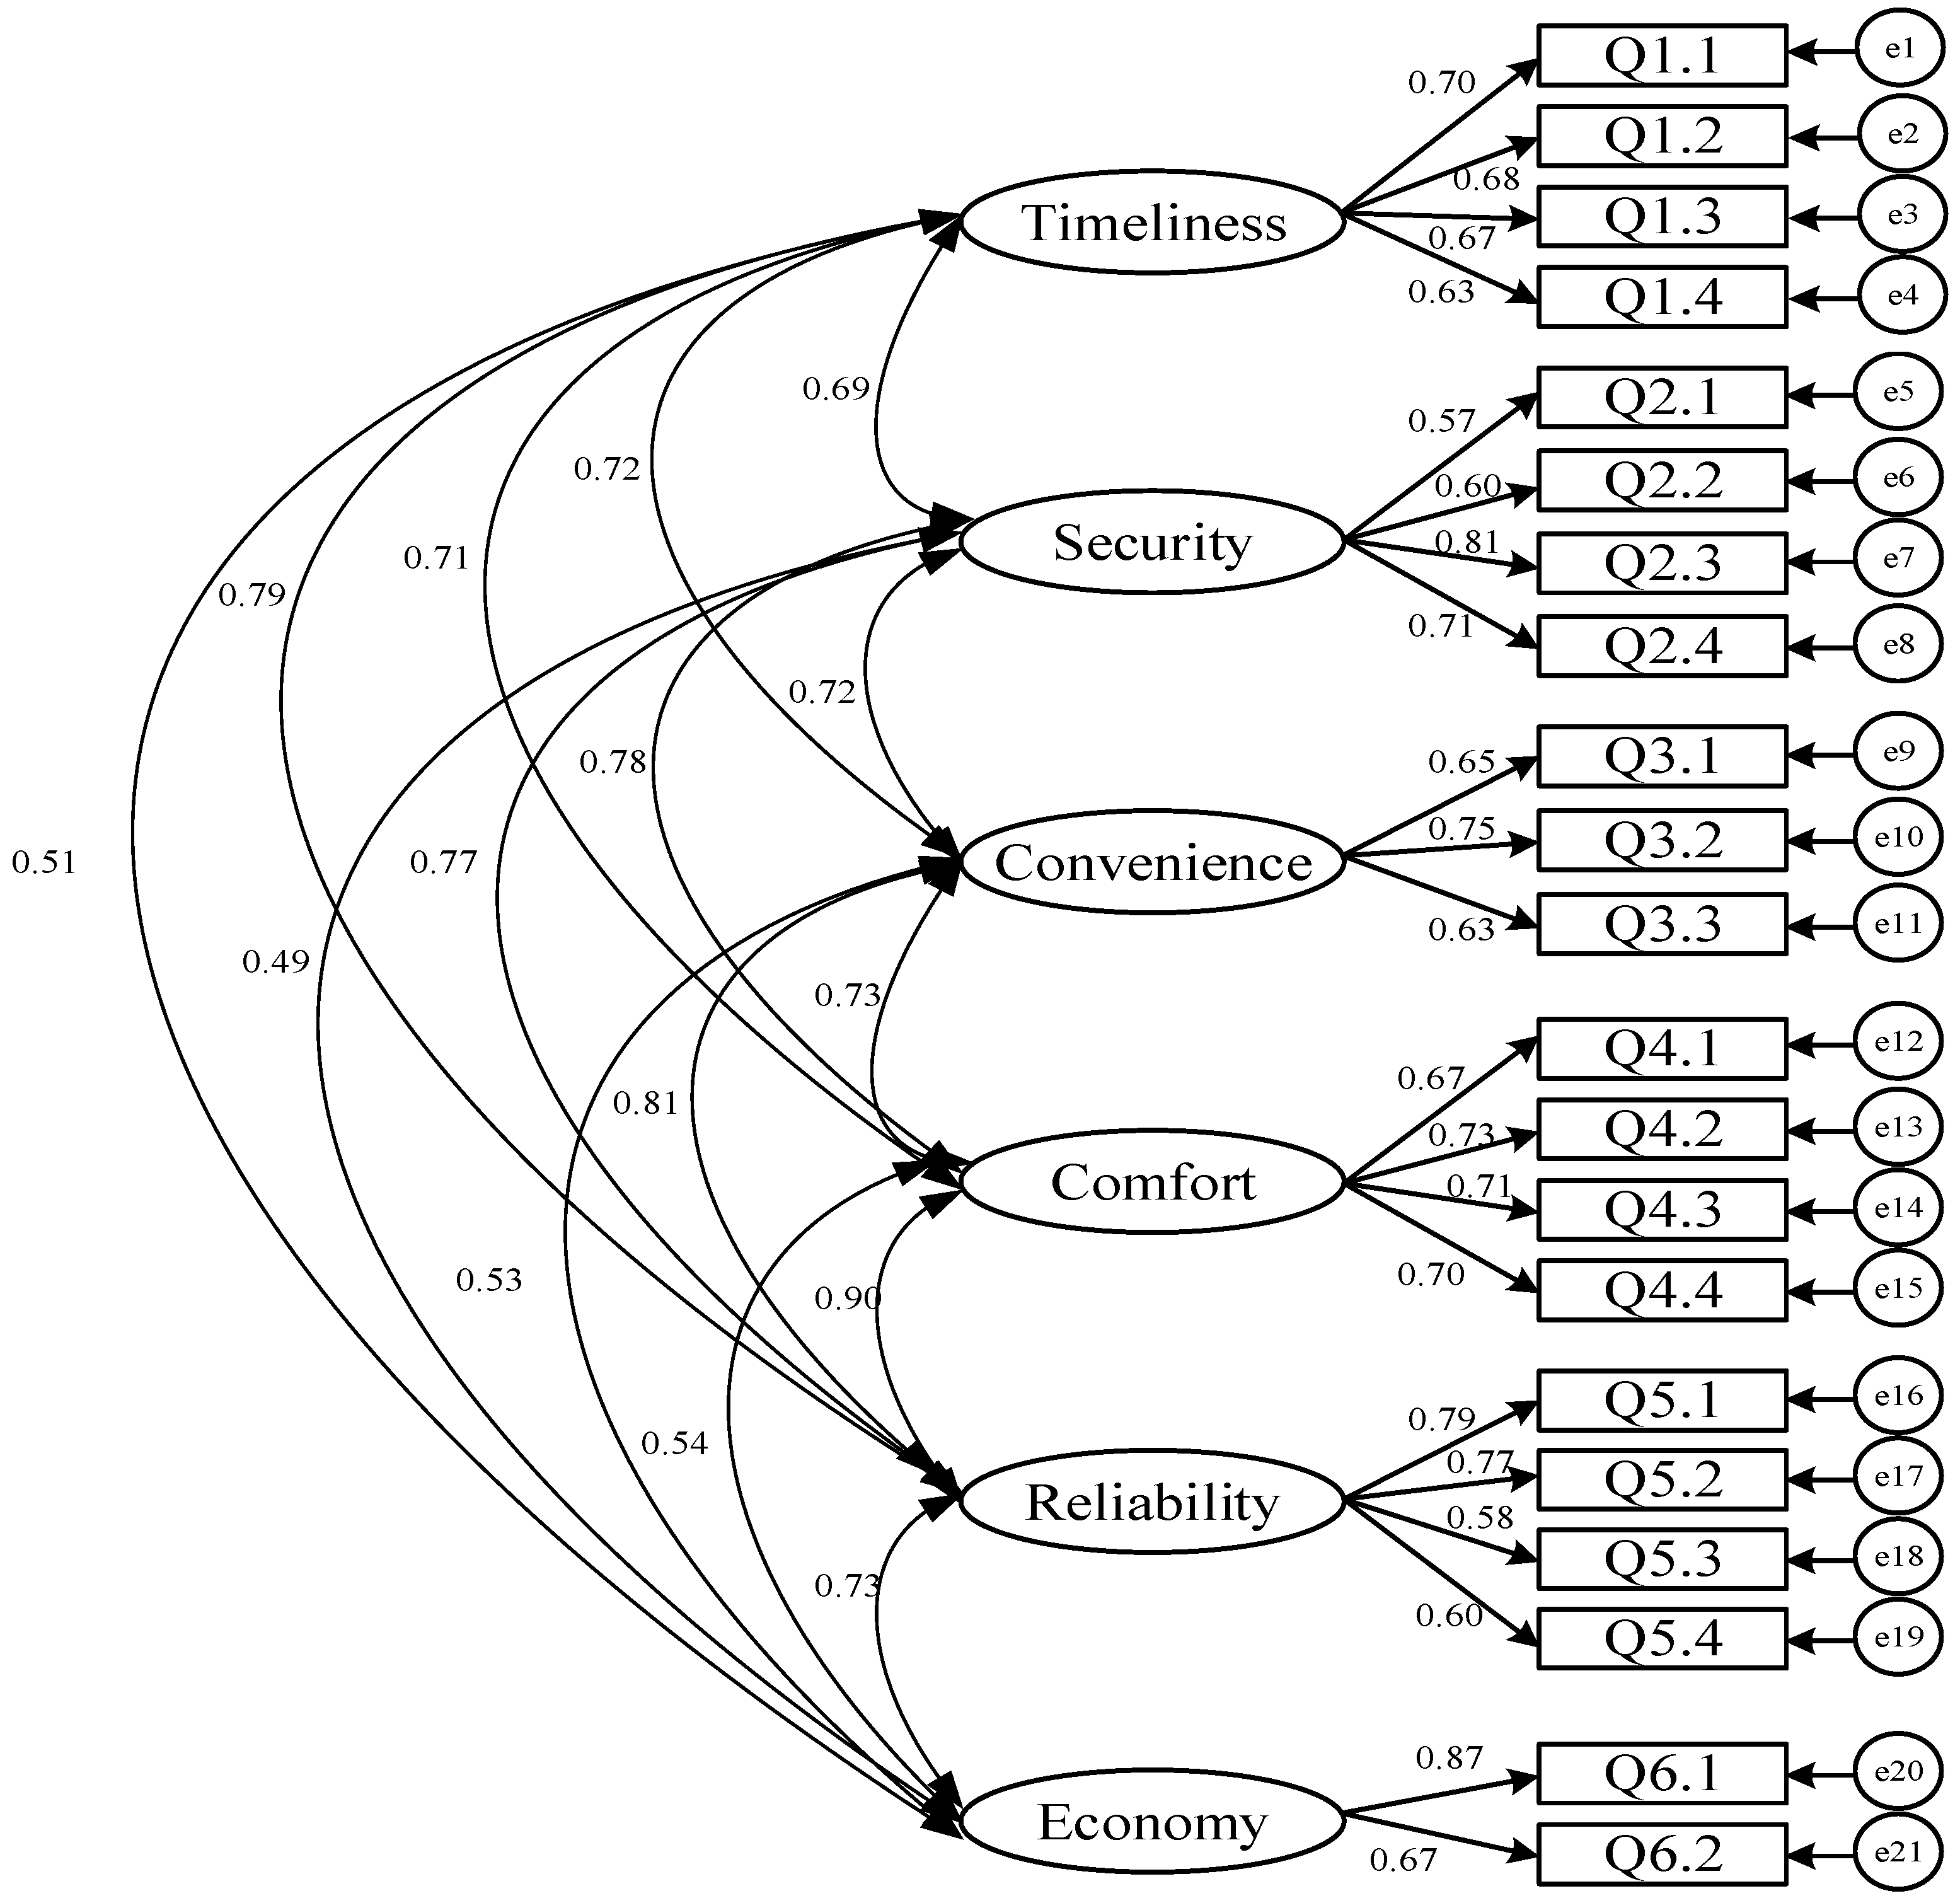
4.2. Validity Analysis

The validity analysis is to test whether each item is able to investigate the cognitive status of the subject effectively. In this research, the indicator system is determined by industry experts, transport managers and bus fans in advance. Therefore, the confirmatory factor analysis was used to test the validity by AMOS version 22.0 (International Business Machines Corporation, Armonk City, NY, USA).
Figure 2, confirmatory factor analysis model matches the survey data well, and goodness of fit statistics is as follows in Table 3.
As we can see from Table 3, CMIN/DF (Chi square/degree of freedom) value is 2.951, which is less than 3.00. RMR (Root mean residual) value is less than 0.05 and RMSEA (Root mean square error of approximation) is less than 0.08. GFI (Goodness-of-fit index), AGFI (Adjusted goodness-of-fit index), NFI (Normed fit index), TLI (Tucker-Lewis index), and CFI (Comparative fit index) values are more than 0.9. All the fitting indexes have reached the fitting standard. Therefore, the construction of the index system is reasonable.

4.3. Characteristic Analysis of the Sample

In this survey, the proportion of males and females of the respondents is 51:49, which is close to 1:1. For age ranges, most respondents (more than 72%) are 18–44. Overall, 1869 respondents earn 2000–6000 yuan/month, a response rate of 62%. The travel purpose is mainly going home and working, which accounts for more than 54% of the total respondents. This is consistent with the characteristics that the number of commuter accounts for 57% of the total travel number of Beijing residents [27]. Considering the different scale of passenger volume among different types of bus lines, approximately 96% of the respondents are normal buses passengers. In the valid sample, 38% of the respondents were selected in the peak period of workday. Overall, 35.7% of sampled people were selected during non-peak period of workday and 25.9% during the weekend. The distribution of the survey sample is shown in Table 4.

4.4. Satisfaction Evaluation Method

To reflect the real satisfaction of passengers, this research used the correlation coefficients as weights and determined the overall satisfaction or the satisfaction of each level indicators layer by layer, rather than directly using the marks of the passengers on the overall satisfaction to evaluate satisfaction. This practice is widely used in customer satisfaction research in a wide range of industries worldwide [28].
The questionnaire marks the scores of overall satisfaction as well as the satisfaction of 21 indicators at second-level. The weights are the correlation coefficient ( ρ ) of every second-level indicator with the overall satisfaction. The increase of the correlation coefficient would improve the correlation between indicators and overall satisfaction. Based on the number of respondents in the different research groups G which can be divided into several groups according to the total, travel purpose, age or other attributes (as shown in Table 4), the correlation coefficient and satisfaction score is computed for each research group. Finally, the average score of the respondents’ satisfaction is determined as each indicator of satisfaction of the research group.
For example, the correlation coefficient of each indicator at second-level with the overall satisfaction is
ρ A C j = i = 1 n ( C j i C j ¯ ) ( A i A ¯ ) i = 1 n ( C j i C j ¯ ) 2 ·; i = 1 n ( A i A ¯ ) 2
where ρ A , C j   denotes correlation coefficient of j th indicator at second-level with the overall satisfaction; C j i denotes score of j th indicator at second-level graded by i th respondent; C j ¯ is average score of the j th indicator at second-level; A i is overall satisfaction score of i th respondent; A ¯ is average score of the overall satisfaction in group G; and n denotes the number of respondents in group G.
Satisfaction score of kth indicator at first-level is calculated using the correlation coefficient values as given in Equation (3).
B k = [ i = 1 n ( j = 1 m C j i × ρ A , C j / j = 1 m ρ A , C j ) ] / n
where B k denotes satisfaction score of j th indicator at first-level and m is the number of indicators at second-level corresponding to jth indicator at first-level.
The satisfaction evaluation model weighted by the related coefficient reflects the users’ personal factors that affect their satisfaction. To a certain extent, it overcomes the one-sidedness of the existing evaluation methods, which rely solely on “statement” to get satisfaction scores.

5. Satisfaction Evaluation and Influence Factors: A Case Study of Beijing

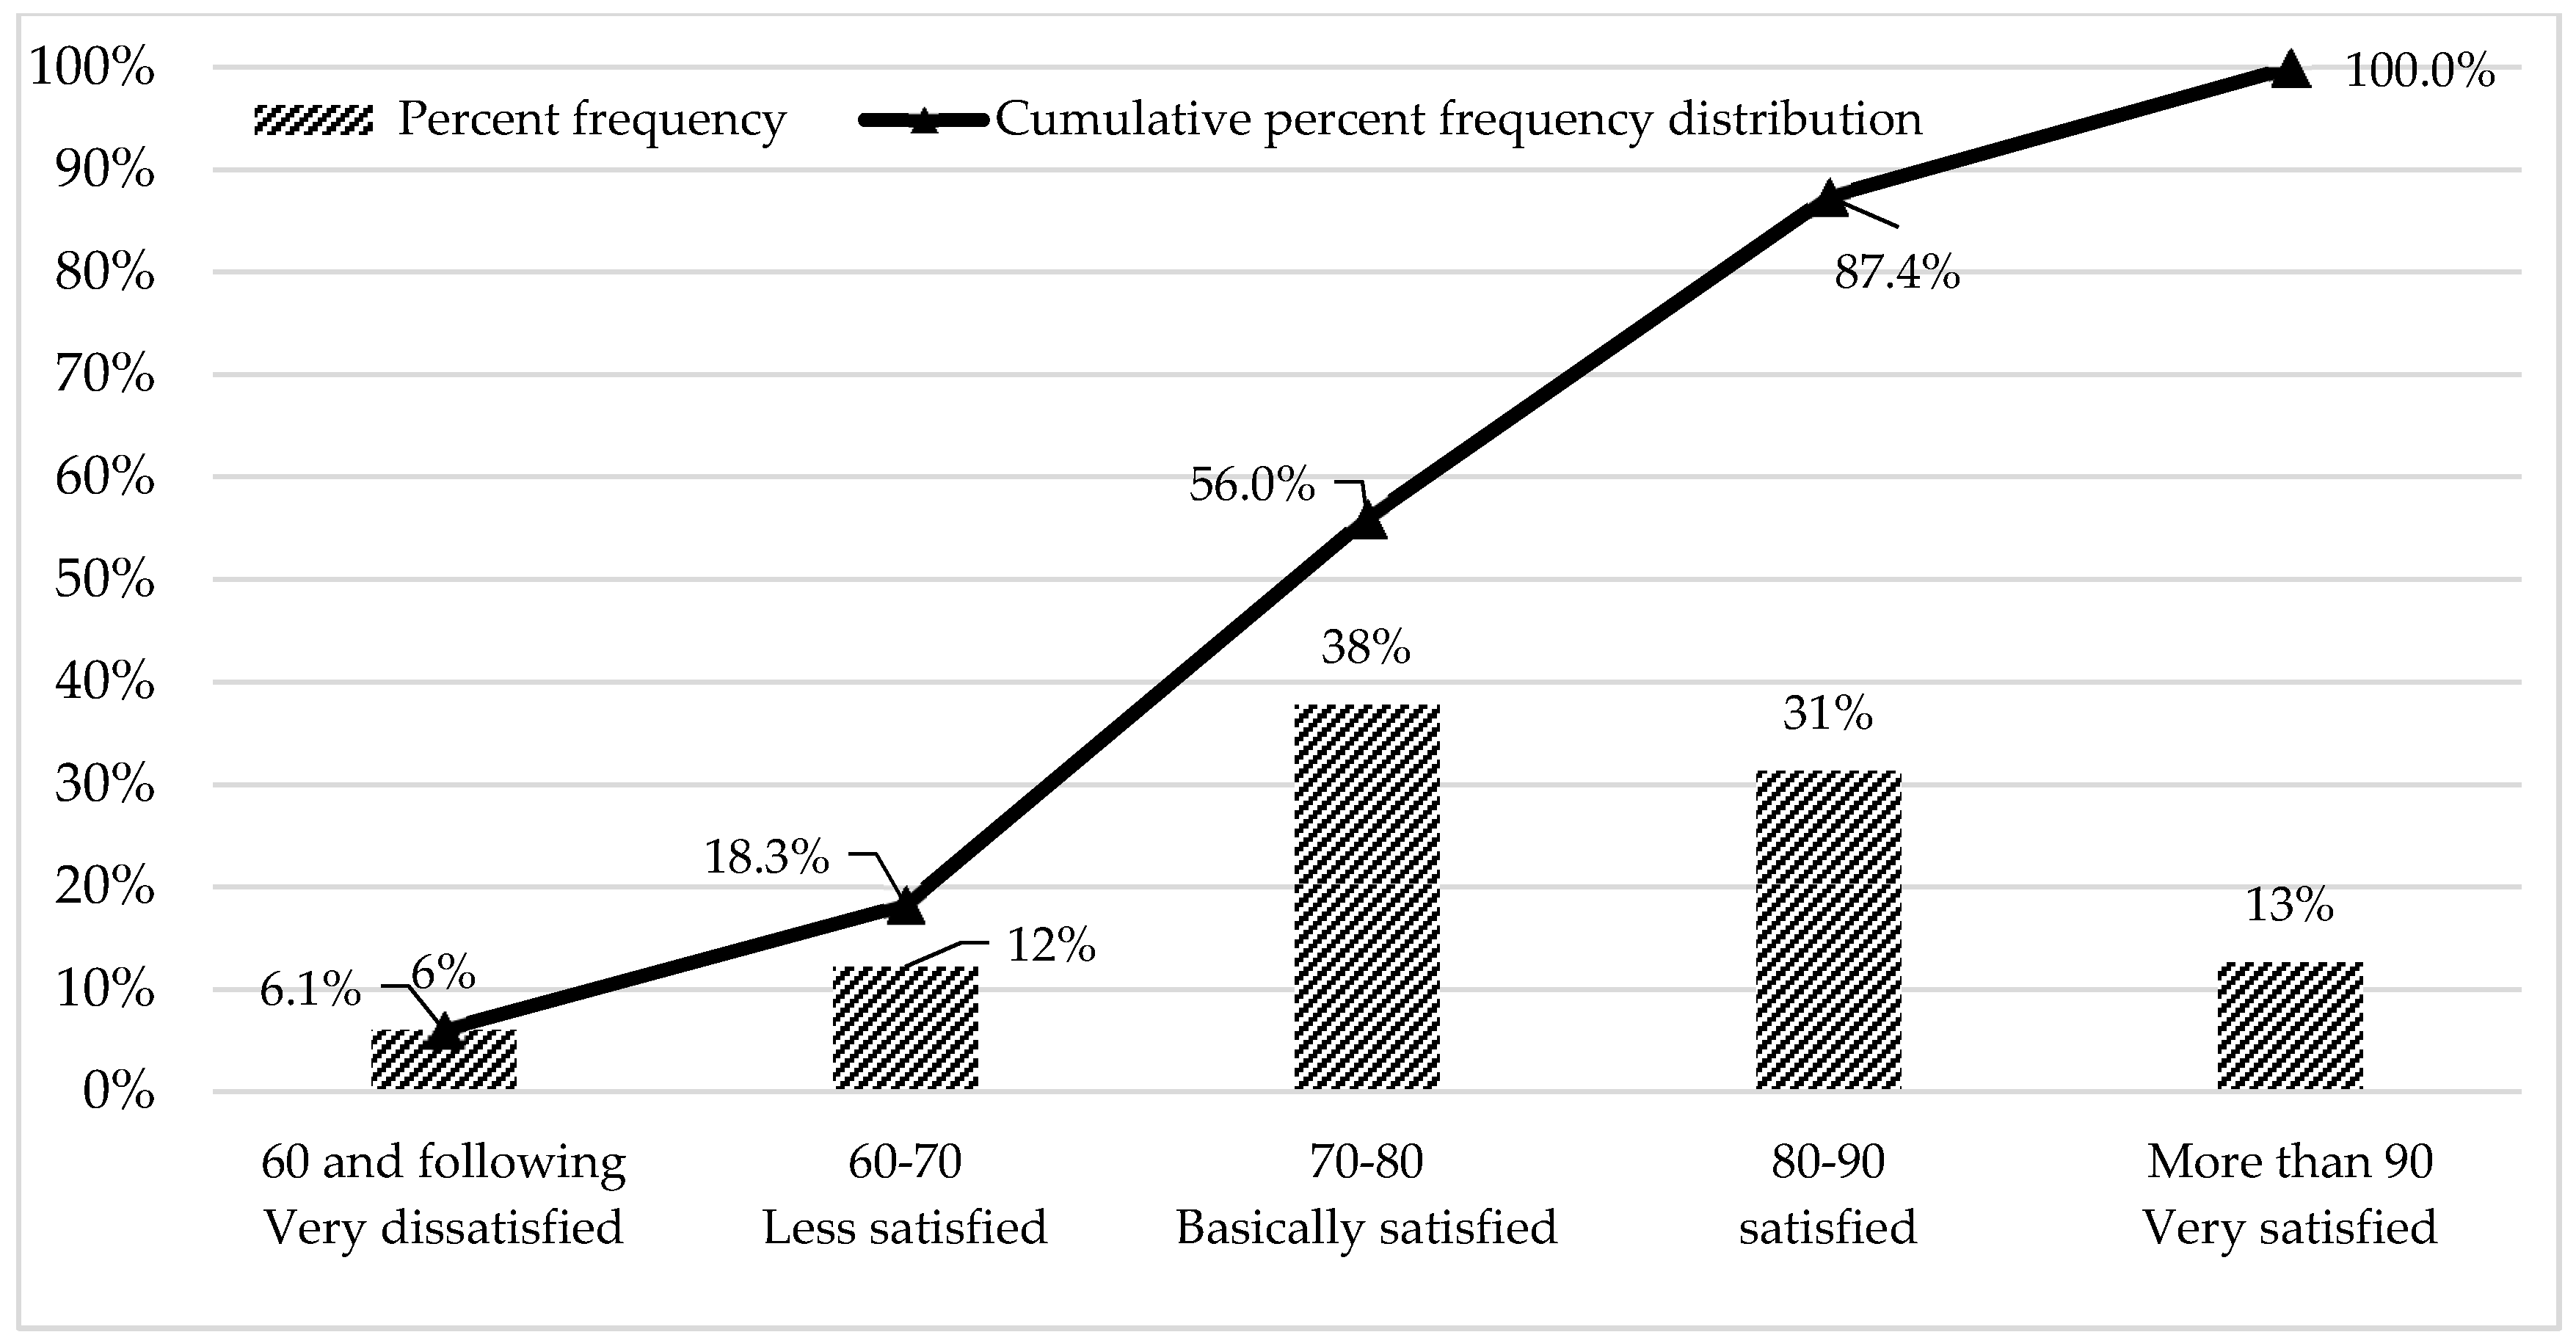
5.1. Overall Satisfaction Evaluation Result Analysis

This research used Equations (2) and (3) to deduce and analyze passengers’ overall satisfaction with public transport in Beijing. Centesimal system quantized the results and divided them into five levels. The percentages of different levels in the total sample are shown in Figure 3. The overall satisfaction score of the passengers is 78.2. Passengers are “basically satisfied” and “satisfied” with the bus service accounted for nearly 70% of the respondents.
The satisfaction of each first-level indicator is shown in Figure 4. The satisfaction score of timeliness is 74.3, which is the lowest score among six first-level indicators. Compared with overall satisfaction, timeliness score is lower by 5%. Tracing to the corresponding second-level indicators, passengers are very dissatisfied with waiting time at the bus stop and travel time. The score of waiting time at the bus stop and travel time is 71.9 and 73.3, respectively. The score of security, convenience and comfort are close to the overall satisfaction: 78.6, 78.7 and 78.6, respectively. Respondents are satisfied with service quality of traffic security, emergency management and travel convenience. All of the scores of the aspects mentioned above are over 80.0. The research also found that the satisfaction score of reliability is 80.4, which is the highest evaluation among the six first-level indicators. Respondents are very satisfied with the reliability of driver and conductor in service and bus service information. The satisfaction scores of these items are 82.1 and 81.7, respectively. Passengers also highly value the economy of bus service and the score of economy is 79.9. Bus fare in Beijing is very cheap and there are various preferential policies for students, disabled person, elderly people and so on.

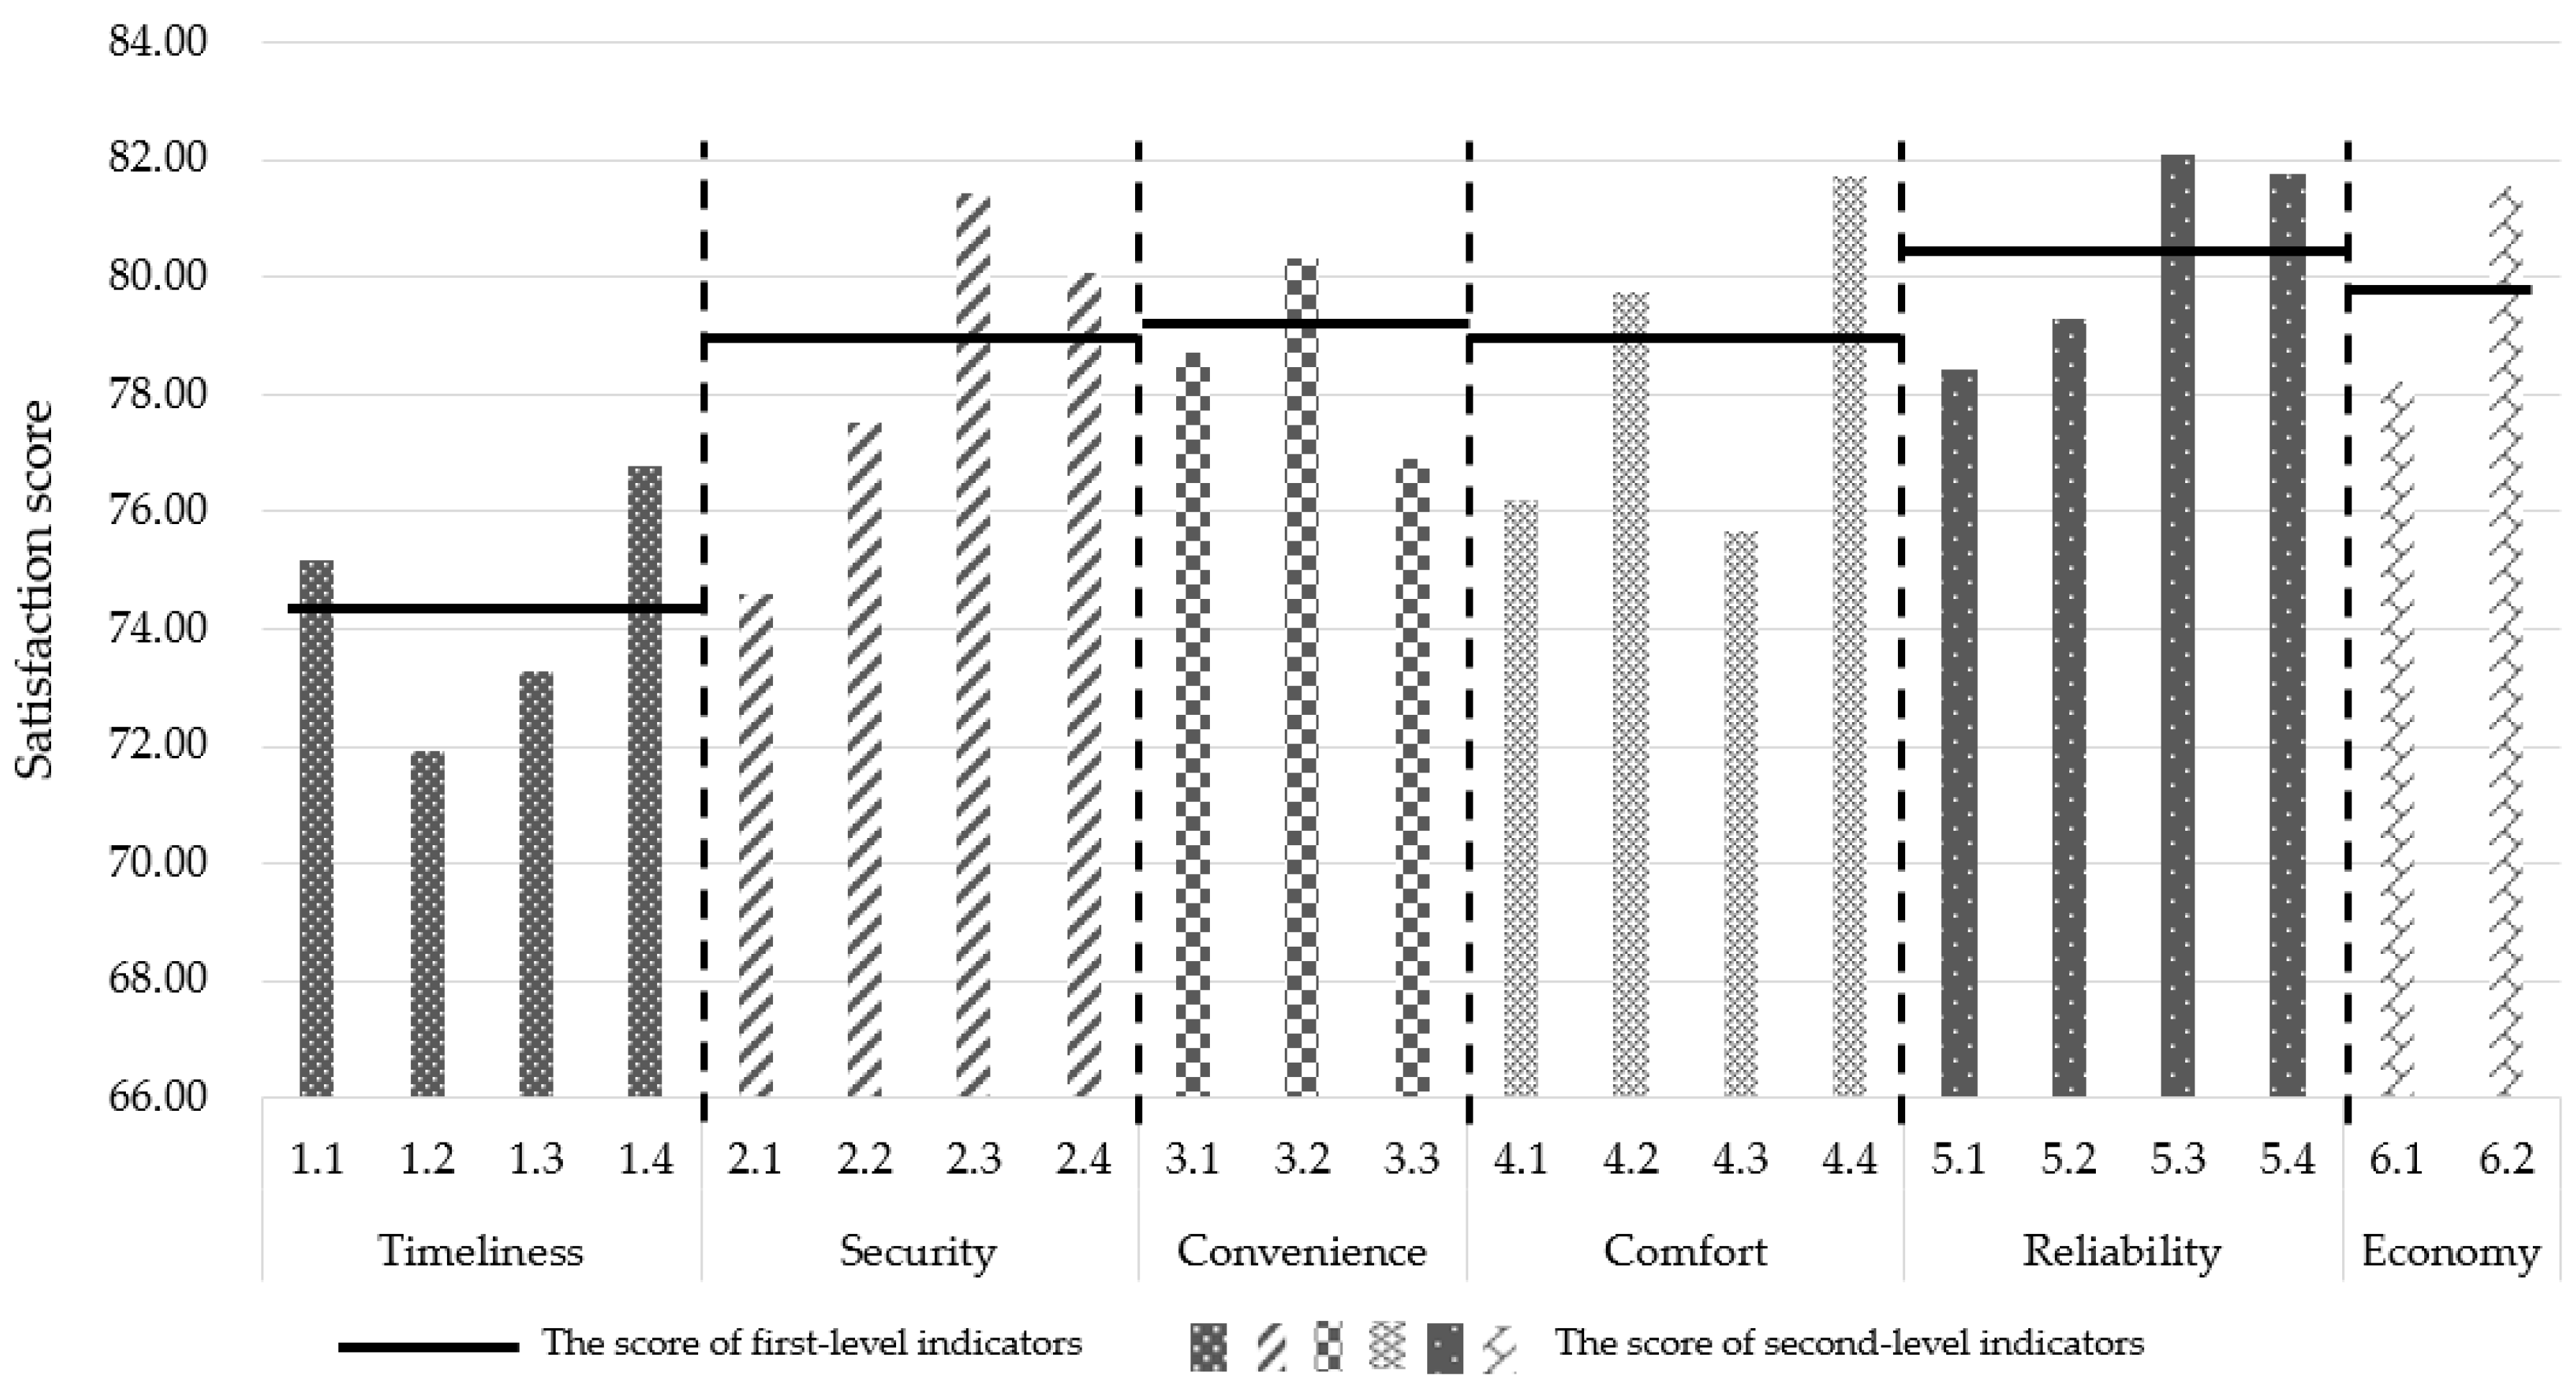
5.2. Bus Satisfaction Analysis in the View of Different Segments

The satisfaction of the Articulated bus is the lowest (77.7) among the vehicle types, due to the score of timeliness below 4.7% of the average. We also found that the satisfaction levels of the different types of line are related to their functional localization. The satisfaction of the Customized bus is the highest (87.1) because of meeting the actual demand of passengers. The degree of satisfaction of the Common line and Branch line is relatively low. There is great difference in the scores of satisfaction among different types of bus stops. The satisfaction in hub stops is the lowest, which is related to the high density of passenger flow. Accordingly, overall satisfaction is heavily influenced by poor feelings for comfort aspects
Compared with the customers who do not own a private vehicle, car owners have higher expectations for convenience and economy. Improving the services capabilities of these two aspects is a feasible way to attract more private car owners to take the bus. For the travel purpose, the satisfaction of the commuting travel is relatively high, and is ranked in the top three. The satisfaction of traveling for personal affairs is the lowest because respondents have high expectations on the timeliness of bus service. For the income group, the bus service quality satisfaction of the income group 2000–4000 is the highest, while the satisfaction of income group 4000–6000 is the lowest. For the age group, the satisfaction appears to show high polarization. The satisfaction of students is the lowest (77.2), especially with respect to timeliness and convenience, which are the most important indicators to improve. The age group 45–54 has high satisfaction on the bus service, and they expressed a high degree of recognition for services in the economy. The specific scores of satisfaction are depicted in Table 5.

5.3. Variance Analysis of Influencing Factors

Severl factors influence satisfaction. Thus, it is necessary to set the factors that may influence bus passenger satisfaction in the questionnaire, which mainly include bus and line factors, such as the type of bus, line, and stops; and individual attribute factors, such as travel purpose, income, age and time. The research used variance analysis to investigate the influences of various factors on the results of satisfaction. Then, it identified the factors that have a more significant impact with a low satisfaction score to lay the foundation for putting forward improvement measures on the bus service.
Multivariate variance analysis is a statistical analysis with multiple independent variables to determine whether they are affected by one or more factors. To analyze the influence of different attribute factors on the first-level indicator satisfaction, this research conducted a multivariate variance analysis and the result is given in Table 6.
As seen from the significance, different influencing factors have different impacts on the indicators:
(1)
The timeliness indicator is mainly constrained by the factors of the customer’s age, travel purpose, and time. Age plays the most significant role.
(2)
The security indicator is mainly affected by the factors of the type of line and bus, travel purpose, and the type of line has the most significant influence on the security.
(3)
Differences in infrastructure, such as the type of line, bus, and stop, have a significant effect on the reliability indicator. Particularly, the type of line has the greatest influence.
(4)
The convenience indicator is influenced by two factors: the type of bus and line.
(5)
The comfort indicator is mainly affected by the factors of type of line, travel purpose, type of bus and private car ownership, among which the type of line has the greatest influence.
(6)
The economic indicator is mainly constrained by the factors of type of line, type of bus, travel purpose and private car ownership, among which the type of line has the greatest influence.

6. Conclusions and Future Work

Sustainable development of bus vitality is an important part of urban green transportation. Improving public transport service quality is an effective way to enhance bus attractiveness. This research constructed a satisfaction evaluation matrix that includes 6 first-level indicators, 21 second-level indicators and 77 third-level indicators from the opinion of passengers. By the survey design, stratified sampling was used to select 100 bus lines as samples to evaluate the satisfaction of bus service quality in Beijing. The results show that overall satisfaction score is 78.2 and the proportion of bus passengers who are satisfied with the bus service exceeds 80%. By analyzing the different segment’s satisfaction evaluation and influencing factors of satisfaction, the study found that the bus type is the primary factor that affects the overall satisfaction. The satisfaction with the Articulated bus is very low because it always undertakes large-scale passenger flow. The lowest satisfaction score of first-level indicators is timeliness, which is mainly affected by the factor of age. The satisfaction of the income group 2000–4000 and passengers from hub stops is also relatively low. Therefore, enhancing the timeliness of the bus service is the first effective measure to improve the overall satisfaction. The service level of security, convenience, comfort and passengers’ travel environment should be developed step by step as well.
The research provided method guidance for quantitative bus satisfaction evaluations. Firstly, a multi-dimensional evaluation index system contributed to evaluating the service quality of public transport scientifically and objectively. The evaluation indexes covered the whole trip of passengers, from the starting point to the destination. Secondly, the process of survey design was also sufficiently detailed. Because of the complexity of traffic in megacities, the rigor of the survey scheme played an essential role in ensuring the evaluation of the results is accurate. Thirdly, the research carried out a normalized assessment of the service level and satisfaction for public transportation. The main advantage of using the satisfaction evaluation model weighted by the related coefficient is that it not only considers the subjective feelings of the users but also estimates the importance of the indicators based on the passenger perception. Under the balance of “statement” and “estimate”, the overall satisfaction and the satisfaction of the first-level indexes are determined.
In future research, normalization assessment could be evaluated using satisfaction evaluation index system in more cities. The difference in service quality level between cities can be further compared with each other. It might also be worthwhile to investigate the relationship between the passengers’ individual characteristics and service quality perception. That is conducive to provide a more scientific method of service performance evaluation and identify indicators need to be optimized.

Author Contributions

J.W., J.W. and L.M. designed the overall framework of the research. X.D. and C.W. is responsible for the data collection and analyzing the data. All authors wrote the paper, but their primary individual contributions are reflected as follows: Section 1 and Section 6 are to be ascribed to J.W. and L.M.; Section 2 is to be ascribed to J.W.; and Section 3, Section 4 and Section 5 are to be ascribed to X.D. and C.W. All authors read the final manuscript and approved it for final submission.

Funding

This research was supported by the National Natural Science Foundation of China (NFSC) (No. 51578028 and No. 61420106005), and it was also sponsored under “Beijing Nova” Program by Beijing Municipal Science and Technology Commission (No. Z171100001117100).

Acknowledgments

The authors would like to show great appreciation for the support to all investigators. It is because of their careful investigation, satisfaction evaluation work of bus can be carried out successfully.

Conflicts of Interest

The authors declare no conflict of interest.

Appendix A

Table A1. Satisfaction Evaluation Indicator System.
First-LevelSecond-LevelThird-Level
1 Timeliness1.1 Arrival time at the bus stop1.1.1 Arrival Time at the bus stops
1.2 Waiting time at the bus stop1.2.1 Waiting time for the bus
1.2.2 Queueing time for the bus entering or leaving stops
1.2.3 Queueing length of passengers when getting on the bus
1.3 Travel time1.3.1 Bus transporting velocity
1.3.2 Degree of detouring
1.3.3 Number of stopping on the way
1.4 Transfer time1.4.1 Time for transferring
1.4.2 Waiting time for a bus during transferring
2 Security2.1 Security of waiting2.1.1 Waiting order on the stops
2.1.2 Security facilities in the platform
2.1.3 Degree of crowdedness in the platform at peak period
2.2 Security of boarding2.2.1 The position as the bus stops
2.2.2 Degree of illegal parking of social vehicles around the stops
2.2.3 Order of getting on and off the bus
2.2.4 Safety of opening and closing the bus door
2.3 Traffic security2.3.1 Security capacity of passenger and property
2.3.2 Driver obeys the traffic rules
2.3.3 Condition of the bus
2.3.4 Adequacy of armrest facilities inside the bus
2.3.5 Adequacy of security facilities inside the bus
2.3.6 Clarity of security warning sign
2.4 Emergency management2.4.1 Maturity of emergency measures
2.4.2 Arrangement of a security guard
3 Convenience3.1 Convenience of facilities3.1.1 Satisfaction with the availability of information about bus stop
3.1.2 Satisfaction with the availability of information about transfer
3.1.3 Satisfaction with the service of electronic screen
3.1.4 Satisfaction with the recharging network layout of bus IC card
3.1.5 Convenient degree of parking bicycles or private cars near the bus stop
3.1.6 Convenient degree of barrier-free structures
3.1.7 Connection degree between the bus station and pedestrian street-crossing facilities
3.1.8 The intact conditions of bus IC card machine
3.2 Convenience of travel3.2.1 The number of optional routes to the destination
3.2.2 The number of transfers to the destination
3.2.3 Convenience degree of reaching bus stops
3.2.4 Convenience degree of connecting with other modes of transportation
3.3 Convenience of information services3.3.1 Convenience degree of picking up information about bus line which is adjusted
3.3.2 Convenience degree of picking up information about an emergency event
3.3.3 Convenience degree of service of bus arrival information
3.3.4 Convenience degree of accessing to information from websites, WeChat, Apps, etc.
4 Comfort4.1 Stop environment4.1.1 The crowd density in the platform area
4.1.2 Humanized facilities (such as awning, dustbin) are adequate
4.1.3 Degree of the cleanliness of stops
4.1.4 Adequacy of order guarantee facilities
4.2 Condition of vehicle hardware4.2.1 Seats are comfortable
4.2.2 Cleanliness of the bus
4.2.3 Intactness of infrastructures (such as seats, windows, handrails)
4.2.4 Intactness of radio and television
4.3 Dynamic environment on the bus4.3.1 Degree of Crowding
4.3.2 Microclimate and noise level in vehicles
4.3.3 Maintenance of fresh air in vehicles
4.4 Quality of services4.4.1 Variety of bus service
4.4.2 Smoothness of vehicle operation
4.4.3 Staff tries to keep order in the vehicle
4.4.4 Staff takes care and helps the riders with disabilities
4.4.5 Staff offers effective and patient service
4.4.6 Staff are well dressed
5 Reliability5.1 Punctuality of travel time5.1.1 Punctuality of waiting time
5.1.2 Punctuality of traveling time
5.2 Reliability of transit dispatching5.2.1 Reasonable degree of the schedule about the first and last bus
5.2.2 Reliability of the time of the bus’s departure
5.2.3 Uniformity of the intervals of bus’s departure
5.3 Reliability of driver and conductor in service5.3.1 Reporting station is clear, accurate and timely
5.3.2 Stop at the specified place
5.3.3 Driving bus follows by the prescribed route
5.3.4 Variety of ways to put forward complaints and suggestions
5.4 Reliability of bus service information5.4.1 Ticket information is accurate and reliable
5.4.2 Bus schedule is published clearly
5.4.3 Accuracy of transfer information
5.4.4 Accuracy of intervals information about the bus’s departure
5.4.5 Accuracy of information about the surrounding places
5.4.6 Accuracy of information about bus arrival forecasting (mobile APP)
6 Economy6.1 Rationality of fare and system6.1.1 The satisfaction about a variety of ticket system
6.1.2 The satisfaction of discounting
6.2 Rationality of the fare of personalized services6.2.1 Reasonable degree of the price about differentiated service
6.2.2 The satisfaction about differentiated bus service pricing model

References

  1. Eboli, L.; Mazzulla, G. A new customer satisfaction index for evaluating transit service quality. J. Public Transp. 2009, 12, 2. [Google Scholar] [CrossRef]
  2. de Oña, J.; de Oña, R.; Eboli, L.; Mazzulla, G. Index numbers for monitoring transit service quality. Transp. Res. Part A Policy Pract. 2016, 84, 18–30. [Google Scholar] [CrossRef]
  3. Oña, J.D.; Oña, R.D.; López, G. Transit service quality analysis using cluster analysis and decision trees: A step forward to personalized marketing in public transportation. Transportation 2016, 43, 725–747. [Google Scholar] [CrossRef]
  4. De Oña, J.; de Oña, R.; Eboli, L.; Mazzulla, G. Perceived service quality in bus transit service: A structural equation approach. Transp. Policy 2013, 29, 219–226. [Google Scholar] [CrossRef]
  5. Bordagaray, M.; dell’Olio, L.; Ibeas, A.; Cecín, P. Modelling user perception of bus transit quality considering user and service heterogeneity. Transportmetrica 2014, 10, 705–721. [Google Scholar] [CrossRef]
  6. Jiang, A.; Feng, Y.; Li, X.; Li, X. Railway Passenger’s Satisfaction Evaluation Based on Entropy Method and Fuzzy Theor; Springer: Berlin/Heidelberg, Germany, 2015. [Google Scholar]
  7. Das, S.; Pandit, D. Methodology to determine service delivery levels for public transportation. Transp. Plan. Technol. 2016, 39, 1–23. [Google Scholar] [CrossRef]
  8. Kesten, A.S.; Öğüt, K.S. A new passenger oriented performance measurement framework for public rail transportation systems. PROMET Traffic Transp. 2014, 26, 299–311. [Google Scholar] [CrossRef]
  9. Morton, C.; Caulfield, B.; Anable, J. Customer perceptions of quality of service in public transport: Evidence for bus transit in Scotland. Case Stud. Transp. Policy 2016, 4, 199–207. [Google Scholar] [CrossRef] [Green Version]
  10. de Oña, J.; de Oña, R.; Eboli, L.; Forciniti, C.; Mazzulla, G. Transit passengers’ behavioural intentions: The influence of service quality and customer satisfaction. Transportmetrica 2016, 12, 385–412. [Google Scholar] [CrossRef]
  11. Gao, Y.; Rasouli, S.; Timmermans, H.; Wang, Y. Understanding the relationship between travel satisfaction and subjective well-being considering the role of personality traits: A structural equation model. Transp. Res. Part F Traffic Psychol. Behav. 2017, 49, 110–123. [Google Scholar] [CrossRef]
  12. Chen, J.; Tang, W.; Cai, X.Y.; Duan, L.W. Multiple-group structural equation model of passenger satisfaction in urban rail transit. J. Transp. Syst. Eng. Inf. Technol. 2018, 18, 173–178. [Google Scholar]
  13. Shaw, J.W.; Li, X.; Fan, Y.; Qi, Y. A fuzzy AHP approach to compare transit system performance in US urbanized areas. J. Public Transp. 2017, 20, 66–89. [Google Scholar]
  14. Feng, Y.; Li, X.; Li, X.; Yang, L. Interrelations among the urban rail service quality, passenger satisfaction and loyalty. In Proceedings of the Transportation Research Board 94th Annual Meeting, Washington, DC, USA, 11–15 January 2015. [Google Scholar]
  15. de Oña, R.; de Oña, J. Analysis of transit quality of service through segmentation and classification tree techniques. Transportmetrica 2015, 11, 365–387. [Google Scholar] [CrossRef]
  16. Celik, E.; Bilisik, O.N.; Erdogan, M.; Gumus, A.T.; Baracli, H. An integrated novel interval type-2 fuzzy MCDM method to improve customer satisfaction in public transportation for Istanbul. Transp. Res. Part E Logist. Transp. Rev. 2013, 58, 28–51. [Google Scholar] [CrossRef]
  17. Verbich, D.; El-Geneidy, A. The pursuit of satisfaction: Variation in satisfaction with bus transit service among riders with encumbrances and riders with disabilities using a large-scale survey from London, UK. Transp. Policy 2016, 47, 64–71. [Google Scholar] [CrossRef]
  18. Kuo, C.W.; Tang, M.L. Relationships among service quality, corporate image, customer satisfaction, and behavioral intention for the elderly in high speed rail services. J. Adv. Transp. 2013, 47, 512–525. [Google Scholar] [CrossRef]
  19. Qian, J.; Wang, D.G.; Niu, Y. Analysis of the influencing factors of urban residents to use urban public bikes: A case study of Suzhou. Geogr. Res. 2014, 33, 358–371. [Google Scholar]
  20. Min, Y.; Jing, Y.Z.; Wei, W.; Zhi, Y.L.; Zhi, B.L. Metro commuters’ satisfaction in multi-type access and egress transferring groups. Transp. Res. Part D Transp. Environ. 2015, 34, 179–194. [Google Scholar]
  21. Abdullah, K.; Jan, M.T.; Hazilah, N. A structural equation modeling approach to validate the dimensions of servperf in airline industry of Malaysia. Int. J. Eng. Manag. Sci. 2012, 3, 134–141. [Google Scholar]
  22. Eboli, L.; Forciniti, C.; Mazzulla, G. Spatial variation of the perceived transit service quality at rail stations. Transp. Res. Part A Policy Pract. 2018, 114, 67–83. [Google Scholar] [CrossRef]
  23. De Ona, R.; Eboli, L.; Mazzulla, G. Key factors affecting rail service quality in the Northern Italy: A decision tree approach. Transport 2014, 29, 75–83. [Google Scholar] [CrossRef]
  24. De Oña, J.; De Oña, R.; Garrido, C. Extracting Importance of Attributes from Customer Satisfaction Surveys with Data Mining: Decision Trees and Neural Networks. In Proceedings of the Transportation Research Board 94th Annual Meeting, Washington, DC, USA, 11–15 January 2015. [Google Scholar]
  25. Municipal bureau of statistics of Beijing. Beijing Statistical Yearbook; China Statistics Press: Beijing, China, 2013. [Google Scholar]
  26. Roberts, D.M.; Bilderback, E.W. Reliability and validity of a statistics attitude survey. Educ. Psychol. Meas. 1980, 40, 235–238. [Google Scholar] [CrossRef]
  27. Beijing Transportation Research Centre. Beijing Transportation Annual Report 2015. Available online: http://www.bjtrc.org.cn/JGJS.aspx?id=5.2&Menu=GZCG, 2016 (accessed on 1 October 2017).
  28. Matsuda, T.; Miyagi, C.; Kina, S.; Yara, M.; Dulan, Y.; Hisada, T. Highlighting opportunitiesk to improve business operations using correlation coefficient to measure customer satisfaction. Jpn. J. MHTS 2014, 41, 653–657. [Google Scholar]
Figure 1. Sample size distributions for each layer.
Sustainability 10 02723 g001
Figure 2. Confirmatory factor analysis.
Sustainability 10 02723 g002
Figure 3. Satisfaction level distribution of Beijing bus transport.
Sustainability 10 02723 g003
Figure 4. Satisfaction of first and second-level indicators.
Sustainability 10 02723 g004
Table 1. Satisfaction Evaluation Index System (Partial).
First-LevelSecond-LevelFirst-LevelSecond-Level
1 Timeliness1.1 Arrival time at the bus stop4 Comfort4.1 Stop environment
1.2 Waiting time at the bus stop4.2 Condition of vehicle hardware
1.3 Travel time4.3 Dynamic environment on the bus
1.4 Transfer time4.4 Quality of services
2 Security2.1 Security of waiting5 Reliability5.1 Travel time punctuality
2.2 Security of boarding5.2 Transit dispatching Reliability
2.3 Traffic security5.3 Driver and conductor in service
2.4 Emergency management5.4 Bus service information
3 Convenience3.1 Facilities convenience6 Economy6.1 Fare and system rationality
3.2 Travel convenience6.2 Fare of personalized services rationality
3.3 Information services
Table 2. Reliability analysis.
IndexCronbach’s AlphaSubindex Number
Timeliness0.7834
Security0.7654
Convenience0.7093
Comfort0.7944
Reliability0.8074
Economy0.7942
Table 3. Goodness of Fit Statistics.
Fit IndexFit StandardResults
CMIN/DF<3.002.951
RMR<0.050.046
RMSEA<0.080.057
GFI>0.900.940
AGFI>0.900.918
NFI>0.900.928
TLI>0.900.918
CFI>0.900.934
Table 4. Distribution of survey sample.
CharacteristicsFrequencyPercentage
GenderMale153651.0
Female147649.0
Age<18792.6
18–2445014.9
25–3494731.4
35–4477925.9
45–5436212.0
55–642749.1
>651214.0
Car ownershipHave car102634.1
Have not car198665.9
Income<2000 yuan/month30210.0
2000–4000 yuan/month69923.2
4000–6000 yuan/month117038.8
6000–8000 yuan/month53517.8
>8000 yuan/month30610.2
Travel purposeGo home79126.3
Work84328.0
Official business2207.3
School/study1394.6
Personal affairs45215.0
Entertainment or shopping38012.6
Others1876.2
Type of busDouble-decker bus1354.5
Articulated bus93731.1
Non-articulated bus194064.4
Type of lineExpress line152750.7
Common line114938.1
Branch line1214.0
Microcirculatory line923.1
BRT632.1
Customized line602.0
Type of stopHub stop49116.3
Common roadside stop236778.6
Harbor-shaped stop1545.1
TimePeak time115438.3
Non-peak time107635.7
Weekends78226.0
Table 5. Satisfaction scores with different segments.
SegmentsOptionsSatisfactionSegmentsOptionsSatisfaction
Type of busDouble-decker bus79.0Type of stopHub stop77.4
Articulated bus77.7Common roadside stop78.2
Non- Articulated bus78.1Harbor-shaped stop80.1
Type of lineExpress line78.1TimePeak time78.3
Common line77.5Non-peak time78.4
Branch line78.5Weekends77.6
Microcirculatory line78.2Income (yuan/month)Under 200078.7
BRT81.42000–400079.0
Customized line87.14000–600077.5
Private car ownershipYes78.26000–800078.1
No78.1Over 800078.3
Travel purposesGo home78.3AgesUnder1877.2
Work78.418–2477.3
Official business77.925–3477.4
School/study78.135–4478.6
Personal affairs77.345–5479.5
Entertainment or shopping78.755–6478.3
Others77.7Over 6580.8
Table 6. Multivariate variance analysis (only showing significant impact indicators).
SourceType III Sum of SquaresDegree of FreedomMean SquareF-TestSignificance
TimeTimeliness2095.45221047.7264.5650.010
Type of lineSecurity3783.3325756.6664.3650.001
Convenience2859.4965571.8993.2590.006
Comfort3280.1605656.0323.6070.003
Reliability6394.10251278.8208.6420.000
Economy8675.52651735.1058.8220.000
Type of stopReliability955.3242477.6623.2280.040
Type of vehicleSecurity3086.60131028.8675.9350.000
Convenience4357.48431452.4958.2760.000
Comfort2436.3553812.1184.4650.004
Reliability2116.0963705.3654.7670.003
Economy6831.92532277.30811.5790.000
Income
AgeTimeliness4164.8896694.1483.0250.006
Private car ownershipEconomy1115.38111115.3815.6710.017
Travel purposeTimeliness2919.8246486.6372.1200.048
Security2551.4456425.2412.4530.023
Comfort2436.4806406.0802.2330.037
Economy5879.7656979.9614.9830.000

