Abstract
Silver is one of the rarest metals in nature and certainly among the most used ones, not only as precious good for financial investments but also for many industrial critical applications. Because it would be very difficult to analyze the situation regarding the future global availability of silver as a commodity in general, due to the necessity of a large amount of data which are hardly available, we have focused only on the mining production of primary silver. In particular, the study regards the activities of a sample consisting of twelve of the world top fifteen leading primary silver mines, which represent the 54% of the worldwide primary silver production and 16% of the global silver mining production. We have investigated the related exploitation state and trends of these twelve sites by elaborating their last ten-years statistics on silver production, ore grades, resources and reserves. The findings of this study, in short, are that the cumulative average silver ore grades, both in extracted mineral, resources and reserves, of the above selected mines, have decreased and also that the new mining fields (Dukat, San Bartolomé, Pirquitas, Saucito) have lower silver content indexes than the older ones.
1. Introduction
Silver is a non-renewable resource [1] and one of the rarest metals of the earth’s crust (average 0.075 mg/kg), preceded only by a few others, such as gold and the six platinum group metals (PGM) [2]. Its distinctive physical-chemical properties, its typical use as precious good and its many and unique industrial uses are well known, particularly in electrical and electronic equipment (EEE), as specialty catalysts and for strategic and modern high-tech applications [3].
Summarizing the global situation of the silver market and its main dynamics, by the statistical information from the “World Silver Survey 2017” of the Silver Institute [4], it is possible to highlight the following key-points: (1) from 2007 to 2016, the world mine silver production has continued to grow with an annual average rate of 3.2%, from 667.7 Moz to 885.8 Moz; (2) the trend of the physical demand, from 2010 to 2016, has essentially stabilized around 1000 ÷ 1100 Moz/year; (3) most recently, silver prices have significantly decreased: from 35.12 $/oz, in 2011, to 17.14 $/oz, in 2016; (4) the industrial supply from scrap, from 2011 to 2016, obviously followed the price dynamics, falling drastically from 260.1 Moz/y to 139.7 Moz/y. Clearly, a possible future rise of prices could increase the share of silver recovery from scraps and could make those deposits that are currently considered uneconomic to become of mining interest [5].
Because it would be very difficult to analyze the situation regarding the future global availability of silver as a commodity in general, due to the necessity of a large amount of data which are hardly available, we have focused our research only on the production statistics of the most important primary silver mines in the world, investigating their exploitation state and historical trends. To do this, we have investigated and elaborated the corresponding quantitative information about the average silver grade of the extracted minerals of twelve of the world top fifteen leading primary silver mines, which represent the 54% of the worldwide primary silver production and 16% of the global silver mining production. It is interesting to investigate the production of primary silver, even if it is a small portion of global supply, in order to have an idea of the past and, probably, future variations of silver contents in those primary deposits that have got, as far as it is currently known, the highest silver ore grades on Earth. These mines are the only sites to produce silver as primary product while all the others, although having a considerable silver production, produce silver not as primary product, but as by-product of other minerals (gold, copper, zinc, etc.).
It must be made clear, by now, that our conclusions could not probably be general forecasts for the global silver mining production and, even less, for the future availability of this metal as commodity. In fact, to access the long term silver availability or exhaustion, it is necessary to include the assessment of the amount of silver from all potential geological resources (either as primary product or by/co-product from other mineral deposits). In addition, information and corresponding investigation about geological exploration of new silver mining fields is not included in this manuscript for the lack of data in the related companies’ reports.
2. Materials
According to the statistics of the Silver Institute and Thomson Reuters (“World Silver Survey 2017”), the first two silver producing countries in the world, in 2016, were Mexico and Peru, which together represent the 38% of the global silver production (885.8 Moz), while the only world primary silver production was 265.1 Moz and the biggest silver producing companies were Fresnillo plc. (Mexico City, Mexico) (45.7 Moz), Glencore plc. (Baar, Switzerland) (39.1 Moz) and KGHM Polska Miedź S.A. Group (Lubin, Poland) (38.8 Moz). Most of the silver produced in the world is obtained, however, as by-product of gold, copper, lead and zinc mining processes (620.7 Moz).
For the aims of this paper, we have referred to the world ranking of the first fifteen leading primary silver mines, published by the Silver Institute in its “World Silver Survey 2016” [6]. Of these mines, we have considered the last decade’s production data—mostly derived from their respective companies’ annual reports—of the following twelve extraction sites: Saucito (Mexico) and Fresnillo mines (Mexico) of the Fresnillo plc.; Dukat mine (Russia) of the Polymetal International plc. (Limassol, Cyprus); Cannington mine (Australia) of the South 32 Ltd. (Perth, Australia); Uchucchacua mines (Peru) of the Compañia de Minas Buenaventura SAA (Lima, Peru); Pirquitas mines (Argentina) of the Silver Standard Resources Mining Inc. (Vancouver, Canada); Greens Creek (Juneau, AK, U.S.A.) of Hecla Mining Company (Coeur d’Alene, ID, U.S.A.); San Jose mine (Argentina) of the Hochschild Mining plc. (London, UK) and the McEwen Mining Inc. (Toronto, Canada); Arcata mine (Peru) of the Hochschild Mining plc.; San Bartolomé (Bolivia) and Palmarejo mines (Mexico) of the Coeur Mining Inc. (Chicago, IL, United States); and La Colorada mines (Mexico) of the Pan American Silver Corp. (Vancouver, Canada).
Due to the lack of statistical information or to the unavailability of their respective annual reports, it was not possible to analyze the production data of the following remaining three mining sites: Escobal mine (Guatemala) of the Tahoe Resources Inc.; Imiter mine (Morocco) of the Société Métallurgique d’Imiter and Gümüşköy (Turkey) of the Eti Gümüş A.Ş. It was also not feasible to use the production data contained in the annual reports of Gümüşköy mine (Turkey) of the Eti Gümüş A.Ş., because this information is mostly available in aggregate form.
In 2015, the last available year data available in the “World Silver Survey 2016”, the above twelve sites represented, with a total production of 142.6 Moz of silver, over the 80% of the mining production of the whole fifteen statistical sample; that was almost the 54% of the world primary silver production and the 16% of the global mine production.
Below, we briefly describe the analyzed mines, indicating the related information sources that we have used for our study.
The Fresnillo Saucito site (Zacatecas, Mexico), operational since 2009, is an underground mine with flotation plants. It is the current first primary silver mine in the world: in 2016, this mine produced 21.9 Moz of silver [4,7]. The other site of Fresnillo plc., the Fresnillo mine (Zacatecas, Mexico), in operation since 1554, is an underground mine too [8]. Its flotation plant has a milling capacity of 8000 t/d (2.64 Mt/y). In 2016, this mine produced 15.9 Moz of silver. For both Fresnillo’s company mining sites, the respective data sources have been the following: Fresnillo, “Production Report”, several years [9]; Fresnillo plc., “Annual Report”, several years [10].
The Dukat underground silver/gold hub (near the cities of Magadan and Omsukchan, in Magadan Region, Russia), of the Polymetal International plc., is the third largest silver deposit in the world. In 2016, this plant produced 19.8 Moz of silver [4]. Production has started from 2000. The Dukat and Lunnoye operating units, located in the same geographic proximity area, created, in 2008, the Dukat hub. Dukat concentrator currently operates at full capacity of 1500 kt/d and uses conventional sulphide flotation technology. The corresponding statistical sources have been: Polymetal International plc., “Annual Report & Accounts”, several years [11].
The Cannington site (Shire of Mckinley, Queensland, Australia), 100% owned by South 32 Ltd, is a Pb-Zn-Ag Broken Hill-type (BHT); it is an underground mine and a sulphide ore type. It has a surface processing facility and constitutes one of the largest ore reserves in the world. This deposit, discovered in 1990, has commenced concentrate production from 1997. In 2015, it was the second largest primary silver mine in the world with a production of 22.2 Moz. In 2016, this site produced 18.2 Moz of silver. The statistical sources have been the following: South 32 Ltd., “Annual Report 2015” and “Annual Report 2016” [12]; BHP Billiton plc., “Annual Report”, several years [13]; BHP Billiton, “Quarterly Production Report—June”, several years [14]; St. Angelo [15].
The Uchucchacua site (Lima, Peru), 100% owned by Compañía de Minas Buenaventura S.A.A., is an underground mine and produces, in order of economic importance, silver, zinc and lead. In 2016, this plant and the adjacent plant of Julcani produced 16.2 Moz of silver, with a high content of precious mineral in ore treated (474 g/t). These have been the related data sources: Compañía de Minas Buenaventura S.A.A., “Annual Report”, several years [16].
The Pirquitas plant (Jujuy, Argentina), a 100% owned property of Silver Standard Resources Mining Inc., is an Ag-Sn-Zn underground and open-pit deposit. This site has been in operation since 2010. In 2016, silver mining production was 10.4 Moz. Its statistical information have been: Silver Standard Resources Mining Inc., “Silver Standard Report—Fourth Quarter and Year-End Results”, several years [17].
The Greens Creek mine (Admiralty Island, Alaska, USA) of Hecla Mining Company, producing, in 2016, 9.3 Moz of silver, is a polymetallic (Ag, Zn, Au, Pb), stratiform, sulphide deposit. The data sources of this site have been the following: Hecla Mining Company [18]; Hecla Mining Company, “Annual Report”, several years [19].
The San José silver-gold plant (in Santa Cruz province, Argentina) is an underground operating site since 2007. It is a low sulphidation type, held in partnership between Hochschild Mining Argentina (51% ownership) and McEwen Mining Inc. (49% ownership) by the “Minera Santa Cruz, S.A.” (MSC) joint-venture agreement. In this site, in 2016, 6.7 Moz of primary silver were produced [20]. The first production operations of the Arcata site (Department of Arequipa, Peru)—that covers an area of 47,000 hectares, currently 100% owned by the British-based Hochschild Mining plc.—started in 1961. This unit produces silver/gold bulk concentrate by flotation of minerals from underground operations [21]. In 2016, silver production was 6.3 Moz. For both the San José and Arcata mines, the statistical sources have been: Hochschild Mining plc., “Annual Report & Accounts”, several years [22]; Hochschild Mining plc., “Preliminary results for the twelve months ended 31 December 2016”, 8 March 2017 [23]; McEwen Mining Inc., “Annual Report”, several years [24].
Coeur Mining Inc. has two sites among the top 15 world largest primary silver mines: San Bartolomé (Potosì, Bolivia) and Palmarejo (Chihuahua, Mexico). The first one is a surface mining plant with a 2016 silver production of 5.5 Moz [25]. The second site is a silver-gold complex with an underground mine, whose commercial production commenced in 2009. Palmarejo’s silver production, in 2016, was 4.4 Moz [26]. For both sites, data sources have been: Coeur Mining Inc., “Annual Report”, several years [27]; Coeur Mining Inc., “News release”, several years [28].
La Colorada (Zacatecas, Mexico), 100% acquired by Pan American Silver Corp. in 1998, is a poly-metallic underground mine. The operation produces silver, gold, zinc and lead by milling approximately 870 t/d of sulphide ore and 430 t/d of oxide ore [29]. 2016 production was 5.8 Moz. The corresponding sources of data have been: Pan American Silver Corp., “Annual Report”, several years [30].
3. Methods
Of the twelve analyzed mines, we have extrapolated the production statistics concerning the following items: silver produced, ore processed, silver mill feed grade, silver average yield, reserves (proved and probable), resources (measured, indicated and inferred) and average ore grades in resources and reserves.
We have focused only on primary silver mines, excluding those sites that, although having a considerable silver production, produce silver not as primary product, but as by-product of other minerals (gold, copper, zinc, etc.), because, as we have already written in the introduction of this paper, it would be very difficult to analyze the situation regarding the global availability of silver in general, due to the necessity of a large amount of data hardly available. Specifically, a “primary silver producer” is a company generating most of its revenue from silver sales. In addition to this, we have chosen, for reasons of availability, homogeneity and statistical significance, to limit the reference temporal scale of all indicators to the last ten years: from 2007 to 2016.
Furthermore, the assessment of proven and probable resources (measured, indicated and inferred), of almost all twelve examined mining companies, is based on the recommendations contained in the Joint Ore Reserves Committee (JORC) “Australasian Code For the Reporting of Exploration Results, Mineral Resources and Ore Reserves” of “The JORC Code 2012 Edition” [31]. As known, assessment of resources and reserves is important for the companies themselves and their investors to establish the production units’ depreciation and amortization of annual expenses [32,33].
Other precious metals mining companies, like Coeur Mining Inc., that are listed in the Toronto Stock Exchange (TSX), report the amount of their mineral resources and reserves according to different requirements, based on the Canadian Securities and Exchange Commission (SEC) by the National Instrument 43-101 Standards of Disclosure for Mineral Projects (“NI 43-101”). The term “mineralized material”, used in the SEC’s Forms 10-K of Coeur Mining Inc., indicates those mineral deposits which are not ore reserves; this term is equivalent to JORC’s “proven” (or “measured”) and “probable” (or “indicated”) mineral resources together.
Lastly, as the “silver average yield” indicators are not always available in the companies’ yearbooks, it has often been necessary to determine them indirectly by dividing silver produced amount (“mine production”) by the tonnes of extracted ore (“ore milled” or “ore processed” items). Likewise, for an easy and homogeneous comparison, it has been necessary to multiply the silver mill feed grade (in ore treated), of each mine, by the corresponding tonnes of ore milled or processed. The related values of all the mines considered have been summed and then cumulatively divided by the total amount of milled or processed ore. This synthetic coefficient represents the average silver content of the treated mineral for all sites.
4. Results and Discussion
4.1. Production Statistics
Cumulative primary silver production, of the above-mentioned 12 mines, has increased considerably from 2007 to 2011; subsequently, it has remained substantially stable in the following years. On the contrary, the trend of processed ore (or ore milled) has progressively increased during the considered decade by more than double, ranging from about 7 Mt/y to almost 18 Mt/y (Table 1).

Table 1.
Silver production (in Moz) and ore processed (kt).
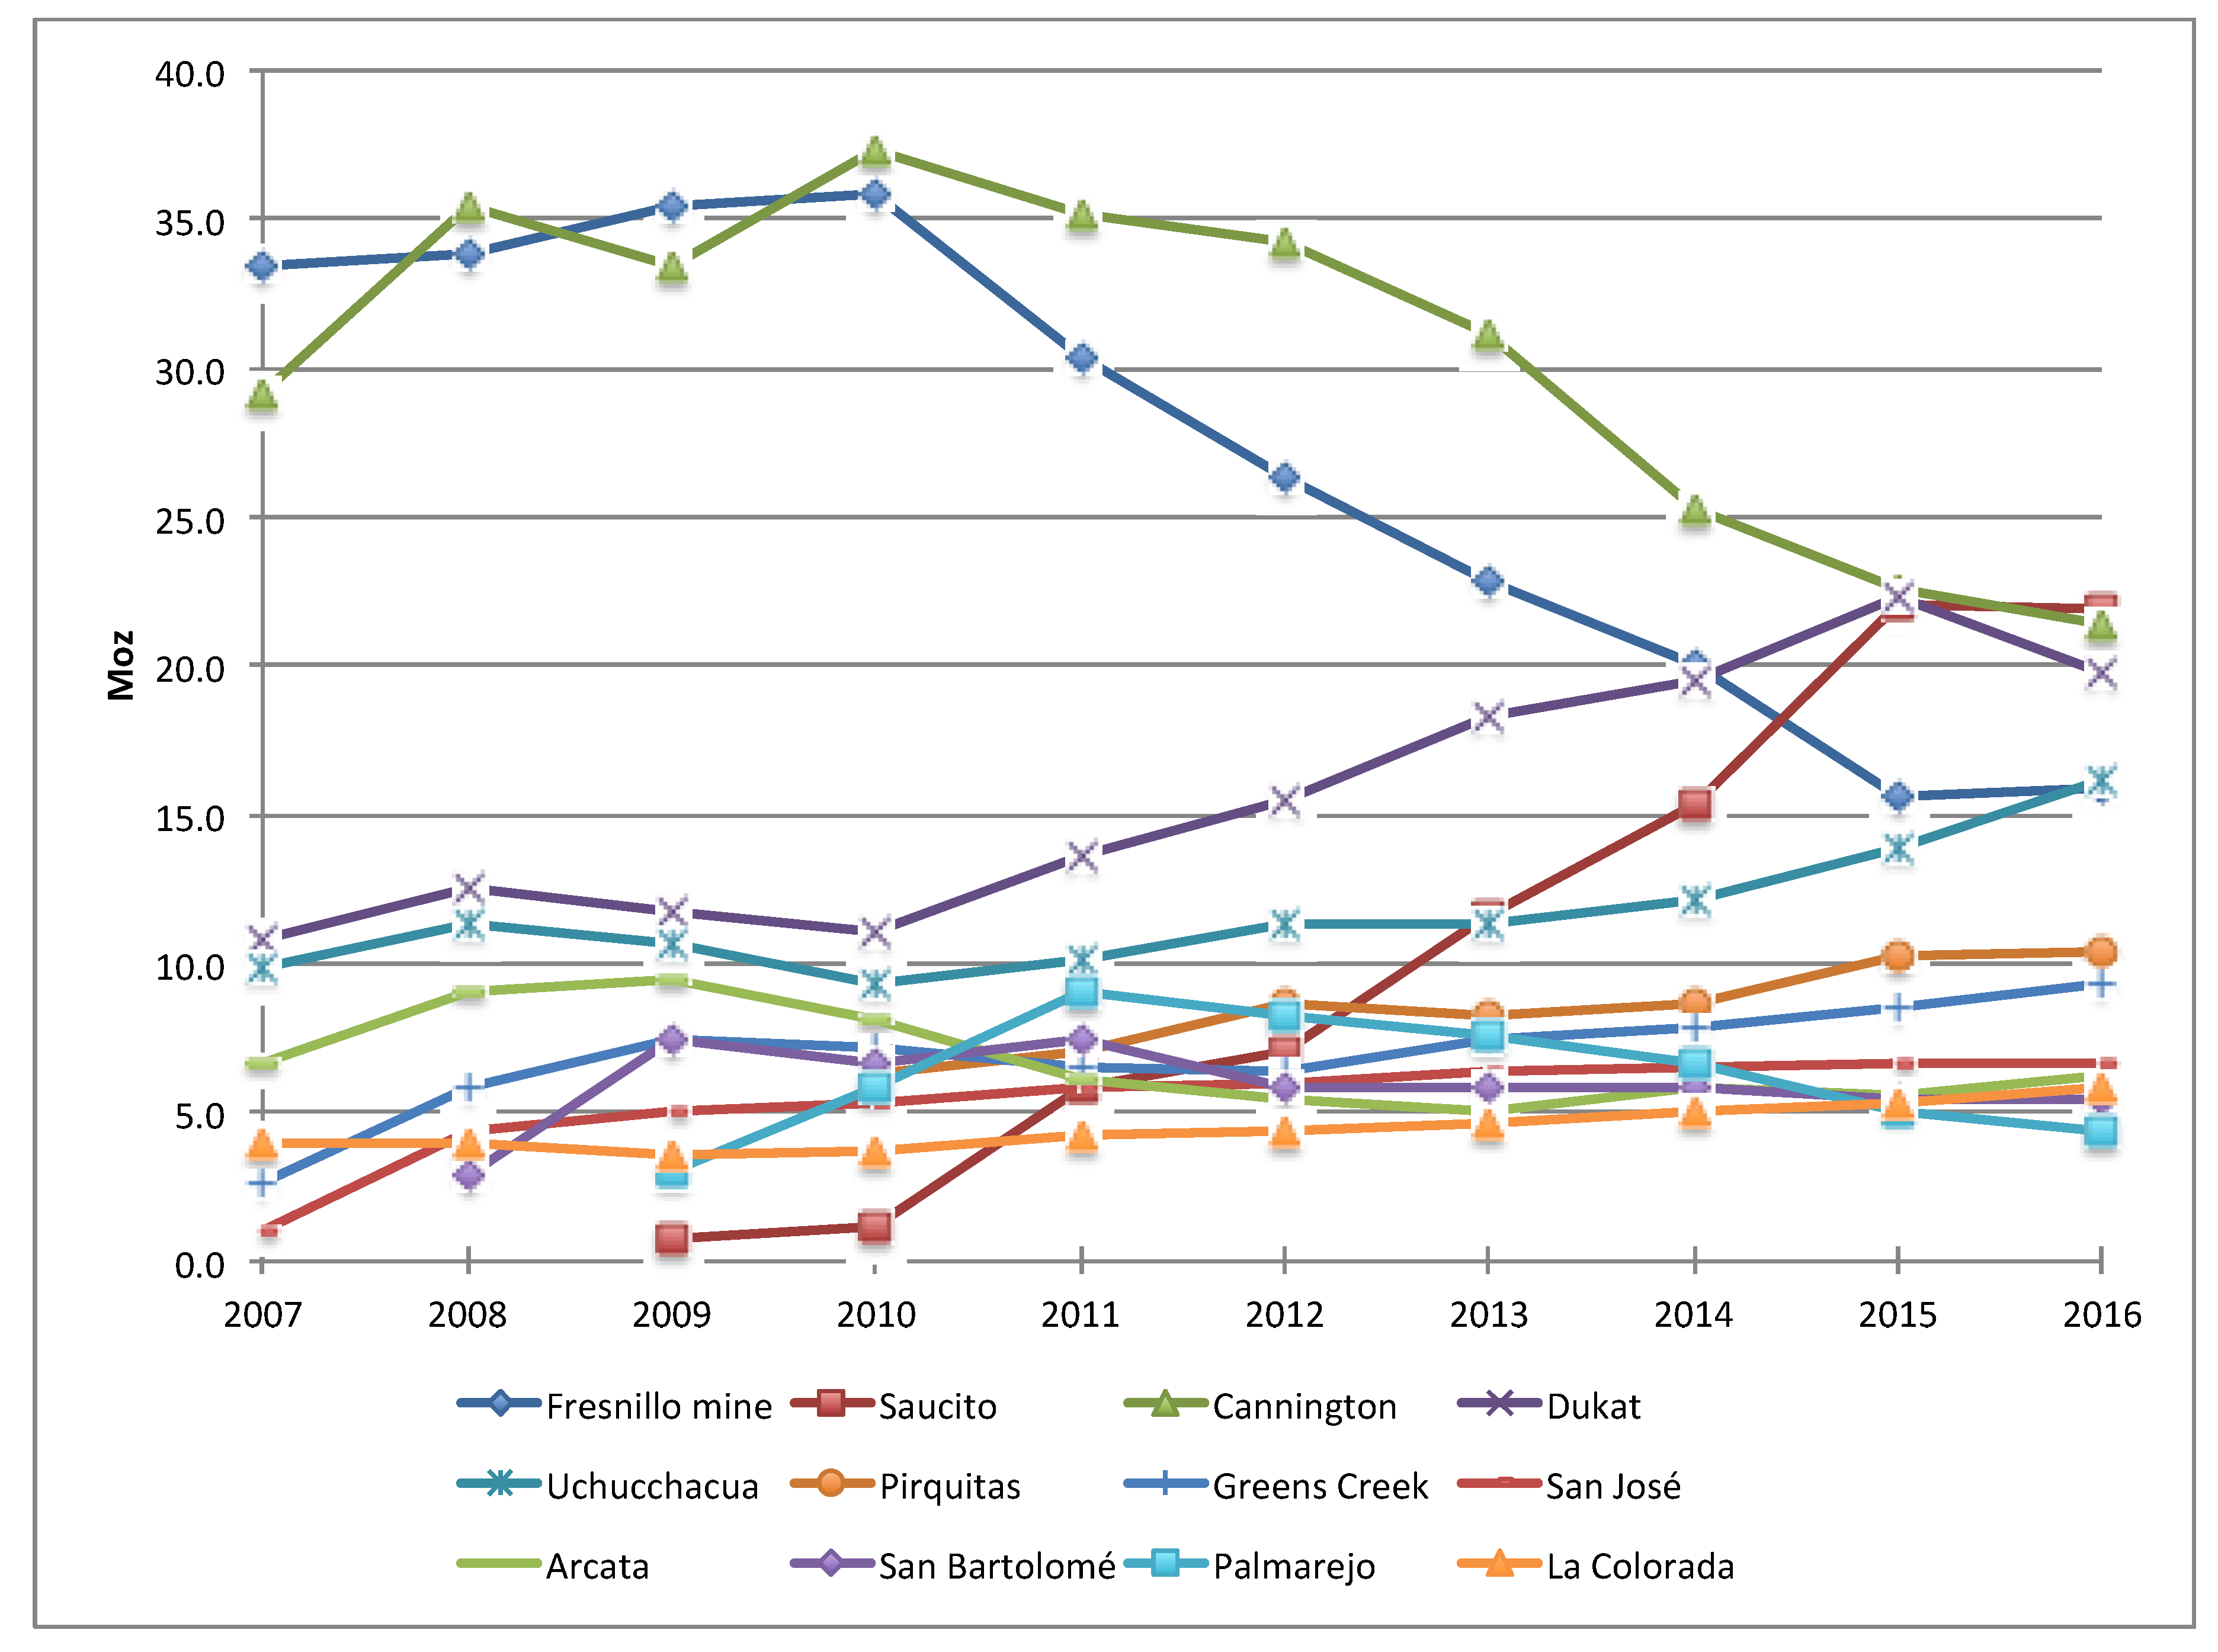
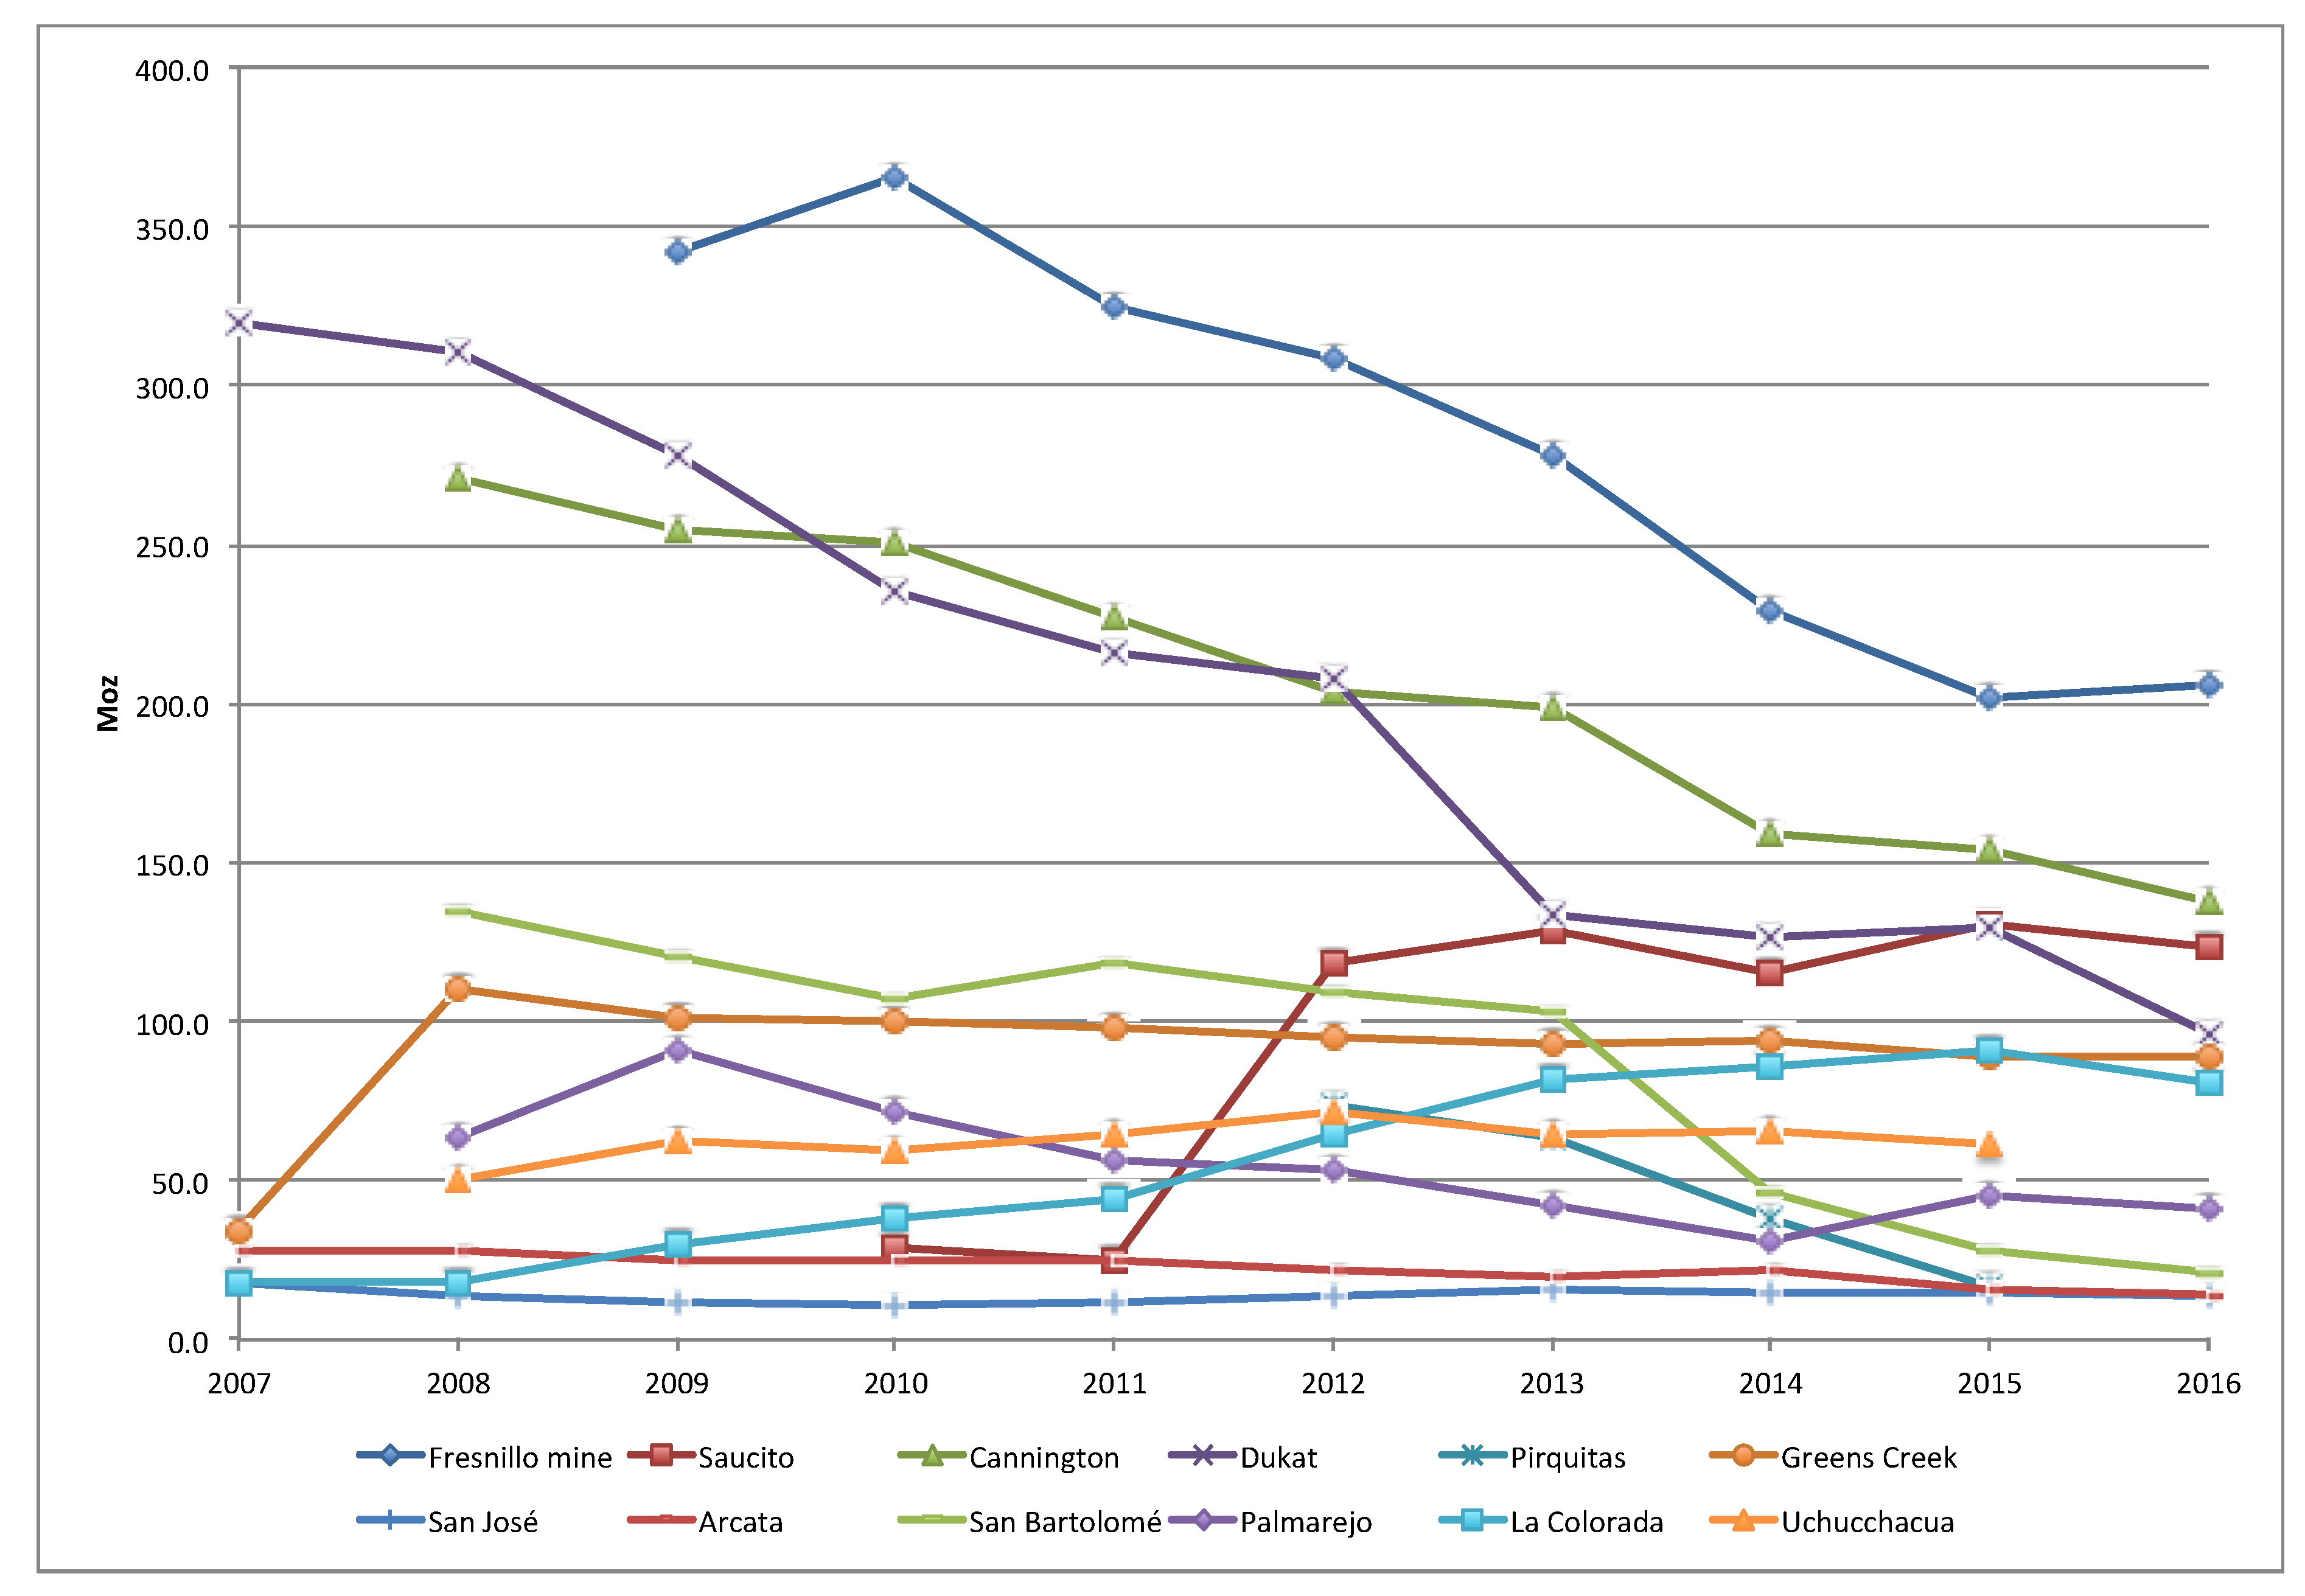
In particular, as shown in Figure 1, the production of the two oldest and most important mines (Fresnillo and Cannington), in recent years, has significantly declined since 2010, to be almost halved in recent years (37.3 Moz in 2017).

Figure 1.
Silver mine production.
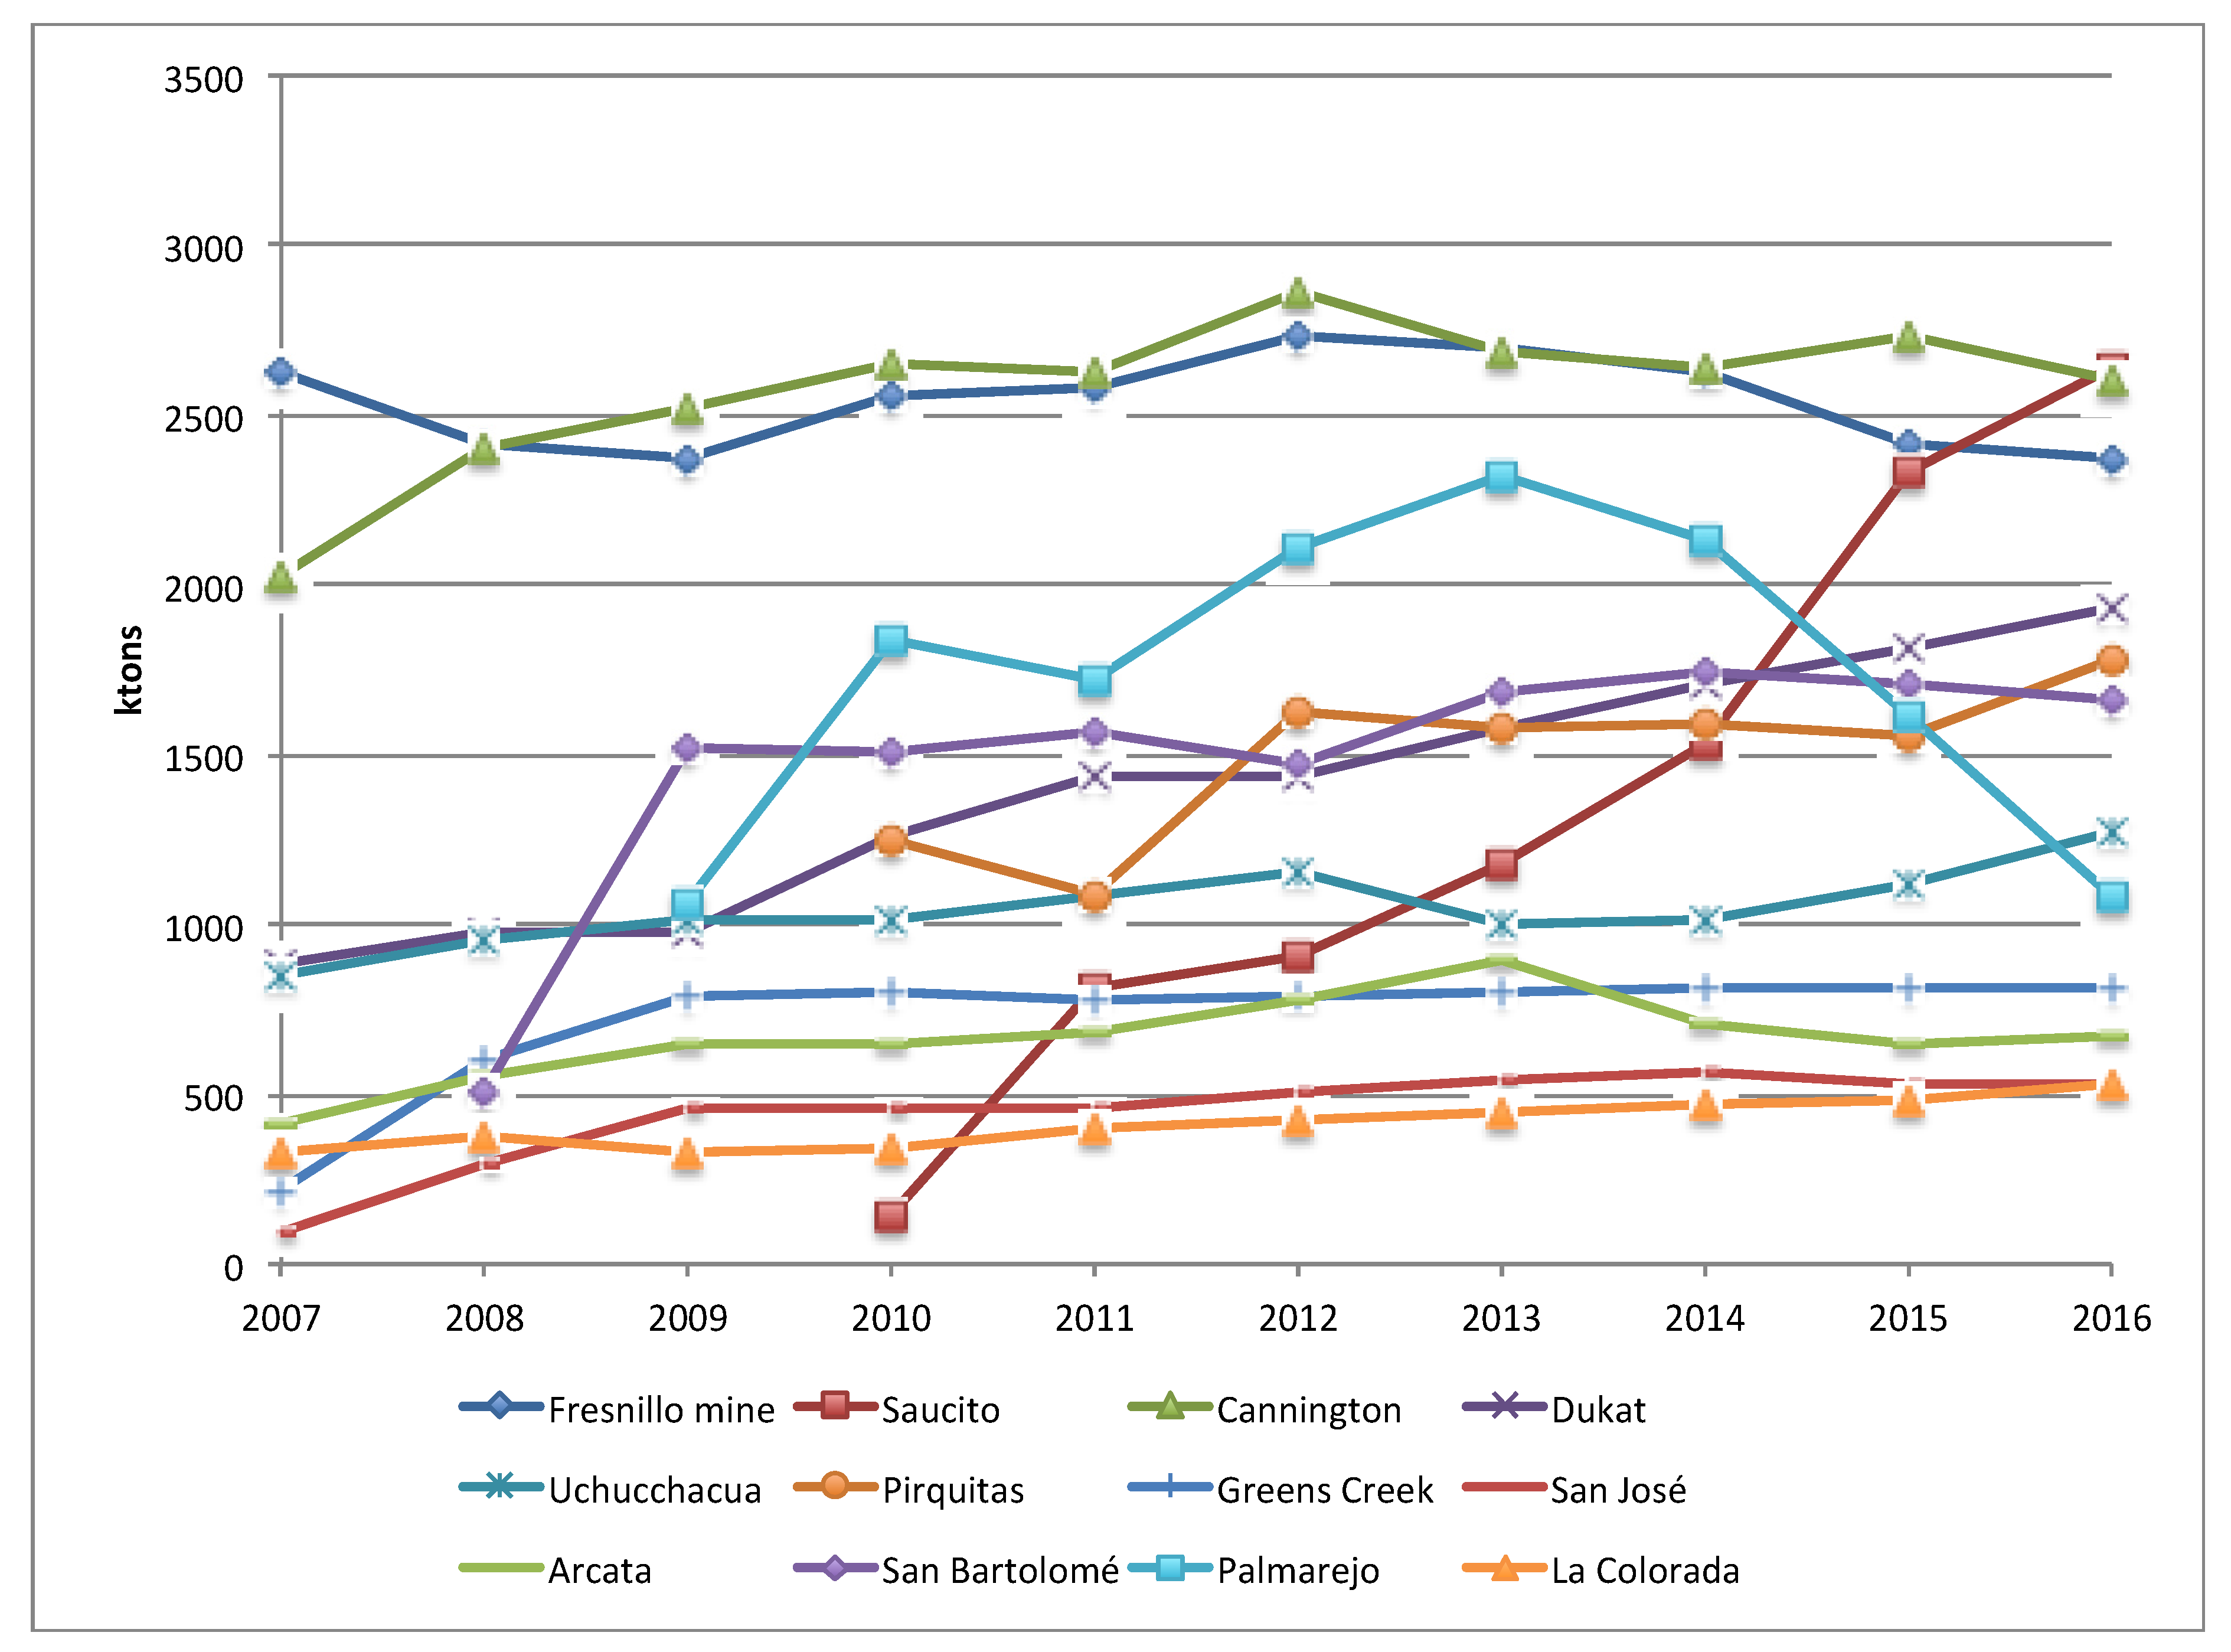
In Figure 2, there are the evolution lines of the “ore milled/processed” indicators: the corresponding values of the largest mines and of the other sites have remained substantially stable throughout the decade. This, perhaps, is due to the fact that the productive potentiality of a mining site results from two short-term fixed variables: the sizing of extractive technological capacity and labor force employed. The values of the same indicator of the remaining mines have progressively increased, mainly due to an expansion of productive capacity of new mining fields (Saucito, Dukat and Uchucchacua), as we can see in Figure 1 too. Palmarejo mine trend is like an inverted parabolic curve, maybe due to a rapid and consistent reduction of its average silver content in the ore extracted.
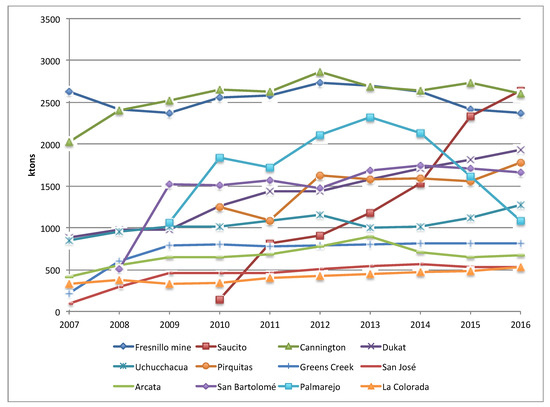
Figure 2.
Silver ore milled or processed.
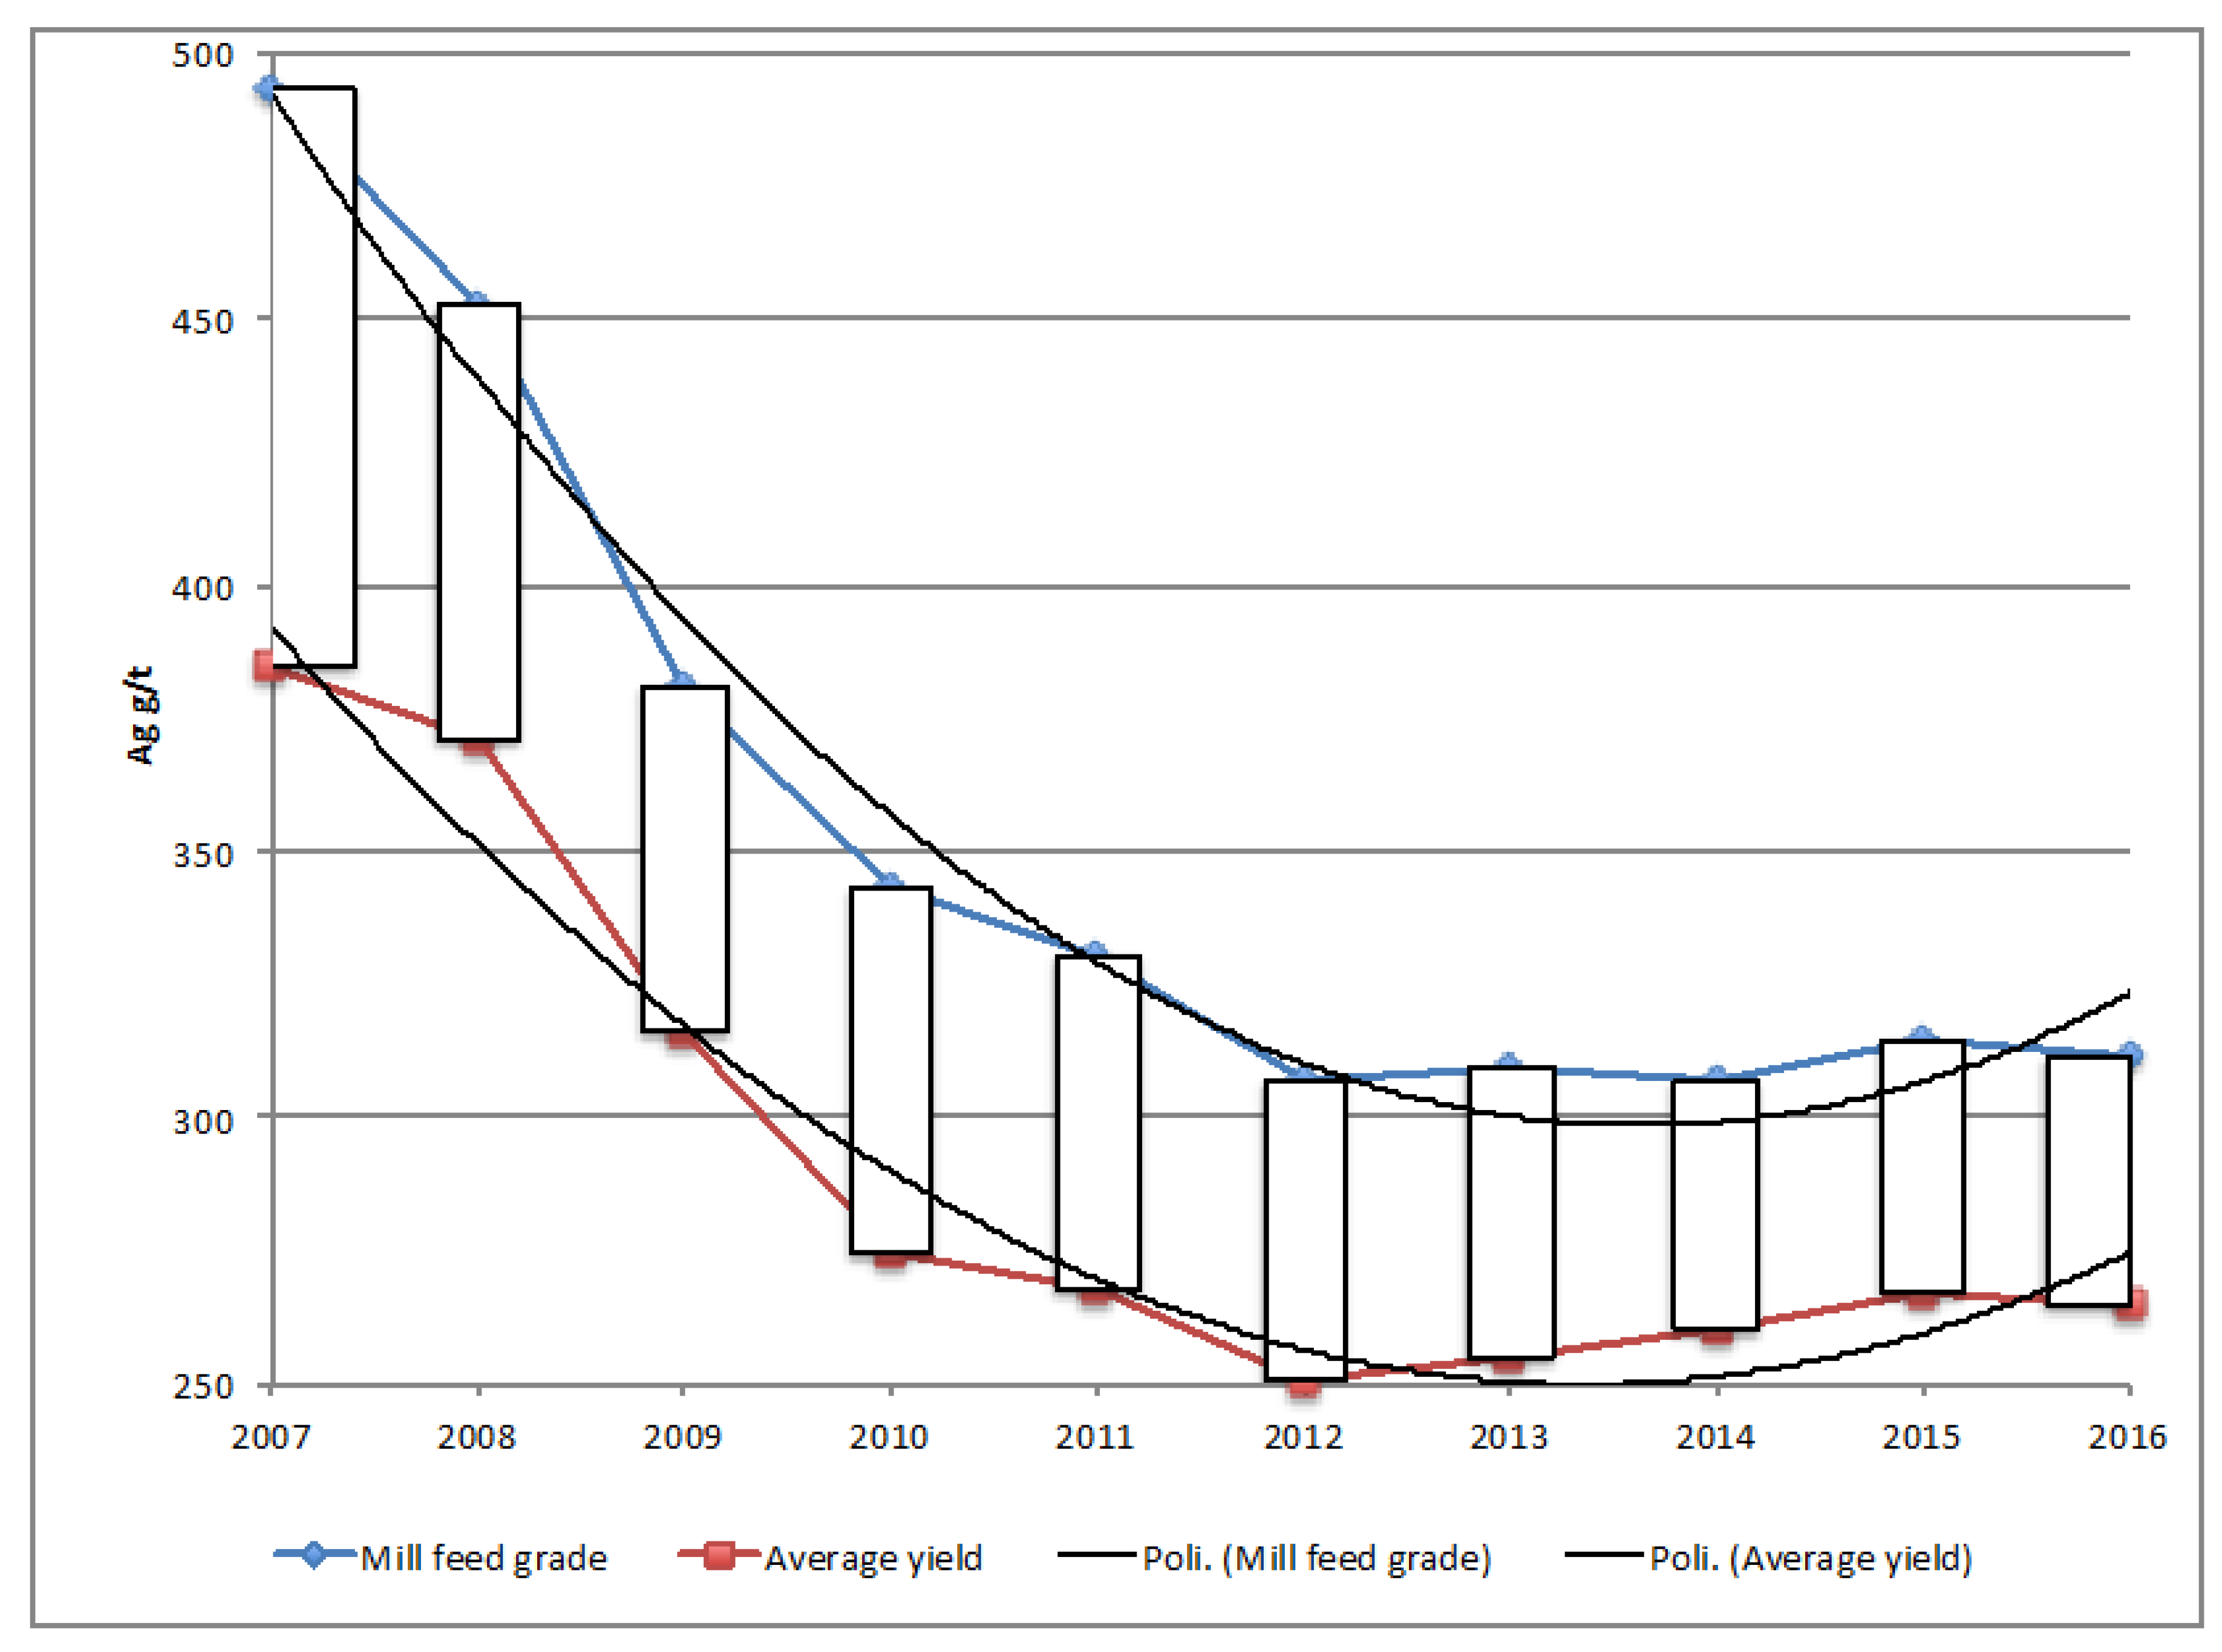
In Table 2, there are data on: (1) silver “mill-feed grade” in ore treated; (2) “average yield”, obtained as ratio of “(silver produced)/(ore milled)”; and (3) “recovery rate”, in percent, obtained as ratio of “(average yield)/(mill feed grade)”. Probably, the increase of this last ratio is mainly due to the general improvement of the technological efficiency of the extraction processes.
Table 2.
Silver mill feed grade (in ore-treated, g/t), average yield (Ag g/t), and silver recovery rate (%) of the examined mines (except Cannington).
Both the first two variables, until 2012 (see Figure 3), are declining for the fact that, probably, these twelve mining companies, considered as a whole, are currently exploiting fields having ore material with a lower content of silver. Specifically, the mill feed grade curve assumes a more pronounced descending trend than that of the average yield. After 2012, both curves are in constant, even if slight, increase. The spread between the two variables, at the beginning of the considered period, has decreased.
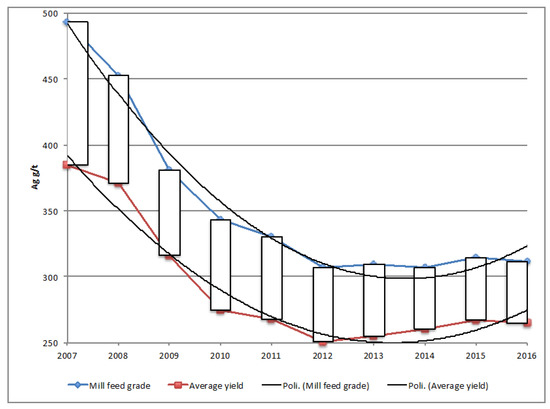
Figure 3.
Silver mill grade and silver average yield.
The recovery rate (Table 2) shows a positive trend starting from 2007, with a sudden decrease only in 2010, and then it settles around 85% during the last three years.
In particular, we are interested in analyzing the situation of the “ore grade” parameter, in order to verify the starting hypothesis regarding the poorer silver content in the extracted mineral. By examining Figure 4, we can see that the newest sites, namely those that have begun production more recently (Dukat, San Bartolomé, Pirquitas, Saucito), have lower silver content indexes than the oldest mines. Also, this evidence is symptomatic of the lower productivity rates in the oldest mining sites having probably driven the corresponding companies to begin the exploitation of those areas/fields that have less silver content.
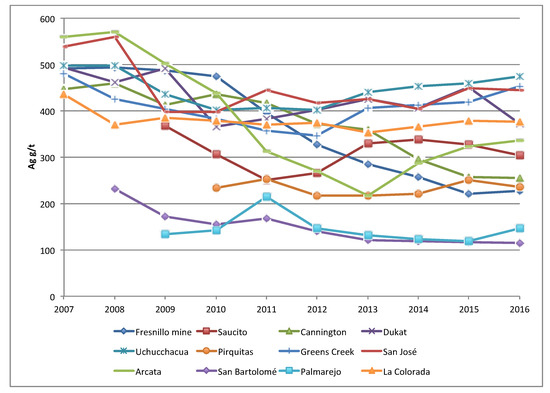
Figure 4.
Silver ore grade.
In Figure 5, there are the trends of the ratio: [(ore grade) − (average yield)]/(average yield). This graphic allows us to assume that, during the above specified time interval, there was probably a technological improvement that caused a consequent adjustment of the values of the indexes of each mining site around the average value of 15%. Very likely, in order to maintain an equivalent silver production and compensate for the lower average silver grade, the companies have optimized the milling capacity of their separation plants, producing less waste.
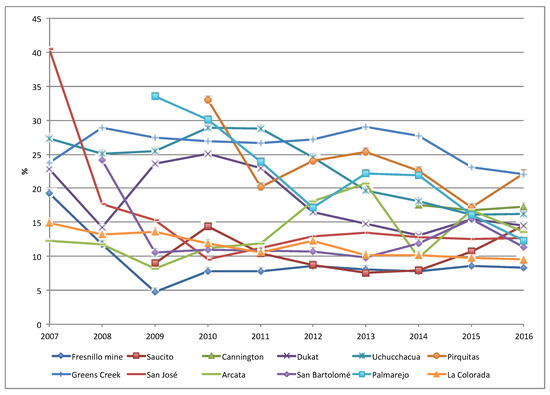
Figure 5.
[(ore grade) − (average yield)]/(average yield).
4.2. Resources and Reserves
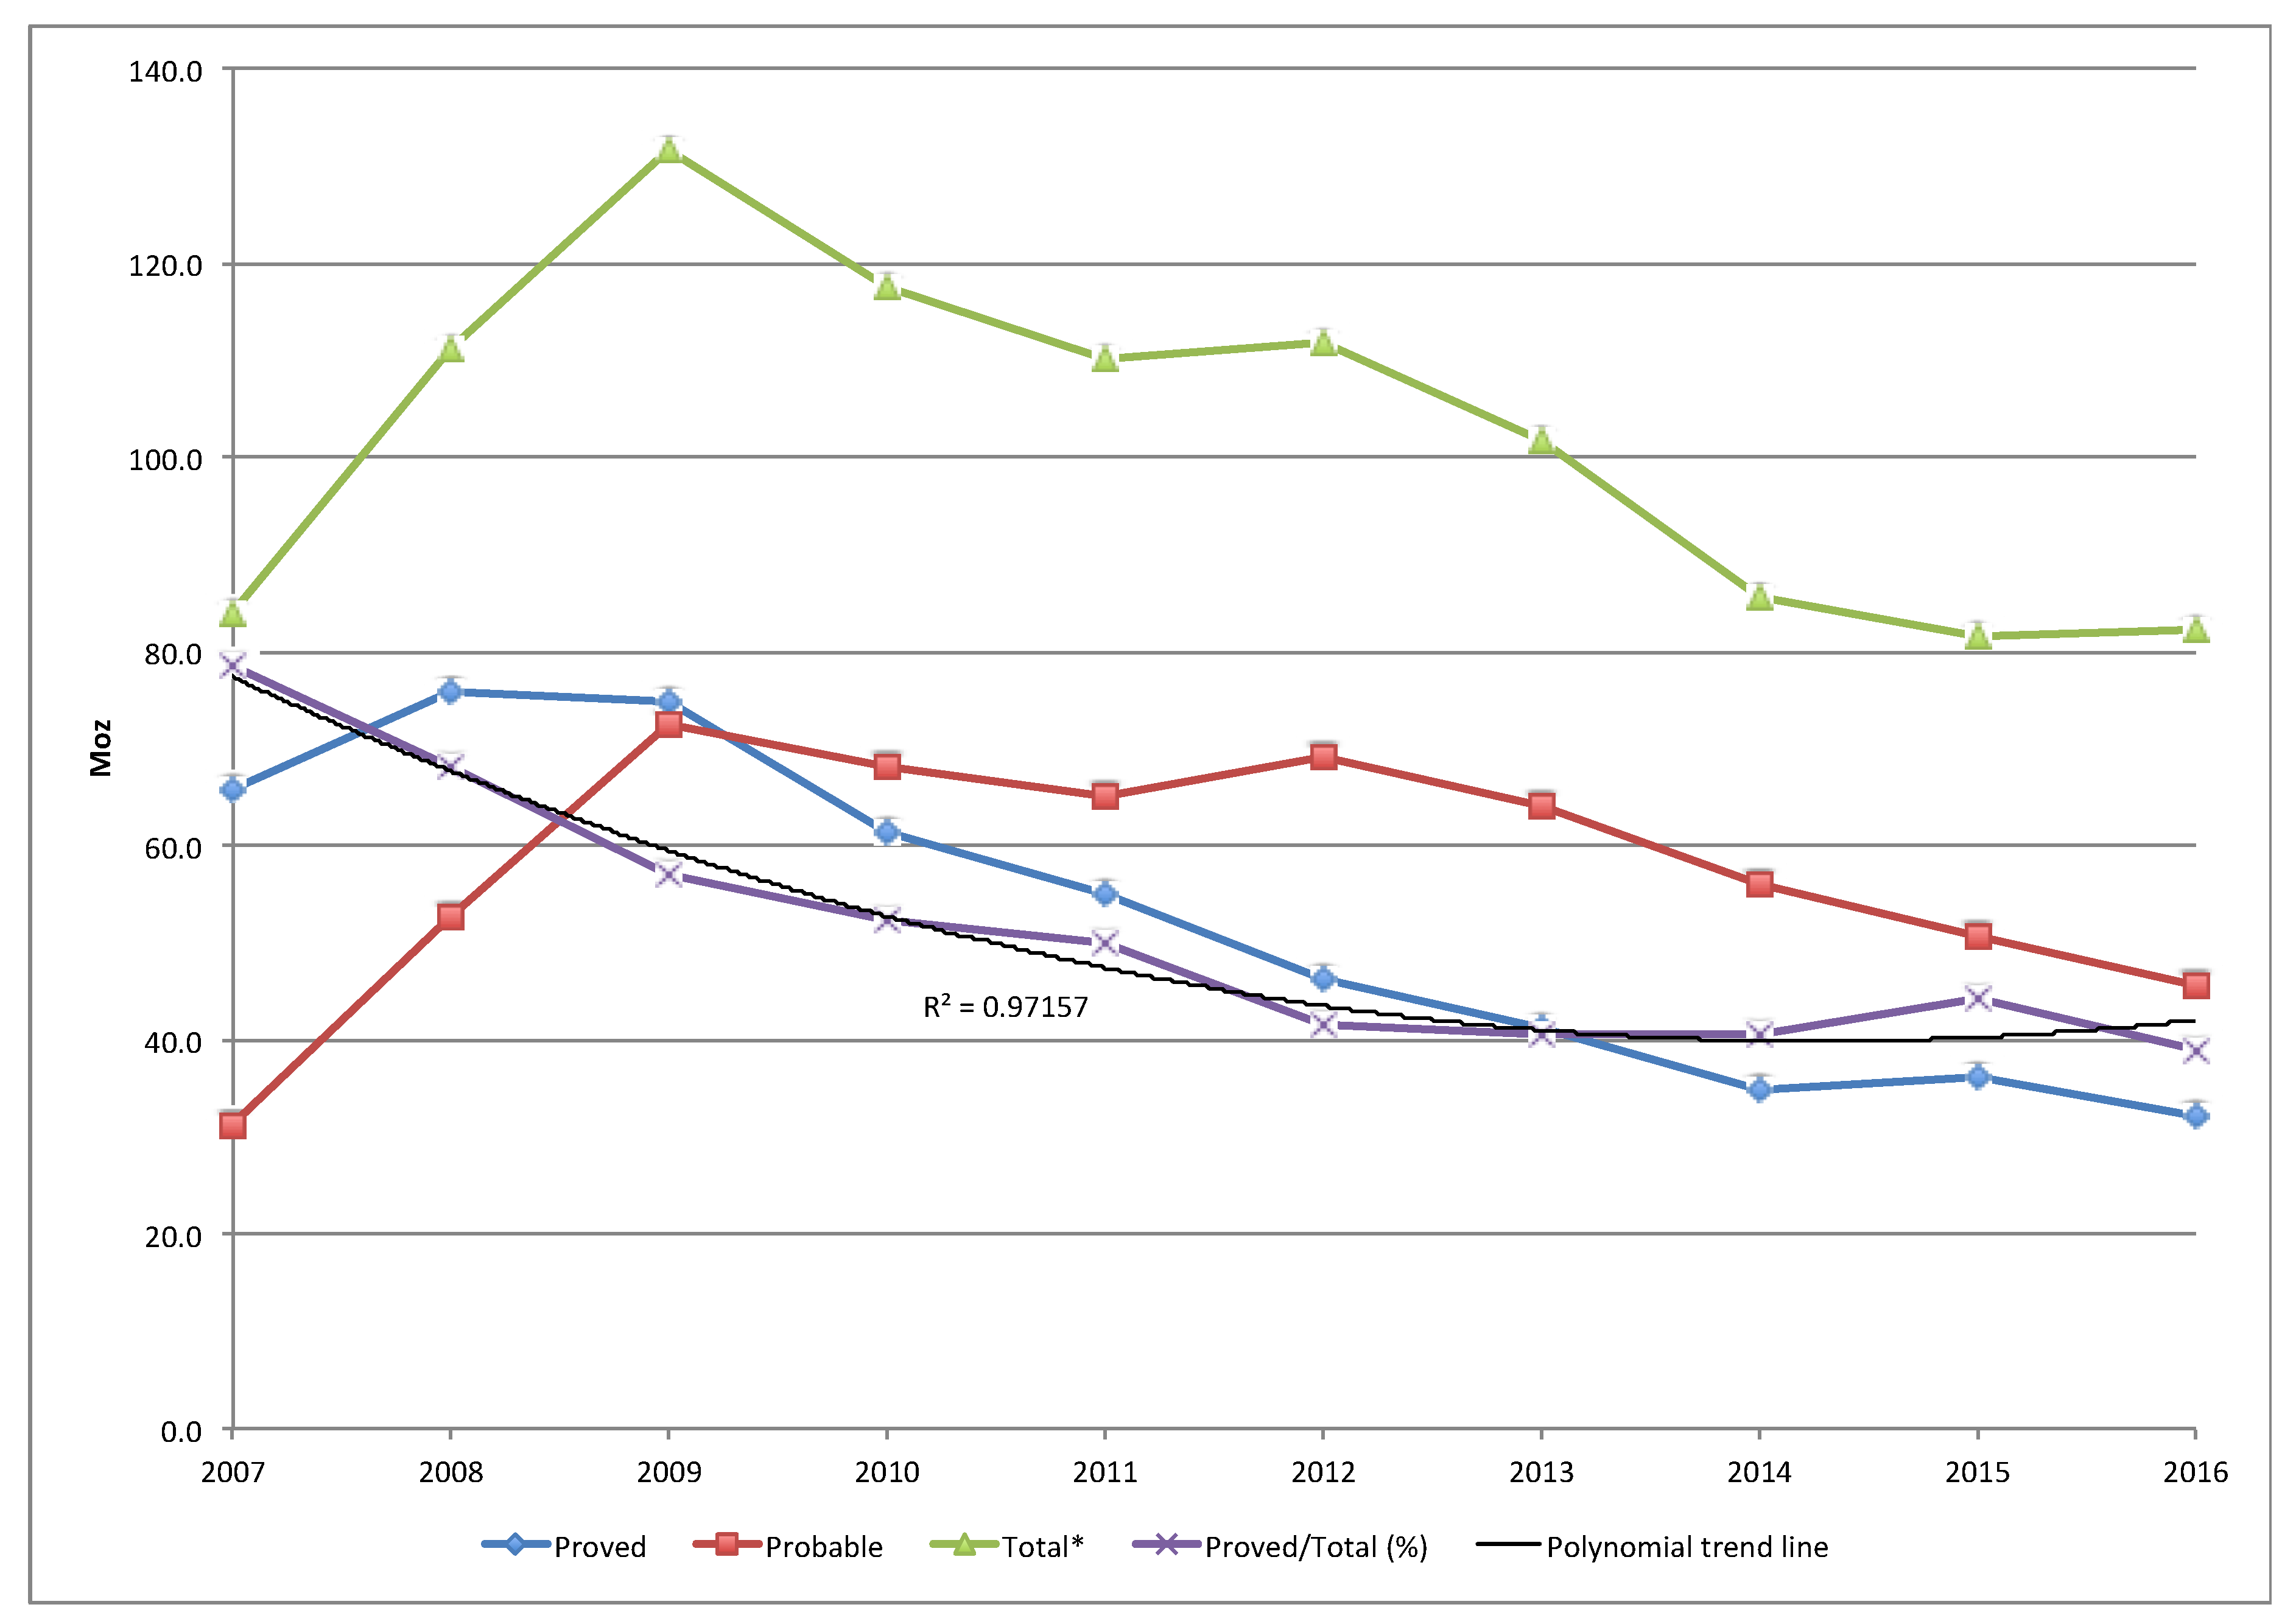
In Table 3, the data of the primary silver reserves of the examined 12 mines are reported. Specifically, for proven and probable reserves, the indexes are referred to the average values of 11 of these 12 extractive sites. In fact, the disaggregated statistics of Uchucchacua mine are not available. In any case, aggregate data, which is reported as the “Total” in Table 3, include those of the Uchucchacua mine, too. We have chosen to examine the weighted average values of reserves and resources, instead of the simple sums of the single data of each mine, in order to better highlight the corresponding trends and to calculate the burn-off time (mineable reserves divided by the annual average mining production) [34]. At this regard, it is useful to underline that the overall quantification of resources and reserves is a parameter subject to variations over time, as the brownfield activities of a mineral deposit are carried out continuously and systematically with the exploitation of the site, and therefore it is less useful, for the aims of this paper, than the analysis of ore grades of resources and reserves.
Table 3.
Primary silver reserves’ average values of the examined mines (Moz).
However, analyzing this table, and especially the corresponding graphical representation (Figure 6), it can been noticed that the average estimated values of total reserves, for all the considered mines, have negative trends, especially from 2009, when the maximum peak was recorded. This peak was, in part, caused by the inclusion of the Fresnillo mine data, as it can be seen from Figure 7. In 2009, the total average amount of reserves was estimated, always according to the criteria of the JORC Code, being 131.4 Moz, while, in the last considered year, this value fallen to just over 80 Moz. Also the percentage ratio of the average value of the proven reserves divided by the total average of reserves has decreased from 2007 to present, as we can see by the curve of polynomial trend line (R2 = 0.9757; as known, R2 is a number, ranging from 0 to 1, indicating the degree of correspondence between the estimated values, of a trend line, and the real ones). This implies that, for the assessment of reserves, the estimated contribution of those proved on the total reserves decreased during the decade.
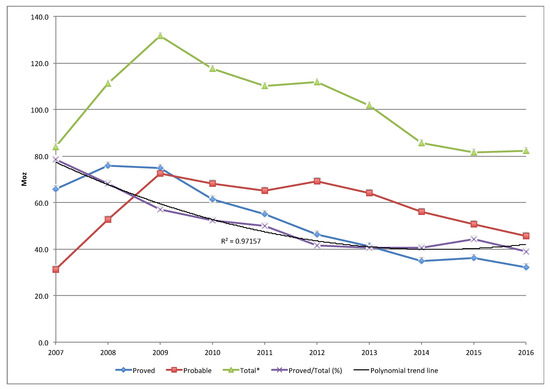
Figure 6.
Average values of reserves (Moz) and (proved reserves)/(total reserves) ratio. *Weighed averages.
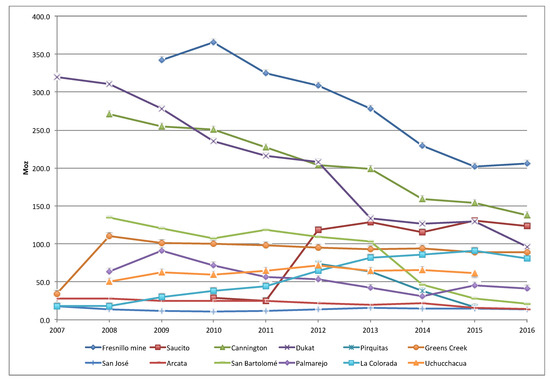
Figure 7.
Total reserves.
In Figure 7, the historical trends of total reserves for each mining site are illustrated. The top three sites (Fresnillo mine, Dukat, and Cannington), with the largest amount of reserves, are also those ones that show the highest estimated rates of reduction and have virtually halved the total amount of their reserves: from a value of 875 Moz in 2009 to less than 440 Moz in 2016. This obviously has direct repercussions on the mine life of the sites, as we will see shortly.
Also for the analysis of resources, we will take into account the corresponding average weighted values and not the simple sums, which would not be very significant because these data are not always available for all the analyzed companies. In Table 4, from 2007 to 2010, the weighted average amount of the measured resources (relating to ten of twelve mines, due to the absence of statistics of Greens Creek and Uchucchacua sites), decreased from 135 Moz to 80 Moz. This can be explained, largely, by the fact that the measured reserves of the Dukat mine decreased from 510 Moz in 2007 to less then 35 Moz in 2010; this circumstance obviously distorts the average of the whole sample, so it is not possible to draw significant conclusions. The only point to be highlighted is the relationship between the measured and the total resources; the evolution of this ratio, in fact, indicates a higher degree of uncertainty.
Table 4.
Average resources of the mines of the sample (Moz).
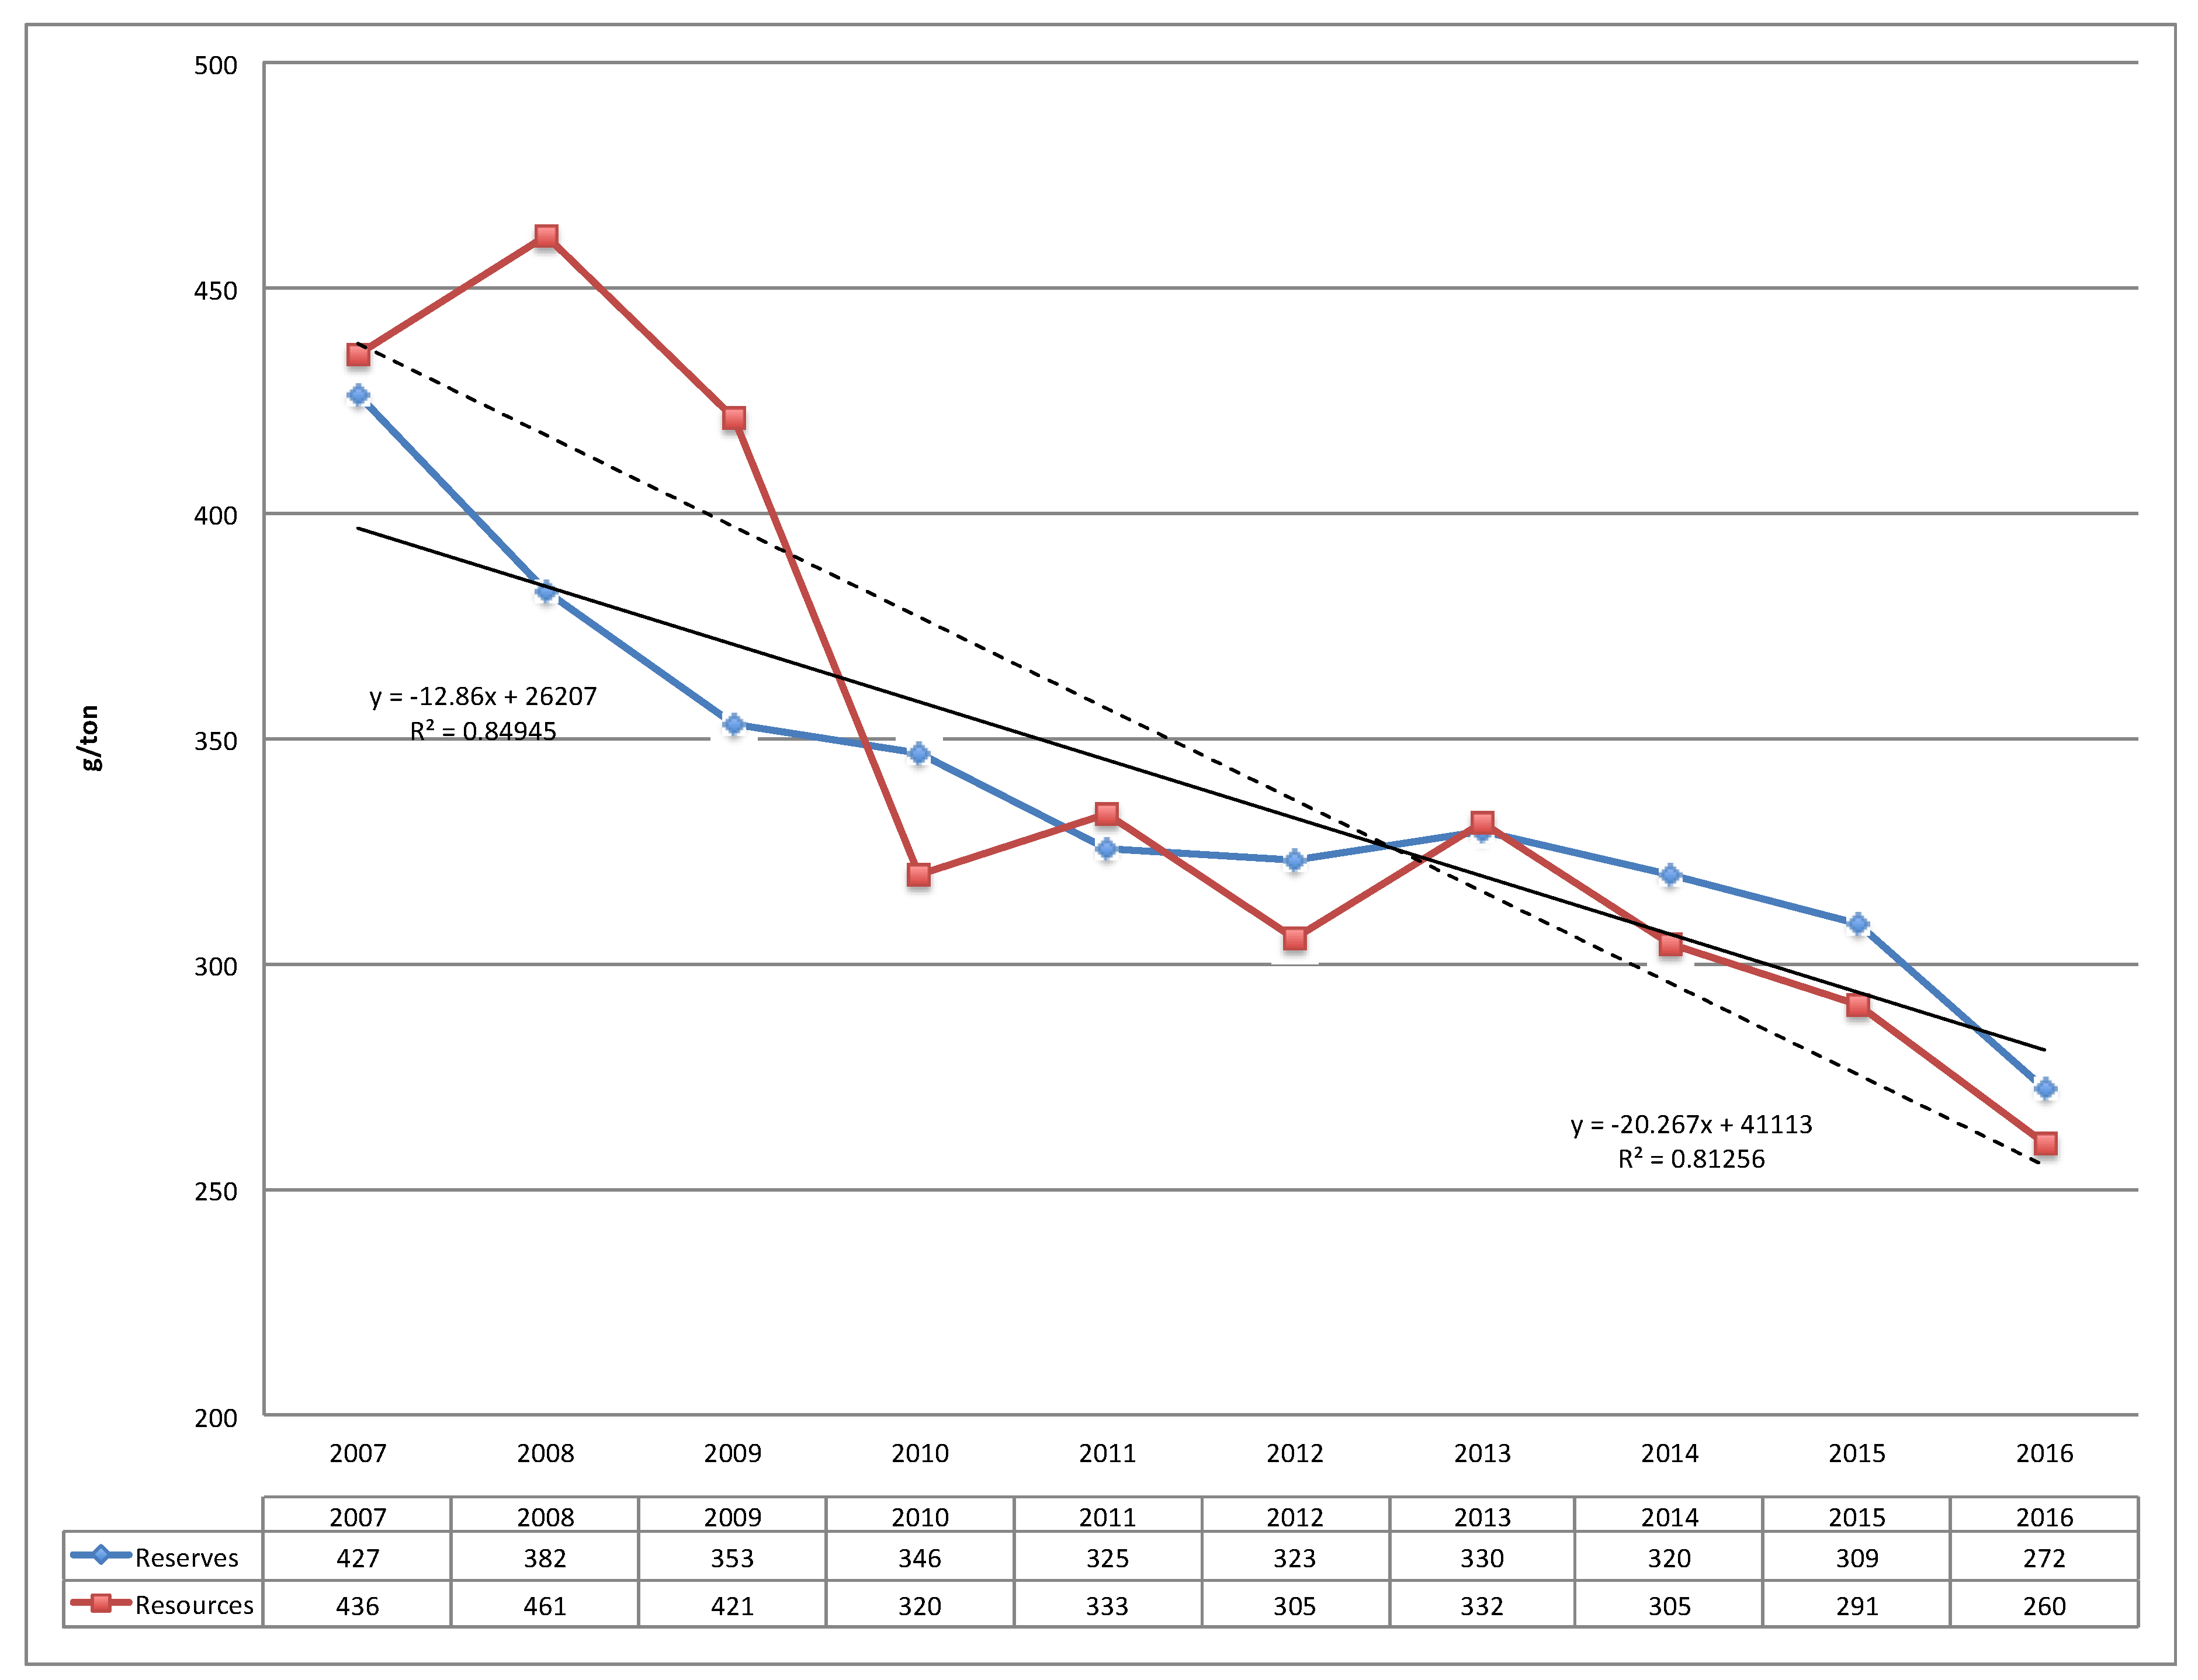
The trend lines of the average ore grades in reserves and resources for the twelve examined mines, as a whole, (Figure 8) show descending tendencies over the decade, although the trend line of values concerning the estimated average silver content of resources (in the chart, the dotted line) is more pronounced than that of reserves (drawn as a continuous line). This circumstance means not only that, since 2010, the average silver content of resources has, quite always, been lower than that of reserves, but also that this value, whose trend line has a significantly lower negative angular coefficient in absolute terms, is progressively decreasing at a faster rate than reserves, as we can see graphically by the different inclinations of the two trend functions (y1 and y2). The adaptation of both these data trend lines is good: in fact, the values of R2 are acceptable.
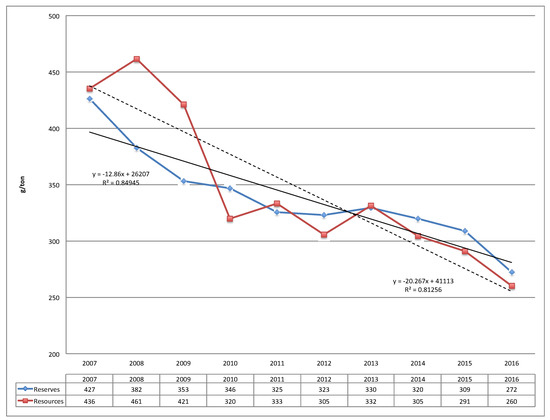
Figure 8.
Average ore grade of silver reserves and resources.
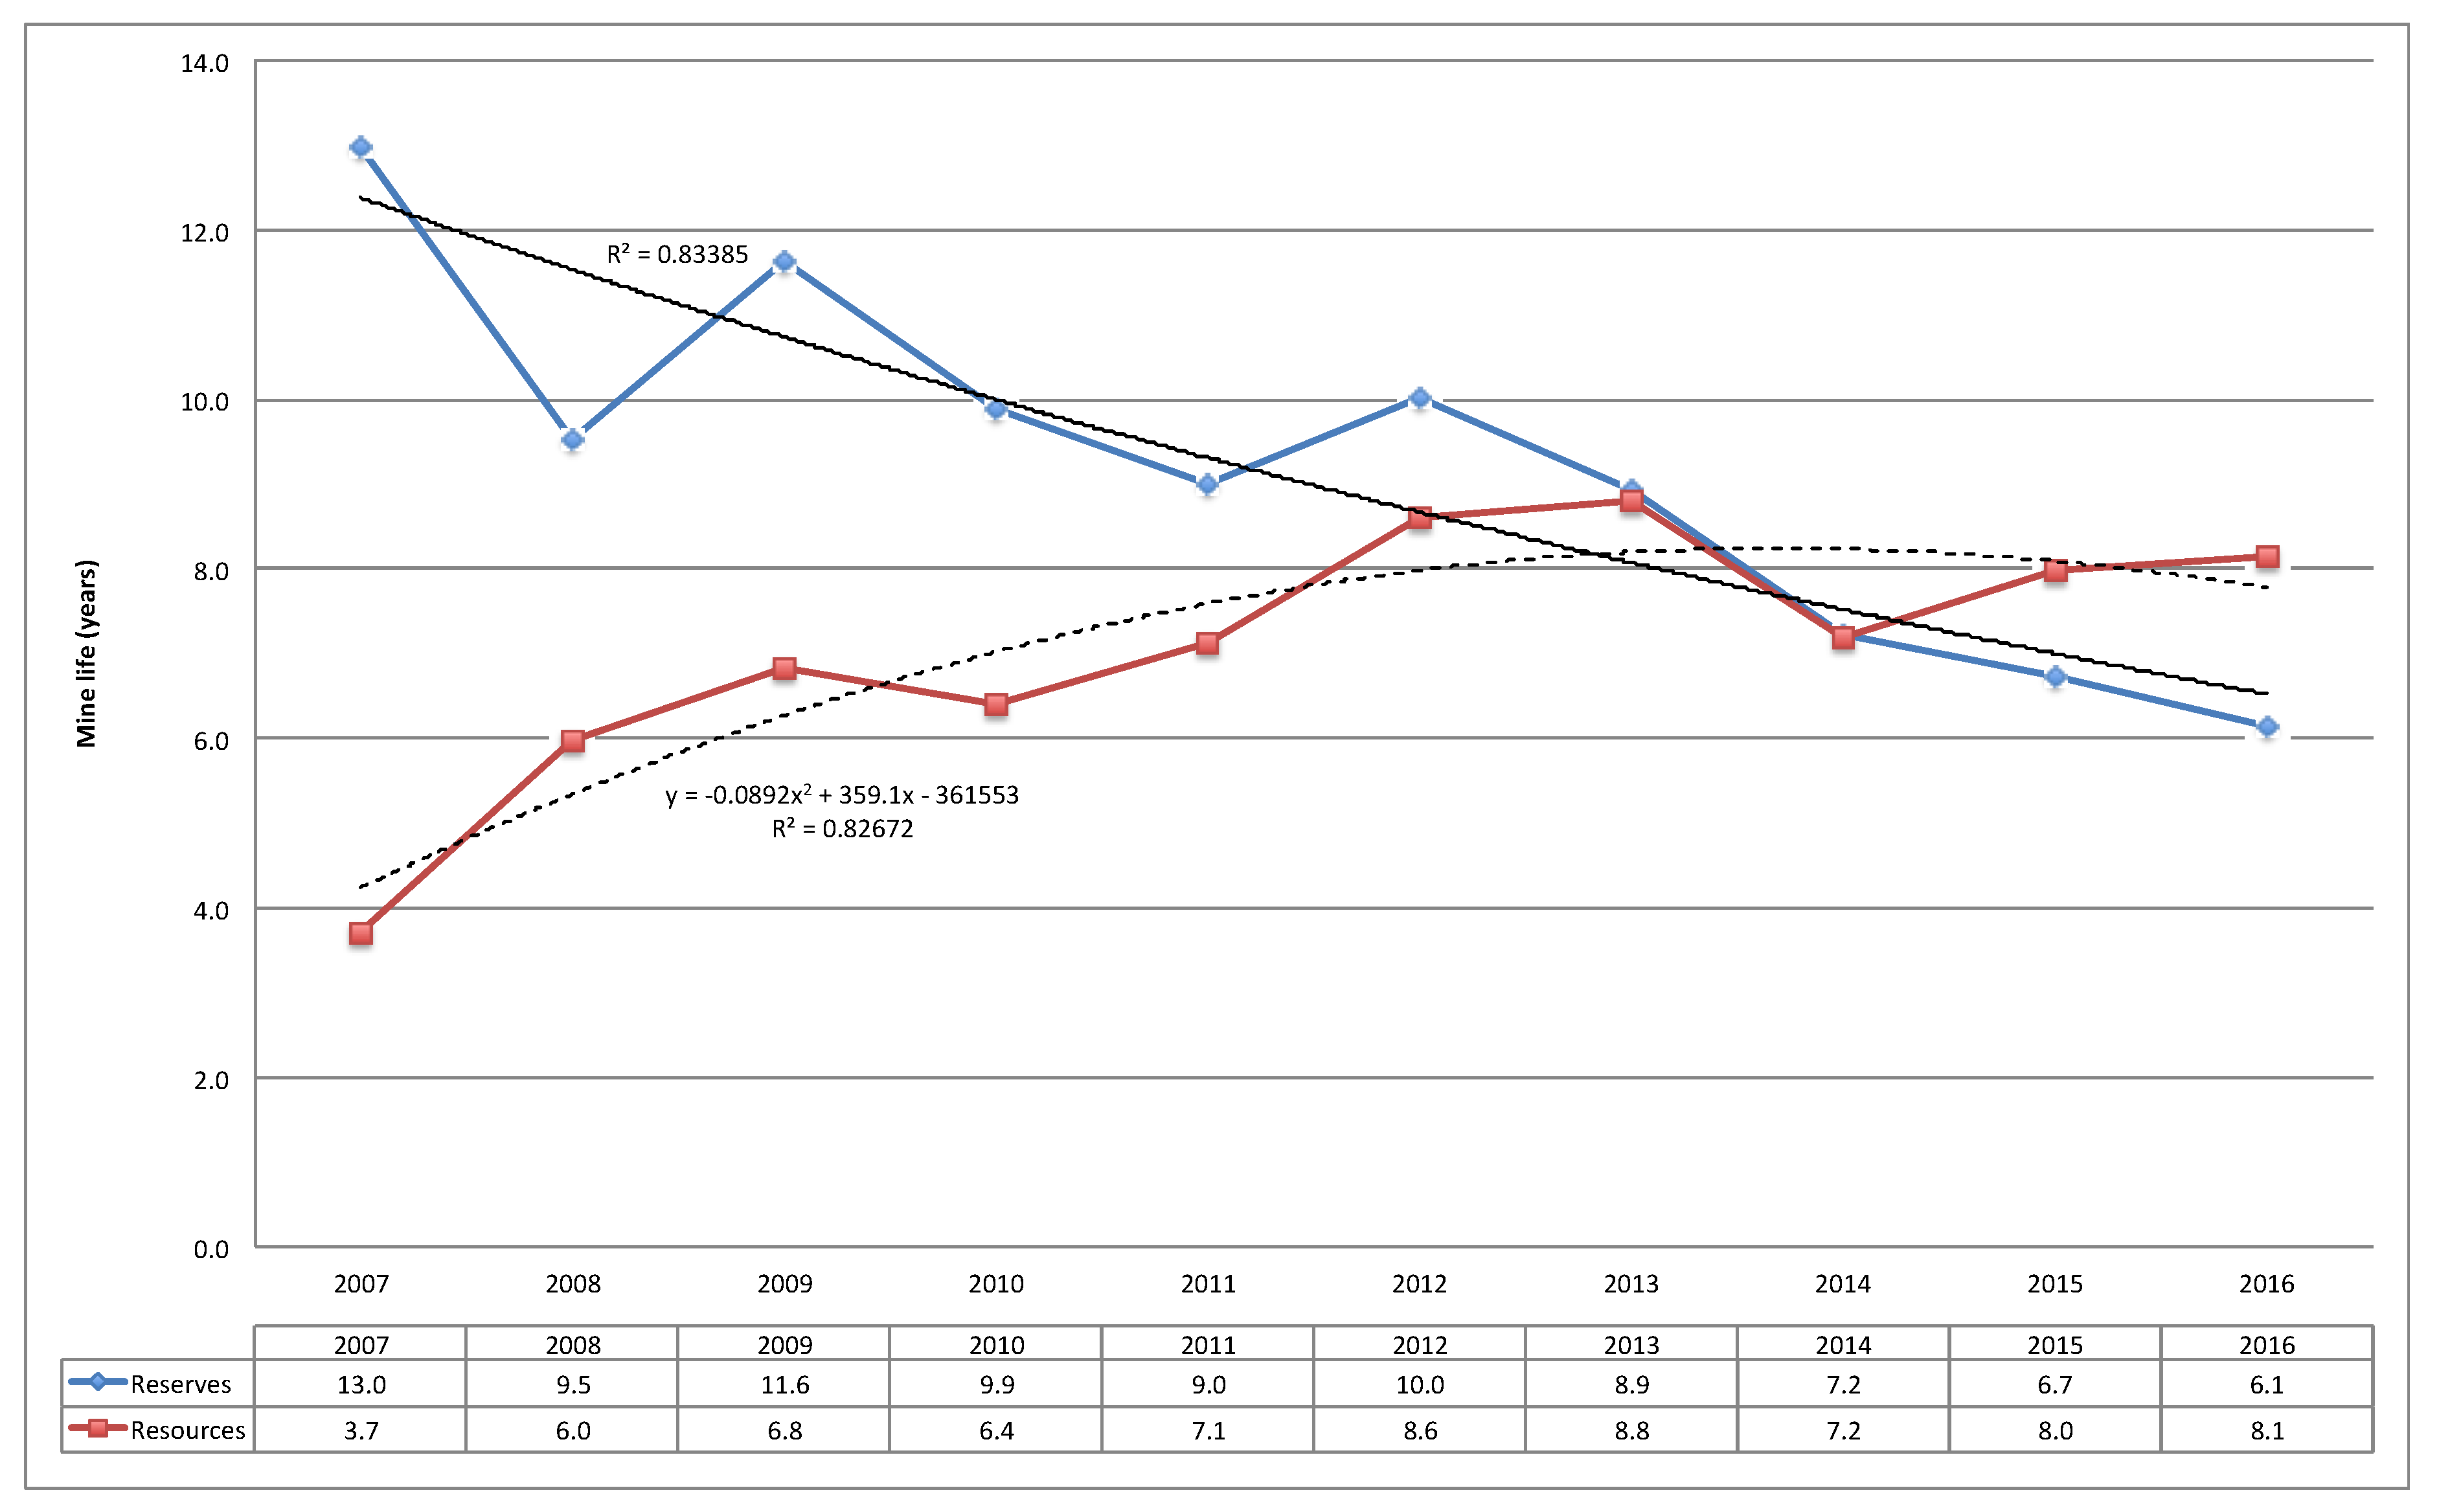
In order to complete the analysis, we have calculated, based on the estimated average amount of reserves (proven and probable), resources (measured and inferred) and the corresponding annual production, the variations of the cumulative average mines residual life or burn-off time, as shown in Figure 9. At this regard, the quantification of this indicator is very approximate, because, as we have already anticipated, we could not have complete and adequate information about the companies’ geological exploration activities of new silver mining fields.
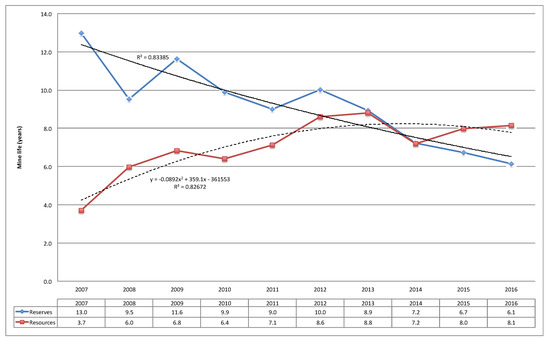
Figure 9.
Silver mine life of reserves (proven and probable) and resources (measured and inferred).
5. Conclusions
This paper is based on the analysis of mining production of a statistical sample consisting of twelve of the world’s top fifteen largest primary silver mining sites. The findings of this study, in short, are that the primary silver contents, in terms of silver ore grade, of these mines have been, gradually and significantly, reduced during the period 2007–2016.
This is confirmed, for most of the decade 2007–2016, by at least two facts: (1) the average silver content of the extracted mineral, from the examined mines, has progressively and significantly decreased, partly counterbalanced by an increase of the efficiency of mining separation technologies and the corresponding recovery rates (Figure 3); (2) the historical cumulative decreasing estimated variations of silver ore grade of resources and reserves (Figure 8).
Very likely, in order to maintain an equivalent silver production and compensate for the more and more lower average silver grades, the companies have optimized the milling capacity of their separation plants, producing also less waste, as we have seen in Figure 3. This situation could probably imply, in the next years, an increase of extraction costs for these twelve analyzed mining sites.
Summary Points
- Silver is one of the rarest metals in nature and one of the most important for many hi-tech applications.
- Investigating the production of primary silver gives to us a good idea of the past and, possibly, future availability of this metal in those primary deposits that virtually have the highest silver ore grades on the earth.
- Until now, no scientific publication has yet been issued to investigate these topics.
- This paper is based on the analysis of primary silver mining statistics of a highly significant sample consisting of twelve of the world’s top fifteen largest primary silver mining sites.
- The findings of our study are that the primary silver mining grade of these twelve big production sites has, gradually and significantly, decreased.
Future Issues
- What is the whole situation about silver reserves and ore grade of the world mines?
- What are the real mining extraction costs of silver?
- Is it true that many mining companies are in economic losses situations?
- What are the historical variations in the extraction costs of the largest silver mines in the world?
Author Contributions
Contribution is to be attributed to the authors in equal parts.
Funding
This research received no external funding.
Acknowledgments
The authors thank the reviewers and Traci Michelle Ricciardo for the extensive English revisions.
Conflicts of Interest
The authors declare no conflicts of interest and no financial and personal relationships with other people and organizations that could inappropriately influence (bias) their work.
Glossary of Some Technical Terms
| Oz | one troy ounce, equivalent to 31.1035 g; Moz is million ounce; |
| t | tonne (metric ton), equal to 1.1023 short tons, or 2205 pounds; |
| t/d | metric tonnes per day; |
| g/t Ag | grams of silver per tonne of rock; |
| Ore grade | the percentage of silver contained in the extracted mineral; |
| Average yield (in oz/t) | the percentage of silver that is actually produced from the extracted material, due to the specific mining technology of a site. |
References
- Gsodam, P.; Lassnig, M.; Kreuzeder, A.; Mrotzek, M. The Austrian silver cycle: A material flow analysis. Resour. Conserv. Recycl. 2014, 88, 76–84. [Google Scholar] [CrossRef]
- Butterman, W.C.; Hilliard, H.E. Silver. USGS (U.S. Geological Survey); Open-File Report 2004–1251; 2005; Reston (Virginia). Available online: https://pubs.usgs.gov/of/2004/1251/2004-1251.pdf (accessed on 8 March 2018).
- Grandell, L.; Lehtila, A.; Kivinen, M.; Koljonen, T.; Kihlman, S.; Lauri, L.S. Role of critical metals in the future markets of clean energy technologies. Renew. Energ. 2016, 95, 53–62. [Google Scholar] [CrossRef]
- The Silver Institute. World Silver Survey. 2017. Available online: https://www.silverinstitute.org/site/publications/World_Silver_Survey_2017.pdf (accessed on 22 February 2018).
- Sverdrup, H.; Ragnarsdottir, K.V.; Koca, D. Investigating the sustainability of the global silver supply, reserves, stocks in society and market price using different approaches. Resour. Conserv. Recycl. 2014, 83, 121–140. [Google Scholar] [CrossRef]
- The Silver Institute. World Silver Survey. 2016. Available online: https://www.silverinstitute.org/site/publications/World_Silver_Survey_2016.pdf (accessed on 16 February 2018).
- Fresnillo plc. What We Do. Available online: http://www.fresnilloplc.com/what-we-do/mines-in-operation/fresnillo/ (accessed on 22 January 2018).
- Laznicka, P. Giant metallic deposits—A century of progress. Ore Geol. Rev. 2014, 62, 259–314. [Google Scholar] [CrossRef]
- Fresnillo plc. Production Reports. Available online: http://www.fresnilloplc.com/investor-relations/reports-and-presentations/?year=2017 (accessed on 19 February 2018).
- Fresnillo plc. Reports and Presentations. Available online: http://www.fresnilloplc.com/investor-relations/reports-and-presentations/ (accessed on 19 February 2018).
- Polymetal International plc. Annual Reports & Accounts. Available online: http://www.polymetal-international.com/ investors-and-media/annual-reports.aspx?sc_lang=en (accessed on 22 February 2018).
- South32 Ltd. Annual Reports. Available online: https://www.south32.net/investors-media/reports-and-presentations (accessed on 25 February 2018).
- BHP Billiton plc. Annual Reports. Available online: http://www.bhp.com/media-and-insights/reports-and-presenta-tions (accessed on 8 February 2018).
- BHP Billiton plc. Quarterly Production Reports—June. Available online: http://www.bhp.com/media-and-insights/ reports-and-presentations (accessed on 22 February 2018).
- St. Angelo, S. The Silver Chart Report. SRSrocco Report, 2015. Available online: https://srsroccoreport.com/the- silver-chart-report (accessed on 22 February 2018).
- Compañía de Minas Buenaventura S.A.A. Annual Reports. Available online: http://www.buenaventura.com/annual_reports (accessed on 10 February 2018).
- Silver Standard Resources Mining Inc. Silver Standard Reports—Fourth Quarter and Year-End Results. Available online: http://ir.ssrmining.com/investors/investor-kit-download-library/default.aspx (accessed on 22 February 2018).
- Hecla Mining Company. Greens Creek. Available online: http://www.hecla-mining.com/greens-creek/ (accessed on 18 February 2018).
- Hecla Mining Company. Annual Reports. Available online: http://ir.hecla-mining.com/CustomPage/Index?KeyGenPage=315096 (accessed on 5 February 2018).
- Hochschild Mining plc. San Jose—Argentina. Available online: http://www.hochschildmining.com/en/our_operations/current_operations/argentina/san_jose (accessed on 11 February 2018).
- Hochschild Mining plc. Arcata—Peru. Available online: http://www.hochschildmining.com/en/our_operations/current_operations/peru/arcata (accessed on 18 February 2018).
- Hochschild Mining plc. Annual Reports & Accounts. Available online: http://www.hocplc.com/en/investors/results (accessed on 22 February 2018).
- Hochschild Mining plc. Preliminary Results for the Twelve Months Ended 31 December 2016. Available online: http://www.hocplc.com/en/investors/results/financial?year=2017 (accessed on 5 February 2018).
- McEwen Mining Inc. Annual Report. Available online: http://www.mcewenmining.com/Operations/Reserves-and-Resources/default.aspx (accessed on 2 February 2018).
- Coeur Mining Inc. San Bartolomé, Bolivia. Available online: http://www.coeur.com/mines-projects/mines/san-bartolomé-bolivia#.WP-GlhQ1WEY (accessed on 5 February 2018).
- Coeur Mining Inc. Palmarejo, Mexico. Available online: http://www.coeur.com/mines-projects/mines/palmarejo-mexico#.WP-KDRQ1WEY (accessed on 7 February 2018).
- Coeur Mining Inc. Annual Reports. Available online: http://investors.coeur.com/GenPage.aspx?IID=4349317&GKP=1073749603 (accessed on 18 February 2018).
- Coeur Mining Inc. News Release. Available online: http://investors.coeur.com/news.aspx?IID=4349317&Year=2017&mode=0 (accessed on 8 February 2018).
- Pan American Silver Corp. La Colorada—Highlights. Available online: https://www.panamericansilver.com/operations-projects/mexico/la-colorada (accessed on 11 February 2018).
- Pan American Silver Corp. Annual Reports. Available online: https://www.panamericansilver.com/investors/reports/ annual-reports (accessed on 22 February 2018).
- JORC. Australasian Code for Reporting of Exploration Results, Mineral Resources and Ore Reserves—The JORC Code—2012 Edition. Available online: http://www.jorc.org/docs/JORC_code_2012.pdf (accessed on 22 March 2018).
- Krzemień, A.; Riesgo Fernández, P.; Suárez Sánchez, A.; Álvarez, I.D. Beyond the pan-european standard for reporting of exploration results, mineral resources and reserves. Resour. Policy 2016, 49, 81–91. [Google Scholar] [CrossRef]
- Njowa, G.; Clay, A.N.; C. Musingwini, C. A perspective on global harmonisation of major national mineral asset valuation codes. Resour. Policy 2014, 39, 1–14. [Google Scholar] [CrossRef]
- Ragnarsdottir, K.V.; Sverdrup, H.; Koca, D. Assessing long-term sustainability of global supply of natural resources and materials. In Sustainable Development—Energy, Engineering and Technologies—Manufacturing and Environment; Ghenai, C., Ed.; Intech Publishers: London, UK, 2012; ISBN 9789535101659. [Google Scholar]


© 2018 by the authors. Licensee MDPI, Basel, Switzerland. This article is an open access article distributed under the terms and conditions of the Creative Commons Attribution (CC BY) license (http://creativecommons.org/licenses/by/4.0/).