Article

Green City Concept and a Method to Measure Green City Performance over Time Applied to Fifty Cities Globally: Influence of GDP, Population Size and Energy Efficiency

1
Institute for Housing and Urban Development Studies, (IHS), Erasmus University Rotterdam, (EUR), 3062 PA Rotterdam, The Netherlands
2
Institute for Housing and Urban Development Studies, (IHS) and Rotterdam School of Management, Erasmus University Rotterdam, 3062 PA Rotterdam, The Netherlands
*
Author to whom correspondence should be addressed.
Sustainability 2018, 10(6), 2031; https://doi.org/10.3390/su10062031
Submission received: 30 April 2018 / Revised: 31 May 2018 / Accepted: 12 June 2018 / Published: 15 June 2018

Abstract

:
There are many concepts and methods trying to accommodate the growth of cities without impairing sustainability. However, most are too complex, cannot measure green performance over time and fail to deliver actionable advice to decision-makers. The Green City Concept (GCC) is one of the latest of these concepts. This paper introduces a Green City Conceptual Framework (IHS-GCCF) and a harmonized method to measure Global Green City Performance over time (GGCPI). The IHS-GCCF highlights the importance of energy as a steward of resource efficiency and green performance. IHS-GCCF and GGCPI can be used to measure green performance, to explain possible factors influencing the calculated green performances over time, set targets and track achievements. They are adaptable to individual city needs. By applying the method to fifty cities worldwide through desk research, the paper shows that a green city is also sustainable and liveable. It also shows that GDP influences Green City Performances positively, population size influences it negatively and sanitation and air quality sectors influence green city performance the most. The paper addresses a range of gaps in the green city field. It consolidates prior research into one actionable conceptual framework and method.

1. Introduction

The 20th century was characterised by rapid and often uncontrolled urban growth leading to the emergence of huge dispersed or decompacted cities unlike the more compact cities of the 19th century. Fast industrialisation, new technological inventions such as automobiles, and the availability of cheap land and inexpensive fossil fuels were some of the driving forces of this model of urban development [1] (pp. 243–266).
This dispersed urban model was heavily dependent on the automobile and the use of fossil fuels. An extensive build-up of transport and other infrastructures contributed to the deterioration of urban environmental performance in many cities globally through increased city footprints and impermeable surfaces; destruction of urban natural resources and green fields; reduced water quality and quantity; increased journey time, traffic congestion, and fuel consumption; and more [2,3].
The consequences of this car-dependent dispersed city prompted academics and urban managers to search for innovative ways to promote economic and urban growth with less environmental impact and use of natural resources. Several reports, concepts, theories and methods addressing this issue were and are being produced.
In the 1980s, the reports: “The Limits to Growth” introduced the idea of sustainable economic growth [4]; “Our Common Future” demonstrated it was possible to reconcile economic growth, environmental preservation and social development [5]; and the New Urbanism Movement advocated ways to limit dispersed urban expansion of cities by using more environmentally friendly urban design practices such as walkable neighbourhoods, mixed land use and Transit Oriented Developments (TODs) [1] (pp. 243–266).
The theory of sustainability in the 1990s reconciled social equity, economic growth and environmental preservation with city development [6] (pp. 296–312), and opened the way for the development of other concepts such as sustainable city [7], green urbanism [1], liveable city [8,9,10,11], and compact city [12,13] among others, that are still current and are at the centre of the debate on the influence of urban forms, city designs, use of natural resources, energy and other issues linked to urban sustainability.
The incorporation of climate change issues into the international political agenda in the 2000s brought energy [14] and resource efficiency [15] to the centre of the discussion on sustainable development and city sustainability. Discussions on urban forms including energy, resources efficiency and environmental performance became central elements in the search for new concepts and methods to define and measure city sustainability. These latest developments led to the development of the term “green”.
“Green” means different things to different people. The term is nowadays widely used by private and public organisations as a brand for sustainability and eco-friendliness. “Greening” is another term associated to the term green. In this article “green” and “greening” are used synonymously for sustainability and related issues where energy and resource efficiency are central elements.
As a result of the increased attention given to energy, resource efficiency and urban form in relation to climate change, questions already formulated before such as “Are certain urban forms and city designs more sustainable than others in terms of pollution, environmental impact and energy use?”; “What strategies and actions can effectively contribute to make cities more sustainable (greener)?”; and, more recently, “How can we manage the current urban expansion process under the effects of climate change, and at the same time make this process greener?” have regained importance. Although actively being studied up to now there is no critical consensus about the best answers to these questions. Scholars [12,13,16,17,18,19] cited the compact city form as one that could strongly contribute to city sustainability, especially in relation to the impacts of the urban expansion process and the use of energy, resources efficiency, infrastructure and environmental performance related issues. The benefits resulting from the application of this concept cited in the literature can be summarized as: shorter intra-urban travel distances, reduced automobile dependency, increased walking, cycling and use of public transportation, reduced per capita cost of infrastructure provision, influence on the ways cities generate and consume energy, and encouraging the increase of urban density and recycling of already urbanised land.
The Green City Concept is one of the latest responses to the diverse efforts and research conducted to address the problems caused by the dispersed model of city development and to help cities to become more sustainable (greener), less dispersed and more liveable.
Many studies have attempted to define sustainable and green cities [8,20,21,22] and some have tried to develop concepts and translate these into methods and tools such as benchmarks to measure environmental and/or sustainability performance [23,24,25,26,27,28,29,30,31]. Others have proposed reference guides and frameworks to help prioritize problems and propose city level actions to improve sustainability and environmental performance by using and analysing indicators and policy instruments [28,32,33].
In general, the various definitions and some of the concepts proposed for green cities address issues related to the three pillars of sustainability theory and a variety of other issues such as health, greenery, resilience and equity. Environment related issues are by far the most often presented in green city definitions, concepts and methods [23,24,25,26,27]. The EBRD [26], for example, defines a green city as one that is characterized predominantly by its environmental performance, with the intention of maximising social and economic benefits. This definition is used to prepare a methodology for benchmarking and prioritisation using seventy core indicators and several elective indicators chosen according to a Green City Pressure–State–Response (PSR) framework. The Economist Intelligence Unit [20] does not propose a definition of a green city but has developed a benchmark method to measure environmental performance of cities per continent using a group of thirty qualitative and quantitative indicators focused mostly on infrastructure and environmental issues. Zoeteman et al. [25], uses 87 indicators to investigate (causes of) differences in sustainability performance between EU cities using the three sustainability domains of economy, ecology and socio-cultural aspects. On the other hand, the ADB Green City Development Toolkit [32] and Solutions for Liveable Cities [33] are reference guides for ADB staff, consultants, and city leaders introducing key concepts of green city development and outlining a three-step city assessment framework together with a summary of existing tools and resources for green, liveable and sustainable development.
The existence of a broad range of environmental and other urban related issues within a city has resulted in the development of many green city definitions and approaches as briefly mentioned above which has created difficulties for its acceptability and adoption. While some focus only on the environmental aspects, others include socio-economic, environmental and infrastructure elements and others include policies, resilience, ICT technologies and plans such as disaster risk plans, etc. The indexes proposed to measure environmental and/or sustainability performance in general use a large number of indicators which makes them difficult for decisions makers to use and some mix qualitative with quantitative indicators. Many indicators proposed in some of these methods are not regularly tracked by many cities, especially those of developing countries. This lack of uniformity of concepts and approaches to green cities has resulted in a great heterogeneity of methods and indicators for the measurement of environmental and sustainability performance.
The above brief overview of the literature has shown that very different approaches and methods have being developed in relation to green city issues resulting in difficulty in forging a consensus on how and which methods and measures cities should be applied to become greener. In addition, there are still many gaps found in this research that need to be studied, such as the lack of a definition of green city rooted in a simple green city conceptual framework, the development of index methods containing a short number of indicators to measure environmental performance rooted in a conceptual framework, and simple methods to track the evolution and progress of cities’ environmental performance over time. The review of the literature also showed that there is a need for more in-depth research on how population size and GDP influence environmental performance, especially of cities of developing countries with large populations [26,34,35]. No study proposing a method to measure green city performance was found in this review.

Scope of the Paper, Methodological Issues and Objectives

In 2013, due to the growing interest in the subject of green cities, the Infrastructure Group (Today called the Green City and Infrastructure Group.) at the Institute for Housing and Urban Studies (IHS (EUR)) conducted an in-depth literature review on green city issues to gather more knowledge on this field and explore future academic and practical applications. The result of this work led us to use our own knowledge and expertise on urban management, environment, infrastructure, climate change, housing and energy to develop an initial simple green city concept and a tool to be incorporated in our academic activities and to complement our advisory work on supporting cities to become greener. The green city concept was developed by incorporating key findings of the literature, such as elements of the three pillars of the theory of sustainability, and of other concepts including issues such as energy, infrastructure, land planning, greenery and compactness mentioned in the literature review above.
The green city concept is a simple umbrella framework attempting to facilitate the understanding of what a green city is. The conceptual framework called IHS-GCCF is composed of four entry points, seven thematic areas and several promoters. Energy efficiency is the main entry point and also a distinctive characteristic of this concept related to the existing green city concepts. It is assumed in this concept that the overall promotion of energy efficiency in all cities’ activities will help to steward the improvement of city resource efficiency which will ultimately contribute to improving the city’s environmental performance, sustainability and liveability. Within the IHS Green City and Infrastructure Group, it is claimed that a green city, as defined in this framework, is also sustainable and liveable.
The tool called the IHS Green City Index (IHS-GCI) is rooted in the IHS-GCCF and was developed by adapting to our needs the approach proposed in [23]. It allows us to measure and compare the EP of cities on the same continent over time and contains a small number of quantitative indicators representing key elements of the thematic areas of a developed green city concept.
After being implemented and applied as academic exercises to more than 20 cities from five continents in our Master’s and the Green City for Eco-efficiency Executive Courses, we decided, at the end of 2016, to conduct another literature review on the green city to incorporate some valuable comments received from the evaluations of our programmes, some new developments in the fields of green cities, energy, liveability and sustainability. This would allow us to re-develop the IHS-Green City Index (IHS-GCI) and use the experience gained with the application of the IHS-GCI tool to create a new tool called IHS Global Green City Performance Index (IHS-GGCPI) which is able to measure green city performance over time globally. In this article, the IHS Global Green City Performance Index (IHS-GGCPI) is sometimes referred to as index method, index or just method and fills an important gap in the literature which is the absence of a tool to measure green city performance.
In this article, green city performance (GCP) is also called green performance (GP) and is defined as the sum of the environmental and the socio-economic performances. This definition follows the approach used to build our green city concept framework which incorporated key elements of the pillars of the theory of sustainability and is supported by the fact that some authors [22,26,32] also include the sustainability domains in their own definitions of green cities.
The (IHS-GGCPI) index is rooted in the IHS-GCCF and was developed by adapting to our needs the approach proposed in [20] and the proposed definition of GP. The index allows us to measure green performance over time but this article only provides a description of how the method can be used to measure GP over time. The GPs shown in this article as a result of the application of the index refer to data collected in the period 2013–2016, a single snapshot which can be used as a base line to calculate the GP for future periods.
The objectives of this article were formulated taking into account some of the literature gaps previously mentioned in this article and are divided into three parts: introduction of the re-developed IHS Green City Conceptual Framework and the IHS Global Green City Performance Index method (IHS-GGCPI; application of the new index method to measure the Green City Performance (GCP) of fifty cities globally and to study the influence of the population size, GDP, energy and key urban sectors in these GCPs; to verify the claim that a green city as defined in our green city conceptual framework is also a sustainable and liveable city.

2. Materials and Methods

The research adopted a deductive approach, building on the state of the art literature on green city and the authors’ knowledge and experience with the environment, infrastructure, sustainability and green city. One key finding in the literature leading to the development of the IHS-GCCF was the presence of some elements of the three pillars of the theory of sustainability in several green city definitions [1,6,7,26]. In addition, it was found that concepts such as compact cities, greenery, energy efficiency, renewable energy, greenery and green growth [8,9,10,11,12,13,14,15,16,17,18,19] have grown in importance in recent years. The inclusion of elements of the three pillars of sustainability and other issues mentioned above formed the basis for the development of the IHS-GCF and of the IHS-GGCPI. The approach used by the Economist Intelligence Unit [23] to calculate the environmental performance of cities was adapted to our needs to develop the IHS-GGCPI.
A desk study strategy was used for the revision of the green city concept, the redevelopment of the index and to answer the other objectives of the paper.

2.1. Development of the IHS-GGCPI Method: Steps and Procedures

The re-develop the IHS-Green City Conceptual Framework (IHS GCCF) displayed in Figure 1 the IHS-GGCPI method index was enhanced by using the key findings in the literature on green cities as well as using the authors’ own experience with green issues.
The steps and the procedures adopted to develop the IHS-GGCPI method are described below. They are slight adaptation of the procedures used to create the previous IHS-GCI:
Step 1: Selection of indicator for the IHS-GCGPI and assigning weights to the indicators
The re-developed IHS green city conceptual framework (Figure 1, Item 3.1 (results)) was used as the base to choose the indicators to compose the new method. These indicators were selected taking into account key aspects of the green conceptual framework and the following criteria: the indicators should represent elements of the green city concept shown in Figure 1. The index should contain a maximum of 30 quantitative indicators representing aspects of the three pillars of sustainability (social, economic and environment) and linked to the elements of the newly re-developed IHS-GCCF. The selected indicators needed to be regularly monitored in cities globally and the data to be collected for these indicators should be published in any official local, national or international institution during the period 2013–2016.

2.1.1. Initial Selection of the Indicators and Pilot Test

Using the above criteria, an initial set of 32 indicators were selected and pilot tested on ten cities (two per continent). These indicators were tested to assess the availability of data, if they were regularly tracked and if the definition used matched the definition we have adopted. The criteria used to select the ten cities for the pilot test were: cities with high economic importance and high income for the country, well recognised high environmental quality, with a large and medium population and finally cities that regularly use indicators to monitor and make available data on its socio-economic and environmental situation.
The pilot test was conducted in two rounds of five cities: Johannesburg, Shanghai, Buenos Aires, Berlin and Mexico City; and Lagos, Delhi, New York, Sao Paulo and London. After each round, an assessment of the initial proposed list of indicators was conducted in relation to the defined criteria.
As a result of the first round, some indicators were dropped and definitions were adapted. The dropped indicators included the ones proposed to measure governance, the level of education, urban agriculture, water quality, energy intensity and CO2 equivalent per capita for electricity consumption. The first four indicators were dropped because it was hard to find one single indicator representing these areas and a uniform description for the indicator. The other two were dropped because of the lack of regular data measurements and inconsistent definitions. The ICT indicator definition was changed from the number of mobile telephones in a city to internet penetration regardless of the access method, and mass transport was redefined to include only heavy rail metro, subway systems and commuter rail systems for whose lengths records usually exist.
The assessment conducted in the ten cities included in the first and in the second rounds showed that for three indicators, share of wastewater treated, share of solid wastes collected and population living in slums some rich cities have ceased to regularly track them. These cities however usually have laws requiring them to comply with high standards in issues related to these indicators. Once these indicators represent important aspects of our green city concept and are also important to measure green city performance of cities of developed and developing countries, the following assumptions were made for the rich cites that have ceased to regularly track them: share of wastewater treated higher than 97%, solid waste collected higher than 95% and populations living in slums less than 0.3%. These numbers are within the range of the top score (5) of the IHS-GGCPI and means that cities with data for these indicators, within these ranges, are among the top twenty percent cities with the highest GPs. Another reason to propose these numbers is the fact that in practice cities do not treat or collect 100% of their wastewater or solid waste and some residual precarious residences still exist in these cities. An explanation of the construction of the scoring system and the ranges is presented in Step 2.

2.1.2. Final Retained List of Indicators and Assigned Weights (Wav)

After the assessment of the pilot test, twenty-five indicators distributed across eight sectors and divided into two groups were selected. Table 1 presents the final list of indicators per group and sectors with respective units and definitions. The administrative area, although included in the list of the indicators, was not used to calculate the city green performance. Its role was to define the geographical (surface) area of the cities where the data were collected.

2.1.3. Assigning Weights to the Selected Indicators (Wav)

After selecting the final list of the indicators, a weight was assigned to each indicator. The procedure adopted was: distribution of the final list of the indicators divided into eight sectors (Table 1) to ten IHS academic staff (including the two authors) familiar with the objectives and with the IHS-Green City Conceptual Framework. Each staff member was asked to weigh the indicators to a maximum of 100% for each sector according to their importance to the IHS-GCCF. After the weights were assigned the average weight (Wav) was calculated and later used to calculate the green performance of each indicator. The weights represent the importance that different stakeholders and experts give to the indicators of the tool in line with our conceptual framework; therefore, we decided to involve a group of experts in the process of assigning weights to incorporate a greater diversity of importance, and not to restrict the importance attributed by the two authors. The weights shown in Table 1 are the average of the weights given by the ten experts including the two authors.
Step 2: IHS-scoring system
The scoring system for the global index was created using the total new data collected for the twenty-five indicators of the fifty studied cities. The total collected data were normalised using a range of 1–5. The scores were classified as 1 point (signifying well below average), 2 points (below average), 3 points (average), 4 points (above average) and 5 points (well above average). This normalisation procedure was made to allow the different data values to be comparable and to construct aggregate scores for each city. The score in the index represents the rank of the fifty cities examined on a quintile based comparison. A city that has a score of 1 is in the bottom 20% of all cities, a score of 2 implies the city is between the bottom 20% and 40% of all cities and so on. A city with a score of five, means that it is better than 80% of cities.
Step 3: Calculating and explaining Green City Performance over time
To better understand the procedures involved in calculating the GCP of the indicators, sectors and cities and explain any change (increase, reduction or no change) in GCPs calculated in the studied period, we have prepared an excel spreadsheet (matrix) as shown in Table 2 that guides the users in this process.

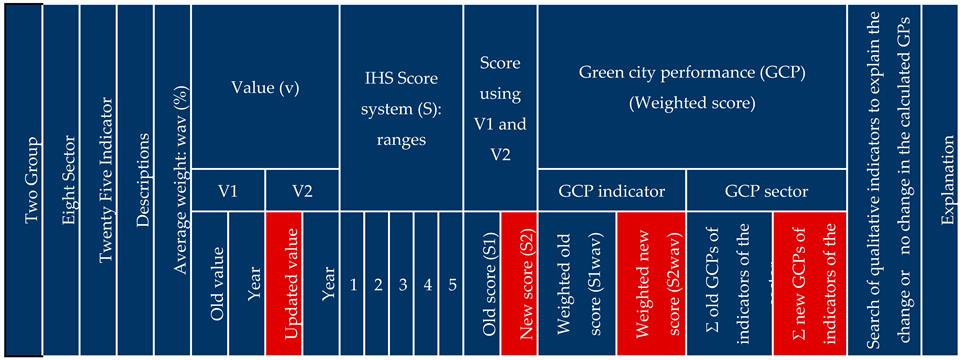
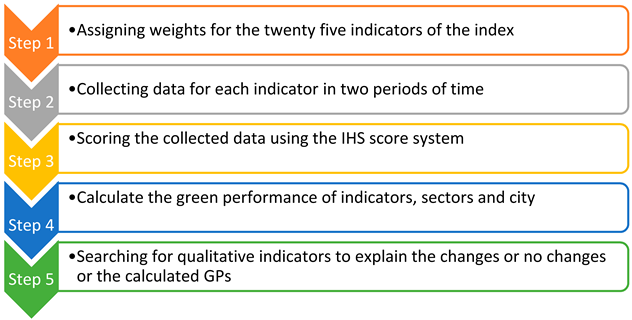
2.1.4. Explanation on how to use Table 2 to calculate Green City Performance

  • In the column with title Sector, and column with title Indicator, the user(s) will find the names of the sectors and the indicators per sector with their respective definition.
  • In the column with title Average weight (Wav), the user(s) will find the average value assigned by the IHS staff to each indicator (see description of assigning weights in the Step 2 above). In the previous IHS-GCI, the users (students) needed to assign weights following a given set of instructions and later calculate the average weight of each indicator to be used in the next steps.
  • In the column with title V1 and named Old value, the user(s) will copy and put in this column the values of the data for each indicator collected by IHS in the period 2013 to 2016. In the next column titled Year, it should be indicated the year and the source of the data.
  • In the column with title V2 and named Updated value, the user(s) need to search for each of the twenty-five indicators new updated data using internet and other sources and fill in this column. In the next column titled Year it should be indicated the year and source of each updated data.
  • Using the IHS score system of Table 2, the user(s) needs to score the data of the indicator V1 and put the result in column titled S1. Repeat the same procedure for the V2 and put the result in column titled S2. The scoring procedure refers to score the value of the old and updated data to one value of the range 1–5 where 1 represents Well below average (1 point) and 5 Well above average (5 points); see Step 2 of the method.
  • The next procedures refer to the calculation of the old and updated GCPs. The GCP of the indicators is called weighted score (weight times the score). These values are put in the column titles: Weighted old score (S1wav) and Weighted new score (S2wav). The GCP of a sector is calculated by adding the weighted score for all indicators of the sector: columns titles Σ old GCPs of indicators of the sector and Σ new GCPs of indicators of the sector. Finally, the total GCP of the city for the two studied periods are calculated as the Σ old GCPs of all sectors for the period 1 and the Σ new GCPs of all sectors for period 2.
  • Explaining any changes in GCP over time in columns titled Qualitative indicators and Explanation. In the first column, the user(s) need for the studied period and per sector search on the Internet and in other sources for qualitative indicators, such as policies, plans, programmes, projects, awareness campaigns, etc., related to any indicator(s) of the sector and implemented by the studied city during the studied period. In the column titled Explanation, the user(s) should provide a short discussion using the identified qualitative indicators and if necessary other relevant information, such as for example factors related to socio, economic, migration, political changes, governance, etc., to try to explain any changes (increase, reduction or no change) in the calculated GCP over time.

2.2. Assessing the Claim that a Green City Is also a Sustainable and Liveable City: Procedures

Two different procedures were developed to assess the above claim: one to measure the claim that a green city is also a sustainable city and the other that a green city is also a liveable city.
Two approaches were developed to investigate if a green city as defined in our GCCF is also a sustainable city: the first approach consisted in conducting an in-depth literature review of the concepts of sustainability, compact city, sustainable city, liveable city and green city to build and revise the green city concept as presented and discussed in the Introduction; and the second approach consisted in calculating correlations between the total green city performance calculated using the GGCPI method with the green performance of the socio-economic group and with the green performance of the environmental group of this method and, finally, calculating the correlation between the green performances of the socio-economic group with the green performance of the environmental group.
The procedures developed to investigate if a green city as defined in our GCCF is also a liveable city used the calculation of correlations between the total green city performance measured using the GGCPI and the total liveability performance calculated using the new developed liveable performance index described below:
The approaches used to develop the IHS-Liveability performance index followed more less the same approaches and the steps used to build up the IHS-GGCPI. These approaches and steps are described below.

2.2.1. Selection of Liveability Indicators

Several articles have shown that the liveability concept is linked to the concept of sustainability [8,9]. Other authors [10,11] emphasized that, although the liveability concept contains diverse elements of the concept of sustainability, it is particularly focused on special characteristics of the place where people currently live, such as the quality of life, health, safety, accessibility and well-being of the local communities.
From the mentioned papers, we selected twenty indicators used or mentioned by the above cited authors to measure liveability, and compared these selected indicators with the indicators of the IHS-GGCPI in Table 1. Fourteen indicators of the liveability list matched the indicators of the GGCPI. These indicators were selected to form the liveability performance index, as shown in Table 3.

2.2.2. Assigning Weights for the Liveability Indicators

The fourteen indicators selected to form the liveability index were distributed to five IHS staff familiar with the liveable city concept and asked to assign weights to these indicators to a maximum of 100%. The average weights were calculated as shown in Table 3 and used to calculate later the liveability performance.

2.2.3. Calculating the Liveability Performance

The same score systems developed for the IHS-GGCPI method were used to score the indicators selected to measure liveability. This approach is justified because the liveability indicators are also indicators of the IHS-GGCPI.
The liveability performance of each indicator is the weighted score of each indicator. The weight used in this calculation is the average weight assigned to each liveability indicator shown in Table 3. The total liveability performance of a city is the sum of the liveability performances of the fourteen indicators.

2.3. Data Analysis

The data collected for the fifty cities were processed using Microsoft Excel statistical analysis tool. A Pearson correlation was used to identify possible influence of key indicators and sectors on the green city performances. The confidence interval was kept at 95% with a level of confidence of 0.05.
The ranking of Green City Performance was prepared by calculating the GCPs of the fifty cities using the new developed index method (IHS-GCCPI). These results were arranged in a descendent order (top to down) green performance.
To help the analysis of the calculated green performances, three clusters of GCPs were formed: high, middle and low GCP. The approach used to form these clusters consisted of dividing the fifty cities into groups with approximately the same number of cities. The results of these clusters were further analysed in relation to the green performances of the sectors and key indicators such as sanitation, population size, GDP per capita, energy, air quality and others.

3. Results and Discussion

3.1. Results

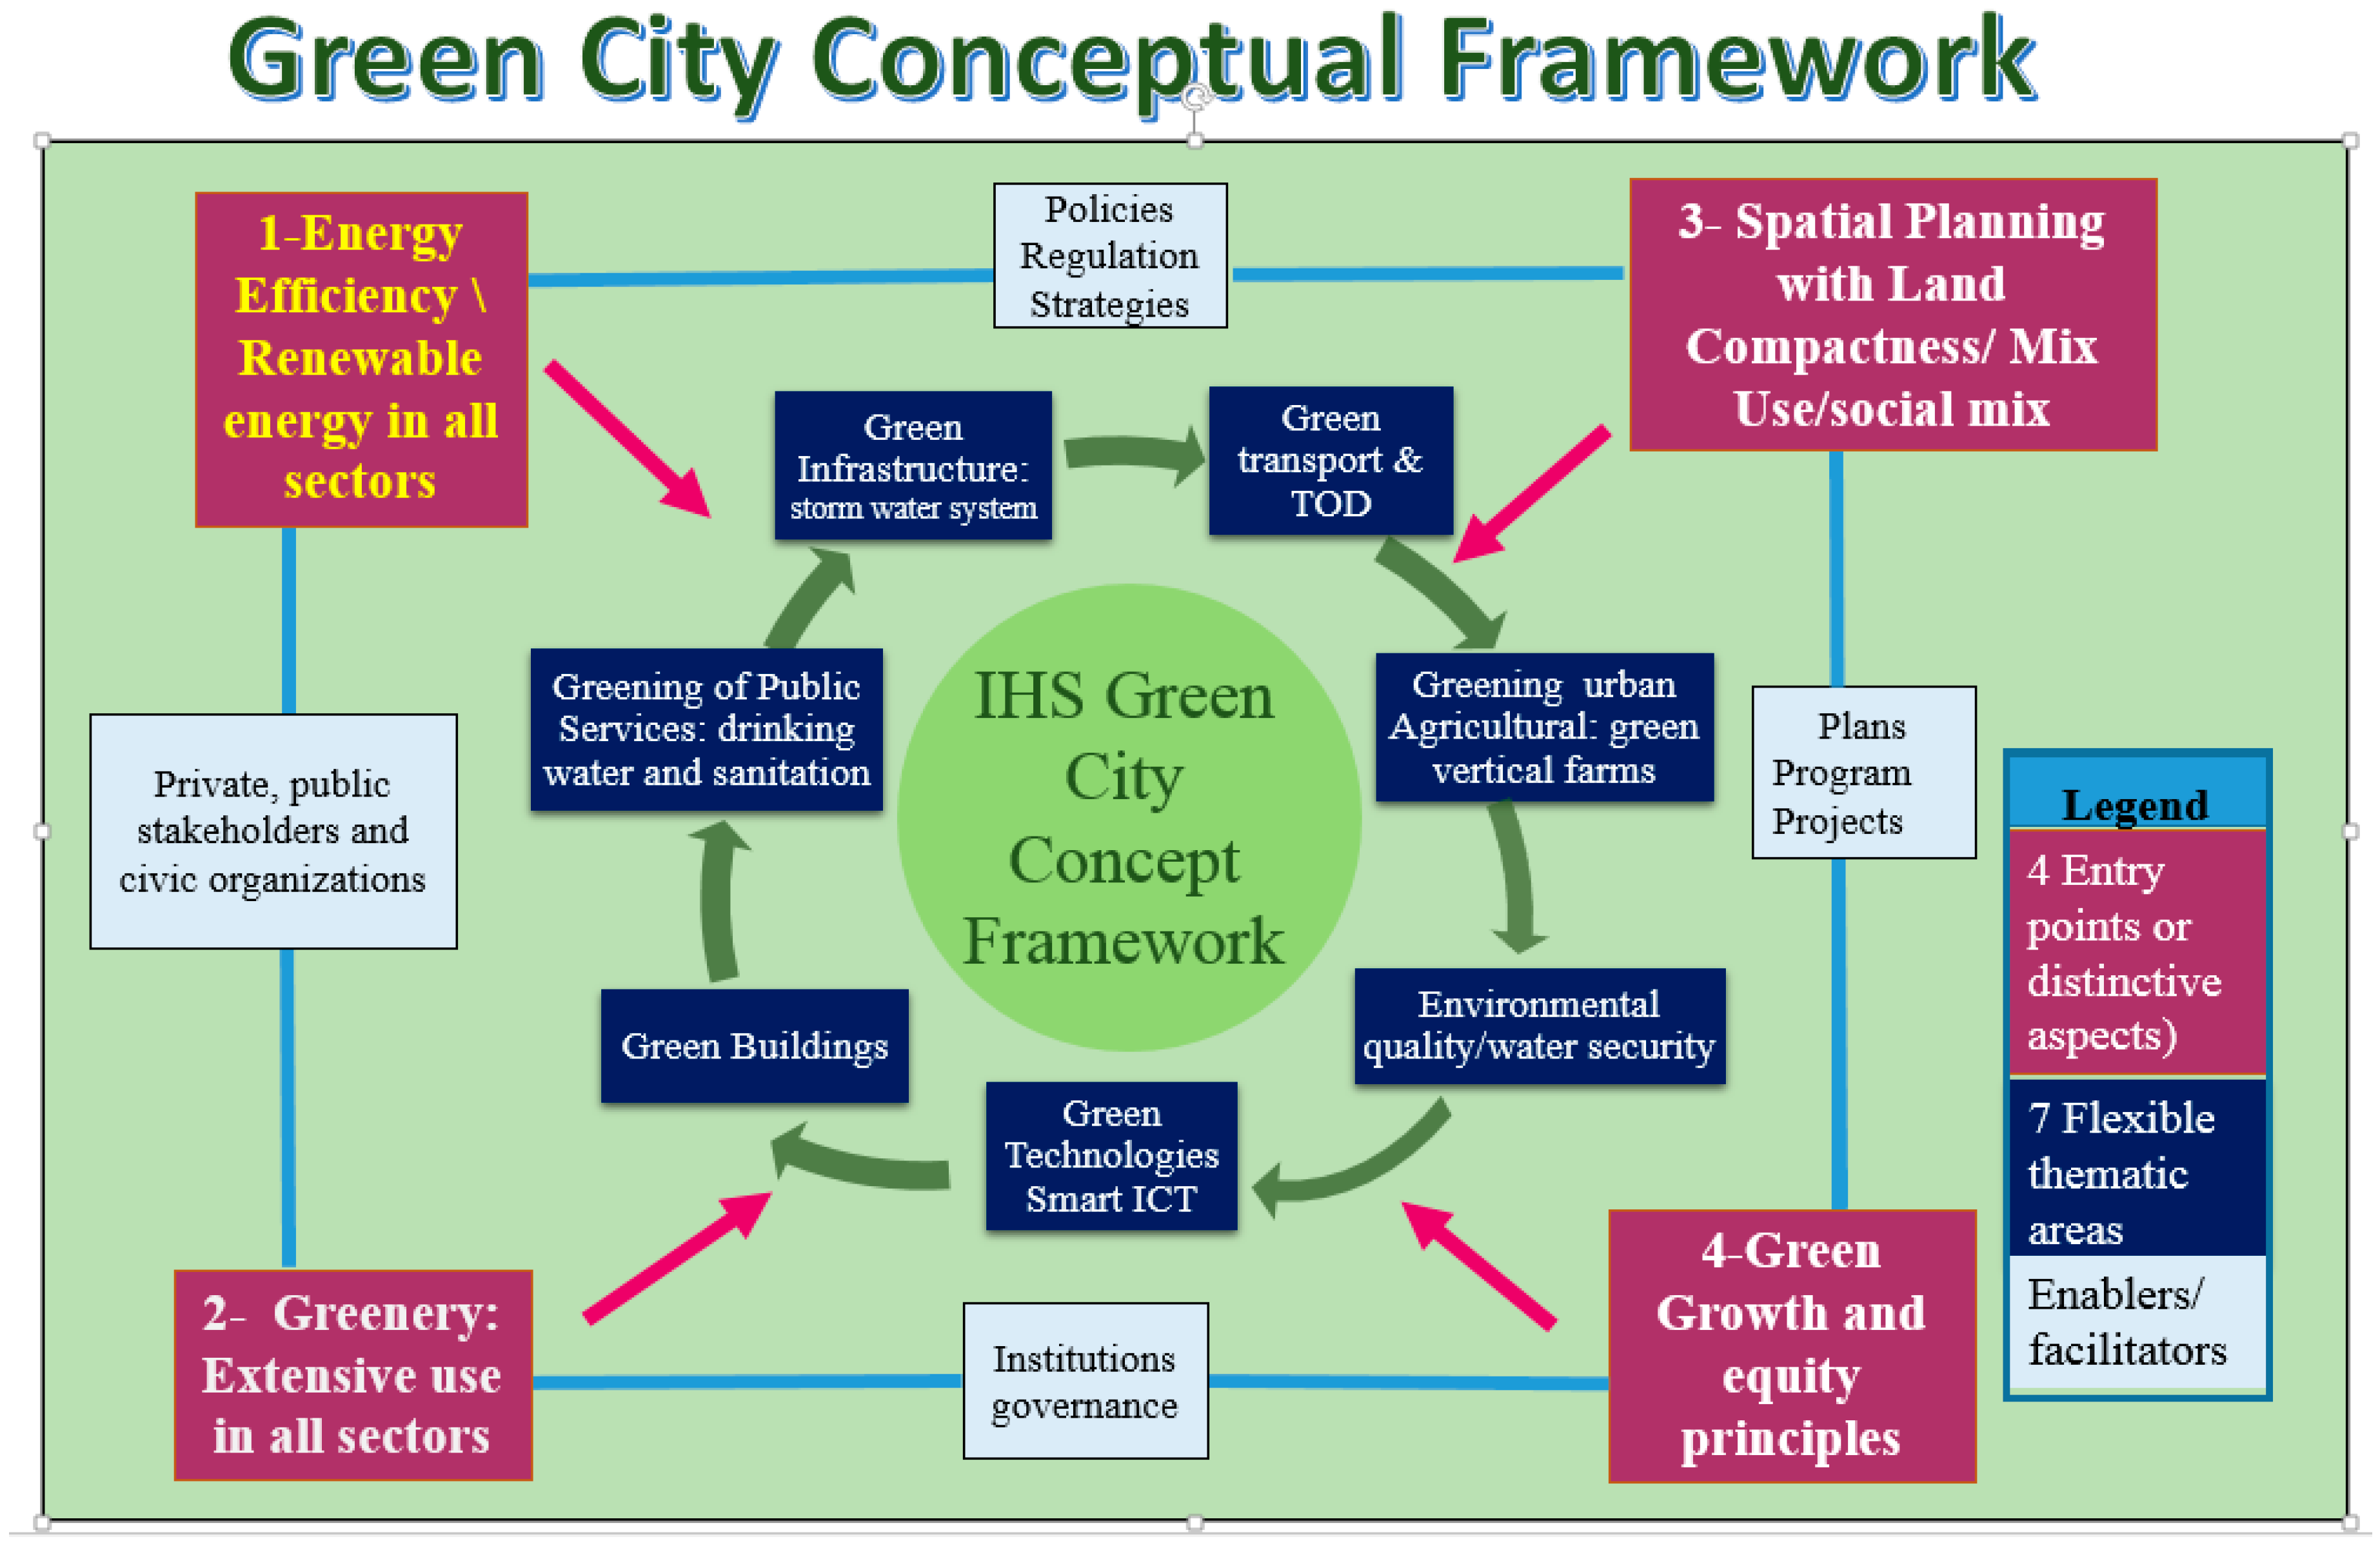
3.1.1. The Re-Developed IHS-GCCF and the IHS-GGCPI Method

The new re-redeveloped IHS-Green city conceptual framework is depicted in Figure 1, Item 2.1. It does not differ much regard to the previous one. The entry points, thematic areas and enablers remain the same but diverse new elements and aspects of the entry points and thematic areas were updated and tuned to better emphasize the central role of renewable energy and in special energy efficiency, seen in this concept as the steward forces contributing to improve city resources efficiency and the overall city green performance. A short summary including the key elements and descriptions used to characterize each entry point, thematic area and enablers is provided below. A description of the key aspects of each thematic area can be seen in Appendix A.

3.1.2. Entry Points

The entry points contain a set of core elements and aspects that we think should be considered and applied to each thematic area and the city activities to align them with the overall goal of improving the GCP.
As can be seen in Figure 1, the promotion of renewable energy and energy efficiency in all city activities is the most important entry point of the concept. Energy is seen in this concept as the central element to promote and steer the achievement of resource efficiency which will contribute to the overall improvement of the GCP. It is assumed in the concept that energy is linked with many elements of the urbanisation process, such as transport, public services, infrastructure, density, water, land use, food, environmental quality, ICT, health, economic development, climate change, etc. Energy related actions in one or more of these elements will have spin off effects in many other urban activities and consequently will influence city resource efficiency and the GCP [13,14,15,16,17].
The promotion of extensive use of greenery, second entry point, is linked to the idea of bringing back nature to cities. This advocates for an equal balance between green and built spaces through the extensive use of greenery practices; such as increasing the presence of urban green spaces and parks in combination with water resources whenever possible, green roofs, green facades, green linear corridors, etc. Greenery contributes to increase the quality of citizen’s lives; to improve health, aesthetics values, and city attractiveness; to reduce environmental pollution, climatic impacts, and heat islands; to create a local micro climate; to help mitigate GHGs (carbon sequestration); to contribute to reduce urban floods; and to adapt to climate change [12,13,36].
Planning for land compactness with mixed land use and social mix, the third entry point, promotes the development of more compact cities using design elements such as compactness, density, greenery, Transit Oriented Development (TOD) practices, and mixed land use and social mix to improve the city’s green performance. It is acknowledged that planning land compactness with the extensive use of mixed land-use and social mix concepts will contribute to decrease the need to travel by creating more working opportunities near to the places where people live and increase diversity. The application of the social mix concept such as, constructing affordable apartments for different income levels in the same building can contribute to reducing social segregation by allowing families with different incomes to live together [13].
Green growth with equity principles, the fourth entry point, promotes the application of elements of these two concepts in all city activities involved with local development. Key elements of these concepts are the promotion of low carbon technologies, increased energy efficiency practices and innovative managerial and financial practices and instruments to steer the development of a local inclusive economy with low adverse environmental impacts and distribute the growth fairly [28].

3.1.3. Thematic Areas

The thematic areas presented in Figure 1 are those areas we think are important for defining a green city and measuring green performance. They do not represent the huge amount of issues involved in the urbanisation and local development of cities; they are a simplification to facilitate the understanding of what a green city is; they are flexible. Any city can add or subtract a thematic area according to their local or regional features such as geography, economy, environment, culture, heritage, etc. In our academic work, the proposed thematic area “Greening the Urban Agricultural Sector” was sometimes replaced by some groups for Heritage. Finally, the choice of these thematic areas were also related to the facility of finding regularly monitored indicators representing elements of these areas used o calculated GCP. A full description of the main elements and aspects of each area is presented in Appendix A: Thematic Areas Main Elements and Aspects.

3.1.4. Enablers

The enablers are key actors and instruments proposed to manage the city and to facilitate the integration of the diverse actions proposed by each thematic area to improve the city environmental performance. Examples of these actors and instruments are private and public institutions, stakeholders, civic organisations, policies, plans, programmes, projects, regulations, governance, finance schemes, etc. Telecommunication and smart technologies (ICT) play a key role in developed the conceptual framework facilitating the implementation of diverse enablers and simplifying their use and communication among city managers, citizens and other stakeholders.

3.1.5. The IHS-GGCPI Method

Table 4 shows the steps in using the IHS-GGCPI index method. Item 2.1 explains in detail how to use each of these steps to calculate green city performance over time and to explain the possible changes of the calculated GCP in the period under study.
The development of the index method was anchored in the IHS-Green City Conceptual Framework displayed in Figure 1, and is composed of twenty-five quantitative indicators distributed in two groups and eight sectors as shown in Table 1, Item 2.1.

3.2. Application of the IHS-GGCPI Method to Fifty Cities Globally

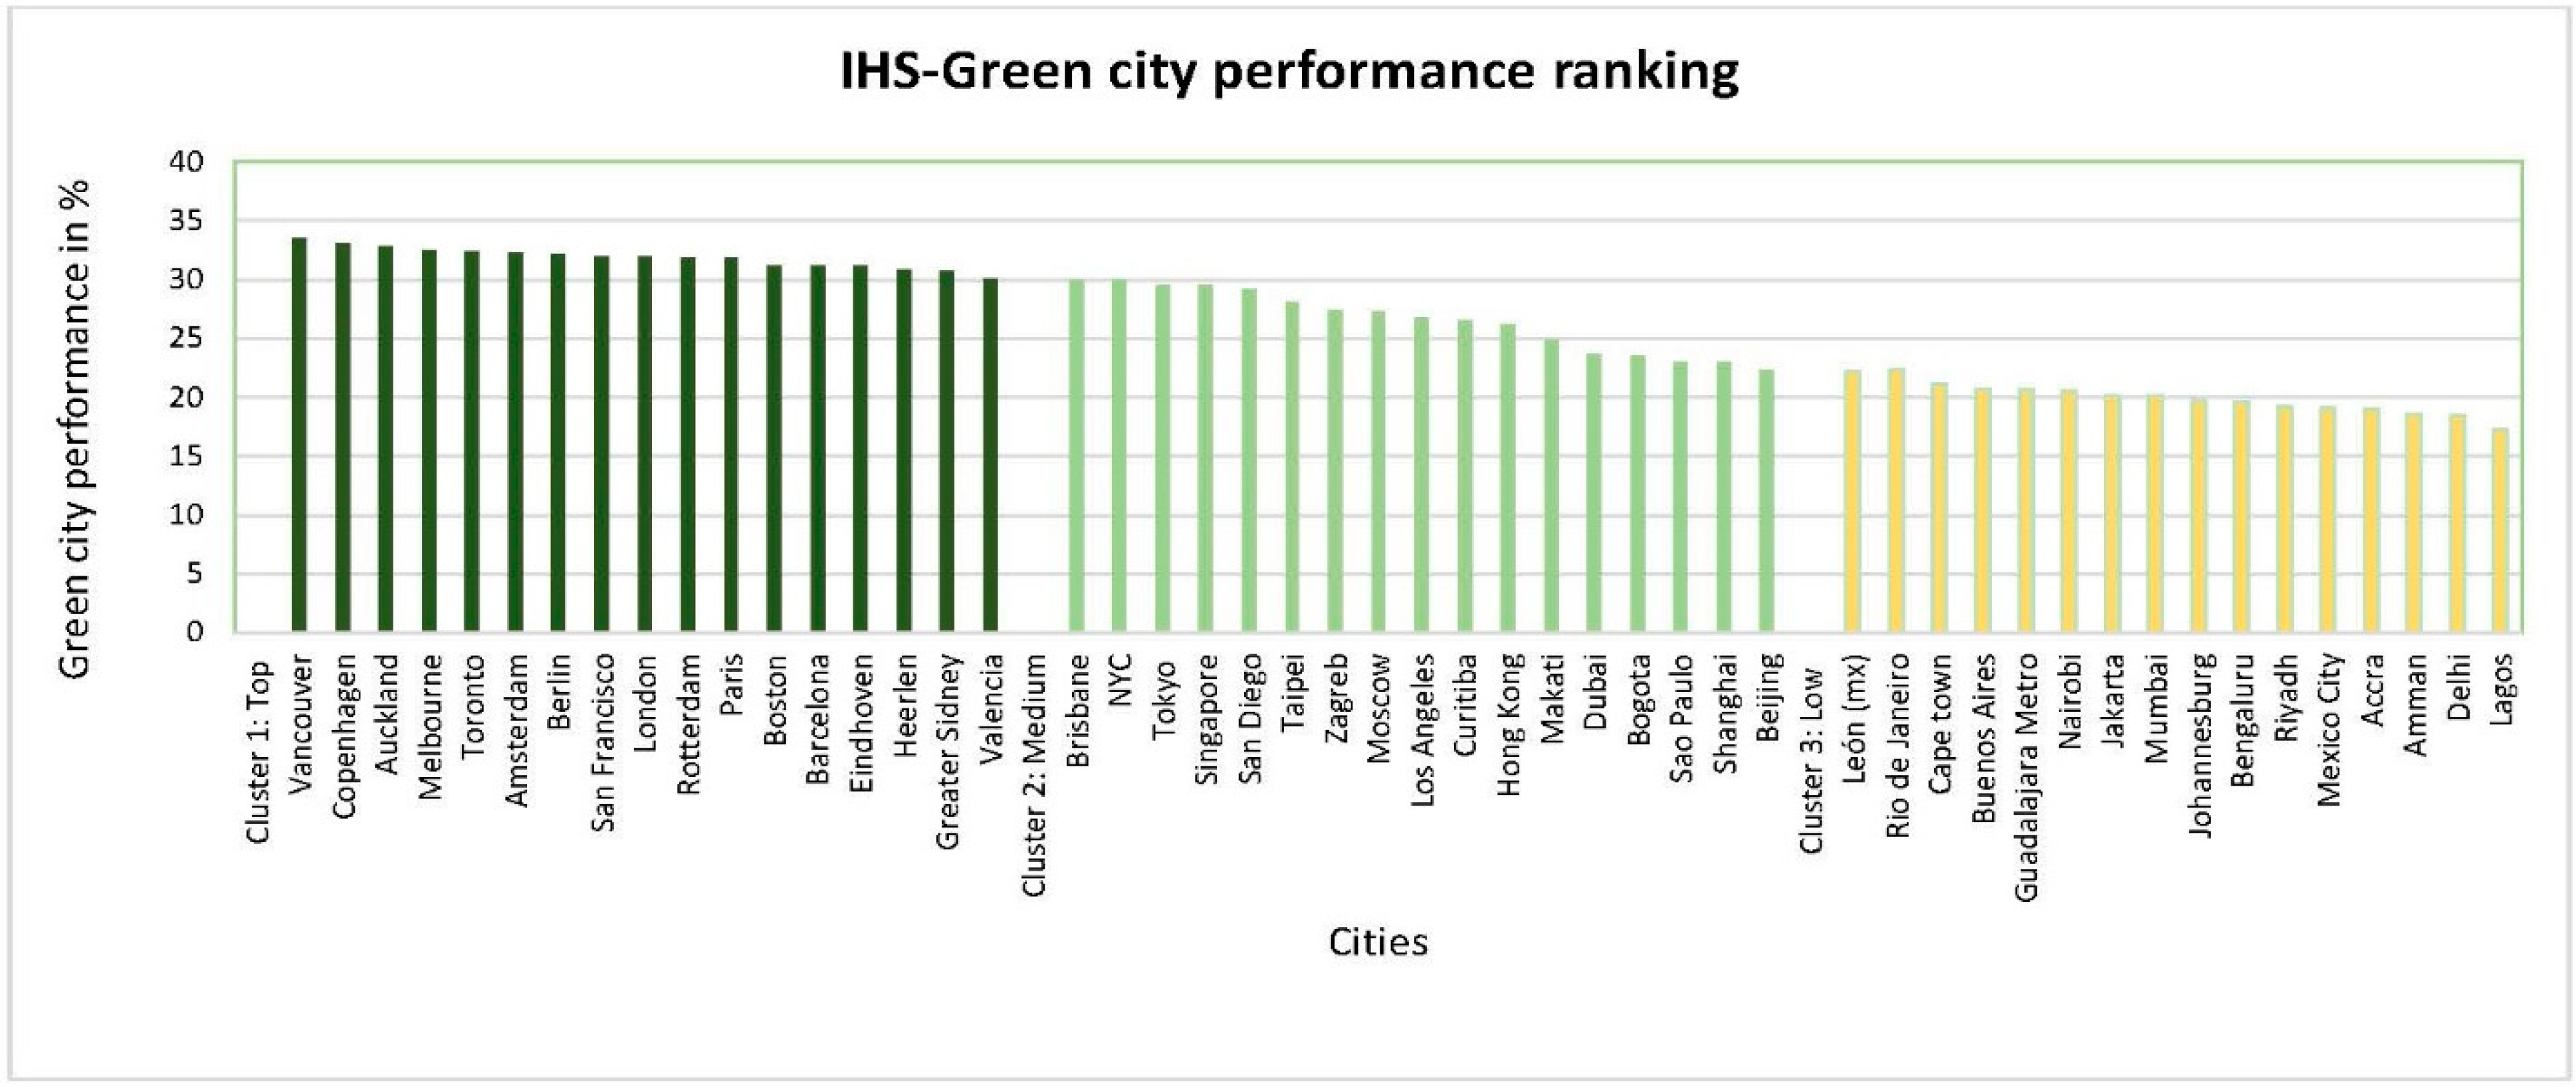
3.2.1. Ranking of Green City Performances

Figure 2 shows the results of the calculated GPs of the fifty studied cities organized in a descending order of GP ranking.
These results, as it can be seen in this figure, are divided into three clusters: Cluster 1 includes cities with high green performances, Cluster 2 cities are those with medium green performances and Cluster 3 comprises cities with low green performances. The procedures used to create the cluster are described in Item 2.3.

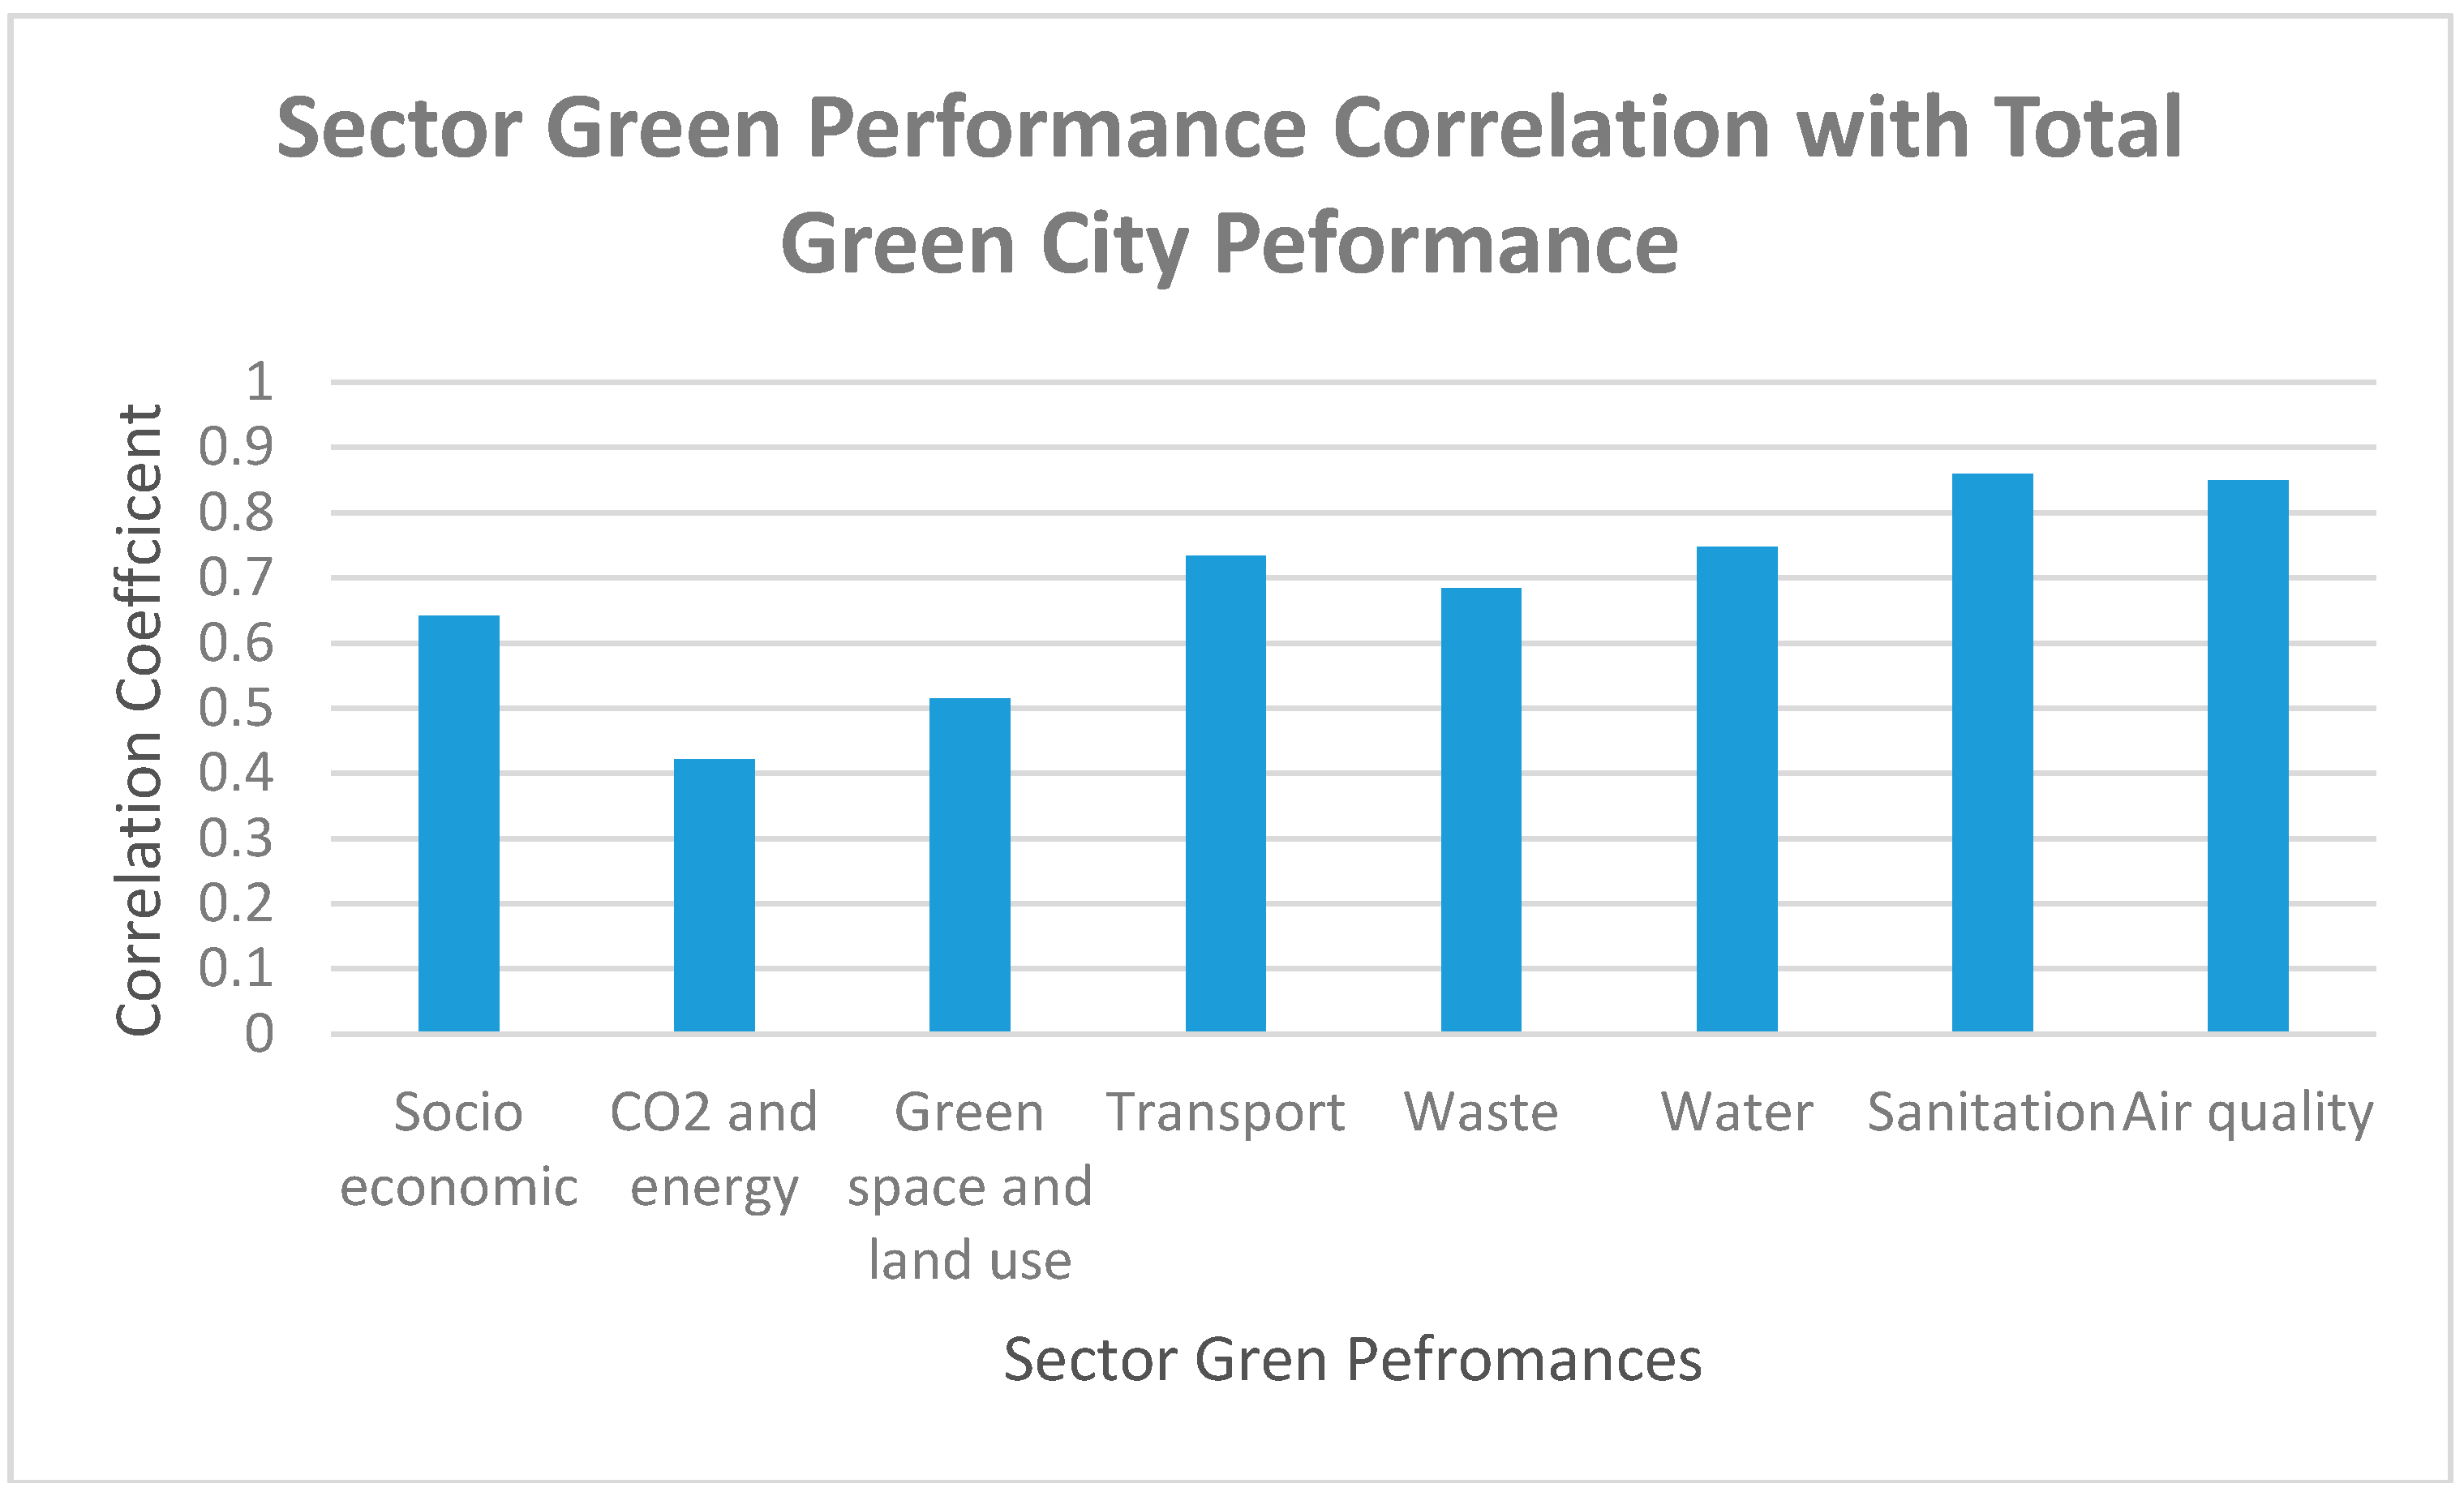
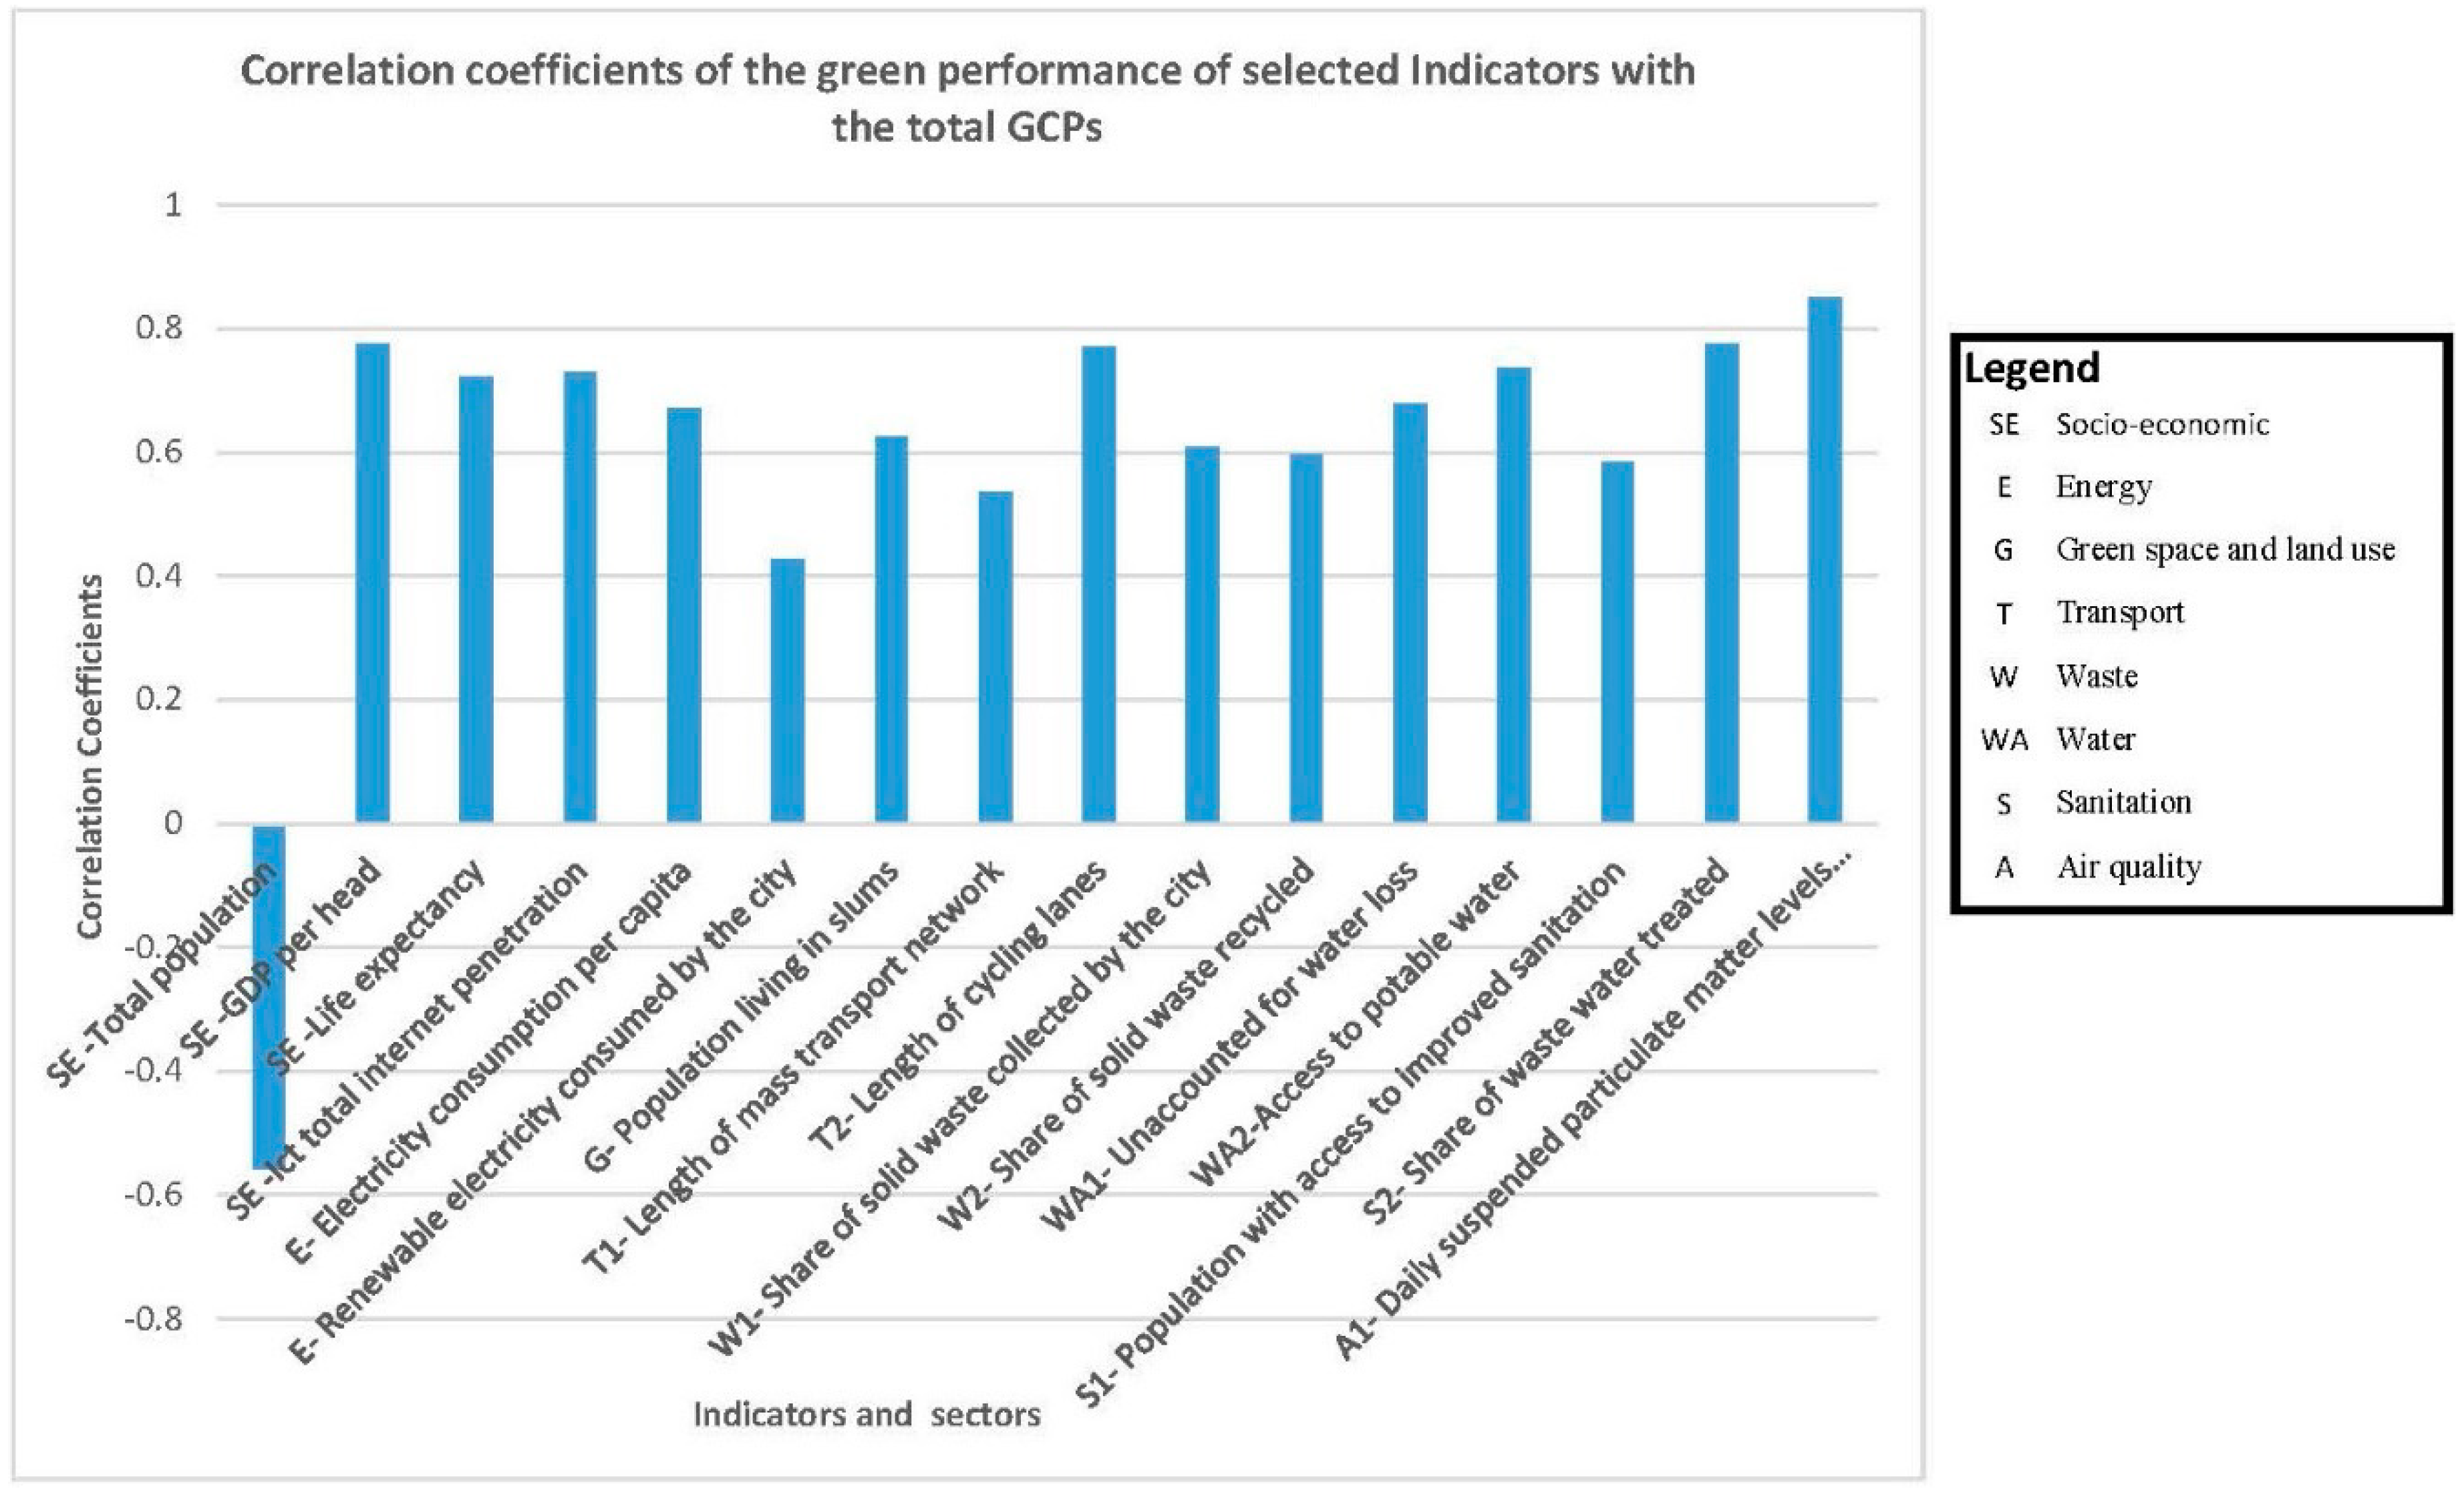
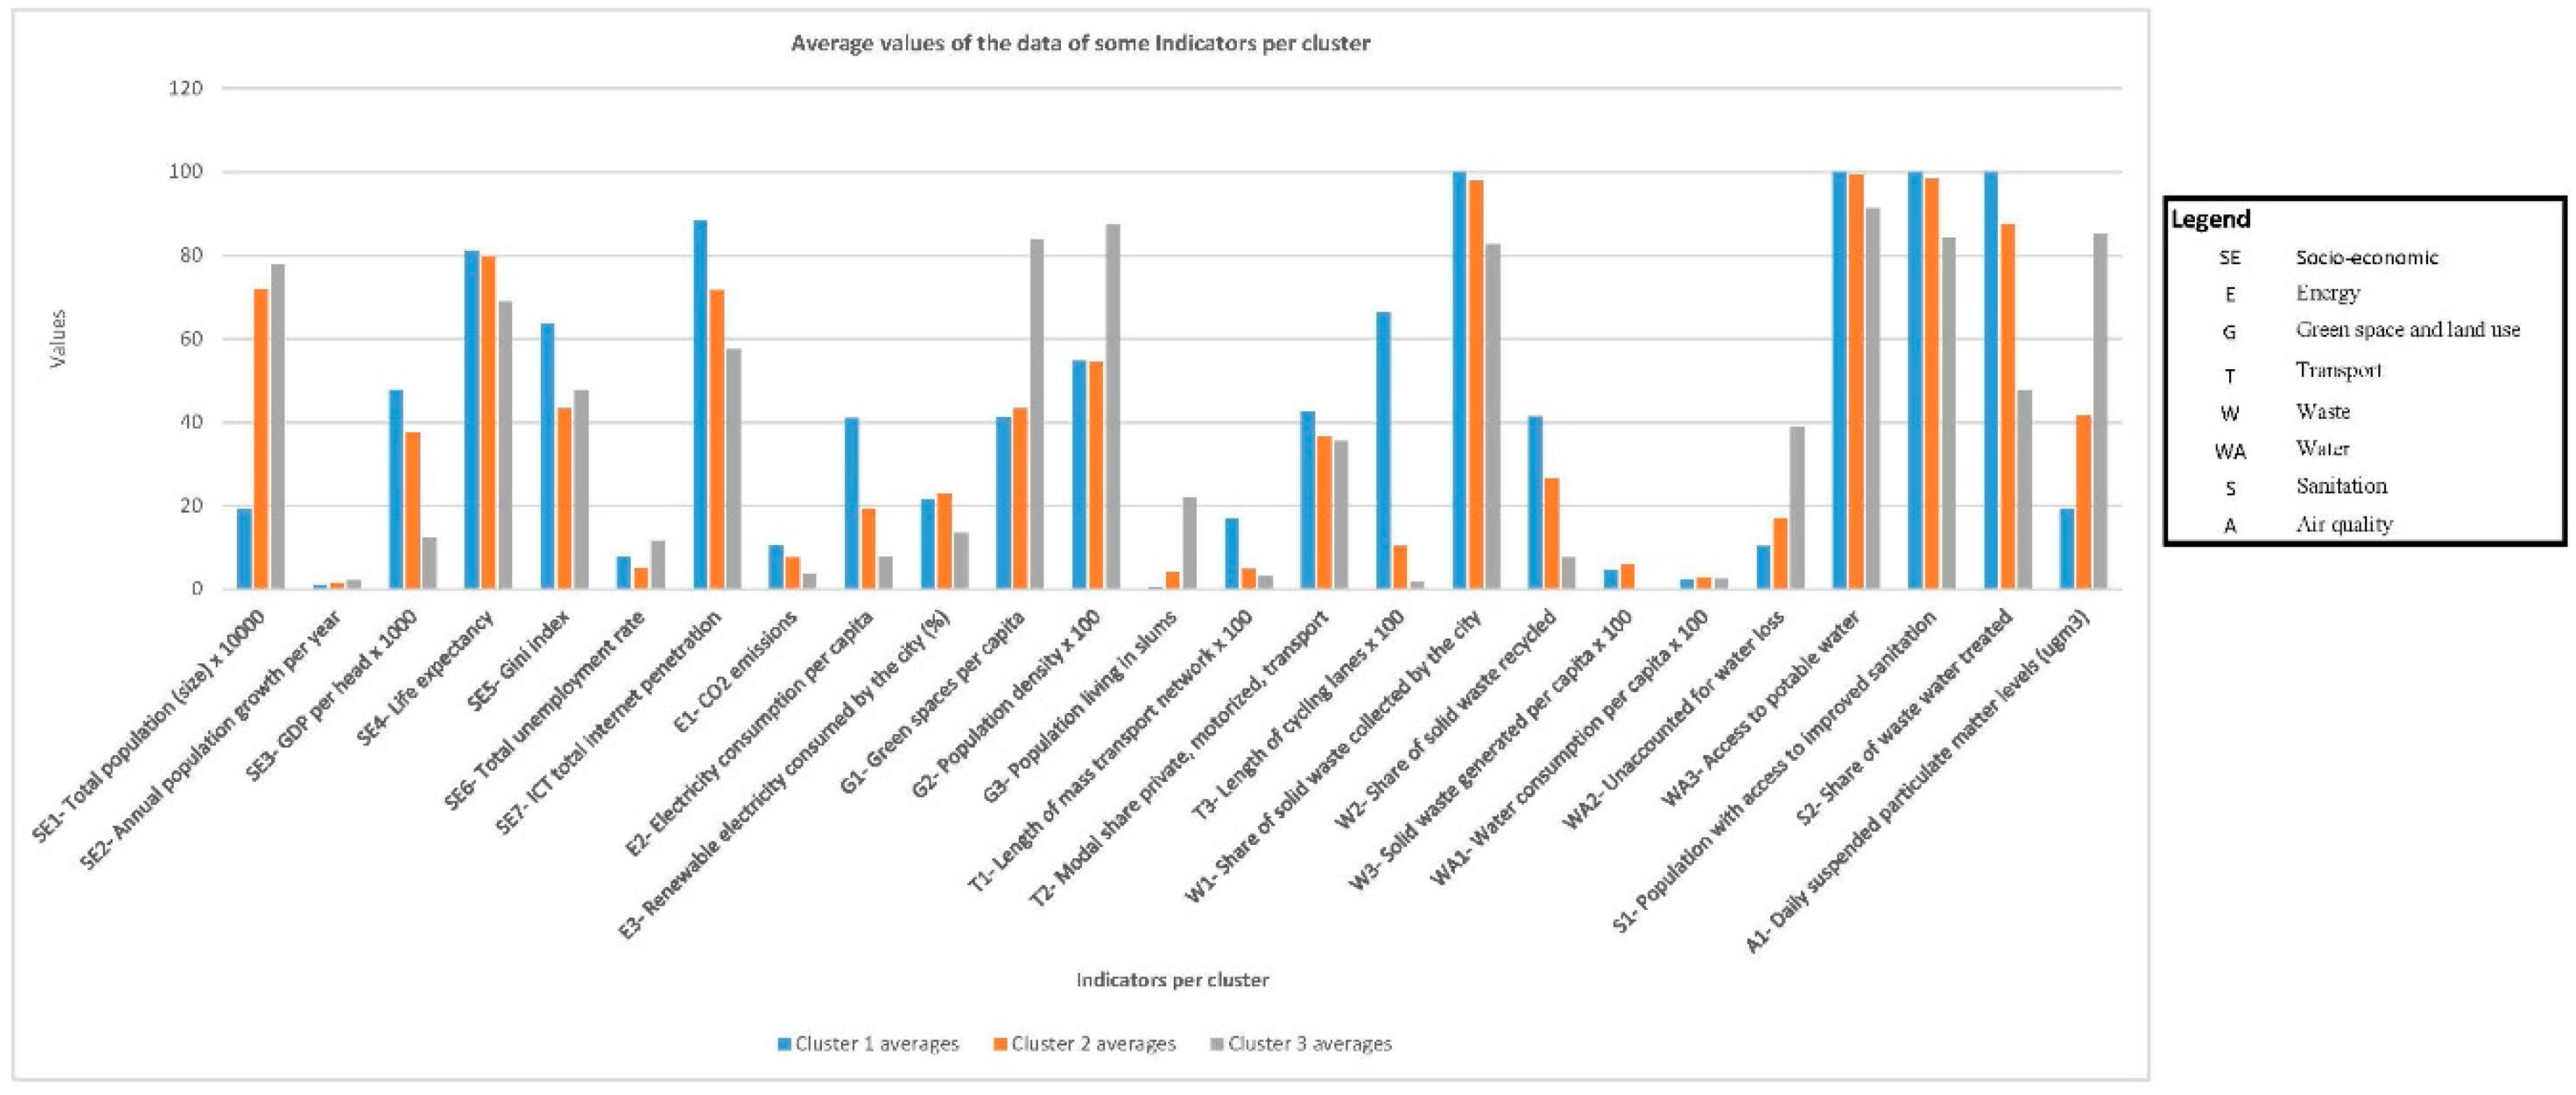
3.2.2. Influence of Sectors on the Total GCPs

Figure 3 presents the results of the sector green performance correlations with the total GCPs. All the sector correlation coefficients have very significant, strong and positive correlations with the total GCPs (p = 0.0%, except for the sector energy that present a significant but weak correlation with a p = 0.2% for an interval of 95%).

3.2.3. Influence of GDP and Population Size on the Total GCCPs

Figure 4 depicts the significant correlation between green performance and population size, GDP and other indicators.
Figure 5 presents complementary data information collected for these indicators. The vertical axis is structured to accommodate the different units of the collected data for the displayed indicators.
As it can be seen in Figure 4, GDP has a strong and positive correlation with the total GCPs (r = 0.77, p = 0.0%), while the indicator population size is negatively correlated with total GCPs and presents a medium correlation coefficient (r = 0.55, p = 0.0%).
In Figure 5, the average GDP of the cities of Cluster 1 is the highest (47,834.81 US$) among the three clusters. It is four times higher than the average GDP of cities of Cluster 3 (12,351.07 US$). Cities of Cluster 2 have an average GDP equal to almost three times higher (37,625.84 US$) than the average GDPs of cities in Cluster 3. Some of the richest cities of Cluster 2 also have individual GDPs higher than some cities of Cluster 1.
In this same figure, cities of Cluster 3 have the largest population size average (equal to 7,785,373.40) followed by Cluster 2 (7,188,994.39) and Cluster 1 (1,919,391.65).

3.2.4. Influence of Energy on the Total GCPs

Figure 3, Figure 4 and Figure 5 show diverse results related to the correlation and data of the energy sector and their indicators. As mentioned, it can be seen in Figure 3 that the energy sector has a significant but week correlation with the total GCP.
In Figure 5, on average, the cities of Cluster 1 produce more renewable energy than cities of Cluster 3 but consume on average three times more electricity per capita and produce almost three times more CO2 emissions per capita. In some Cluster 3 cities, such as Rio de Janeiro and Nairobi, more than 80% of electricity produced and consumed is generated by renewable hydro power. This is also the case for some cities of Cluster 2 such as Curitiba, Bogota and Sao Paulo.

3.3. Assessing the Claim that a Green City Is also a Sustainable and Liveable City

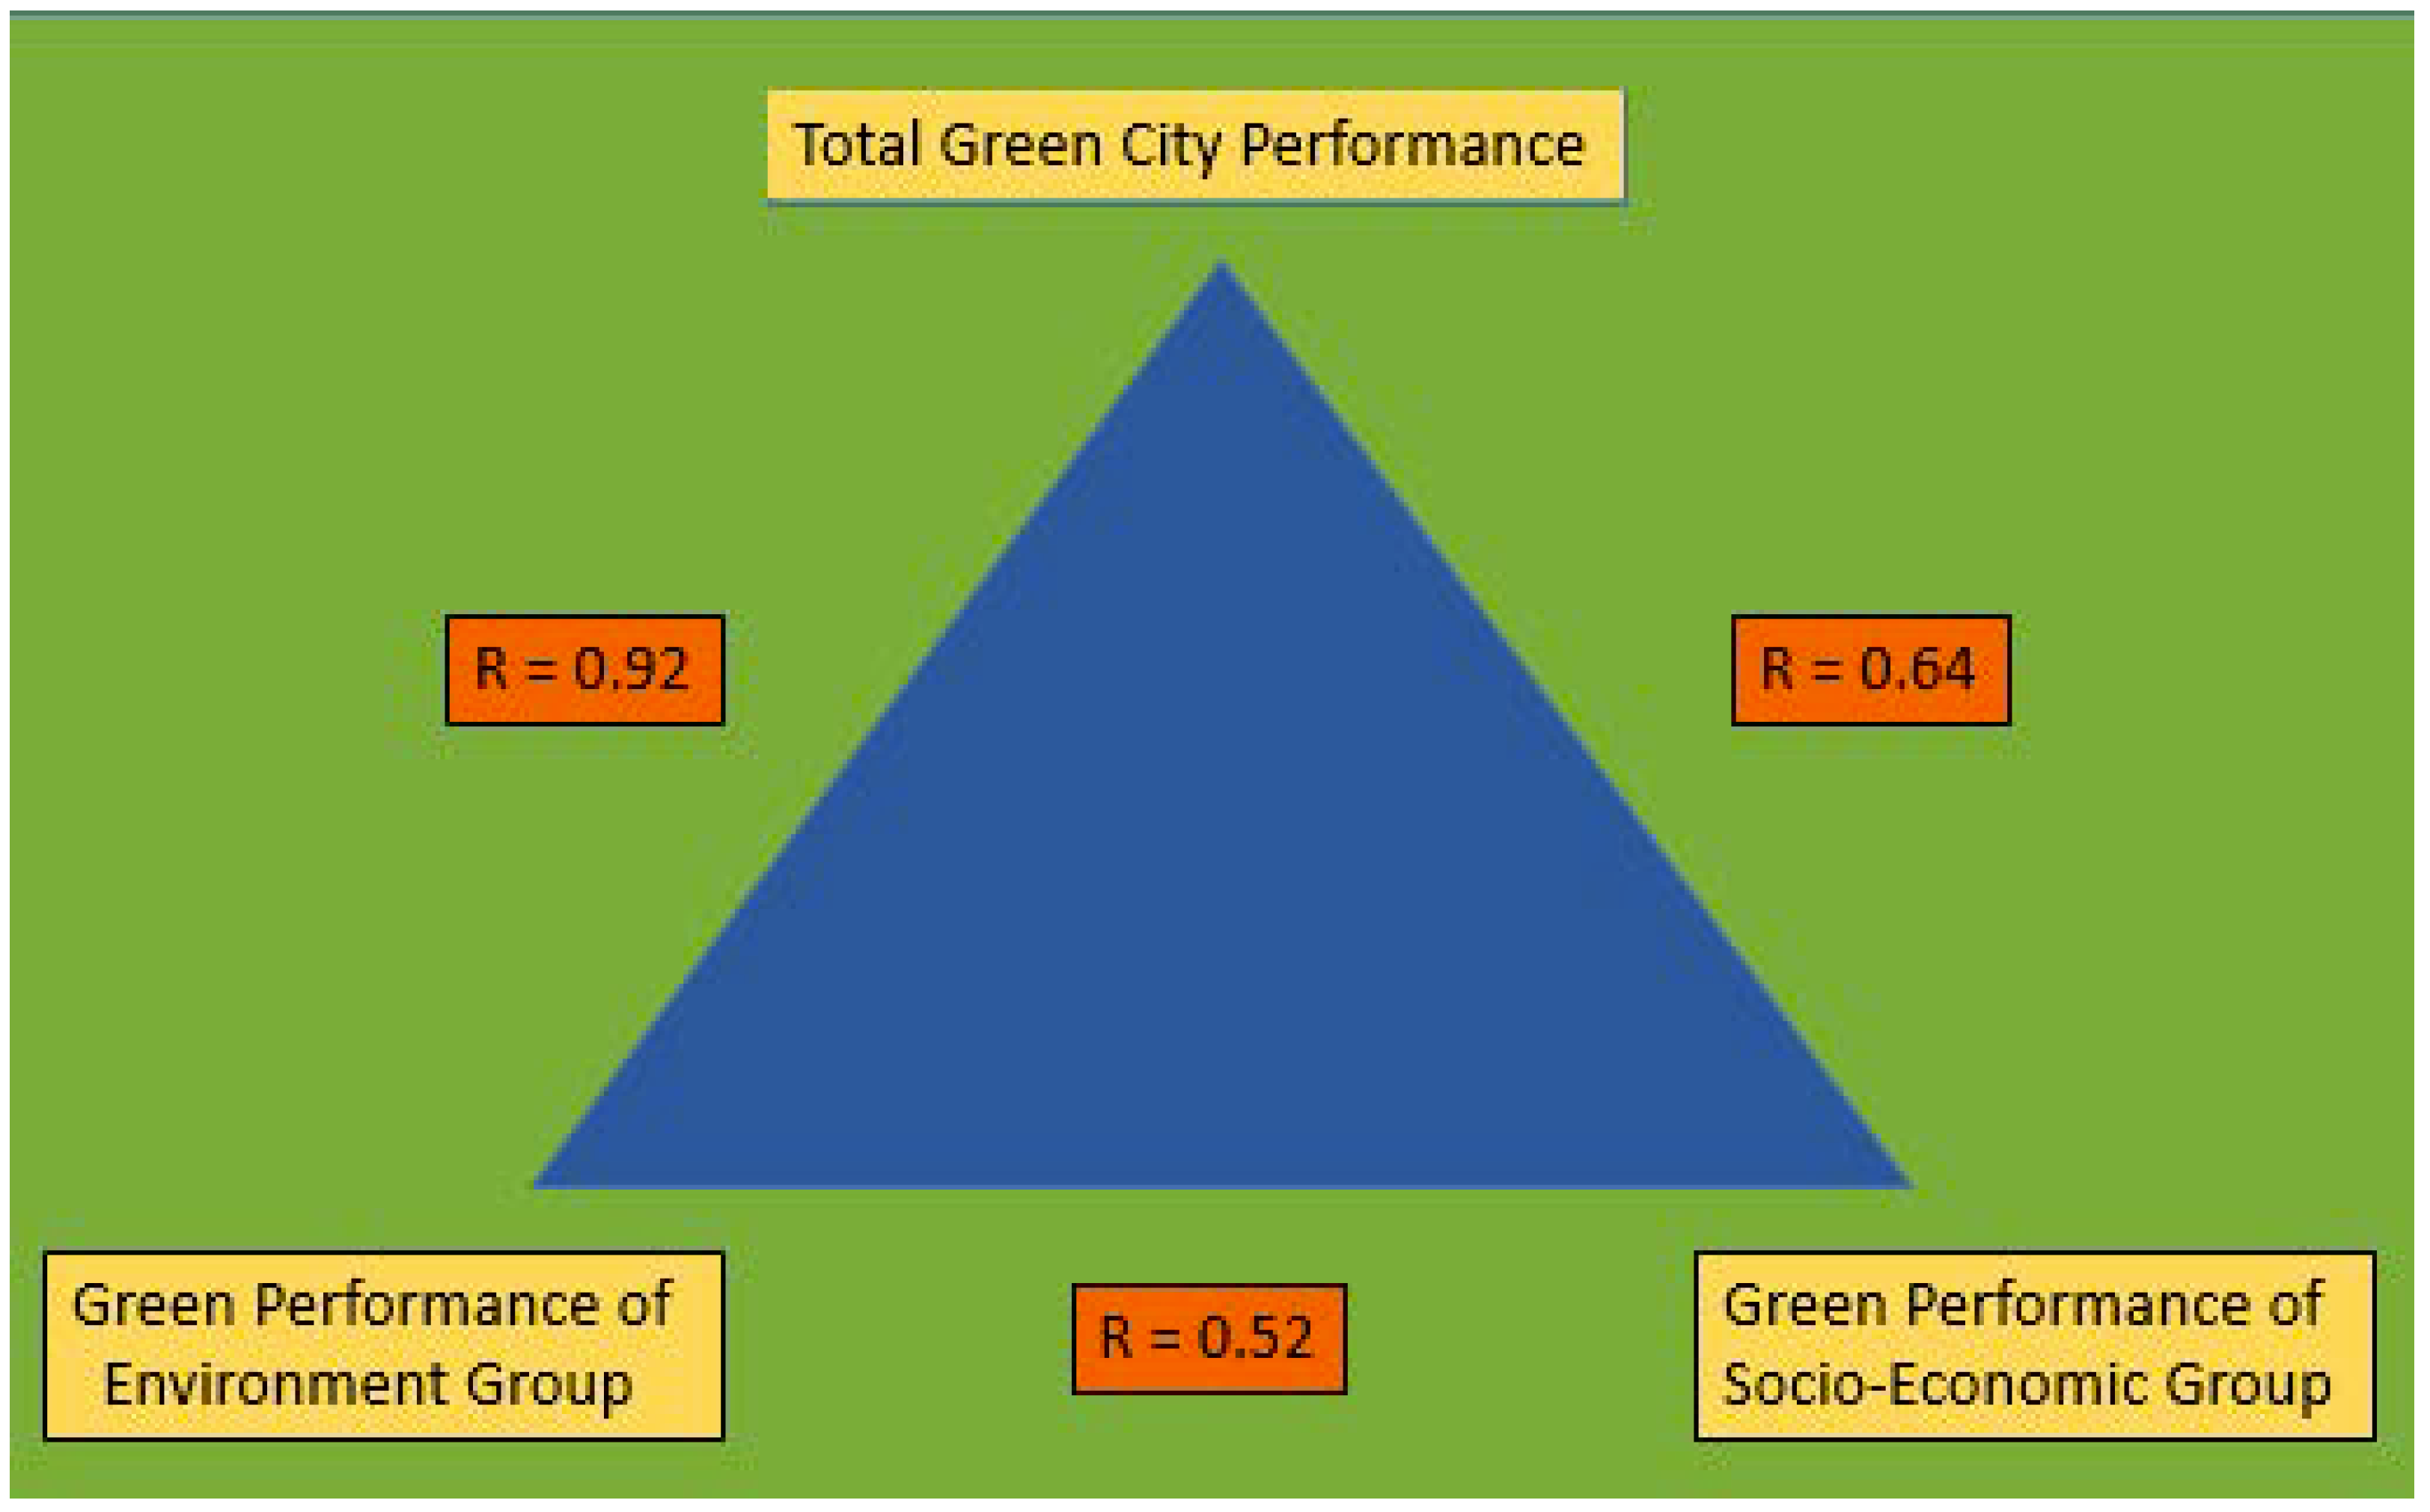
3.3.1. Assessing Whether a Green City as Defined in the GCGCH Is also a Sustainable City

Figure 6 shows that there are positive and significant correlations between total GCP and the GPs of the group environment (r = 0.92, p = 0.0%), the socio-economic group (r = 0.64, p = 0.0%) and the green performance of the environment and socio-economic groups (r = 0.52, p = 0.0%).

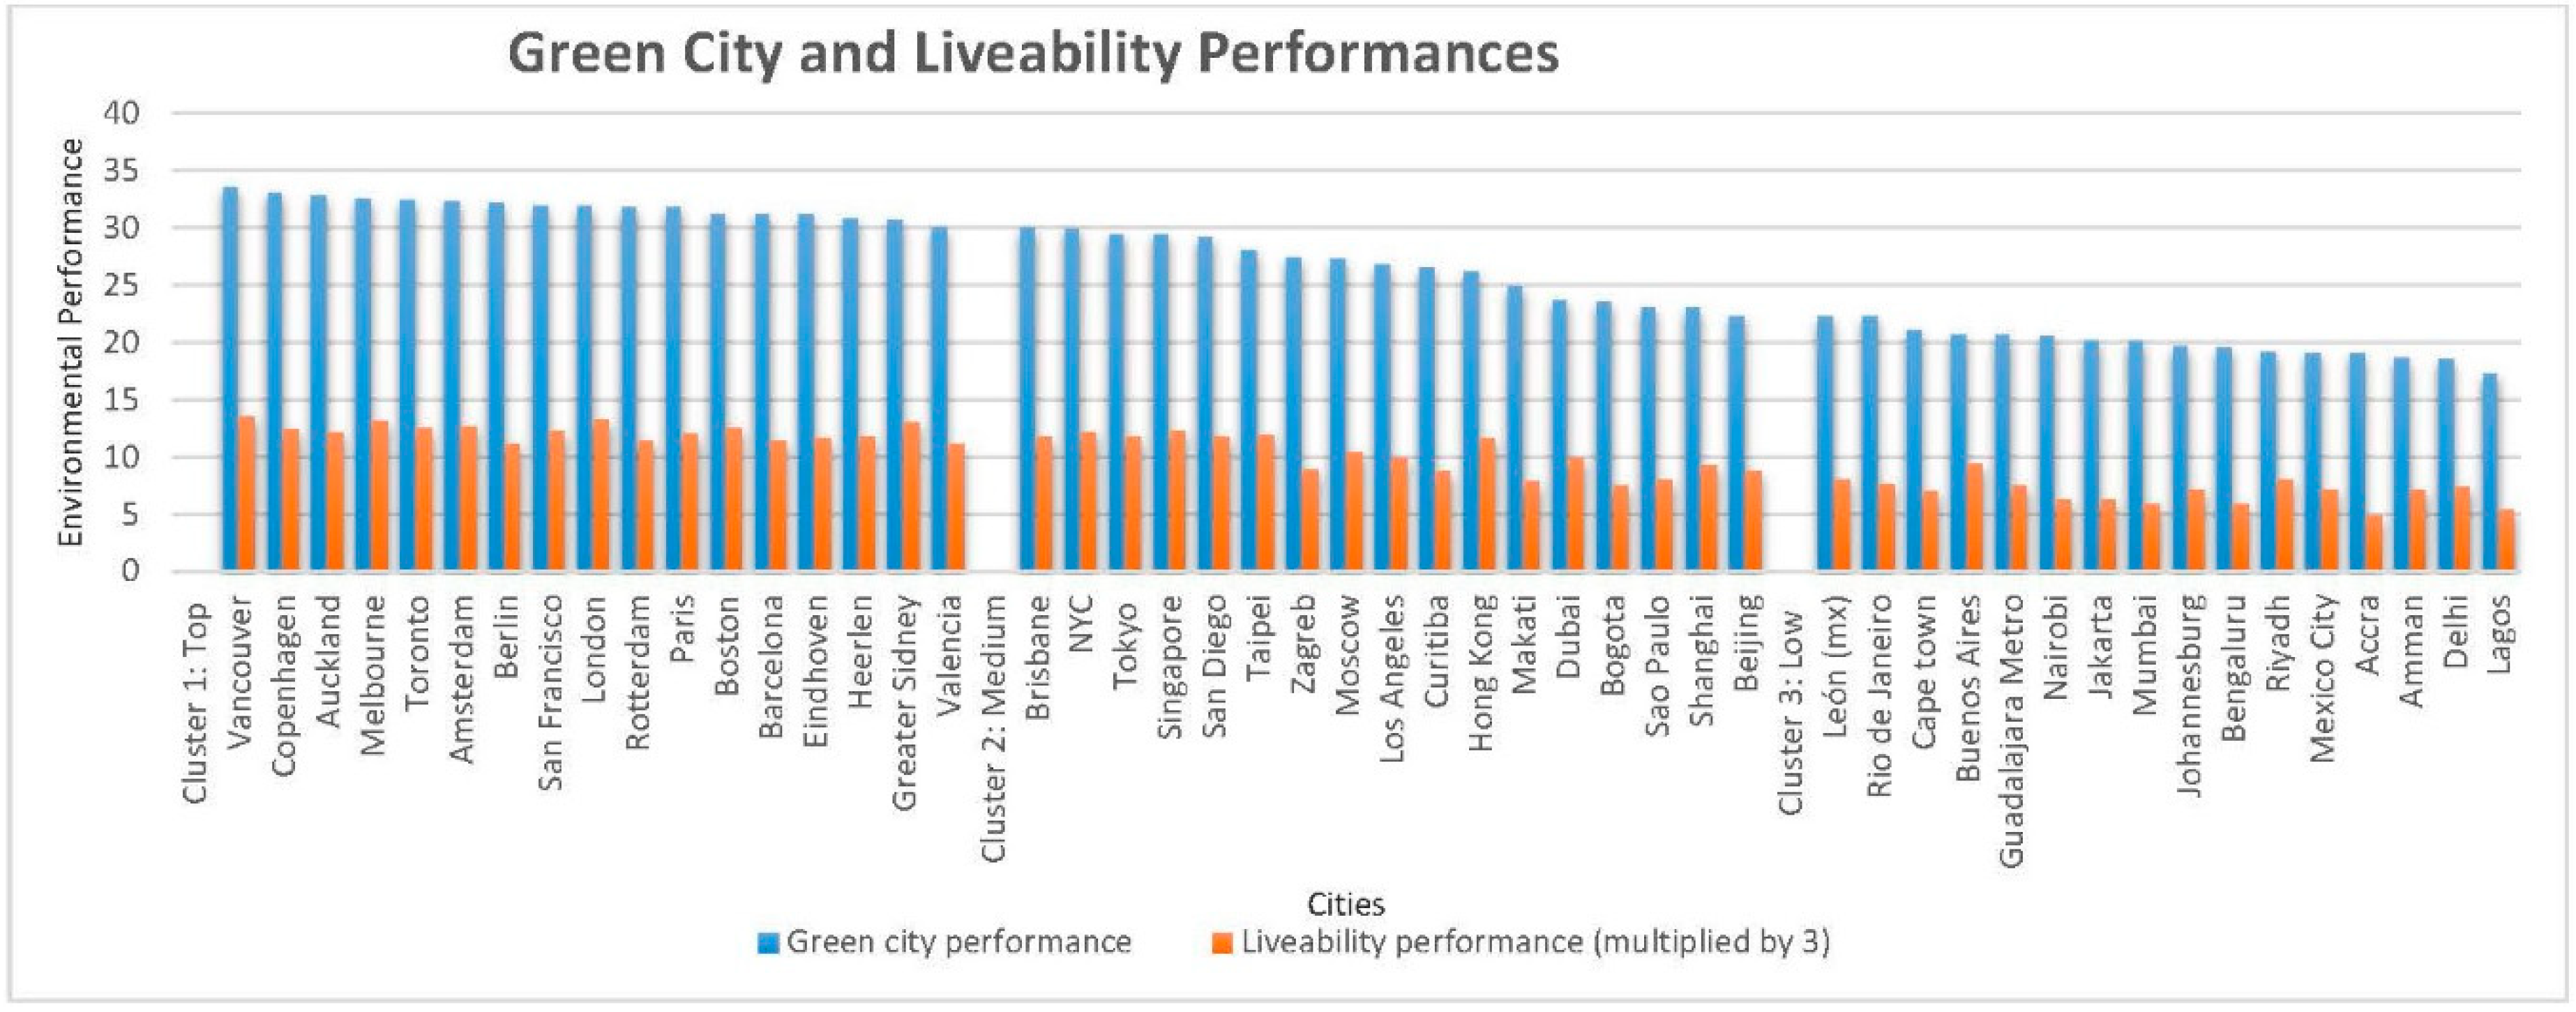
3.3.2. Assessing Whether a Green City as Defined in the GCGCH Is also a Liveable City

Figure 7 shows the ranking of Green City and Liveability performances calculated using the procedures described in Section 2.1 and Section 2.2. In this figure, we see that cities with high green performances also have high liveability performance. Total GCP has a very significant correlation with the Total Liveability Performance (r = 0.90 and p = 0.0%).

3.4. Discussion

3.4.1. The Revised IHS-GCCF and the IHS-GGCPI Method

The IHS Green City Concept is an umbrella framework (Figure 1), comprising several elements from diverse theories and concepts previously introduced and discussed in the Introduction.
The concept incorporated several elements of the socio-economic and environmental pillars of the theory of sustainability and other concepts such as compact city, sustainable city, green growth, liveable city among others. The framework highlights and promotes energy efficiency and renewable energy as a steward of resource efficiency and green performance.
Developing a conceptual framework for the green city and using it to develop a method to measure a city’s green performance is a complex task, as has been pointed out throughout this article. Behind the basic parameters that define how cities perform in terms of green and other related issues there are, for example, different and sometimes complex patterns of urban development. These have diverse spatial, cultural, environmental, social and economic characteristics that are almost impossible to capture using a small set of thematic areas and indicators.
The authors are aware of this complexity and these difficulties and recognize that the proposed Green City Conceptual Framework (IHS-GCCF) and the IHS-GGCPI method do not address all the different elements of the urban development process. In addition, the selected sectors and indicators forming the index only reflect a fraction of local reality. They framework and methodology attempt to simplify and measure this complexity by offering a simple umbrella framework to define a green city and develop a method to calculate green city performance over time and explain the variation or non-variation of green performance in the study period.
The green city conceptual framework, the method and their application to fifty cities as presented and discussed in this article fill some gaps in the literature. These include the development of a simple green city concept, a method to measure green performance and track the evolution and progress of cities’ green performance over time rooted in a green city conceptual framework and the investigation of the influence of GDP, key sectors and population size in green performances.
As a result of the assumptions and the procedures used to develop the IHS green city conceptual framework and the method used to measure GCP globally, the authors define a green city as “a city that promotes energy efficiency and renewable energy in all its activities, extensively promotes green solutions, applies land compactness with mixed land use and social mix practices in its planning systems, and anchors its local development in the principles of green growth and equity.” Energy efficiency is a distinctive feature of this definition compared with other definitions of green cities.
The authors believe that the method and the procedures described in this article can be useful to guide any future users to apply the method described in this article to create their own method, or to adapt the method to their own city’s needs. The method can also be applied to monitor the achievement of proposed targets and actions to improve city green performance and help identify and explain the factors behind achievements and failures.

3.4.2. Application of the IHS-GGCPI Method to Fifty Cities Globally

Data Quality

The data used to construct the method were collected in 2017 by IHS staff following the criteria previously developed and described under Item 2.1 and Step 2 in the Materials and Methods Section. In total, 1298 data were collected for the fifty cities: 79.2% of the total data collected refer to the period 2013–2016, 6.2% to 2012 and 14.6% are from before 2012, of which 0.1% are for 2001, the earliest data collected.
Three main sources were used to collect the data: The World Council for City Data (WCCD, ISO37120) [37] with 36.46%, followed by the CDP, formerly carbon disclosure project [38] from which we source the share of renewable electricity generated and emissions per capita for many cities, and from which most of the GDP estimates have been taken. Other official sources included the World Health Organization (WHO), the Word Bank, OECD, UN Habitat, local and national public institutions and, in the case of data for some indicators of African cities, scientific papers.
The availability and comparability of data across cities was more limited for Africa and a number of Asian cities than in cities from other continents. Eighty-six per cent of the total data set is from city administrative areas, 9% from national, metropolitan and provincial data, 2.1% were blanks (no available data) and 2.9% have assumptions made (see Item 2.1, Step 2 of the section materials and methods). “Length of cycling lanes” was the indicator presenting the highest number of blanks (9 cities) followed by “green spaces per capita” with four cities. The high number of blanks of the “length of cycling lanes” reflects to some extent the fact that only recently has the building of cycle lanes become popular worldwide and that many cities where cycle lanes are not yet regularly tracked. The “green spaces per capita” indicator is many cities of Africa and Asian is not being regularly tracked or if tracked di different definitions are being used.
As previously mentioned in the Item 2.1, Step 2 in the Materials and Methods Section, assumptions were made for the indicators of some rich cities such as “share of solid waste collected by the city” (eleven cities), “population living in slums” (nine cities) and “share of waste water treated” (nine cities). Some rich cities as mentioned before are no longer regularly tracking these indicators although they have strict policies and rules controlling them.
In sectors where indicator data were not available (blank) ,the weight of the indicators were redistributed among the other indicators within the sector to be in line with the criteria that the total weight of the indicators within a sector adds up to 100%.
Representativeness and consistency was assured by collecting data from global and regional sources wherever possible and avoiding as much as possible specific documents and other reports where differences in definitions and methods of collection could be an issue for data consistency. A record of original data sources is kept at IHS.
Despite following a strict data collection protocol, we acknowledge that some inaccuracies might remain within the data set due to inconsistencies in definitions, measurements, data collection methods and lack of data, such as in some African and a few Asian cities which means that the data should be considered with a degree of caution.

3.4.3. Ranking of Green City Performances

As can be seen in Figure 2, Vancouver leads the overall ranking of GCP with 33.35 points followed by Copenhagen with 33.06 and Auckland with 32.8. Among the top ten green cites, five are from Europe (Copenhagen, Berlin, Amsterdam, London and Rotterdam), three from North America (Vancouver, Toronto and San Francisco) and two from Oceania (Auckland and Melbourne).
Per continent, Copenhagen is the top green city in Europe, Vancouver in North America, Auckland in Oceania, Tokyo in Asia, Curitiba in South America and Cape Town in Africa. Moscow, Shanghai and Sao Paulo, important BRICS cities have medium green performances. Per country, two Dutch and two Canadian cities are among the top 10 green city performances. All studied African and Indian cities such as Cape Town, Nairobi, Johannesburg, Accra, Lagos, Mumbai, Bengaluru and Delhi are in Cluster 3 with low green performances. Lagos is the city with the lowest green performance (17.27 points) in this ranking.
The authors are aware that comparing the results of indexes developed to measure and rank city sustainability, city environmental performance or green city performance is an almost impossible task. Although some of these rankings sometimes use elements and indicators that overlap with each other, they very often measure different things, use different approaches, indicators, cities and criteria.
Despite these difficulties, the results obtained with the application of the IHS-GGCPI index method to some extent match with results found in the existing literature. Cities such as Vancouver, Copenhagen, London, Auckland, Amsterdam, Berlin, Toronto, Paris, and Barcelona found to be in the top Clusters 1 and 2 of the IHS ranking are also very often present in the top list of indexes which rank cities according to their sustainability, environmental performances and liveability [23,24,25,26,27,29,30,31,32].
The IHS-GCCPI ranking could be useful for the participating cities to benchmark themselves and possibly propose targets and actions to improve their GP. For cities not included in the ranking it could be also useful to compare themselves with ranked the cities provided they follow the procedures to calculate their own GP described in the IHS-GGCPI method.

3.4.4. Influence of the Sectors, GDP, Population Size and Energy on the Calculated Green City Performances

As can be seen in Figure 3, Sanitation, Air Quality, Water and Transport are the sectors presenting the strongest correlation coefficients with the total GCPs. Sanitation and Air Quality are the two sectors with the highest correlation coefficients with total green city performances, 0.71 and 0.70 respectively. Since the Air Quality sector has only one indicator (PM10) this indicator alone predicts 70% of the total GCP.
As it can be seen in Figure 2, Figure 3, Figure 4 and Figure 5, there is an economic bias towards rich cities: the richest cities (Clusters 1 and 2) measured by GDP are greener than the cities of developing countries (Cluster 3). The richest cities of Cluster 1 and most of the cities of Cluster 2 have very high GDPs; small to medium population size; very good green performance in the Sanitation, Air quality, Waste, Drinking water, Transport and Socio-economic sectors; and very high Energy consumption, Production of renewable energy, and CO2. Cities of Cluster 3 on the other hand have low green performance for these sectors, low GDP, low socio-economic levels, large population size, high number of slums, low energy consumption and low CO2 emissions.
These results suggest that cities in Clusters 1 and 2 have large financial resources to invest in the sanitation, air quality, drinking water, transport and waste sectors which have contributed to the high GPs of these cities. Cities in Cluster 3 on the other hand have low GDPs, low financial resource capacity to invest in these sectors and very often also have large population size and slum areas which contribute to low GPs in these cities.
Population size, as shown in Figure 4, has a significant negative correlation with the total CGPs. This result seems to indicate that cities with very large population tend to have a low GCP. To some extent the above statement was confirmed by this research. Cities with very large populations such as Delhi, Mumbai, Bengaluru, Mexico City, Lagos, Rio de Janeiro and Jakarta are in Cluster 3, and all have low green performances. However, a more in-depth look at the results shows London, with more than 10 million inhabitants, among the top ten greenest cities, as can be seen in Figure 2. This is also the case of other cities with large populations such as Tokyo, Los Angeles and New York, which are found in Cluster 2. This also applies to mega cities such as Shanghai and Beijing with more than twenty million inhabitants, which are among the cities of Cluster 2. All these large cities have higher green performance than the large cities of Cluster 3.
From the above results it can be said that population size influences total CGP but that other factors such as GDP, through its effect on investment capacity, also have an important influence on the total GCP. The same applies to other factors such as good governance, planning and managing cultures. This seems to be the case of some rich cities with very large populations found in this research.
The research shows a significant but low correlation (0.42) of the energy sector with total city GP (see Figure 4). A possible explanation could be that the indicators chosen to represent the energy sector only capture part of the relations between energy and the city economy. Energy intensity is a better indicator of energy efficiency but was not used in the index because it is not regularly monitored in cities worldwide, and especially in many cities in developing countries. For the same reason, other important indicators, such as energy consumed per sector and source (such as solid fuels, oil, gas, and nuclear) were not included.
It is well recognized that decisions on energy use and sources affect the green performance of key sectors such Air quality, Sanitation, Transport and Waste in a significant way. The results of this research showed that cities belonging to Cluster 1 and 2 have very good total green performance as well as a very high GP for the individual sectors. This can be seen as an indication that these cities have better overall energy and resource efficiency compared with the cities of Cluster 3.

3.4.5. Assessing the Claim that a Green City Is also a Sustainable and Liveable City

As shown in Figure 6, total green city performance is positively and significantly correlated with green performance in the environmental and socio-economic groups, and there is also a significant correlation between the green performance of the environmental and socio-economic groups.
The environmental group which contains several sub-groups related to infrastructure, strongly influences total GCP, with a correlation coefficient of 0.92. Several publications have also reported that environmental/infrastructure related issues are very often strongly present in many of the existing green city concepts, methodologies and indexes [21,22,26,32,33]. The significant correlation between the total GCP and the GP of the environment and socio-economic groups indicates that the IHS green city conceptual framework (GCCF) contains elements of the three pillars of the theory of sustainability which confirms the approach used to develop the conceptual framework. In the literature referred to in the Introduction, the definitions of green cities also very often included elements of sustainability, and sometimes the green city is also called a sustainable or eco-city [22]. As the IHS-GGCPI index method was developed using the IHS-GCF that contains key elements of the three pillars of the theory of sustainability, these results confirm that a green city as defined in the IHS-GCCF is also sustainable.
A strong positive and significant correlation was found between total green city performance and liveable city performance (r = 0.90). In Figure 2 and Figure 7, we can see that six out of the ten top green cities are also found among the ten most liveable cities, and eight of the ten cities with the lowest GCPs are also found among the ten cities with the lowest liveability performances.
The richest cities of Clusters 1 and 2 are more liveable that the cities in Cluster 3. Cites with large populations are in general less liveable than medium and small cities. However, it was found in the green city performance discussion, that some cities with large populations have very high liveability performance such as London, Sydney, Tokyo and Hong Kong.
The comparison of cities’ rankings for green city and liveability performance showed important variations. London for example, occupies ninth place among the top ten green cities (Figure 2) but is the second most liveable city (Figure 7). Similarly, Sydney is sixteenth in the GGP ranking but fourth in the liveability ranking. New York, Hong Kong, and Buenos Aires also have higher positions in the liveability ranking than in the GCP ranking. One possible explanation of why cities vary in their rankings in these two indexes is the weights assigned to the indicator in each index. The weights given in the liveability index are different from these same indicators in the green city index (see Table 1 and Table 3).
As explained in Items 2.1 and 2.1 of the Materials and Methods Section, the weights assigned for the indicators in each index represent the importance that is given for the indicator in relation to the key characteristics of the green city concept or the liveability concept. The characteristics of the green city and liveability concepts, although overlapping in some respect, have important differences. In the liveability concept, for example, the characteristics of the place and the ways a person living or visiting the place sees it and feels about it are more important than for the concept of green city [10,11].
Cities with high liveability in this research also score highly for green performance and are often found in the top positions of other liveability indexes [11,31] and environmental performance or sustainability indexes [23,30] which confirms the claim of our group that a green city as defined in our concept is also a sustainable and liveable city.

Author Contributions

The first author was responsible for the Supervision and Administration of the research including the Conceptualization, Methodology, Formal Analysis, Investigation, Validation, Writing-Review & Editing of the article. The second author was involved in the Investigation, Formal Analysis, Data Collection (data curation), Software (IBM SPSS) and Visualisation.

Funding

This research received no external funding.

Acknowledgments

The authors would like to thank Julia Skinner, Sharon Welsh and staff and colleagues at the IHS (EUR), for their inputs in the preparation and editing of the article.

Conflicts of Interest

The authors declare no conflict of interest.

Appendix A. Thematic Areas and Description of the Key Elements and Aspects of the IHS-GCCF Presented in Figure 1 of the Article

The IHS-GCCF contains seven thematic areas including diverse elements and aspects described below:

Appendix A.1. Green Transport and TOD

Green transport in this concept focuses on the improvement of the movement of people (accessibility) as a priority by promoting walking, cycling, efficient public transport, compactness and connectivity rather than on the improvement of movement of motorised vehicles. Key elements include: promotion of multimodal integration, taking into account affordability and accessibility in transport planning, promotion of extensive use of TOD practices, low or zero emission technologies, green fuels, and smart and electrical cars.

Appendix A.2. Green Urban Agriculture

The huge urban areas of our cities have increased the distances to bring and distribute food to consumers and consequently increase the consumption of fuels and greenhouse gases (GHGs) by the transport (freight) sector. Producing, processing, distributing, and consuming food near to the consumer markets helps to shorten the food supply chains, to reduce energy consumption and GHGs emissions and improve local air quality. Many cities are using new technologies and practice to develop and produce food on the rooftops of buildings and in vertical green farms.

Appendix A.3. Environmental Quality and Water Security

Environmental quality in our concept focuses on the application of green practices to keep and/or improve the quality of water, air and soil quality measured in terms of quality standards. Water efficiency and conservation are some practices cities are also adopting to deal with the problems related to water security.

Appendix A.4. ICT and Green Technologies

ICT in this concept include all related telecommunication technologies and smart tools available to facilitate the use of public and private services, to disseminate information, and to facilitate the integration, management and implementation of the actions proposed by each thematic area to contribute to the improvement of the overall GCP. Green technologies in this concept also include all technologies and practices leading to the improvement of energy production, consumption and resources efficiency.

Appendix A.5. Green Buildings

The building sector is one of the three most energy consuming sectors of cities. The thematic area focused on the extensive use of energy and resources efficiency in combination with the increment of the production and use of renewable energy in the sector. Key elements of this thematic area include the use of low development impact practices in the construction of new buildings and in the retrofit of the existing building stocks, the use of building energy labels and energy performance certificates to improve energy efficiency, the inclusion of building energy performance practices within the local or national building codes and the increase of recycling and reuse of building wastes together with the application of the building for dismantling technologies and approaches.

Appendix A.6. Greening Public Services

The term greening public services in this thematic area is used in reference to the energy efficiency and renewable energy practices used in the production of public services such as drinking water, wastewater, solid wastes, energy, etc. Another important element of this thematic area is the use of practices leading to the increase of physical resilience of the infrastructure systems to adapt them to future extreme climatic and non-climatic related events.

Appendix A.7. Green Infrastructure

Green Infrastructure in this concept deals primarily with storm water systems. It focuses on the building of new storm water systems or retrofit the existing ones to be able to reduce downstream floods and to improve the water quality of the receiving water bodies. Central elements in this thematic area are: the use of approaches leading to infiltrate, evaporate, retard or retaining part of the rain water near to source; use the construction of new storm water systems or retrofit the existing ones to increase greenery surfaces; improve site landscapes and the creation of multifunctional spaces for preservation of urban wildlife habitat and recreation; and promote the construction of green roofs, green facades, green linear corridors, wet land with or without detention ponds, urban parks and the use semi or permeable material such as interlocked bricks in walking sides and roads.

References

  1. Lehmann, S. What is green urbanism? Holistic principles to transform cities for sustainability. In Climate Change—Research and Technology for Adaptation and Mitigation; InTech: Rijeka, Croatia, 2011; Chapter 14; pp. 243–266. [Google Scholar]
  2. OECD. Compact City Policies: A Comparative Assessment, Paris ed.; OECD: Paris, France, 2013. [Google Scholar]
  3. Freire, M.E. Urbanization and Green Growth in Africa. Green Growth Series, Report Number 1; Growth Dialogue: Washington, DC, USA, 2013. [Google Scholar]
  4. Meadows, D.H.; Meadows, D.L.; Randers, J.; Behrens, W.W., III. The Limits to Gowth. A Report for the Club of Rome’s Project on the Predicament of Mankind; Universe Books: New York, NY, USA, 1972. [Google Scholar]
  5. WCED. Our Common Future; Oxford University Press: Oxford, UK, 1987. [Google Scholar]
  6. Campbell, S. Green cities, growing cities, just cities? Urban planning and the contradictions of sustainable development. J. Am. Plan. Assoc. 1996, 62, 296–312. [Google Scholar] [CrossRef]
  7. Tjallingii, S.P. Ecological Conditions. Strategies and Structures in Environmental Planning; TU Delft: Delft, The Netherlands, 1996. [Google Scholar]
  8. Duijvestein, K. Van duurzame ontwikkeling naar duurzaam bouwen en weer terug. Dubo Jaarboek 2002, 21, 15–21. [Google Scholar]
  9. Lowe, M.; Whitzman, C.; Badland, H.; Davern, M.; Hes, D.; Aye, L.; Butterworth, I.; Giles-Corti, B. Liveable, Healthy, Sustainable: What Are the Key Indicators for Melbourne Neighbourhoods? Research Paper 1, Place, Health and Liveability Research Program; University of Melbourne: Melbourne, Australia, 2013. [Google Scholar]
  10. National Research Council. Concept of Liveability and Indicators. Community and Quality of Life: Data Needs for Informed Decision Making; The National Academies Press: Washington, DC, USA, 2002. [Google Scholar]
  11. Economist Intelligence Unit. The Global Liveability Report 2017; The Economist: London, UK, 2017. [Google Scholar]
  12. Jabareen, Y.R. Sustainable urban forms: Their typologies, models, and concepts. J. Plan. Educ. Res. 2006, 26, 38–52. [Google Scholar] [CrossRef]
  13. UN Habitat. Habitat III Issue Papers on Urban and Spatial Planning and Design; UN Habitat: New York, NY, USA, 2015. [Google Scholar]
  14. Irrek, W.; Thomas, S. Defining Energy Efficiency; Wuppertal Institut fur Klima, Umwelt, Energie GmbH: Wuppertal, Germany, 2008. [Google Scholar]
  15. Energy Center Nederland (ECN). Resource Efficiency: What Does it Mean and Why is it Relevant; Energy Center Nederland: Petten, The Netherlands, 2013. [Google Scholar]
  16. Litman, T. Determining Optimal Urban Expansion, Population and Vehicle Density, and Housing Types for Rapidly Growing Cities. In Proceedings of the World Conference on Transport Research, Shanghai, China, 10–15 July 2016. [Google Scholar]
  17. Westerink, J.; Haase, D.; Bauer, A.; Ravetz, J.; Jarrige, F.; Aalbers, C.B.E.M. Compact city strategies in Europe compared for trade-offs. Science for environment. Science for Environment. Eur. Plan. Stud. 2013, 21, 473–497. [Google Scholar] [CrossRef]
  18. Matsumoto, T. Compact City Policies: Comparative Assessment. In 47th ISOCARP Congress; ISOCARP: The Hague, The Netherlands, 2011. [Google Scholar]
  19. Brilhante, O. The compact city versus making room for future city expansion in the context of Nampula, Mozambique. TRIALOG 2017, 128, 1. [Google Scholar]
  20. Kahn, M.E. Green Cities: Urban Growth and the Environment; Brookings Institution Press: Washington, DC, USA, 2007. [Google Scholar]
  21. Lindfield, M.; Steinberg, F. (Eds.) Green Cities; ADB: Manila, Philippines, 2012. [Google Scholar]
  22. Pace, R.; Churkina, G.; Rivera, M. How Green Is a Green City? A Review of Existing Indicators and Approaches; IASS: Potsdam, Germany, 2016. [Google Scholar]
  23. Economist Intelligence Unit. African, Asian and European Green City Index—Assessing the Environmental Performance of Major Cities; Siemens: Munich, Germany, 2010. [Google Scholar]
  24. Inter-American Development Bank (IDB). Evaluation of IDB’s Emerging and Sustainable Cities Initiative; Inter-American Development Bank: Washington, DC, USA, 2016. [Google Scholar]
  25. Zoeteman, K.; Zande, M.V.D. Integrated Sustainability Monitoring of 58 Eucities: A study of European Green Capital award Applicant Cities; Tilburg University: Tilburg, The Netherlands, 2015. [Google Scholar]
  26. European Bank for Reconstruction and Development (EBRD). Green City Program Methodology; European Bank for Reconstruction and Development: London, UK, 2016. [Google Scholar]
  27. European Union. European Green Capital 2018. Good Practice Report; European Comission: Brussels, Belgium, 2016. [Google Scholar]
  28. OECD. Green Growth Indicators 2014; OECD Publishing: Paris, France, 2014. [Google Scholar]
  29. Tamanini, J.; Bassi, A.; Hoffman, C.; Valenciano, J. The Global Green Economy Index. Measuring National Performance in the Green Economy; Dual Citizen Inc.: Washington, DC, USA, 2016. [Google Scholar]
  30. Arcadis. Sustainable City Index. Putting People at the Heart of City Sustainability; Arcadis: Rotterdam, The Netherlands, 2016. [Google Scholar]
  31. Parilla, J.; Trujillo, J.L.; Berube, A.; Ran, T. Global Metro Monitor. An Uncertain Recovery; Metropolitan Policy Program at Brookings: Washington, DC, USA, 2015. [Google Scholar]
  32. Asian Development Bank (ADB). Green City Development Tool Kit; Asian Development Bank: Manilla, Philippines, 2015. [Google Scholar]
  33. Sandhu, S.C.; Singru, R.N.; Bachmann, J.; Sankaran, V.; Arnoux, P. GrEEEn Solutions for Livable Cities; Asian Development Bank: Manilla, Philippines, 2016. [Google Scholar]
  34. Ayik, C.; Ayatac, H.; Sertyesilisik, B. A Gap Analysis on Urban Sustainability Studies and Urban Sustainability Assessment Tools. Archit. Res. 2017, 7, 1–15. [Google Scholar]
  35. Saha, D. Empirical research on local government sustainability efforts in the USA: Gaps in the current literature. Local Environ. 2009, 14, 17–30. [Google Scholar] [CrossRef]
  36. Derkzen, M.L.; Teeffelen, A.J.A.; Verburg, P.H. Quantifying urban ecosystem services based on high-resolution data of urban green space: An assessment for Rotterdam, the Netherlands. J. Appl. Ecol. 2015, 52, 1020–1032. [Google Scholar] [CrossRef]
  37. WCCD. World Council for City Data (WCCD, ISO37120). Available online: http://www.dataforcities.org (accessed on 10 October 2017).
  38. CDP. Formerly Carbon Disclosure Project. Available online: https://www.cdp.net/ (accessed on 10 October 2017).
Figure 1. IHS-Green City Conceptual Framework (IHS-GCCF).
Sustainability 10 02031 g001
Figure 2. IHS Green City Performance Ranking.
Sustainability 10 02031 g002
Figure 3. Sector Green Performance Correlation with Total Green City Performance.
Sustainability 10 02031 g003
Figure 4. Correlation coefficients of the green performance of selected Indicators with the total GCPs.
Sustainability 10 02031 g004
Figure 5. Average Values of the Data for Some Indicators per Cluster.
Sustainability 10 02031 g005
Figure 6. Correlations of Total Green City Performance with the Green Performances of the Groups.
Sustainability 10 02031 g006
Figure 7. Ranking of Green City and Liveability Performances.
Sustainability 10 02031 g007
Table 1. IHS-GGCPI: Groups, sectors, indicators, definitions and weights.
GroupSectorIndicator NameDefinitionsAverage Weights
Administrative areaGeographical (surface) area of the city for which the data was collected in km2
Socio economicSocio economicTotal populationNumber of inhabitants in administrative area9
Annual population growth per year% of growth in population in administrative area11
GDP per capitaGDP in US$ PPP, 210416
Life expectancyYears16
Gini index0 to 10018
Unemployment rate% of total population in the labour force17
Total internet penetration (ICT)Share of inhabitants connected to the internet by any access method in %13
EnvironmentCO2 and energyCO2 emissionsTotal CO2 emissions of the city divided by its population in tons per capita34
Electricity consumptionTotal electricity consumption of the city divided by its population in Gigajoules per capita23
Renewable electricityShare of renewable energy of total electricity consumption in %43
Green space and land useGreen spaces per capitaAll publicly accessible green areas in square meter per capita41
Population densityPopulation per square meter within administrative area of the city26
Population living in slumsShare of total population living in informal settlements in %33
TransportLength of mass transport networkHeavy rail, subway, metro, etc., in meter per 10,000 inhabitants42.5
Modal share private, motorized, transportModal share on a regular working day: % of regular work day trips24.5
Length of cycling lanesProtected bicycle lanes in meter per 10,000 inhabitants33
WasteShare of solid waste collected by the city% of waste collected by city government or official collection companies30
Share of solid waste recycledShare recycled of all solid waste produced in %39
Solid waste generated per capitaAll waste except construction waste in kilograms per capita31
WaterWater consumption per capitaTotal water consumed in litres per capita per day29.5
Unaccounted for water lossDifference between water produced and billed to end users in %35
Access to potable waterShare of total population with access to drinking water close to living quarters in %35.5
SanitationPopulation with access to improved sanitationShare of total population including sewerage and improved on-site sources excluding all public sources in %49
Share of waste water treatedShare of total waste water produced receiving at least primary treatment in %51
Air qualityDaily suspended particle levelsAnnual mean of PM10 levels in µg/m3100
Note: The indicators in grey cells are those also chosen to measure liveability performance. More explanation on the liveability indicators can be seen in Table 2.
Table 2. IHS-GGCPI matrix to calculate GCP over time and to explain any changes in the GCP.
Sustainability 10 02031 i001
Table 3. Indicators selected to form the liveability index.
Indicator NameDefinitionAverage Weight in %
Administrative area
Total populationNumber of inhabitants in administrative area1.5
GDP per capitaGDP in US$ PPP, 21049.5
Life expectancyYears10.0
Unemployment rate% of total population in the labour force10.0
Total internet penetration (ICT)Share of inhabitants connected to the internet by any access method in %9.0
CO2 emissionsTotal CO2 emissions of the city divided by its population in tons per capita3.0
Green spaces per capitaAll publicly accessible green areas in square meter per capita8.0
Population densityPopulation per square meter within administrative area of the city5.0
Length of mass transport networkHeavy rail, subway, metro, etc., in meter per 10,000 inhabitants8.0
Length of cycling lanesProtected bicycle lanes in meter per 10,000 inhabitants7.5
Share of solid waste collected by the city% of waste collected by city government or official collection companies7.0
Access to potable waterShare of total population with access to drinking water close to living quarters in %7.0
Share of waste water treatedShare of total waste water produced receiving at least primary treatment in %6.0
Daily suspended particle levelsAnnual mean of PM10 levels in µg/m38.5
Table 4. Main steps of the IHS-GGCPI method.
Sustainability 10 02031 i002

