Article

An Empirical Study on Effective Tax Rate and CEO Promotion: Evidence from Local SOEs in China

1
College of Business Administration, Capital University of Economics and Business, Beijing 100070, China
2
School of Business, Macau University of Science and Technology, Macau 999078, China
3
Bohai Property Insurance Company Limited, Tianjin 300071, China
4
International Business Faculty, Beijing Normal University, Zhuhai, Zhuhai 519085, China
5
Zhongshan Institute, University of Electronic Science and Technology of China, Zhongshan 528402, China
*
Authors to whom correspondence should be addressed.
Sustainability 2018, 10(6), 2007; https://doi.org/10.3390/su10062007
Submission received: 25 April 2018 / Revised: 4 June 2018 / Accepted: 4 June 2018 / Published: 14 June 2018
(This article belongs to the Section Air, Climate Change and Sustainability)

Abstract

:
This paper investigates the influence of effective tax payment on the CEO promotion in local State Owned Enterprise (SOE) in China. Based on the analysis of listed local SOEs in China from 2004 to 2010, this paper tests the relationship between CEO promotion and tax payment. In addition, the moderating effect of pyramid layer is tested. This paper finds that there is a significant positive relationship between Effective Tax Rate (ETR) and CEO promotion, which suggests that CEOs may be aggressive in tax payment to please the local governments, who ultimately own the local SOEs. The current paper also finds that the relationship between ETR and CEO promotion is weakened as pyramid layers increase. Our conclusions enrich the literature on CEO turnover and the role of pyramid structure. The conclusions are also helpful for the SOEs’ reform in China and other developing countries. First, this paper is among the first to investigate the relationship between ETR and CEO turnover. Second, this paper highlights the function of pyramid structure in mitigating government intervention. Third, this paper also adds to the research on effective tax.

1. Introduction

Although China has witnessed a massive wave of privatization in the past decades, many firms remain controlled by local governments, especially those that engage in such vital industries as energy, telecommunications, and public utilities. Those firms have been playing a crucial role in China’s economy (for example, in 2010, local SOEs account for 32% of all the listed firms in China and their market value and tax payment are both much higher than those of non-SOE firms (refer Appendix B for more details)), even if privatization becomes more and more popular in China [1]. Even though the Company Law (enacted in 1993 and amended several times afterwards) substantially mitigates government interference, China’s State Owned Enterprises (SOEs) CEO turnover is still subject not only to market factors, but also to bureaucratic factors.
Previous studies concerning CEO turnover in China mainly focuses on the link between CEO turnover and firm performance [2,3,4,5]. However, few, if any, studies specifically investigate the CEO turnover in those local SOEs. This paper aims to fill this gap. More importantly, because of their close connection with local governments, China’s local SOEs are an ideal sample to study the influence of authorities on corporate operations. To provide a new perspective, this paper investigates the political influence and undercovers the potential mechanism through which political factors may affect CEO turnover. Specifically, this paper posits that, for China’s local SOEs, CEO promotion is positively related to the Effective Tax Rate (ETR).
Contradicting the tax equity principle, the effective tax payment varies among firms that are supposed to pay the same amount of tax. Related studies document that the variation in ETR is likely resulted from political interference [6,7]. Built on the potential relation between ETR and political connections, this research inferences that ETR has substantial impact on the CEO turnover in China’s local SOEs. We attribute this relation to the fact that local governments, which ultimately control local SOEs and depend heavily on them for fiscal revenues, play an important role in evaluating the performance of local SOE’s CEO [3]. Accordingly, when CEOs manage to yield more tax to the local governments, they are more likely to get promotion.
To enrich this paper, we also investigate the potential impact from pyramid structure on the CEO turnover and ETR relationship. Prior literature finds that the prevalence of pyramid structure influences corporate operations in various ways [8,9,10,11,12]. Furthermore, this paper proposes that, when there are more layers in the pyramid structure, the interferences from local government will be further mitigated and, thus, the relation between ETR and CEO promotion will be weakened (hereafter, we refer this effect as the “mitigating effect” of the pyramid structure). Based on a sample consisting of 3367 observations from 719 local SOEs, we use Logit regression models to test the relationship between tax payment and CEO promotion and the moderating effect of pyramid structure. In the Section 5.2, the results indicate that marketization significantly weakens the mitigating effect of the pyramid structure. The finding suggests that, with the development of market infrastructure, the role of pyramid structure in reducing political interference becomes less significant.
This paper contributes to both finance and accounting literature in the following ways: First, this paper investigates how ETR affects CEO turnover, which enriches literature on CEO turnover. Although the research samples is China’s local SOEs, the findings are also valuable to other developing economies where governments still have substantial power and incentive to intervene in corporations. Second, this paper highlights the function of pyramid structure in mitigating government interventions. The empirical findings on the CEO promotion lend support to the argument of Fan, Wong, and Zhang (2013) [13]. Third, this paper also adds to the research on effective tax. The finding indicates that, for those firms ultimately controlled by local authority, top management has strong incentive to effectively pay more tax in exchange for their career promotion.
The rest of this paper proceeds as follows: Section 2 reviews related literature and develops our hypotheses; Section 3 presents data and methodology; Section 4 reports empirical tests for our main findings; Section 5 provides additional tests; and Section 6 concludes.

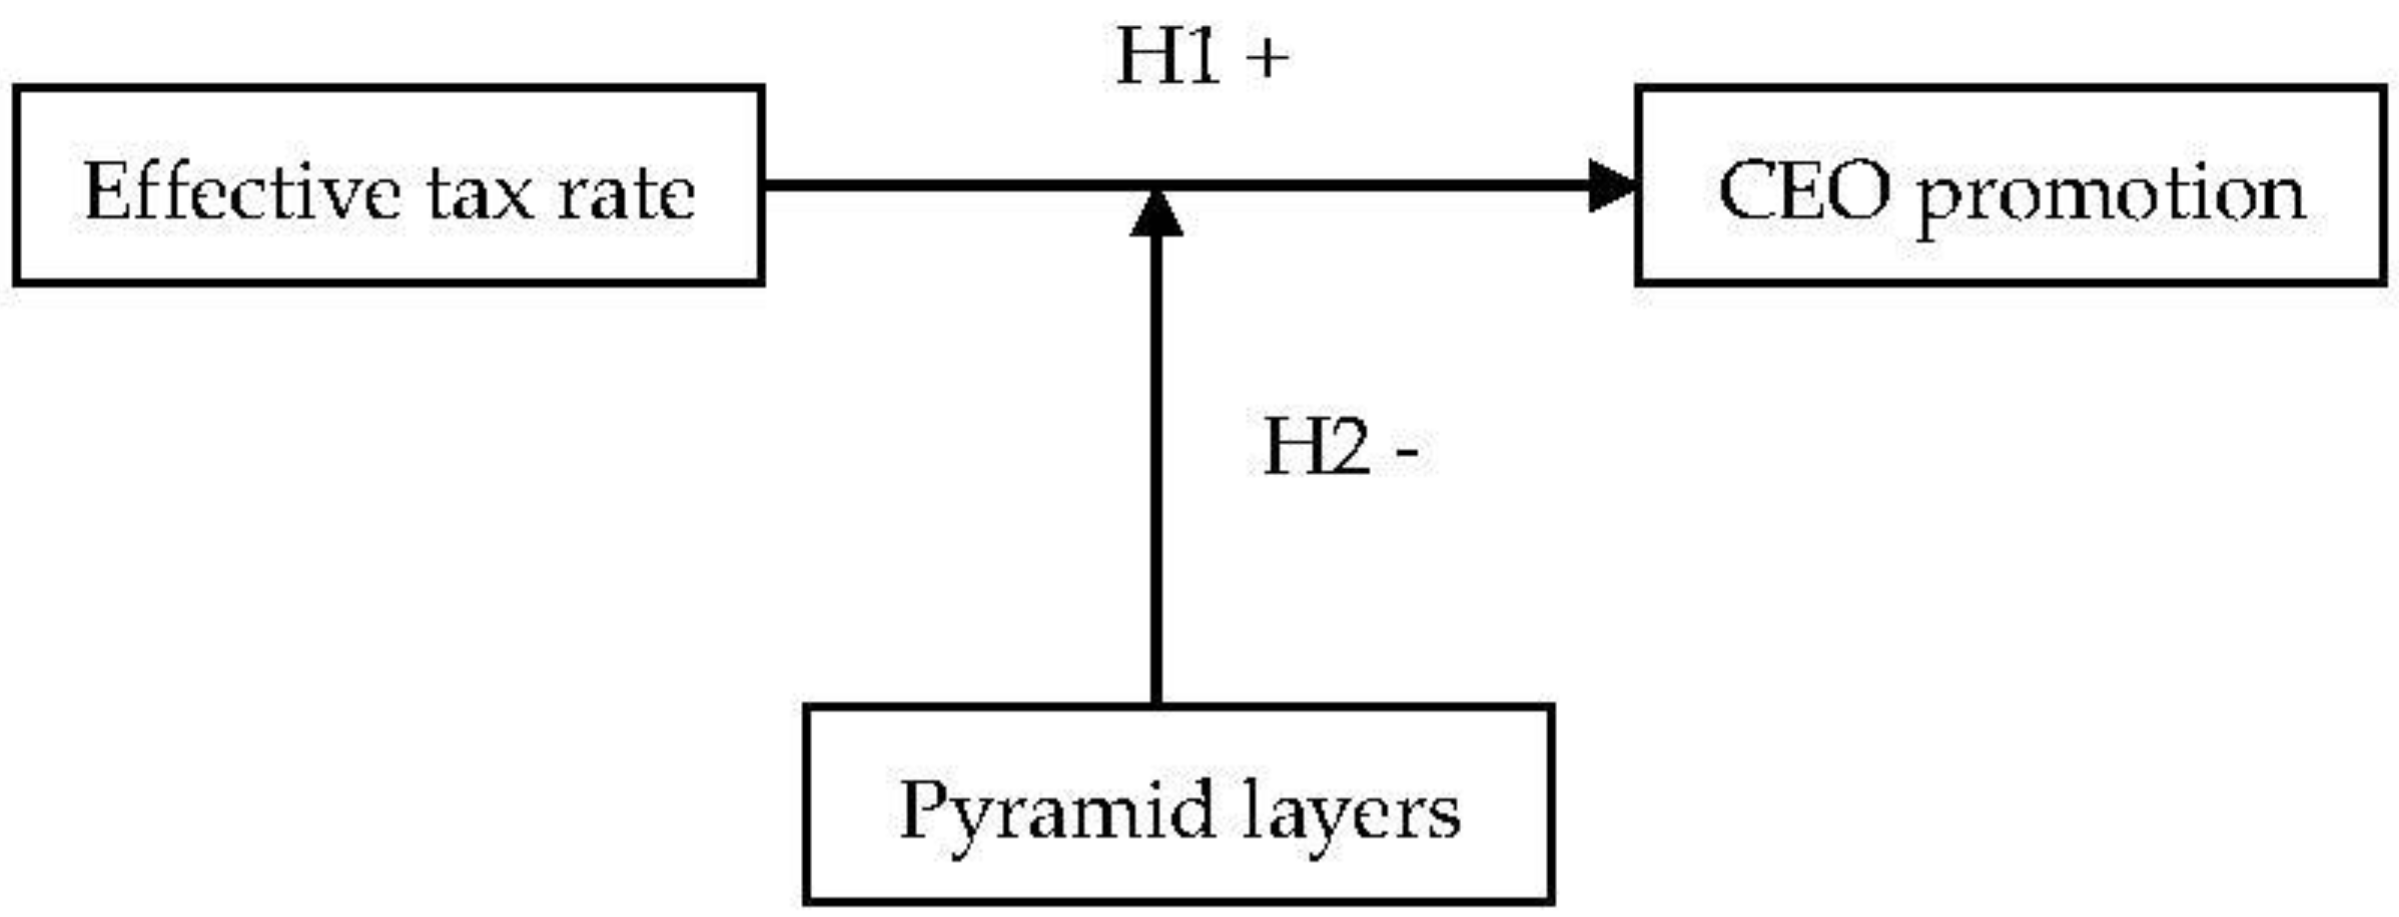
2. Literature Review and Hypotheses Development

The issue of CEO turnover has been a widely-discussed research topic for the past decades. Prior literature has investigated the topic from various aspects. One popular stream of literature finds that firm performance plays an important role in CEO turnover. For example, according to Warner et al. (1988), when the stock price of a listed firm is very low, the probability of its CEO turnover will increase [14]. In addition to stock price, other studies find that, if a firm’s actual performance does not reach securities analysts’ expectation, its CEO turnover is more likely to happen [15,16].
Another stream of literature analyzes the power dynamics within top management and identifies political reasons of CEO turnover. For example, Boeker (1992) founds that, if a firm’s performance decreases, its CEO is more likely get fired. In addition, the probability of being fired is higher for CEOs with greater power [17]. Shen and Cannella (2002) used different variables to measure CEO power, and found that CEOs with less power are more likely to be fired [18]. Zhang (2006) found that, if there is a successor of CEO inside a firm, its CEO is more likely to be fired, especially when its performance is not sufficient [19]. Rizzotti et al. (2017) found that family owners are able to ensure a prompt replacement of an underperforming CEO only when the CEO is not a family member but rather an outside professional [20].
More recent research sheds light on the influence of legitimacy in organizational sociology on CEO dismissal. For example, Arthaud-Day et al. (2006) found that, if financial restatement occurs, the CEO, CFO, outside directors and directors in audit committee are more likely to leave the firm, so that the firm can get legitimacy again [21]. Cowen and Marcel (2011) found that, to get resources and other kinds of support from stakeholders, firms tend to fire those directors involved in a financial fraud [22]. There are also some studies directly examining how outside stakeholders affect CEO turnover, such as securities analysts [23] and media [24].
In the context of China, related literature has largely focused on the relationship between firm performance and CEO turnover. For example, Pessarossi and Weill (2012) found that CEO turnovers are generally followed by positive stock market reactions for the enterprises owned by the central government (the central SOEs) [2]. Kato and Long (2006) found that CEO turnover and firm performance are negatively related. They point out that, however, the relation is less significant for central SOEs which are subject to mutually conflicting objectives [3]. Chang and Wong (2009) found that the firm performance improves after CEO turnover only for loss-making SOEs [4]. Chen, Li, Su and Yao (2012) studied the business groups in China and found that the turnover–performance link in member firms is weakened by the delegation of decision rights [5]. Using a sample of listed non-SOEs in China, Cao et al. (2017) found that the existence of political connection weakens the turnover–performance sensitivity [25].
Some studies also focus on the political issues. For example, You and Du (2012) examined the political connections of SOEs in China. They found that CEOs with close political connections are less likely to be fired and that the sensitivity of forced turnover to firm performance is weaker for connected CEOs than for non-connected firms [26].
Although prior literature sheds some light on the political influence on CEO turnover in China, the mechanism remains obscure. Therefore, this paper tries to capture one mechanism through which political factors cast influences on corporate operations by observing the relationship between ETR and CEO turnover of local SOEs.
According to a thorough review on tax research [27], ETR is generally viewed as a measure of tax avoidance in most accounting literature. Some related studies document that the variation in ETR is likely to result from political issues. For example, Zimmerman (1983) studied the US market and argued that firms with political connection pay more effective tax than those without this kind of connection [6]. Adhikari, Derashid, and Zhang (2006) investigated the developing market of Malaysia and found that ETR is significantly lower for the firms with political connections. They concluded that, in a “relationship-based” economy, political connections are a significant determinant of effective taxation [7].
In such a transitional economy as China, although listed on the stock market and partially tradable to the public, the local SOEs are ultimately owned by local governments which have great influence on CEO promotion [28,29,30,31,32,33,34]. In China’s capital market, there are three kinds of listed companies in terms of the nature of ultimate controller: central SOEs, local SOEs and non-SOEs. Central SOEs are those state-owned enterprises owned by the central government, while local SOEs are those state-owned enterprises owned by the local (province-level) government [35,36,37,38,39,40,41]. In this paper, we focus on local state-owned listed companies as they are so important in China’s economic development (see Appendix B). In addition, local government has direct impact on local SOEs, and local government officials are faced with the pressure of tax assessment, which is related to our topic of the relationship between tax payment and CEO turnover. When it comes to taxation, CEOs of local SOEs have two conflicting goals: on the one hand, they are expected by shareholders to reduce tax payment through tax avoidance, while, on the other hand, they have great incentives to please local government by aggressive tax payment.
Since a local government relies heavily on the actual tax paid by local SOEs for its fiscal revenue, a CEO is more likely to be promoted if the local SOE pays more tax to local government. That yields the first hypothesis:
Hypothesis (H1):
CEO promotion is positively related to ETR in China’s local SOEs.
SOEs generally bear policy costs such as excessive taxation, employment duties or other policy burdens which substantially lower the operating efficiency [42,43]. To mitigate the political costs, some local governments employ pyramids structure to credibly reduce government interference on SOE. Fan, Wong and Zhang (2013) found that the number of a firm’s pyramidal layers is negatively related to local government’s incentive to intervene in the firm’s operating decisions [13]. Thus, one can make reasonable inference that, for SOEs with extensive pyramidal structures, local governments have less influence on the CEO’s promotion. That yields the second hypothesis:
Hypothesis (H2):
The relation between ETR and CEO promotion is weakened for local SOEs with more pyramidal layers.
Our theoretical model consisting of the above hypotheses is shown in Figure 1.

3. Data and Methodology

3.1. Data

The original sample covers all listed local SOEs from 2004 to 2010. The date on the financial information and ownership structure is collected from the China Stock Market Accounting Research (CSMAR) database (CSMAR started disclosing the information on all listed firms’ ultimate controlling shareholders in 2004). We manually collected the information on CEO promotion from the announcements of listed local SOEs and excluded the data on those firms which are: (1) in financial industry; (2) missing data on certain variables; or (3) with ETR lower than 0 or higher than 1. The final sample consists of 3367 observations from 719 local SOEs.

3.2. Variable Measurements and Model Specification

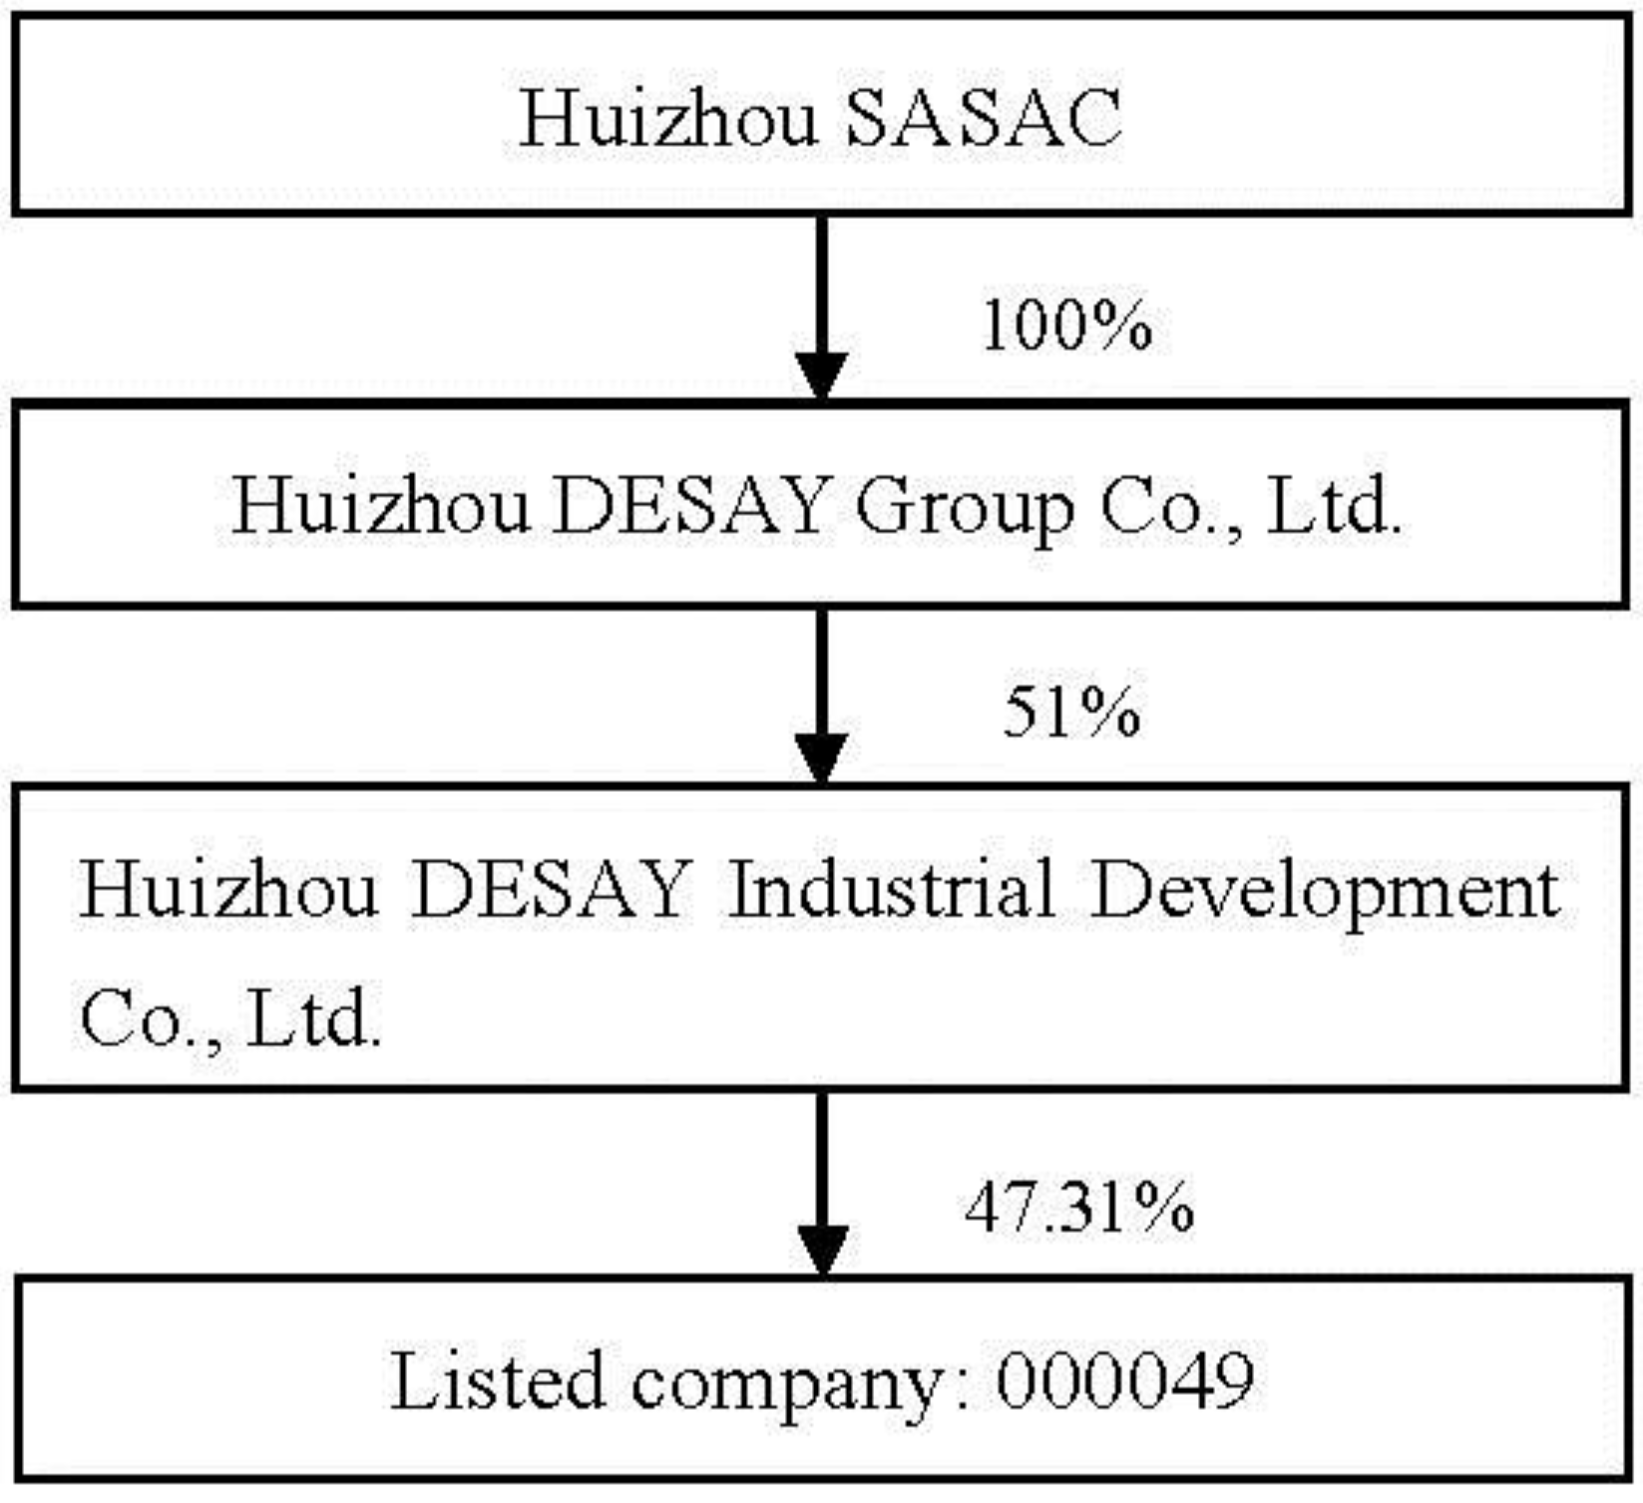
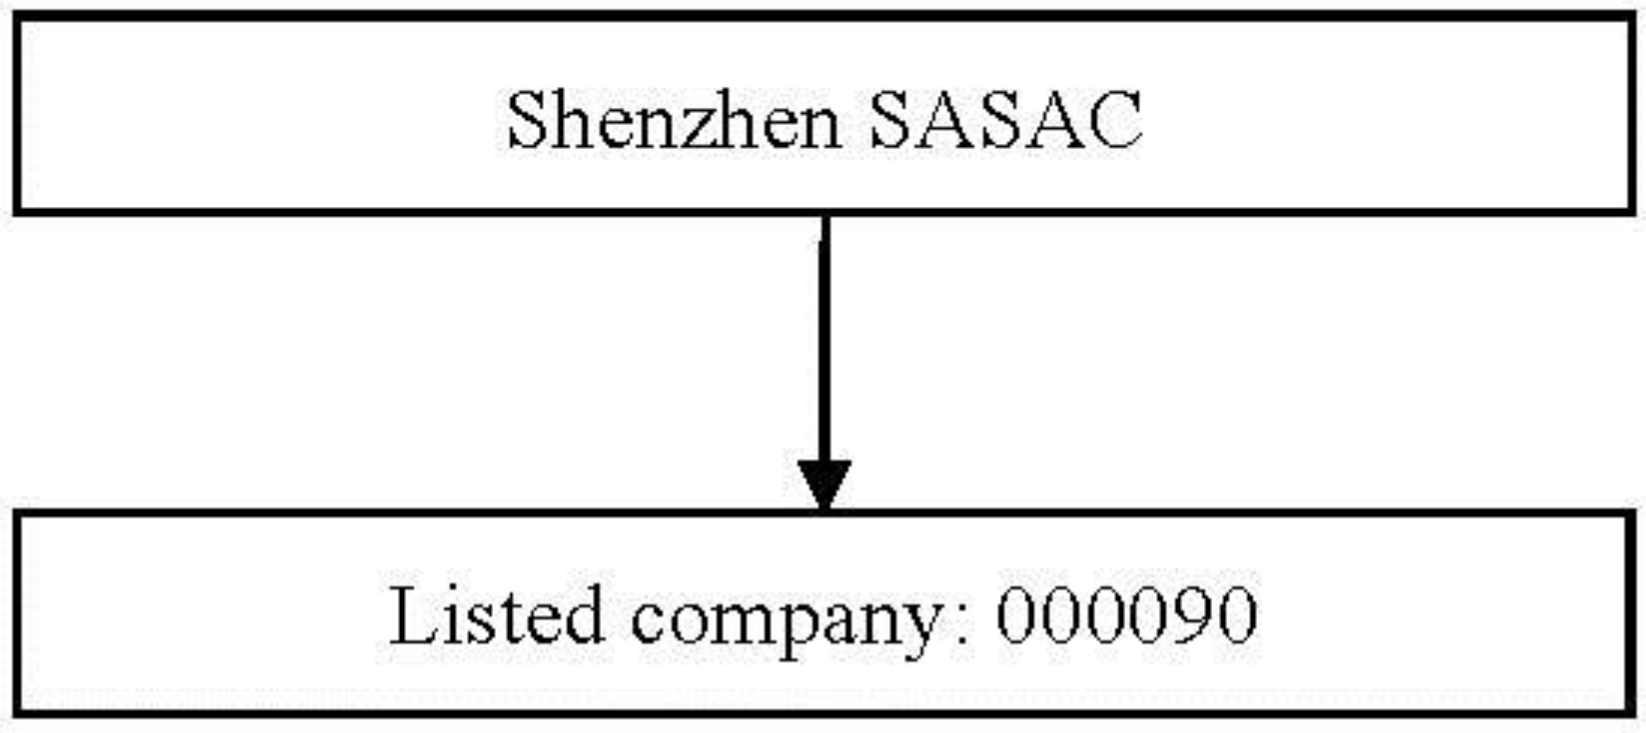
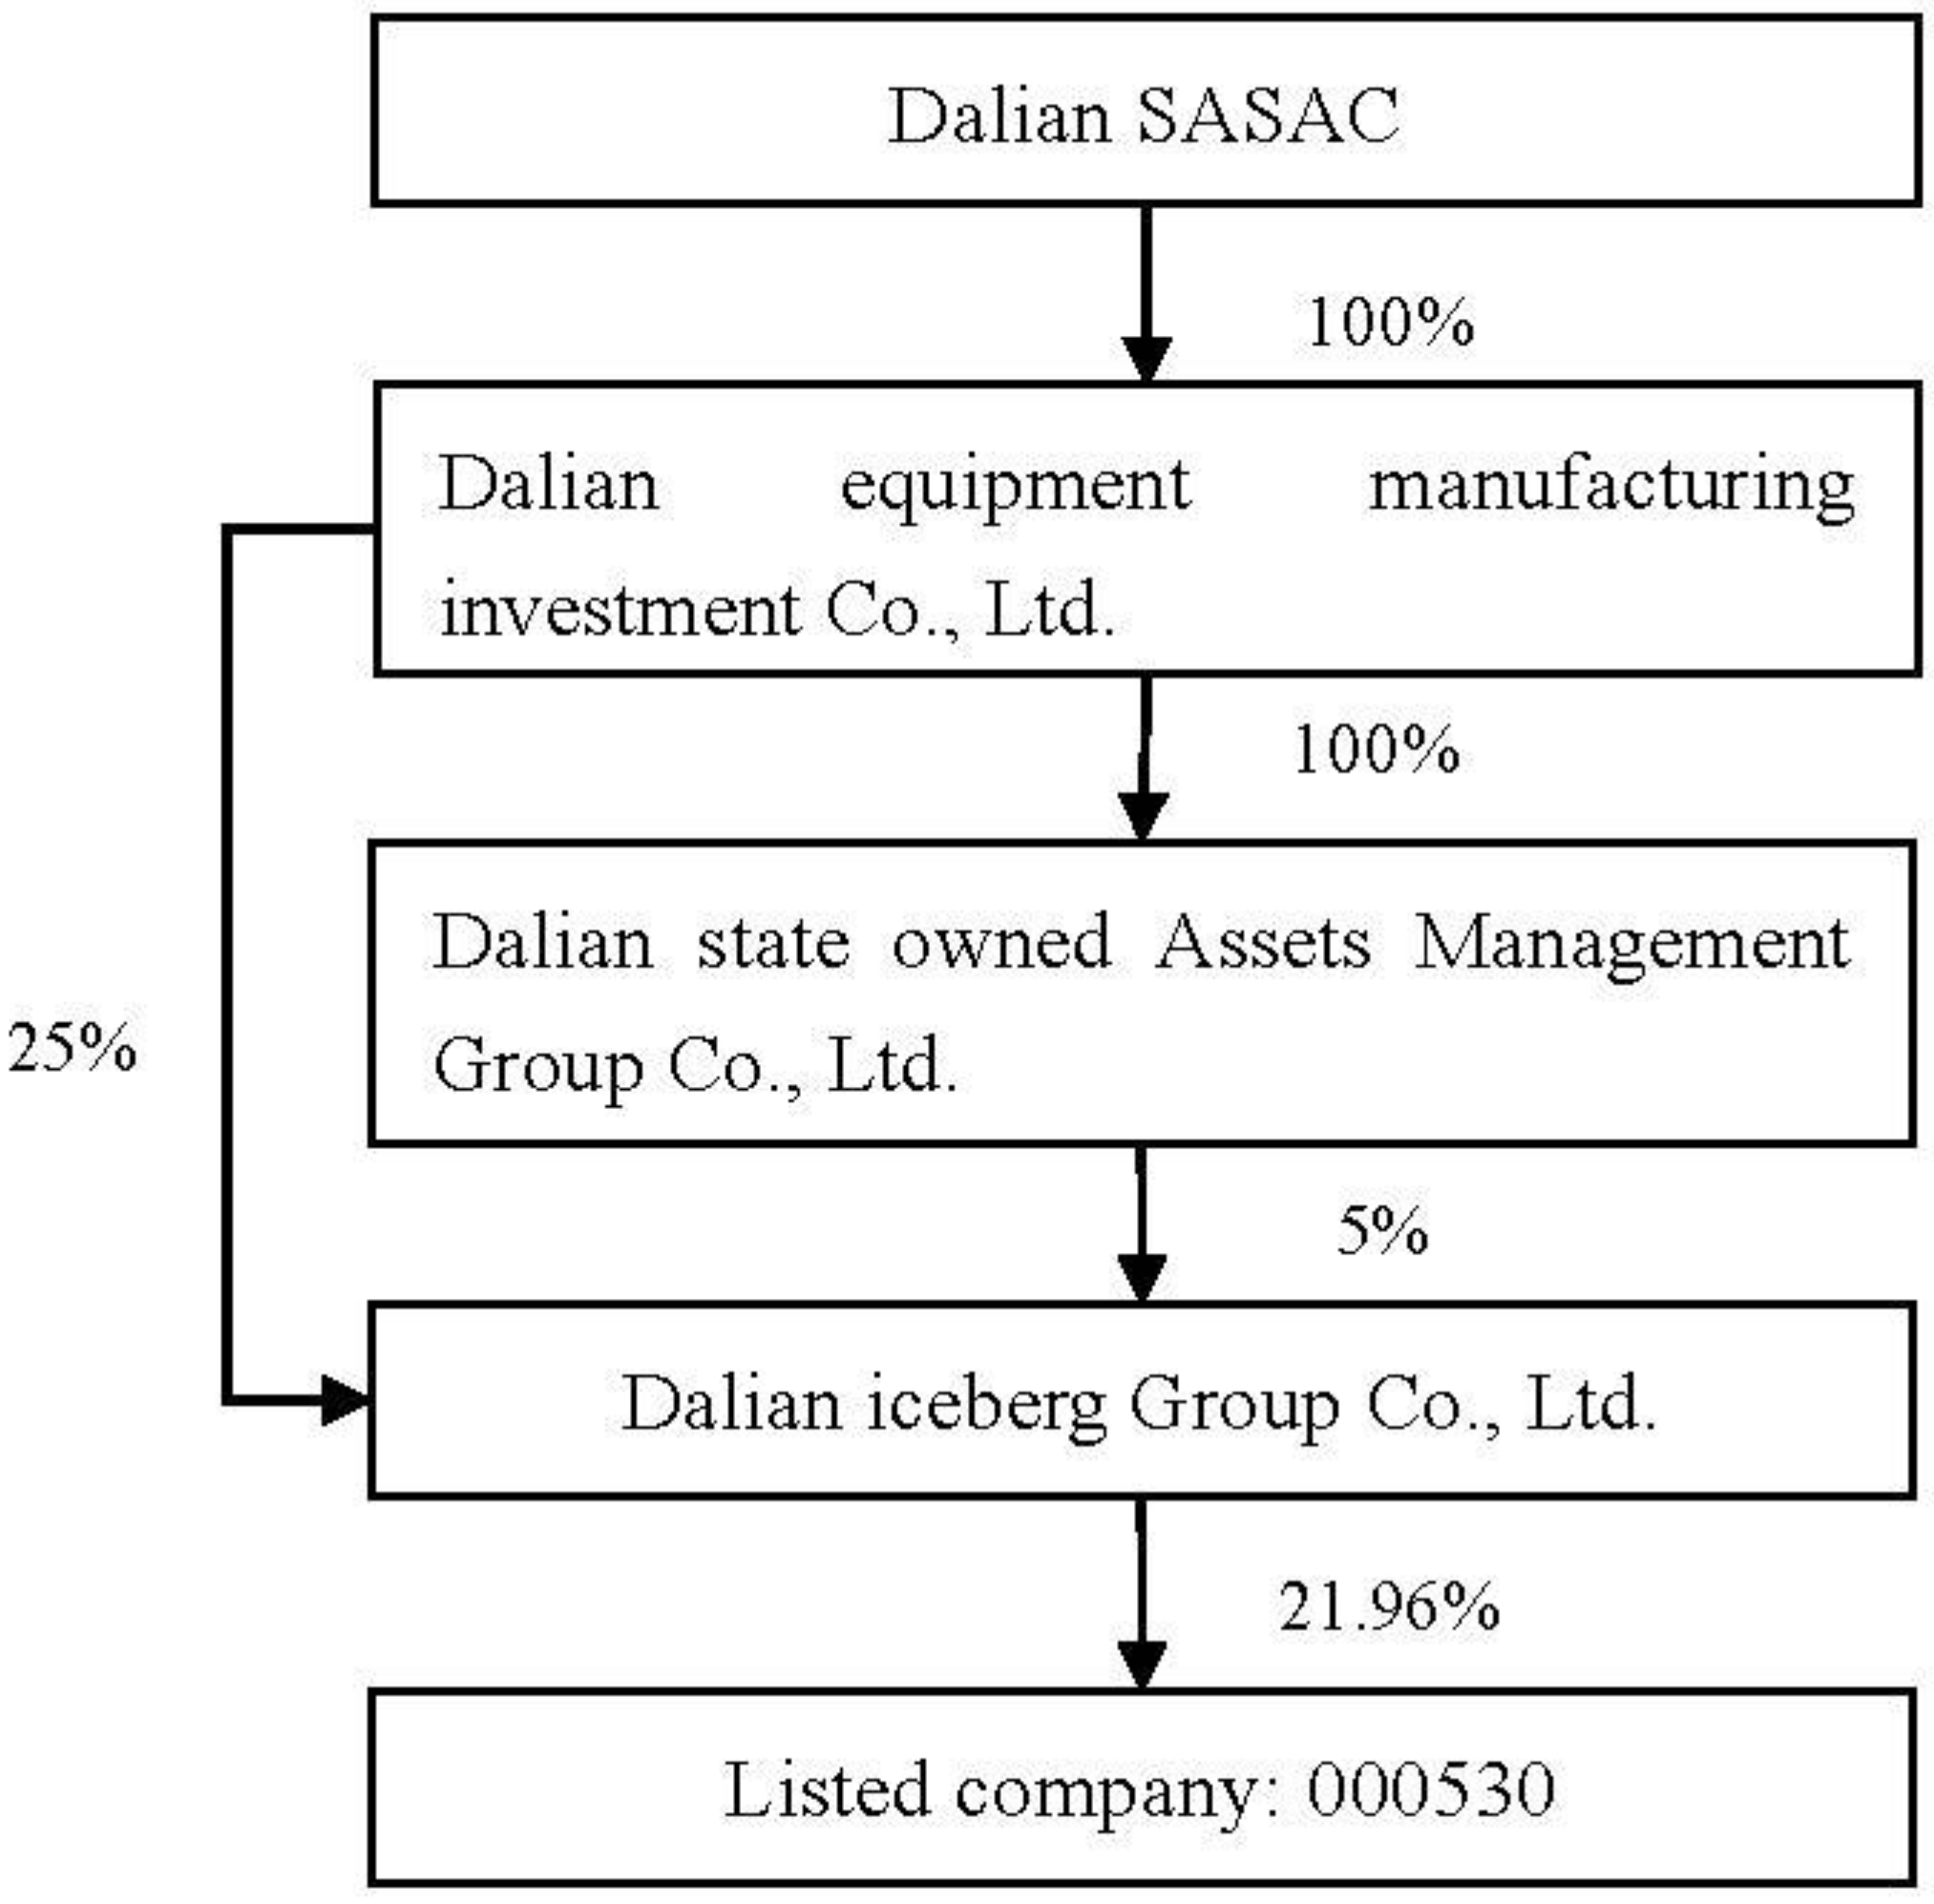
3.2.1. Pyramid Layer

Following Fan et al. (2013) [13], we counted the number of intermediate layers between the listed company and its ultimate controlling shareholder to compute the variable layer. If there are multiple chains connecting a listed local SOE and the corresponding local government, we chose the longest chain to calculate its layer.
The examples below illustrate how we compute the pyramid layers for a local SOE. Figure 2 shows the ownership structure of a local SOE with the ticker symbol “000090”. The firm is directly controlled by its ultimate controlling shareholder, the Shenzhen State-owned Assets Supervision and Administration Commission (SASAC), without any intermediate layers. In this case, the number of layers is one.
Figure 3 shows the ownership structure of another local SOE with the ticker symbol “000049”. This firm is indirectly controlled by Huizhou SASAC with two layers between them. In this case, the number of the layers is three. Figure 4 shows a more complicated ownership structure. There are two chains on the ownership structure between the listed local SOE “000530” and its ultimate controlling shareholder, Dalian SASAC. However, we only focused on the longer chain (the right one). In this chain, there are three intermediate layers between the listed local SOE and its ultimate controlling shareholder, indicating the number of layers is four.

3.2.2. Effective Tax Rate

Prior literature has established various measures on the ETR, which represents the average rate of tax payment per unit of income or cash flow. Two widely used measures are the GAAP ETR and cash ETR [27]. GAAP ETR, defined as the total income expenses divided by the pre-tax accounting income, affects accounting earnings only. Cash ETR, on the other hand, defined as the cash tax payment divided by the total income, measures the actual tax payment per unit of pre-tax book income and thus has no impact on accounting earnings. Since this paper is interested in the actual amount of tax paid to local government each year, we used the cash ETR in the following analysis.

3.2.3. Model Specification

To test the hypotheses, we propose the regression model as follow:
L n ( P ( p r o m o t i o n = 1 ) 1 P ( p r o m o t i o n = 1 ) ) = α + β 1 T a x r a t e + β 2 S i z e + β 3 R o a + β 4 N o 1 s h a r e + β 5 D u a l + β 6 P e r c e n t a g e + β 7 C e o s h a r e + β 8 C e o a g e + β 9 C e o t e n u r e + β 10 S t + β 11 i = 1 11 i n d + β 12 i = 1 6 y e a r + ε
The promotion is a dummy variable which equals one if the CEO of a local SOE is promoted and zero otherwise. According to Zhang (2006) [19], we used Logit regression analysis method, since the dependent variable is a dummy variable. ETR is the effective tax rate and is calculated as the local SOE’s cash tax payment divided by its total income. In addition, in line with previous literature [19,24], the control variables are defined as follows:
Size, which refers to firm size, is the natural logarithm of a company’s total asset. Roa, which refers to return on assets, is calculated as the net profit divided by total asset. No1share represents the largest shareholder’s shareholding ratio. Dual equals one if the CEO and board director is the same person and zero otherwise. Percentage measures the ratio of independent directors in the board and is calculated as the number of independent directors divided by board size. Ceoshare measures the CEO’s shareholding ratio with respect to the total shares outstanding. Ceoage is the CEO’s age and Ceotenure is the CEO’s tenure. ST is a dummy variable and equals to one if the local SOE receives “Special Treatment” and zero otherwise. (“Special Treatment” occurs when a listed firm is in abnormal financial conditions which make investors unable to judge the future of the firm and may endanger the interests of investors. Under regulations of Shenzhen Stock Exchange and Shanghai Exchange, the firm will be marked ST ahead on the stock market. When the abnormal conditions return to normal conditions, the ST will be removed.) Since CEOs are evaluated per their performance in the past year, we lag the related variables by one period.

4. Empirical Results

4.1. Descriptive Summary and Correlation Coefficients

Table 1 presents the descriptive statistics. As the variable of interest of this paper, ETR has a mean value of 22.2% and maximal value of 74.3%. The local SOEs in our sample have 2.26 layers on average. The minimal number of layers is one, which means those local SOEs are directly controlled by local governments. On average, CEO owns 0.8% of a local SOE’s total shares, while the largest shareholder holds around 40%.
Table 2 shows the correlation coefficients. Consistent with H1, the relationship between CEO promotion and ETR is positive and significant at 10% level. As for control variables, Dual is negatively related to promotion. That is because we label a CEO as promoted if the CEO takes the position of chairman. Evidently, if a CEO also holds the position of chairman, he/she will not be promoted in this way. In addition, the maximum value of correlation coefficients is 0.3, which shows that there is no severe multicollinearity problem.

4.2. Regression Results

Table 3 reports the logit regression results. Model 1 provides a base model which consists of only control variables. Model 2 includes the main effect of ETR on local SOE’s CEO promotion. The results of Model 2 show that the estimated coefficient of ETR is positive and significant at 5% level, indicating that ETR is positively related with CEO promotion, which supports H1.
To test the mitigating effect of pyramid layer on H2, we add an interaction term, Layer*ETR, which is the production of pyramid layers and ETR. Model 3 presents the results after adding this interaction term. As shown in this model, the estimated coefficient of ETR is significantly positive, while the estimated coefficient of Layer*ETR is negative and significant at 10% level. The result suggests that ETR and CEO promotion is positively related and the pyramid layer weakens the relationship between CEO promotion and ETR, which supports H2.

5. Additional Tests

5.1. Robustness Tests

To test the robustness of above conclusions, we conduct two tests as follows.
First, local governments not only collect tax payment from local SOEs, but also receive dividends as major shareholders, thus it is possible that dividend payment, rather than tax payment, contributes to CEO promotion. To address this issue, we include a new controlling variable, Dividend received by local government, to test whether our hypotheses still hold. Model 4 and Model 5 in Table 4 present the regression results with Dividend added to our basic model. The estimated coefficient of ETR is 1.254, significantly positive at the 5% level, in Model 4, indicating that ETR is still positively related to CEO turnover, which supports H1. Model 5 shows that H2 is also supported, evidenced by the significantly negative estimated coefficient of the interaction term Layer*ETR.
Second, prior literature argues that, when the major shareholders’ control rights are greater than cash flow rights, they are more likely to expropriate minority shareholders [12]. Pyramid layer is often highly related to the separation of these two rights. Accordingly, there may be an alternative explanation that, when layers increase, the separation between those two right enlarges, and thus local government can “tunnel” more resources through the pyramid structure. In this way, local government may rely less on tax. The existence of mitigating effect of pyramid layer might be due to the role of pyramid structure in “tunneling” resources, not the role in decreasing political interference. To exclude this alternative explanation, the mitigating effect of the separation of two rights is tested. Model 6 in Table 4 provides these results. As shown in this model, the coefficient of the integration term of separation and ETR is not significant. Thus, this alternative explanation is eliminated.

5.2. The Role of Marketization

As the largest developing economy in the world, China has experienced various degrees of marketization across different regions. This is mainly because the economic reform that started in 1978 was pushed gradually. In particular, some provinces in the southeast part of China implemented the opening up policy first, and then the policy fanned out to the internal provinces. Usually, the provinces which began with the reform first have higher marketization degree, while the degree of provinces which began with the reform later is lower. In this section, we investigate whether the mitigating effect of pyramid structure can be affected by the various degree of marketization.
With higher degree of marketization, government interference itself is limited. Consequently, the role of pyramid structure in mitigating governmental intervention becomes less necessary, which suggests that the mitigating effect of pyramid structure is less observable. To test this inference, we divide the original sample into two subsamples per the median of marketization index and test the mitigating effect in these two subsamples, respectively. The subsample with marketization index above the median is referred to as HIGH and the subsample with marketization index below the median is referred to as LOW.
Model 7 and Model 8 in Table 5 present the regression results for the subsamples HIGH and LOW, respectively. As predicted, the estimated coefficients of Layer*ETR are both negative but only significant in LOW subsample, indicating that the mitigating effect of pyramid structure is evident only in low marketization scenarios.

6. Conclusions

This paper investigates CEO turnover in local SOEs in China from a new perspective. Specifically, we find positive relationship between CEO promotion and effective tax rate (ETR) for those SOEs controlled by local governments in China. The finding suggests that CEOs tend to aggressively pay more tax to local governments for their own career promotion at the expense of minority shareholders’ interest. We further find that the CEO promotion-ETR relationship is weakened when there are more layers in pyramid structure between a SOE and its ultimate owner. The mitigating effect arises from the pyramidal structure’s role in separating governmental intervention from corporate operations. Furthermore, we find that the mitigating effect is only evident in less marketized regions where SOEs are subject to greater governmental intervention.
Our findings are robust to several sensitivity tests: First, we eliminate the possibility that CEO promotion is resulted from dividend payment rather than tax payment by including dividend paid to local government as a control variable. Second, the results find that there is no significant mitigating effect of the separation of the right of control and the right of cash flow, which excludes the alternative explanation that local state-owned pyramid structure plays a role of “tunneling” resources.
This paper adds to the accounting and finance literature concerning the CEO turnover topic and contributes to the growing body of research literature regarding the developing market of China. Our conclusions also have practical implications. For example, in the new round of state-owned enterprise reform, government intervention should be reduced, and CEOs of SOEs should be evaluated in a market-oriented way. In addition, the minority shareholders of state-owned listed companies should pay attention to protecting their interests, since the interests of the government (the largest shareholder) and CEO are aligned together.
There is no doubt that this paper has limitations, and these limitations are the future research directions. For instance, in addition to tax payment, there may be other bureaucratic factors which can affect CEO turnover in SOEs. In the future, these factors should be identified and empirically tested. In addition, we have only examined the role of pyramid structure in reducing government intervention in this paper. In the future, we can explore more situational variables which can affect the relationship between bureaucratic factors and CEO turnover in SOEs. This kind of exploration will not only enrich literature, but also be helpful for SOEs reform in China and other developing countries.

Author Contributions

Writing: K.W., H.Z., and S.-B.T.; Providing idea and data: J.J. and Y.S.; and Providing revision advice: S.-B.T., J.W.

Acknowledgments

This research was supported by the National Natural Science Foundation of China (Grant Number: 71702114), the National Social Science Fund of China (Grant Number: 18VSJ084).

Conflicts of Interest

The authors declare no conflict of interest.

Appendix A. Variable Definitions

Layer: Calculated as the number of intermediate layers between the listed company and its ultimate controlling shareholder in the longest chain (no unit).
Promotion: Dummy variable which equals one if the CEO of a local SOE is promoted and zero otherwise (no unit).
ETR: Effective tax rate calculated as a listed company’s real tax divided by pre-tax net income (unit: percentage).
Size: Corporate size calculated as the natural logarithm of a company’s total asset (no unit).
Roa: Return on assets calculated as net profit divided by total asset (no unit).
No1share: The largest shareholder’s shareholding ratio (unit: percentage).
Dual: Dummy variable which equals one if the CEO also holds the position of chairman and zero otherwise (no unit).
Percentage: The percentage of independent directors in a board calculated as the number of independent directors divided by board size (unit: percentage).
CEOshare: CEO’s shareholding ratio (unit: percentage).
CEOage: CEO’s age (unit: years old).
CEOtenure: CEO’s tenure (unit: years).
ST: Dummy variable which equals one if a firm receives “Special Treatment” and zero otherwise (no unit).

Appendix B. The Importance of Local SOEs

Table A1. Comparison of Listed Companies with Different Nature of Ultimate Controller from 2004 to 2010, Calculated using the Average Dollar Exchange Rate in 2010.
YearTypeLocal SOECentral SOEPrivate Firm
2004Number700228426
Asset (billion dollars)392.2332.5202.1
Tax (billion dollars)4.05.61.0
2005Number683237431
Asset (billion dollars)438.1397.8226.8
Tax (billion dollars)4.16.61.2
2006Number665262507
Asset (billion dollars)622.62502.8335.6
Tax (billion dollars)5.414.61.8
2007Number678273597
Asset (billion dollars)847.54744.4517.4
Tax (billion dollars)8.739.03.8
2008Number668294640
Asset (billion dollars)1026.55551.0604.7
Tax (billion dollars)6.623.82.4
2009Number661314776
Asset (billion dollars)1262.67065.4795.4
Tax (billion dollars)8.433.25.1
2010Number6813351089
Asset (billion dollars)1622.49852.91185.1
Tax (billion yuan)12.947.98.1

References

  1. Marques, R.; Berg, S. Risks, Contracts and Private Sector Participation in Infrastructure. J. Constr. Eng. Manag. 2011, 137, 925–933. [Google Scholar] [CrossRef]
  2. Pessarossi, P.; Weill, L. Does CEO Turnover Matter in China? Evidence from the Stock Market. J. Econ. Bus. 2012, 70, 27–42. [Google Scholar] [CrossRef]
  3. Kato, T.; Long, C. CEO Turnover, Firm Performance, and Enterprise Reform in China: Evidence from Micro Data. J. Comp. Econ. 2006, 34, 796–817. [Google Scholar] [CrossRef]
  4. Chang, E.C.; Wong, S.M.L. Governance with Multiple Objectives: Evidence from Top Executive Turnover in China. J. Corp. Financ. 2009, 15, 230–244. [Google Scholar] [CrossRef]
  5. Chen, C.; Li, Z.; Su, X.; Yao, Y. Delegation and Sensitivity of CEO Turnover to Firm Performance within Business Groups: Evidence from China. J. Account. Public Policy 2012, 31, 553–574. [Google Scholar] [CrossRef]
  6. Zimmerman, J.L. Taxes and Firm Size. J. Account. Econ. 1983, 5, 119–149. [Google Scholar] [CrossRef]
  7. Adhikari, A.; Derashid, C.; Zhang, H. Public Policy, Political Connections, and Effective Tax Rates: Longitudinal Evidence from Malaysia. J. Account. Public Policy 2006, 25, 574–595. [Google Scholar] [CrossRef]
  8. Bae, K.; Kang, J.; Kim, J. Tunneling or Value Added? Evidence from Mergers by Korean Business Groups. J. Financ. 2002, 57, 2695–2740. [Google Scholar] [CrossRef]
  9. Bertrand, M.; Mehta, P.; Mullainathan, S. Ferreting out Tunneling: An Application to Indian Business Groups. Q. J. Econ. 2002, 117, 121–148. [Google Scholar] [CrossRef]
  10. Morck, R.; Yeung, B. Agency Problems in Large Family Business Groups. Entrep. Theory Pract. 2003, 27, 367–382. [Google Scholar] [CrossRef]
  11. Morck, R.; Wolfenzon, D.; Yeung, B. Corporate Governance, Economic Entrenchment, and Growth. J. Econ. Lit. 2005, 43, 655–720. [Google Scholar] [CrossRef] [Green Version]
  12. Lin, C.; Ma, Y.; Malatesta, P.; Xuan, Y. Ownership Structure and the Cost of Corporate Borrowing. J. Financ. Econ. 2011, 100, 1–23. [Google Scholar] [CrossRef] [Green Version]
  13. Fan, J.P.H.; Wong, T.J.; Zhang, T. Institutions and Organizational Structure: The Case of State-owned Corporate Pyramids. J. Law Econ. Organ. 2013, 29, 1217–1252. [Google Scholar] [CrossRef]
  14. Warner, J.B.; Watts, R.L.; Wruck, K.H. Stock Prices and Top Management Changes. J. Financ. Econ. 1988, 20, 461–492. [Google Scholar] [CrossRef]
  15. Puffer, S.M.; Weintrop, J.B. Corporate Performance and CEO Turnover: The Role of Performance Expectations. Adm. Sci. Q. 1991, 36, 1–19. [Google Scholar] [CrossRef]
  16. Farrell, K.A.; Whidbee, D.A. Impact of Firm Performance Expectations on CEO Turnover and Replacement Decisions. J. Account. Econ. 2003, 36, 165–196. [Google Scholar] [CrossRef]
  17. Boeker, W. Power and Managerial Dismissal: Scapegoating at the Top. Adm. Sci. Q. 1992, 37, 400–421. [Google Scholar] [CrossRef]
  18. Shen, W.; Cannella, A.A., Jr. Power Dynamics within Top Management and Their Impacts on CEO Dismissal Followed by Inside Succession. Acad. Manag. J. 2002, 45, 1195–1206. [Google Scholar]
  19. Zhang, Y. The Presence of a Separate COO/President and Its Impact on Strategic Change and CEO Dismissal. Strateg. Manag. J. 2006, 27, 283–300. [Google Scholar] [CrossRef]
  20. Rizzotti, D.; Frisenna, C.; Mazzone, R. The Impact of Family Owners’ Monitoring on CEO Turnover Decisions and the Role of Trust. J. Manag. Gov. 2017, 21, 599–621. [Google Scholar] [CrossRef]
  21. Arthaud-Day, M.L.; Dan, R.D. A Changing of the Guard: Executive and Director Turnover Following Corporate Financial Restatements. Acad. Manag. J. 2006, 49, 1119–1136. [Google Scholar] [CrossRef]
  22. Cowen, A.P.; Marcel, J.J. Damaged Goods: Board Decisions to Dismiss Reputationally Compromised Directors. Acad. Manag. J. 2011, 54, 509–527. [Google Scholar] [CrossRef]
  23. Wiersema, M.F.; Zhang, Y. CEO Dismissal: The Role of Investment Analysts. Strateg. Manag. J. 2011, 32, 1161–1182. [Google Scholar] [CrossRef]
  24. Wiersema, M.F.; Zhang, Y. Executive Turnover in the Stock Option Backdating Wave: The Impact of Social Context. Strateg. Manag. J. 2013, 34, 590–609. [Google Scholar] [CrossRef]
  25. Cao, X.; Pan, X.; Qian, M.; Tian, G.G. Political Capital and CEO Entrenchment: Evidence from CEO Turnover in Chinese Non-SOEs. J. Corp. Financ. 2017, 42, 1–14. [Google Scholar] [CrossRef]
  26. You, J.X.; Du, G.Q. Are Political Connections a Blessing or Curse? Evidence from CEO Turnover in China. Corp. Gov. Int. Rev. 2012, 20, 179–194. [Google Scholar] [CrossRef]
  27. Hanlon, M.; Heitzman, S. A Review of Tax Research. J. Account. Econ. 2010, 50, 127–178. [Google Scholar] [CrossRef]
  28. Tsai, S.-B.; Zhou, J.; Gao, Y.; Wang, J.; Li, G.; Zheng, Y.; Ren, P.; Xu, W. Combining FMEA with DEMATEL Models to Solve Production Process Problems. PLoS ONE 2017, 11, e0167710. [Google Scholar] [CrossRef] [PubMed]
  29. Liu, W.; Wei, Q.; Huang, S.-Q.; Tsai, S.-B. Doing Good Again? A Multilevel Institutional Perspective on Corporate Environmental Responsibility and Philanthropic Strategy. Int. J. Environ. Res. Public Health 2017, 14, 1283. [Google Scholar] [CrossRef] [PubMed]
  30. Liu, W.; Shi, H.-B.; Zhang, Z.; Tsai, S.-B.; Zhai, Y.; Chen, Q.; Wang, J. The Development Evaluation of Economic Zones in China. Int. J. Environ. Res. Public Health 2018, 15, 56. [Google Scholar] [CrossRef] [PubMed]
  31. Lin, F.-H.; Tsai, S.-B.; Lee, Y.-C.; Hsiao, C.-F.; Zhou, J.; Wang, J.; Shang, Z. Empirical research on Kano’s model and customer satisfaction. PLoS ONE 2017, 12, e0183888. [Google Scholar] [CrossRef] [PubMed]
  32. Peng, C.-H.; Ho, L.-F.; Tsai, S.-B.; Hsiao, Y.-C.; Zhai, Y.; Chen, Q.; Chang, L.-C.; Shang, Z. Applying the Mahalanobis–Taguchi System to Improve Tablet PC Production Processes. Sustainability 2017, 9, 1557. [Google Scholar] [CrossRef]
  33. Li, H.; Zhang, H.; Tsai, S.-B.; Qiu, A. China’s Insurance Regulatory Reform, Corporate Governance Behavior and Insurers’ Governance Effectiveness. Int. J. Environ. Res. Public Health 2017, 14, 1238. [Google Scholar] [CrossRef] [PubMed]
  34. Yuan, Y.-H.; Tsai, S.-B.; Dai, C.-Y.; Chen, H.-M.; Chen, W.-F.; Wu, C.-H.; Li, G.; Wang, J. An Empirical Research on Relationships between Subjective Judgement, Technology Acceptance Tendency and Knowledge Transfer. PLoS ONE 2017, 12, e0183994. [Google Scholar] [CrossRef] [PubMed]
  35. Chang, S.-F.; Chang, J.-C.; Lin, K.-H.; Yu, B.; Lee, Y.-C.; Tsai, S.-B.; Zhou, J.; Wu, C.; Yan, Z.-C. Measuring the service quality of e-commerce and competitive strategies. Int. J. Web Serv. Res. 2014, 11, 96–115. [Google Scholar] [CrossRef]
  36. Gao, Y.; Tsai, S.-B.; Xue, X.; Ren, T.; Du, X.; Chen, Q.; Wang, J. An Empirical Study on Green Innovation Efficiency in the Green Institutional Environment. Sustainability 2018, 10, 724. [Google Scholar] [CrossRef]
  37. Chou, C.-C.; Shen, C.-W.; Gao, D.; Gao, Y.; Wang, K.; Tsai, S.-B. Modelling the Dynamic Impacts of High Speed Rail Operation on Regional Public Transport—From the Perspective of Energy Economy. Energies 2018, 11, 1151. [Google Scholar] [CrossRef]
  38. Chen, Q.; Wang, J.; Yu, J.; Tsai, S.B. An Empirical Research on Marketing Strategies of Different Risk Preference Merchant. Math. Probl. Eng. 2018, 2018, 7947894. [Google Scholar] [CrossRef]
  39. Chen, Y.; Yu, J.; Li, L.; Li, L.; Li, L.; Zhou, J.; Tsai, S.-B. An Empirical Study of the Impact of the Air Transportation Industry Energy Conservation and Emission Reduction Projects on the Local Economy in China. Int. J. Environ. Res. Public Health 2018, 15, 812. [Google Scholar] [CrossRef] [PubMed]
  40. Xu, L.; Wu, Q.; Du, P.; Qiao, X.; Tsai, S.-B. Financing Target and Resale Pricing in Reward-Based Crowdfunding. Sustainability 2018, 10, 1297. [Google Scholar] [CrossRef]
  41. Wu, W.; Huang, X.; Li, Y.; Chu, C.-C. Optimal Quality Strategy and Matching Service on Crowdfunding Platforms. Sustainability 2018, 10, 1053. [Google Scholar] [CrossRef]
  42. Bai, C.; Xu, L.C. Incentives for CEOs with Multitasks: Evidence from Chinese State-owned Enterprises. J. Comp. Econ. 2005, 33, 517–539. [Google Scholar] [CrossRef]
  43. Conyon, M.; He, L. CEO Turnover and Firm Performance in China’s Listed Firms; Working Paper; Cornell University ILR School: Ithaca, NY, USA, 2008. [Google Scholar]
Figure 1. Theoretical model.
Sustainability 10 02007 g001
Figure 2. Ownership structure of the local SOE “000090”. Source: CSMAR database.
Sustainability 10 02007 g002
Figure 3. Ownership structure of the local SOE “000049”. Source: CSMAR database.
Sustainability 10 02007 g003
Figure 4. Ownership structure of the local SOE “000530”. Source: CSMAR database.
Sustainability 10 02007 g004
Table 1. Descriptive summary. This table presents the summary statistics for variable of interests from 2004 to 2010. Promotion is a dummy variable to label whether the CEO of a local SOE is promoted; ETR is the effective tax rate; Layer is the number of pyramid layers a listed local SOE has; ROA is return on assets; Size is the natural logarithm of total assets; No1share is the largest shareholder’s shareholding ratio; Dual is a dummy variable to label whether the CEO also holds the position of chairman; Percentage is the percentage of independent directors in a board; CEOshare is CEO’s shareholding ratio; CEOage is CEO’s age; CEOtenure is CEO’s tenure; and ST is a dummy variable to label whether a firm receives “Special Treatment”. All variables are defined in detail in the Appendix A.
VariableObsMeanSdMinMax
Promotion33670.0370.19001
ETR33670.2220.14900.743
Layer33672.2590.64417
ROA33670.0380.048−0.1820.192
Size336721.7441.05619.37524.505
No1share33670.4060.1550.1020.759
Dual33670.1030.30401
Percentage33670.3550.0490.2220.556
CEOshare33670.0080.04500.391
CEOage336747.7936.0952973
CEOtenure33673.5341.9080.9208.750
ST33670.0420.20101
Table 2. Correlation Matrix. Table 2 reports the correlation coefficients between variables. Promotion is a dummy variable to label whether the CEO of a local SOE is promoted; ETR is the effective tax rate; Layer is the number of pyramid layers a listed local SOE has; ROA is return on assets; Size is the natural logarithm of total assets; No1share is the largest shareholder’s shareholding ratio; Dual is a dummy variable to label whether the CEO also holds the position of chairman; Percentage is the percentage of independent directors in a board; CEOshare is the CEO’s shareholding ratio; CEOage is CEO’s age; CEOtenure is CEO’s tenure; and ST is a dummy variable to label whether a firm receives “Special Treatment”. All variables are defined in detail in the Appendix A. *, ** and *** represent the significant levels of 10%, 5% and 1%, respectively.
PromotionETRLayerROASizeNo1shareDualPercentageCEOshareCEOageCEOtenureST
Promotion1
ETR0.032 *1
Layer0.011−0.038 **1
ROA−0.017−0.020−0.0101
Size0.0190.059 ***−0.037**0.251 ***1
No1share0.012−0.002−0.0240.167 ***0.184 ***1
Dual−0.041 **−0.000−0.009−0.016−0.083 ***−0.067 ***1
Percentage−0.004−0.033 *0.0060.030 *0.082 ***−0.001−0.0051
CEOshare−0.001−0.022−0.0240.097 ***0.019−0.128 ***0.118 ***−0.0121
CEOage0.009−0.0160.0270.065 ***0.149 ***0.061 ***0.075 ***0.0040.030 *1
CEOtenure−0.019−0.0090.0180.078 ***0.127 ***−0.148 ***0.064 ***0.0020.050 ***0.194 ***1
ST0.029 *−0.213 ***0.033*−0.301 ***−0.256 ***−0.070 ***0.089 ***−0.013−0.024−0.002−0.061 ***1
Table 3. Regression results. This table presents the regression results for the association between CEO promotion and effective tax rate. Model 1 is a base model consisting of only control variables. The dependent variable promotion is a dummy variable to label whether the CEO of a local SOE is promoted. As for control variables, ROA is return on assets in year t-1; size is the natural logarithm of total assets in year t-1; No1share is the largest shareholder’s shareholding ratio; Dual is a dummy variable to label whether the CEO also holds the position of chairman; Percentage is the percentage of independent directors in a board; CEOshare is CEO’s shareholding ratio; CEOage is CEO’s age; CEOtenure is CEO’s tenure; and ST is a dummy variable to label whether a firm receives “Special Treatment” which is in year t-1. Model 2 includes the main effect of ETR on local SOE’s CEO promotion. ETR is the effective tax rate in year t-1. Model 3 includes the mitigating effect of Layer. Layer is the number of pyramid layers a listed local SOE has. The definitions of all variables are given in Appendix A. Year and Industry fixed effects are controlled. Robust standard errors clustered by firm are reported in parenthesis. *, ** and *** represent the significant levels of 10%, 5% and 1%, respectively.
PromotionModel 1Model 2Model 3
ROA−2.132−1.862−1.982
(1.970)(2.079)(2.067)
Size0.0890.0880.099
(0.085)(0.086)(0.088)
No1share0.0030.0030.003
(0.006)(0.006)(0.006)
Dual−1.103 **−1.121 **−1.116 **
(0.473)(0.479)(0.481)
Percentage−0.870−0.723−0.654
(1.884)(1.869)(1.865)
CEOshare0.8761.0281.071
(1.934)(1.907)(1.880)
CEOage0.0090.0090.010
(0.015)(0.015)(0.015)
CEOtenure−0.063−0.062−0.061
(0.052)(0.053)(0.052)
ST0.6710.8800.820
(0.563)(0.550)(0.531)
ETR 1.231 **4.623 **
(0.593)(2.008)
Layer 0.418
(0.257)
Layer*ETR −1.530 *
(0.922)
Constant−6.248 ***−6.468 ***−7.677 ***
(2.153)(2.192)(2.418)
IndustryYesYesYes
YearYesYesYes
N335133513351
Pseudo R20.0220.0250.028
Wald Chi222.0826.7130.94
Table 4. Robustness tests. This table presents the results of two robustness tests. Model 4 and Model 5 are the main effect and mitigating effect after controlling Dividend, respectively. Dividend is the dividend local government receives in year t-1. Model 6 presents the mitigating effect of separation. separation is controlling shareholder’s right of control and right of cash flow. The definitions of other variables are given in the Appendix A. Robust standard errors clustered by firm are reported in parenthesis. *, ** and *** represent the significant levels of 10%, 5% and 1%, respectively.
PromotionModel 4Model 5Model 6
ROA−1.830−1.956−1.857
(2.084)(2.073)(2.081)
Size0.0890.1000.088
(0.086)(0.088)(0.087)
No1share0.0040.0040.003
(0.007)(0.007)(0.006)
Dual−1.125 **−1.119**−1.121 **
(0.478)(0.480)(0.479)
Percentage−0.703−0.640−0.735
(1.861)(1.857)(1.863)
CEOshare1.0491.0881.020
(1.908)(1.881)(1.907)
CEOage0.0090.0100.009
(0.015)(0.015)(0.015)
CEOtenure−0.061−0.060−0.062
(0.052)(0.052)(0.052)
ST0.8720.8140.876
(0.553)(0.535)(0.547)
Dividend−0.002−0.001
(0.007)(0.007)
ETR1.254 **4.626 **1.219 *
(0.592)(2.009)(0.678)
Layer 0.416
(0.256)
Layer*ETR −1.523 *
(0.915)
Separation −0.002
(0.022)
Separation*ETR 0.003
(0.073)
Constant−6.497 ***−7.695 ***−6.454 ***
(2.195)(2.422)(2.207)
IndustryYesYesYes
YearYesYesYes
N335133513351
Pseudo R20.0250.0280.025
Wald Chi226.9530.9426.85
Table 5. The role of marketization. This table presents the results about the difference of the role of pyramid structure in different marketization level. Model 7 and Model 8 are the regression results for subsamples with low marketization index and with high index, respectively. Index is the marketization index computed by Fan et al. (2011). The definitions of other variables are given in the Appendix A. Robust standard errors clustered by firm are reported in parenthesis. *, ** and *** represent the significant levels of 10%, 5% and 1%, respectively.
PromotionModel 7Model 8
Index ≥ MedianIndex < Median
ROA−1.874−1.544
(3.214)(3.013)
Size0.0240.211 *
(0.141)(0.122)
No1share−0.0030.012
(0.009)(0.009)
Dual−1.293 *−0.989
(0.779)(0.652)
Percentage0.368−2.148
(2.734)(2.580)
CEOshare1.008−0.841
(2.157)(3.497)
CEOage0.021−0.000
(0.020)(0.026)
CEOtenure−0.108−0.024
(0.076)(0.073)
ST1.1420.465
(0.800)(0.643)
ETR3.7166.179 **
(2.802)(2.920)
Layer0.1700.873 **
(0.365)(0.390)
Layer*ETR−0.906−2.567 *
(1.255)(1.314)
Constant−17.155 ***−10.319 ***
(3.537)(3.064)
IndustryYesYes
YearYesYes
N16781640
Pseudo R20.0580.065
Wald Chi2569.1645.07

