Article

Spatio-Temporal Evolution Analysis of the Urban Heat Island: A Case Study of Zhengzhou City, China

1
Nanjing Institute of Geography and Limnology, Chinese Academy of Sciences, Nanjing 210008, China
2
University of Chinese Academy of Sciences, Beijing 100049, China
3
Key Laboratory of Watershed Geographic Sciences, Chinese Academy of Sciences, Nanjing 210008, China
4
Key Research Institute of Yellow River Civilization and Sustainable Development & Collaborative Innovation Center on Yellow River Civilization of Henan Province, Henan University, Kaifeng 475004, China
*
Author to whom correspondence should be addressed.
Sustainability 2018, 10(6), 1992; https://doi.org/10.3390/su10061992
Submission received: 3 May 2018 / Revised: 7 June 2018 / Accepted: 11 June 2018 / Published: 13 June 2018
(This article belongs to the Section Sustainable Urban and Rural Development)

Abstract

:
During the progress of urbanization in China, a large number of natural landscapes have been replaced by impervious surfaces. The strong interference from human activities has led to the intensification of urban heat island (UHI) effects and has had a negative influence on the health of residents. Zhengzhou, as a new representative city of rapid urbanization, can be used as a case study for UHI. This study built an inversion model of the land surface temperature (LST) of Zhengzhou in 1996, 2000, 2006, 2010 and 2014. On this foundation, the four indicators of land use/land cover (LULC), density of the population, urban construction, and industrial development were chosen to establish a quantitative analysis model between them and the LST. The conclusions were as follows: (1) From 1996–2014, the average LST in Zhengzhou increased by 2.939 °C, and the standard deviation decreased from 4.08 to 2.64. (2) Since 2006, the development zone far from the center of city has become a new urban high temperature zone. The distribution characteristics of the UHI have changed from “centralization in downtown” to “downtown and suburban distribution”. (3) Construction land and vegetation had the most significant impacts on the UHI effect. The construction land was positively correlated with LST, and the vegetation showed the opposite effect. The population density, urban construction and industrial development have strong driving effects on the UHI effect, of which the driving force of industrial development is the most intense.

1. Introduction

In 1818, Howard first recorded the heat island phenomenon in his book, the London Climate [1]. The phenomenon that urban temperatures are higher than those in the suburbs is called the urban heat island effect [2]. Since then, with the wave of urbanization and industrialization that has swept the world, the scope and intensity of the urban thermal environment has increased, which has a strong influence on regional climate change, energy consumption, and the health of residents. The central temperature of a large city is often higher than that in the suburbs [3]. The increase in urban temperature leads to decreased air pressure and changes in atmospheric patterns, such as pollutant reflux, which strongly affects the regional climate [3,4]. The urban heat island (UHI) effect increases the use of air conditioning in the city in summer and forms a vicious cycle of increasing temperature and energy consumption [4,5]. Due to the increase in temperatures, urban residents are suffering from high-temperature diseases and epidemics [6,7]. Research on the influential mechanisms of the UHI effect helps us to understand the impact of human activities on the urban climate [8]. This research tries to help to clarify the UHI effect caused by human activities and to promote the sustainable development of the urban ecological environment.
In recent years, with the progress in space information technology, inversion algorithms based on GIS (Geographic Information System) and RS (remote sensing) technology have been used to research the thermal environment. Rao (1972) [9] first applied remote sensing images to land surface temperature (LST) retrieval. Since then, NOAA (National Oceanic and Atmospheric Administrat)/AVHRR (Advanced Very High Resolution Radiometer) [10,11], MODIS (Moderate-resolution Imaging Spectroradiometer) [12,13], Aster [14,15,16,17], HJ-1 (HJ-1 Satellite) [18,19], Landsat series [20,21,22] and other satellite images with various temporal and spatial scales have been widely applied to the study of LST retrieval. Compared with other images, the Landsat series has many advantages, such as high spatial resolution, rich spectral information, archived data and free access. It has been applied to remote sensing analyses of the thermal environment by many scholars [20,21,22]. The traditional field site observation method cannot quickly and accurately monitor temperature changes of large areas and long time series. GIS and RS technology can solve this problem and ensure the acquisition, processing and application of source information. These technologies provide the basis for the refined expression of the UHI effect’s temporal and spatial changes and gradually have become the main technical means to study the UHI effect [23,24,25].
At present, many scholars have explored the driving mechanism of the UHI effect from the perspectives of land cover [10,26,27], landscape [28,29] and social economy [30,31,32,33,34] by using the 3S technology (remote sensing, Global Position Systems, Geographic Information Systems), combined with correlation analyses, fractal mathematics and gray system theory. The main types of surface cover that affect the LST are vegetation [10,30,35,36,37,38,39,40,41], construction [42,43,44,45] and surface water [46,47,48,49]. Human activities are also one of the driving forces of the UHI [50,51]. Yue et al. (2008) [52] used the PCA (Principal Component Analysis) method to find that urban construction, population density, industrial layout, surface cover types and urban landscape diversity are the main factors that influence the spatial distribution of the UHI effect. He et al. (2007) [53] found that the contribution rate of human heat emissions to the UHI in Nanjing in 2002 was 29.6%. Zhang et al. (2015) [54] and Wu et al. (2015) [55] found that the large-scale migration of the urban population during the Spring Festival reduced human activities, thereby reducing the release of artificial heat and weakening the UHI.
The rapid urbanization area in China can serve as a case study for the UHI effect. The development of Zhengzhou in recent years is clear. With the implementation of a series of good policies, for example, selected national central cities, the construction of the air harbor, the planning of high-speed rail and the approval of the free trade area, Zhengzhou has become an important central city in the central part of China. During 1996–2014, the proportion of construct land and built-up area increased by 28.53% and 41.54%, respectively, in Zhengzhou [56]. The process of urbanization has greatly changed the urban surface coverage and spatial function structure. This has caused a change in the surface albedo and the release of a large amount of human heat, both of which have large driving effects on the UHI effect [45,57,58]. Therefore, Zhengzhou can be used to study the driving mechanisms of the UHI effect in a rapidly urbanizing area. In the study of the influence factors of the UHI, the impact of surface cover on the UHI has been fully quantitatively analyzed. However, quantitative research on the social economy driving forces of the heat island effect is lacking, and analyses of the mechanisms and case verification are both deficient [59]. Combining high-precision data, such as the economic census, population census, energy consumption survey, etc., this article analyses the influences of human activities on the heat island effect. This study uses Zhengzhou as the research area and uses Landsat images, thermal infrared band data, and an image-based method to build a temperature model of the inversion of surface temperatures of Zhengzhou in 1996, 2000, 2006, 2010, and 2014. With the help of the surface temperature profile, the characteristics of the island uplift and the spatio-temporal evolution of the Zhengzhou heat field are visualized. The four indicators include land cover, the density of the population, urban construction, and industrial development. These are used to establish a quantitative analysis model between the indexes and LST, to analyze the influence of the four indicators on the UHI effect. This study helps to better understand the processes and causes involved in the formation of the UHI effect in Zhengzhou.

2. Materials and Methods

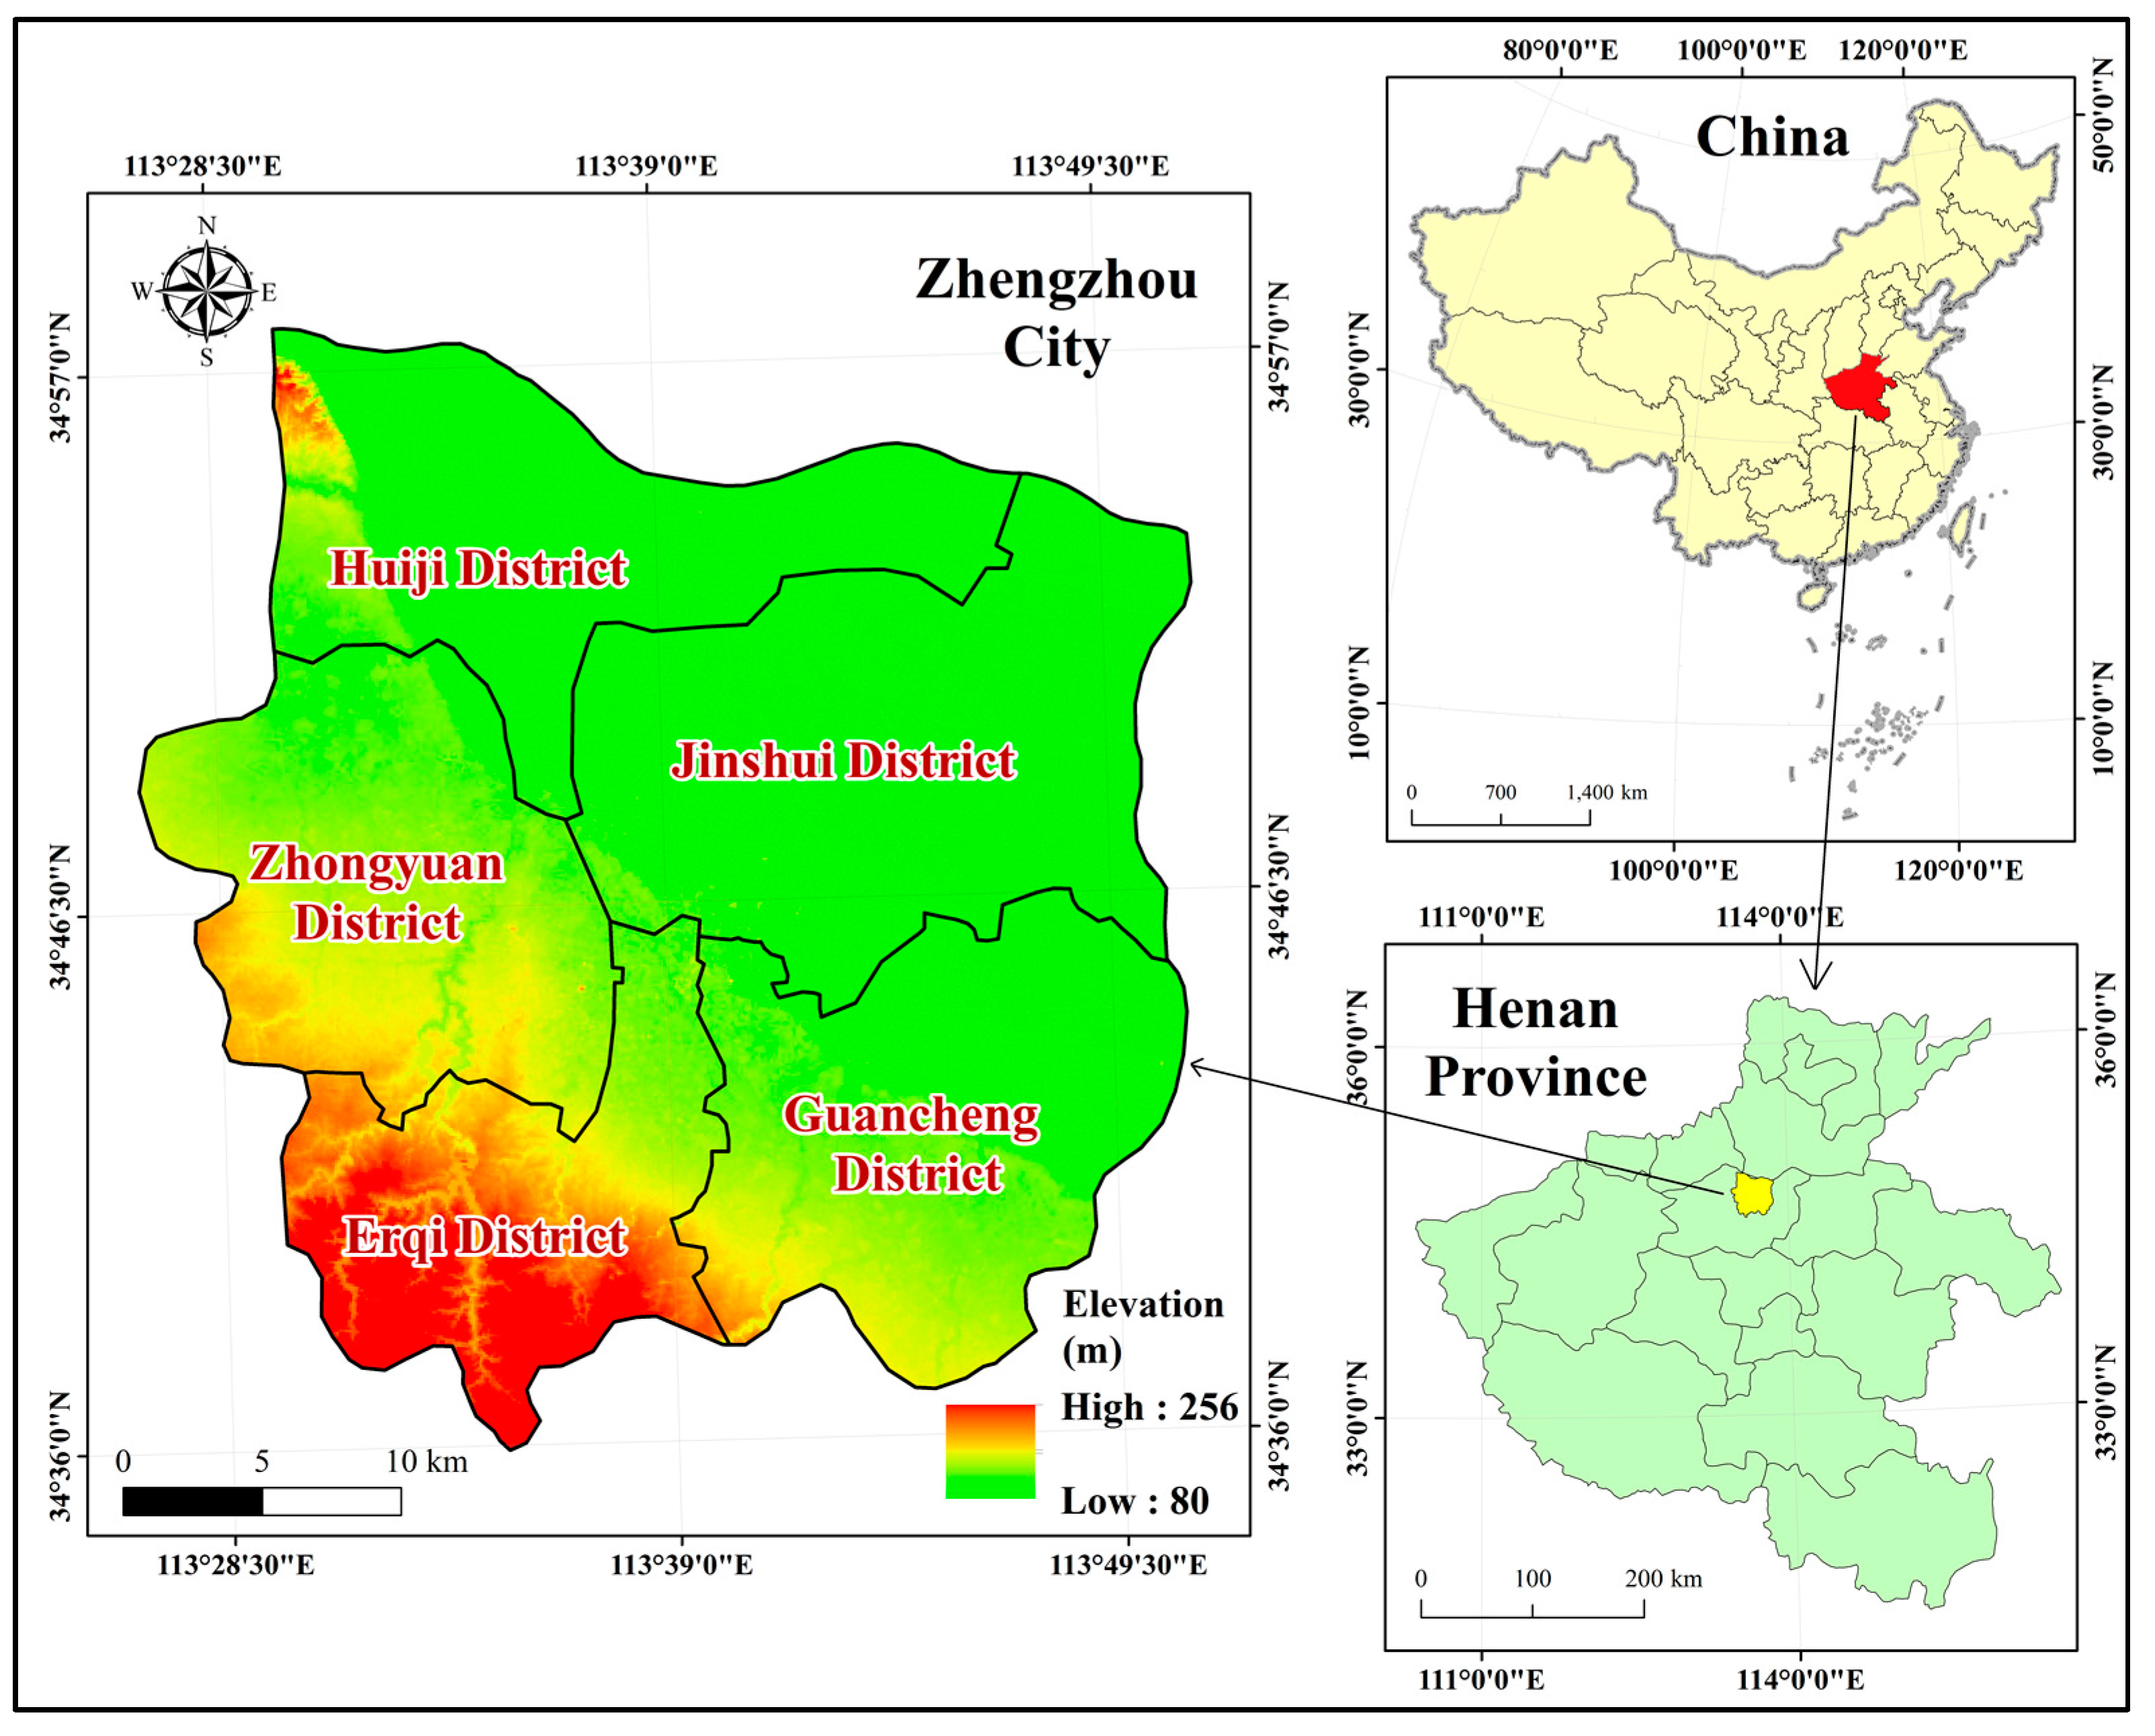
2.1. Study Area: Zhengzhou, China

Zhengzhou is the capital of Henan Province. Itis located between 34°36′–34°58′ N latitudes and 113°28′–113°52′ E longitudes; the urban area is 1010.3 km2, and its built-up area is 443 km2 [60]. By the end of 2015, Zhengzhou city included 6 districts, 5 county-level cities and 1 county. This research studied 5 districts—Jinshui, Zhongyuan, Huiji, Erqi and Guancheng (Figure 1). Zhengzhou is in the transition zone between the Funiu mountains and the Huanghuai plains. The southwest area has the highest terrain, decreasing to the northeast, and showing a ladder-like decline. Zhengzhou is located inland. It has a continental climate in the north temperate zone. This climate has the following characteristics: four distinctive seasons, rain and heat over the same period, dry and cold over the same season, cold and warm air masses alternate frequently, it is dry and less rainy in spring, hot and rainy in summer, sunny in autumn, and cold with less snow in winter. The climate is dry, and 80% of the rainfall is concentrated in the summer. The annual mean temperature is 15.6 °C, the average rainfall is 542.15 mm, the frost-free period is 209 days, and the annual sunshine time is approximately 1869.7 h [56]. Ample sunshine and abundant rainfall during the growing season provide good agro-meteorological conditions. As an important national comprehensive transportation hub and a new industrial city, the rapid urbanization of Zhengzhou has led to great changes in the surface cover, especially related to urban environmental problems represented by the heat island effect. According to meteorological data, the average annual temperature in Zhengzhou rose 2.2 °C from 1996–2014 [56].

2.2. Data

In this research, all of the images used were from the Landsat program of NASA (National Aeronautics and Space Administration). Landsat series data were used for the retrieval of LST, the extraction of land use types and the calculation of the land cover index. All images were downloaded from the website of the USGS (United States Geological Survey) [61]. In order to maintain consistency in the timing of the 5 images and to reduce the influence of meteorological factors such as cloud and precipitation on the inversion results, the imaging time was selected in early summer with a cloud amount of less than 5%, and there was no precipitation on the day before the image was taken. This includes TM (Thematic Mapper) images from 20 May 1996, ETM+ (Enhanced Thematic Mapper) images from 7 May 2000, TM images from 16 May 2006, TM images from 11 May 2010, and OLI (Operational Land Imager) images from 27 May 2014. The TM images used in this study were obtained by the TM sensor mounted on Landsat 5; the ETM+ image was obtained by the ETM+ sensor carried by Landsat 6; and the OLI image was obtained by the OLI sensor mounted on Landsat 8. The study area is located in path 124 and row 36. Data collected from the socio-economic census included 3 indicators: the year-end population, the construction area and completed area of construction, and the gross industrial output value of the 5 districts of Zhengzhou from 1996–2014. These data were obtained from the Zhengzhou statistical yearbook (2001, 2007, 2011, 2015) [56,62,63,64], a report on government work of Zhengzhou, and a statistical report on the national economy and social development of Zhengzhou [60].

2.3. Normalized Difference Vegetation Index (NDVI) and Normalized Difference Building Index (NDBI)

The NDVI is the Normalized Difference Vegetation Index [65]. It has been widely used in the research of the UHI effect to detect the vegetation growth status and vegetation coverage. The range of NDVI is [–1, 1], and the negative value indicates that the land cover is cloud, water, snow and so on. It reflects the high reflection of visible light, and the 0 value indicates that the land cover is rock or bare soil, and the positive value indicates that the surface is covered by vegetation and increases with an increase in coverage. The formula for NDVI is as follows (Equation (1)):
N D V I = ρ N I R ρ R E D ρ N I R + ρ R E D .
ρNIR represents the reflectance of the near infrared band, where ρNIR = Band 4 (for Landsat TM and ETM+) and Band 5 (for Landsat OLI); ρRED represents the reflectance of the red band, where ρRED = Band 3 (for Landsat TM and ETM+) and Band 4 (for Landsat OLI) [66,67,68,69].
The NDBI is the Normalized Difference Building Index [70]. It is used to reflect the density of buildings in unit pixels. The range of NDBI is [−1, 1], and a negative value indicates that the land cover is water. A value of 0 means that the land cover is vegetation, and a positive value indicates the land cover is built-up area. The formula for NDBI is as follows (Equation (2)):
N D B I = ( ρ S W I R ρ N I R ) ( ρ S W I R + ρ N I R ) .
ρSWIR represents the reflectance of the middle-infrared band, where ρSWIR = Band 5 (for Landsat TM and ETM+) and Band 6 (for Landsat OLI); ρNIR represents the reflectance of the near-infrared band, where ρNIR = Band 4 (for Landsat TM and ETM+) and Band 5 (for Landsat OLI) [28,71,72].

2.4. LST Retrieval

2.4.1. Thermal Radiation Intensity

The thermal radiation (Lλ) received by a satellite sensor includes the radiative energy produced by the surface body itself and generated by the surrounding environment [73]. The thermal radiation of Landsat TM/ETM+/OLI is recorded by the DN (digital number) value. DN is the gray value of pixels; it is an integer, with no units and a range from 0~255 [74]—the greater the DN value of the pixel, the greater the corresponding thermal radiation value [74]. Lλ is expressed as follows (Equation (3)):
L λ = G a i n × D N + O f f s e t .
The gain expresses the gain coefficient; its units are W/(m2·sr·μm)/DN and its values are as follows: gain = 0.055375 (for Landsat TM) and gain = 0.067087 (for Landsat ETM+) and gain = 0.0003342 (for Landsat OLI). The offset is the offset coefficient; its units are W/(m2·sr·μm) and its values are as follows: offset = 1.18243 (for Landsat TM) and offset = −0.06709 (for Landsat ETM+) and offset = 0.1 (for Landsat OLI).

2.4.2. Radiation Brightness Temperature

The radiation brightness temperature (Td) is expressed as follows (Equation (4)):
T d = K 2 ln ( 1 + K 1 L λ ) .
K1 and K2 are the revision coefficients (Table 1). The units of K1 are W/(m2·sr·μm) [60,69].

2.4.3. Surface Emissivity

The surface emissivity (ε) is the most important parameter used in the remote sensing of the inversion of temperature. This study used the method proposed by Qin et al. [20] in which the NDVI is used to calculate the surface emissivity. For the detailed formula of the calculation, refer to Qin et al. [20].

2.4.4. LST

Most of the objects in nature are not black bodies. It is necessary to use the surface emissivity to correct the radiation brightness temperature, so that it can be converted into the real surface temperature (Ts). The Ts is expressed as follows (Equation (5)):
T s = T d 1 + ( λ T d ρ ) ln ε 273 .
In the above formula, λ is the wavelength of the emitted radiance: λ = 11.5 μm (for Landsat TM/ETM+) and λ = 10.8 μm (for Landsat OLI) [28]; ρ = 1.438 × 10⁻² mk [75,76,77].

2.5. Classification of Land Use Types

This study used the land-use monitoring classification system using remote sensing by CAS (Chinese Academy of Sciences), as proposed by Liu et al. [78]. The classification system divides the land use types into 6 first level types—farmland, forest, grassland, water, construction land, and bare land—and 25 s level types. Through the land classification standard, the support vector machine (SVM) in the supervised classification is used to set up the interpretation mark, and the land use in the study area is divided into six types. The classification results that result from using these six land use types are very accurate, with the average accuracy being 85%. The land use maps of Zhengzhou for 5 periods (1996, 2000, 2006, 2010 and 2014) were obtained (Figure 2).

2.6. Analysis of the Profile of LST

The LST profile can directly reflect the temperature change from the urban center to the suburbs. Taking the intersection of the east–west direction and the north–south direction, with Zhengzhou as the center, we made 8 profiles in 16 directions: S–N, SSW–NE, SW–NNE, WSW–ENE, W–E, WNW–ESE, NW–SE, and NNW–SSE (Figure 3). Sampling at an interval of 1000 m for each the profile yielded a total of 294 sampling points for the 8 profiles in the 16 directions.

2.7. Precision Verification

All the results of the remote sensing retrieval need to be verified by precision, and the retrieval of LST is no exception. Precision verification is generally used to verify the temperature products using imagery with high spatial resolution, and the measured air temperature data that is consistent with the satellite transit time can also be used. The Landsat TM/ETM+/OIL image used in this study had high spatial resolution, and it is difficult to obtain high precision temperature data. Therefore, the measured air temperature data were used for validation [79].
The precision was verified by comparing the mean values of the measured air temperature of the study area with the LST values obtained from the retrieval, to prove the effectiveness of the retrieval results. The retrieval results of Zhengzhou for 27 May 2014, showed that the average LST value was 32.7 °C. According to historical meteorological data [80], the average LST in Zhengzhou on 27 May 2014 was 30 °C and the average temperature reported in meteorological observations for the week from 24–30 May 2014 was 28 °C. The differences between the two measured air temperatures and the retrieval results are 2.7 °C and 4.7 °C, respectively. It can be considered that the retrieval of LST is effective [79].
The results of the five-phase retrieval in this study were verified by the above method. The inversion results were slightly higher than the measured air temperature and showed a good linear relationship with it, and the fitting degree of them was over 0.7. The temperature differences between the inversion results and observation days/observation weeks was less than 3 °C/5 °C. The temperature during the observation week was greatly disturbed by meteorological factors such as rainfall; thus, it can be considered that the range of 5 °C was effective [79].

3. Results

3.1. Temporal and Spatial Variation Characteristics of LST

The results of the five-phase retrieval are shown in Figure 4. The thermal environment in Zhengzhou showed a tendency to change from an uneven distribution of high and low temperatures to a uniform distribution of high temperatures.
The maximum, minimum, average and standard deviation values of the five-phase retrieval results are shown in Table 2. In 1996, 2000, 2006, 2010, and 2014, the maximum LST value in Zhengzhou was above 40 °C, and the average values were 29.2, 29.7, 29.0, 32.0 and 32.7, The average value increased year by year, which is opposite to the decreasing trends in the temperature difference and the standard deviation. The average value increased year by year, which is opposite to the decreasing trends in the temperature difference and the standard deviation. This indicates that the temperature of the urban area in Zhengzhou increased continuously from 1996–2014 and gradually changed to a relatively stable high-temperature state and that the degree of the heat island effect is becoming increasingly serious.
The LST profile can be further visualized by displaying the cross-section characteristics of the LST in Zhengzhou. Figure 5 shows the uplift in the downtown temperature and the subsidence of the suburban temperature, especially in the four directions of WSW–ENE, W–E, NW–SE, and NNW–SSE. The temperatures at the sampling points in the downtown area were generally 4–6 °C higher than those in the suburbs.
Figure 5 also shows that the UHI in Zhengzhou was mainly distributed in the downtown area before 2006. After 2006, with the acceleration of urbanization and industrialization, the built-up area has been expanding to the surrounding area. The new urban heat island has begun to appear in the suburbs (a new development zone) under the catalysis of urban development. The distribution characteristics of the UHI have changed from “centralization in downtown” to “downtown and suburban distribution”.
At the same time, there has been a grooved depression in the heat island uplift of the downtown area (Figure 5), which indicates that the difference in surface coverage will cause a change in land surface temperatures. For example, in the urban area, the park greenbelt with high vegetation coverage or water bodies will still exhibit relatively low temperatures even though it is affected by the thermal radiation of the surrounding impervious layer.

3.2. The Relationship between Land Use and LST

The statistics of LST for the six land use types in 1996, 2000, 2006, 2010, and 2014 in Zhengzhou are shown in Figure 6. The average LST values of six land use types from high to low are bare land ≈ construction land > farmland ≈ grassland ≈ forest > water. The average LSTs of construction land and bare land were the highest, and the average LSTs for vegetation and water were lower. The LST of the vegetation coverage area was also different. The LST of forest land was slightly lower than that of grassland and farmland. Because the area of bare land is small, the main land use types that influence the UHI effect in this area are construction land and vegetation. Even for the same type of land use, the average LST showed an increasing trend from 1996–2014. This phenomenon indicates that factors such as human activities and meteorological conditions will also affect the LST.

3.2.1. The Relationship between NDVI and LST

The NDVIs of Zhengzhou City in 1996, 2000, 2006, 2010 and 2014 are shown in Figure 7. Blue indicates areas covered with dense vegetation, and yellow indicates low vegetation coverage. As shown in Figure 7, the blue color region continued to decrease from 1996–2014, and the yellow-green region continued to increase. With the development of urbanization, the built-up area is expanding to the suburbs. Much land with high vegetation coverage, such as farmland, forest and grassland, has been transformed into an impervious layer.
As shown in Figure 8, the corresponding NDVI variation is basically negative in the region with positive LST variation. When the variation of LST is between 0 and 0.1, the variation of LST is stable between 0 and 0.2. In particular, it is worth noting that when LST variation is greater than 0.1, the decrease in NDVI begins to rise in series—the more the NDVI decreases, the more the LST increases.
The relationship between the variation in NDVI and the variation in LST in 1996–2000, 2000–2006, 2006–2010, and 2010–2014 is shown in Figure 8. Although consistency was maintained as much as possible, there was still a difference in the timing of imaging and in the correlation between the variation in NDVI and the variation in LSI.

3.2.2. The Relationship between NDBI and LST

The NDBIs of Zhengzhou City in 1996, 2000, 2006, 2010 and 2014 are shown in Figure 9. Red indicates areas of high building density and blue indicates areas of low building density. As shown in Figure 9, the impervious layer symbolized by red expanded rapidly from 1996–2014.
The relationship between the variation in NDBI and the variation in LST in 1996–2000, 2000–2006, 2006–2010, and 2010–2014 is shown in Figure 10.
There was a significant positive linear correlation between the NDBI and the LST at the 0.01 significant level. The correlation coefficients of the NDBI variation and the LST variation in the four periods were 0.597, 0.754, 0.657 and 0.670, respectively. An F-test was used to analyze the regression equation. The p-values of the four regression equations were all less than 0.01, indicating that the linear positive correlations between the four regression equations were significant.
Referring to the relationship between NDVI and LST, it was found that the correlation between LST and NDBI was more closely related to the four periods. Construction land has an obvious effect on the UHI effect. It is a strong driving force of the UHI effect.

3.3. The Relationship between Socio-Economic Factors and LST

The correlation analysis results for the year-end population, using the construction and completion area of construction and the gross industrial output value of the five districts of Zhengzhou in 1996, 2000, 2006, 2010 and 2014 as independent variables, and the LST values as dependent variables, are shown in Table 3.
The regression results (Table 3) showed that there was a positive linear correlation between the LST and the population density, the construction and completion area of construction and the gross industrial output value at the 0.01 significant level. The correlation coefficients were 0.762, 0.723 and 0.774, and the coefficients of determination were 0.580, 0.523 and 0.600. The model has thus reached a better level of interpretation. The population density, urban construction and industrial development are all important factors contributing to the UHI effect.

4. Discussion

4.1. Land Use/Land Cover (LULC) Has a Strong Driving Effect on LST

The rapid expansion of the city has led to dramatic changes in the underlying surface and spatial functional structure [81]. Changes in the surface albedo greatly impact the UHI effect.
According to Figure 4, in 1996, the high LST area is concentrated in the central urban area, the Erqi district, most of the Guancheng district, the Yellow River side beach in the Huiji district. Due to the long wave radiation emitted by dense buildings, the temperature in the central city is higher than that in the suburbs. The land use map (Figure 2) shows that the main land use type in the southwest of the Erqi district and the southeast of Guancheng district is farmland. The imaging period used in this study was in May. May is the heading and flowering period of winter wheat in Henan Province, so, in fact, the vegetation coverage of farmland is low, the surface moisture of the soil evaporates due to solar radiation, and the soil water content is low. According to the hypsometric map (Figure 1), the southwest of the Erqi district has the highest altitude in the study area, with an average elevation of about 200 m, which is not conducive to soil water conservation; the soil moisture is more easily evaporated and leads to an increase in LST. The main soil type of the Yellow River beach in the Hui area is sandy soil. This soil is rapidly warming up due to solar radiation.
In 2000, the spatial distribution of the high LST area was almost the same as that in 1996. The high temperature area in the center urban area expanded to the surroundings alongside the growth of the built-up area. The high temperature zone in the Zhongyuan district has gradually expanded along with the construction of the development zone. From 2006, the LST in the Erqi district reduced, mainly because, after 2000, with the implementation of the policy of returning farmland to forest in the hilly region, the land cover was gradually transferred from farmland to grassland and forest. The vegetation coverage of grasslands and forests is higher and less affected by the season. The transpiration of vegetation is stronger than that of farmland, and it has a stronger soil water locking ability, which causes significant relief for the high LST.
In 2010, the high temperature region continued to spread. In 2014, with the construction of new urban areas, such as the Zhengdong New District, the Hi-tech Zone in the Zhongyuan district, and the Economic-Technological Development Zone in the Guancheng district, the original high vegetation coverage of the LULC was rapidly replaced by an impermeable layer. The change in surface albedo has caused the new urban area to rapidly become a new high LST area in Zhengzhou in the past ten years.
The negative correlation between NDVI and LST shows that vegetation has the effect of alleviating the heat island effect. Plants can evaporate water into the atmosphere through transpiration at the leaf surface, increasing the humidity of the air, and removing some of the heat, thus reducing the temperature. Large areas of green space especially help to improve the thermodynamic properties of the surface and promote the cooling and circulation of air, thus playing a significant role in easing the heat island effect and limiting the diffusion of the heat island effect.
It is worth noting that the relationship between NDVI and LST is segmented. When the variation of LST is between 0 and 0.1, the variation of LST is stable between 0 and 0.2; when the LST variation is greater than 0.1, the decrease in NDVI begins to rise in series. This shows that the negative correlation between NDVI and LST is more significant in the strong growth area of LST. In areas with smaller changes in NDVI, The LST is also susceptible to the external environment. This is similar to related research results. The climate, research scale, and soil moisture will interfere with the cooling rate of vegetation on the LST, especially in areas with smaller changes in NDVI, and this interference is significant [82,83]. At the same time, the vegetation types and landscape pattern of the vegetation area will also affect the cooling effect. It is shown in Figure 6 that the cooling potential of forests is the greatest. The vegetation heat dissipation showed a clear, consistent potentiality increase to a curved patch shape, with bigger dimensions that was smoothly connected to other patches, which facilitated surface heat loss to the surroundings [66]. Similarly, related research in Zhengzhou has shown that the LST at the edge of the hot field is the most sensitive to NDVI [84].
The positive linear correlation between NDBI and LST shows that buildings change the exchange of latent heat and sensible heat on the surface directly and play a significant role in driving the UHI effect [85]. The urban system is an important ecological system and is most affected by human activities; transformation of a city radically changes the thermal properties of the underlying surface. Urban construction and expansion have resulted in a large amount of vegetation and fertile land being replaced by an impermeable layer. These materials have the characteristics of high thermal conductivity, a strong absorptive capacity, a large heat capacity, small thermal inertia and low evaporation energy consumption, and under the same solar radiation, the impermeable layer warms faster than the natural surface [43,44].

4.2. The Driving Effect of Socio-Economic Factors on LST

Intensive human socio-economic activities lead to a large amount of anthropogenic heat release. Many studies have suggested that the population density, urban construction, industrial production and other socio-economic factors play driving roles in the UHI effect [34,50,51,52].
The urban system is a highly densely populated system, and a dense population is one of the main causes of the concentration of heat in the city. The density and spatial distribution of the population both have strong influences on the heat island effect—the more densely populated the areas, the higher the temperature. In areas with a large population density, cooking, heating in winter, cooling in summer, transportation and other heat release activities are more concentrated, and a large amount of artificial heat release makes them high-temperature areas of the city [30,31].
The temperature of the inner city, which has a population of 50–100 million, is 1.1–1.2 °C higher than that in the countryside. In cities with a population of over 1 million, the temperature has been shown to be obviously increased by 1.2–1.5 °C [86,87]. Figure 11 shown that, in 1996, the population of Zhengzhou’s downtown area was 2.2 million. Affected by the polarization of the city, the population of Zhengzhou has been increasing. As of 2014, the resident population of the downtown area of Zhengzhou was 3.8 million [64]. The population of downtown Zhengzhou has doubled over the past 20 years. Jinshui district has a large population base and the fastest growth rate. The population increased from 0.6 million in 1996 to 1.4 million in 2014. The population is highly concentrated and will release much artificial heat, which will aggravate the UHI effect.
The acceleration of the urbanization process in Zhengzhou has produced rapid urban construction, such as real estate development, city-village reconstruction, the construction of industrial parks, etc. During the day, impervious components of residences, hospitals, office buildings, schools, roads and commercial squares emit a large amount of longwave radiation while absorbing solar radiation [88,89,90]. At night, the rows upon rows of buildings can effectively block the emission of longwave radiation, so that the heat of longwave radiation in the day is retained in the urban area; therefore, a UHI area is easily formed [91,92].
The gross industrial output value is an indirect expression of energy and fuel consumption during the process of industrial production. In 2014, the annual comprehensive energy consumption in Zhengzhou was 19.63 million tons of standard coal. The light industry consumed 1.9 million tons of standard coal, and heavy industry consumed 18 4 million tons of standard coal. The total supply of liquefied petroleum gas (LPG) was 62018 tons, and the total supply of natural gas was 953.19 million cubic meters [56]. The majority of the electricity and chemical energy consumed during industrial production is released as heat. In addition, industrial production also emits large amounts of greenhouse gases, such as NOx, CO2, SO2, and aerosols. These greenhouse gases are good at absorbing longwave radiation energy. Greenhouse gases cover an area similar to the thermal insulation layer, enhance the atmospheric counter radiation, and aggravate the intensity of the regional thermal environment [34]. Industrial parks are bound to become new heat island areas, which has been confirmed in related research in other cities in China [52,92].

4.3. Implications

From the abovementioned analysis, this study has produced some implications for urbanists to consider to reduce the negative UHI effect of city development.
(1)
Improve the coverage rate of urban greening. On the basis of controlling the cost, increase public facilities reasonably, such as green parks, forest parks, the road green belt and so on, and encourage residents to build green roofs at the same time.
(2)
Seek a reasonable scale, structure, system and spatial layout for urban land use. We should reverse the traditional expansion model of single-center cities, actively push forward the construction of multi-center cities, and reasonably control the total scale of built-up areas.
(3)
The UHI is mainly formed by the joint action of urbanization and industrialization. Controlling the energy consumption and urban economic development intensity and controlling the total population and reasonable distribution are important measures to effectively curb the UHI effect in Zhengzhou City. At the same time, proper control of the incremental development of urban real estate and high-rise buildings is also important to effectively curb the heat island effect.
(4)
Actively develop new energy technology. The large amount of heat energy emitted by human beings is the most important drivers of the UHI effect. Therefore, we should promote the use of new energy sources and the continuous development of new energy sources, such as wind and solar energy. It is important to reduce the use of non-renewable energy sources, such as coal and gasoline in order to reduce atmospheric pollution and human energy emissions.

5. Conclusions

Between 1996 and 2014, the LST of Zhengzhou increased continuously and gradually changed to a relatively stable, high-temperature state. In 1996, 2000, 2006, 2010 and 2014, the average LSTs in Zhengzhou were 29.2 °C, 29.7 °C, 29.0 °C, 32.0 °C, and 32.7 °C, respectively, and a steady growth trend was maintained. Different types of land cover have strong impacts on the LST. The average LST corresponding to the six types of land use, ranging from high to low, was construction > bare land > farmland > grassland > forest > water. The most influential land use types for the urban thermal environment were shown to be vegetation and the impervious layer. The impervious layer showed a significant linear positive correlation with the LST, and vegetation was shown to mitigate the heat island to a certain extent. The population density, urban construction and industrial development all have strong driving effects on the UHI effect. Industrial parks and new districts have become new heat island areas in Zhengzhou, but these areas are mostly located in the suburbs, and their spatial distribution is scattered, which is relatively conducive to the loss of heat. The emergence of the UHI effect has not been caused by a single driving factor, but is due to urban construction, population aggregation, resource consumption, industrial development, urban land use types, and so on.

Author Contributions

M.M. analyzed the data and wrote the paper. H.Z. helped to gain data and extract LULC information. C.M. helped to edit the manuscript.

Funding

This research was funded by the Natural Sciences Foundation of China grant number 41501128, the Natural Sciences Foundation of China grant number 41430637, the China Postdoctoral Science Foundation grant number 2015M582181.

Acknowledgments

The research is sponsored by a grant of the Natural Sciences Foundation of China (No. 41501128, 41430637) and support from the China Postdoctoral Science Foundation (2015M582181). The authors are grateful to the editors and the anonymous reviewers for their insightful comments and suggestions.

Conflicts of Interest

The authors declare no conflict of interest.

References

  1. Howard, L. The Climate of London; W. Phillips: London, UK, 1818. [Google Scholar]
  2. Manley, G. On the frequency of snowfall in metropolitan England. Q. J. R. Meteorol. Soc. 1958, 84, 70–72. [Google Scholar] [CrossRef]
  3. Zhou, S.Z.; Su, J. Urban Climatology; China Meteorological Press: Beijing, China, 1994. [Google Scholar]
  4. Grimm, N.B.; Faeth, S.H.; Golubiewski, N.E.; Redman, C.L.; Wu, J.G.; Bai, X.M.; Briggs, J.M. Global change and the ecology of cities. Science 2008, 319, 756–760. [Google Scholar] [CrossRef] [PubMed]
  5. Chang, C.R.; Li, M.H.; Chang, S.D. A preliminary study on the local cool-island intensity of Taipei city parks. Landsc. Urban Plan. 2007, 80, 386–395. [Google Scholar] [CrossRef]
  6. Zhou, L.; Dickinson, R.E.; Tian, Y.; Fang, J.; Li, Q.; Kaufmann, R.K.; Tucker, C.J.; Myneni, R.B. Evidence for a significant urbanization effect on climate in China. Proc. Natl. Acad. Sci. USA 2004, 101, 9540–9544. [Google Scholar] [CrossRef] [PubMed] [Green Version]
  7. Patz, J.A.; Campbelllendrum, D.; Holloway, T.; Foley, J.A. Impact of regional climate change on human health. Nature 2005, 438, 310–317. [Google Scholar] [CrossRef] [PubMed]
  8. Yu, X.X.; Yang, G.S.; Wang, Y. Advance in researches on environmental effects of Land Use/Cover change. Sci. Geogr. Sin. 2004, 24, 627–633. [Google Scholar]
  9. Rao, P.K. Remote sensing of urban “heat islands” from an environmental satellite. Bull. Am. Meteorol. Soc. 1972, 53, 647–648. [Google Scholar]
  10. Gallo, K.P.; Mcnab, A.L.; Karl, T.R.; Brown, J.F.; Hood, J.J.; Tarpley, J.D. The use of a vegetation index for assessment of the ubran heat island effect. Int. J. Remote Sens. 1993, 14, 2223–2230. [Google Scholar] [CrossRef]
  11. Stathopoulou, M.; Cartalis, C. Downscaling AVHRR land surface temperatures for improved surface urban heat island intensity estimation. Remote Sens. Environ. 2009, 113, 2592–2605. [Google Scholar] [CrossRef]
  12. Vancutsem, C.; Ceccato, P.; Dinku, T.; Connor, S.J. Evaluation of modis land surface temperature data to estimate air temperature in different ecosystems over Africa. Remote Sens. Environ. 2010, 114, 449–465. [Google Scholar] [CrossRef]
  13. Wan, Z. New refinements and validation of the MODIS Land-Surface Temperature/Emissivity products. Remote Sens. Environ. 2014, 140, 36–45. [Google Scholar] [CrossRef]
  14. Liu, Y. A new approach to reduce inconsistency between MODIS and ASTER land surface temperature products. In Remote Sensing for Agriculture, Ecosystems, and Hydrology VIII; SPIE Remote Sensing; SPIE: Bellingham, WA, USA, 2006; Volume 6359. [Google Scholar]
  15. Shohei, K.; Takeki, I.; Hideo, T. Relationship between Terra/ASTER Land Surface Temperature and Ground-observed Air Temperature. Geogr. Rev. Jpn. 2016, 88, 38–44. [Google Scholar] [CrossRef]
  16. Cai, G.Y.; Du, M.Y.; Xue, Y. Monitoring of urban heat island effect in Beijing combining ASTER and TM data. Int. J. Remote Sens. 2011, 32, 1213–1232. [Google Scholar] [CrossRef]
  17. Nichol, J. An emissivity modulation method for spatial enhancement of thermal satellite images in urban heat island analysis. Photogramm. Eng. Remote Sens. 2009, 75, 547–556. [Google Scholar] [CrossRef]
  18. Wu, H.; Ye, L.P.; Shi, W.Z.; Clarke, K.C. Assessing the effects of land use spatial structure on urban heat islands using HJ-1B remote sensing imagery in Wuhan, China. Int. J. Appl. Earth Obs. Geoinf. 2014, 32, 67–78. [Google Scholar] [CrossRef]
  19. Li, W.; Sun, Y.; Meng, D.; Li, X. Analysis of Beijing’s urban heat-island under the influence of extrme heat based on HJ-1B data. In Proceedings of the 2013 IEEE International Geoscience and Remote Sensing Symposium, Melbourne, Australia, 21–26 July 2013; pp. 3845–3848. [Google Scholar]
  20. Qin, Z.H.; Karnieli, A.; Berliner, P. A mono-window algorithm for retrieving land surface temperature from Landsat TM data and its application to the Israel-Egypt Border Region. Int. J. Remote Sens. 2001, 22, 3719–3746. [Google Scholar] [CrossRef]
  21. Estoque, R.C.; Murayama, Y. Classification and change detection of built-up lands from Landsat-7 ETM+ and Landsat-8 OLI/TIRS imageries: A comparative assessment of various spectral indices. Ecol. Indic. 2015, 56, 205–217. [Google Scholar] [CrossRef]
  22. Bektas, B.F.; Mujgan, E.E. Land Surface Temperature Retrieval from Landsat 8 TIRS—A Case Study of Istanbul. In Proceedings of the EGU General Assembly Conference Abstracts, Vienna Austria, 17–22 April 2016. [Google Scholar]
  23. Kustas, W.P.; Nieto, H.; Morillas, L.; Anderson, M.C.; Alfieri, J.G.; Hipps, L.E.; Villagarcía, L.; Domingo, F.; Garcia, M. Using radiometric surface temperature for surface energy flux estimation in Mediterranean drylands from a two-source perspective. Remote Sens. Environ. 2013, 136, 234–246. [Google Scholar] [CrossRef]
  24. Zou, D.; Zhao, L.; Wu, T.; Wu, X.; Pang, Q.; Wang, Z. Modeling ground surface temperature by means of remote sensing data in high-altitude areas: Test in the central Tibetan Plateau with application of moderate-resolution imaging spectroradiometer Terra/Aqua land surface temperature and ground-based infrared. Appl. Remote Sens. 2014, 8, 083516. [Google Scholar] [CrossRef]
  25. Zhong, S.; Qian, Y.; Zhao, C.; Leung, R.; Wang, H.L.; Yang, B.; Fan, J.W.; Yan, H.P.; Yang, X.Q.; Liu, D.Q. Urbanization-induced urban heat island and aerosol effects on climate extremes in the Yangtze River Delta region of China. Atmos. Chem. Phys. 2017, 17, 1–57. [Google Scholar] [CrossRef]
  26. Carlson, T.N.; Arthur, S.T. The impact of use-land cover changes due to urbanization on surface microclimate and hydrology. As satellite perspective. Glob. Planet. Chang. 2000, 25, 49–65. [Google Scholar] [CrossRef]
  27. Rotem-Mindali, O.; Michael, Y.; Helman, D.; Lensky, I.M. The role of local land-use on the urban heat island effect of Tel Aviv as assessed from satellite remote sensing. Appl. Geogr. 2015, 56, 145–153. [Google Scholar] [CrossRef]
  28. Estoque, R.C.; Murayama, Y.; Myint, S.W. Effects of landscape composition and pattern on land surface temperature: An urban heat island study in the megacities of Southeast Asia. Sci. Total Environ. 2017, 577, 349–359. [Google Scholar] [CrossRef] [PubMed]
  29. Asgarian, A.; Amiri, B.J.; Sakieh, Y. Assessing the effect of green cover spatial patterns on urban land surface temperature using landscape metrics approach. Urban Ecosyst. 2015, 18, 209–222. [Google Scholar] [CrossRef]
  30. Weng, Q.H.; Yang, S.H. Managing the adverse thermal effects of urban development in a densely populated Chinese city. J. Environ. Manag. 2004, 70, 145–156. [Google Scholar] [CrossRef]
  31. Kotharkar, R.; Surawar, M. Land Use, Land Cover, and Population Density Impact on the Formation of Canopy Urban Heat Islands through Traverse Survey in the Nagpur Urban Area, India. J. Urban Plan. Dev. 2016, 142, 04015003. [Google Scholar] [CrossRef]
  32. Zhang, J.Y.; Wu, L.Y. Modulation of the urban heat island by the tourism during the Chinese New Year holiday: A case study in Sanya City, Hainan Province of China. Sci. Bull. 2015, 60, 1543–1546. [Google Scholar] [CrossRef]
  33. Zhang, H.; Qi, Z.F.; Ye, X.Y.; Cai, Y.B.; Ma, W.C.; Chen, M.N. Analysis of land use/land cover change, population shift, and their effects on spatiotemporal patterns of urban heat islands in metropolitan Shanghai, China. Appl. Geogr. 2013, 44, 121–133. [Google Scholar] [CrossRef]
  34. Peng, B.; Shi, Y.; Wang, H.; Wang, Y. The impacting mechanism and laws of function of urban heat island effect:A case study of Shanghai. Acta Eeogr. Sin. 2013, 68, 1461–1471. [Google Scholar]
  35. Raynolds, M.K.; Comiso, J.C.; Walker, D.A.; Verbyla, D. Relationship between satellite-derived land surface temperatures, arctic vegetation types, and NDVI. Remote Sens. Environ. 2008, 112, 1884–1894. [Google Scholar] [CrossRef]
  36. Yuan, F.; Bauer, M.E. Comparison of impervious surface area and normalized difference vegetation index as indicators of surface urban heat island effects in Landsat imagery. Remote Sens. Environ. 2007, 106, 375–386. [Google Scholar] [CrossRef]
  37. Bokaie, M.; Zarkesh, M.K.; Arasteh, P.D.; Hosseini, A. Assessment of Urban Heat Island based on the relationship between land surface temperature and Land Use/Land Cover in Tehran. Sustain. Cities Soc. 2016, 23, 94–104. [Google Scholar] [CrossRef]
  38. Xiao, R.B.; Ouyang, Z.Y.; Zheng, H.; Li, W.F.; Schienke, E.W.; Wang, X.K. Spatial pattern of impervious surfaces and their impacts on land surface temperature in Beijing. Chin. J. Environ. Sci. 2007, 19, 250–256. [Google Scholar] [CrossRef]
  39. Zhang, X.; Estoque, R.C.; Murayama, Y. An urban heat island study in Nanchang City, China based on land surface temperature and social-ecological variables. Sustain. Cities Soc. 2017, 32, 557–568. [Google Scholar] [CrossRef]
  40. Morais, M.V.B.; Freitas, E.D.; Urbina Guerrero, V.V.; Martins, L.D. A modeling analysis of urban canopy parameterization representing the vegetation effects in the megacity of São Paulo. Urban Clim. 2016, 17, 102–115. [Google Scholar] [CrossRef]
  41. Lemonsu, A.; Masson, V.; Shashuabar, L.; Erell, E.; Pearlmutter, D. Inclusion of vegetation in the Town Energy Balance model for modeling urban green areas. Geosci. Model Dev. Discuss. 2012, 5, 1295–1340. [Google Scholar] [CrossRef]
  42. Lee, D.; Woo, J.; Lee, S.H. An analytically-based numerical method for computing view factors in real urban environments. Theor. Appl. Climatol. 2018, 131, 445–453. [Google Scholar] [CrossRef]
  43. Ogashawara, I.; Bastos, V.D.S.B. A Quantitative Approach for Analyzing the Relationship between Urban Heat Islands and Land Cover. Remote Sens. 2012, 4, 3596–3618. [Google Scholar] [CrossRef] [Green Version]
  44. Chun, B.; Guldmann, J.M. Spatial statistical analysis and simulation of the urban heat island in high-density central cities. Landsc. Urban Plan. 2014, 125, 76–88. [Google Scholar] [CrossRef]
  45. Chen, X.L.; Zhao, H.M.; Li, P.X.; Yin, Z.Y. Remote sensing image-based analysis of the relationship between urban heat island and land use/cover changes. Remote Sens. Environ. 2006, 104, 133–146. [Google Scholar] [CrossRef]
  46. Gao, B.C. NDWI-A normalized difference water index for remote sensing of vegetation liquid water from space. Remote Sens. Environ. 1996, 58, 257–266. [Google Scholar] [CrossRef]
  47. Sheng, L.; Lu, D.S.; Huang, J.F. Impacts of land-cover types on an urban heat island in Hangzhou, China. Int. J. Remote Sens. 2015, 36, 1584–1603. [Google Scholar] [CrossRef]
  48. Luo, X.; Peng, Y. Scale Effects of the Relationships between Urban Heat Islands and Impact Factors Based on a Geographically-Weighted Regression Model. Remote Sens. 2016, 8, 760. [Google Scholar] [CrossRef]
  49. Du, H.; Song, X.; Jiang, H.; Kan, Z.; Wang, Z.; Cai, Y. Research on the cooling island effects of water body: A case study of Shanghai, China. Ecol. Indic. 2016, 67, 31–38. [Google Scholar] [CrossRef]
  50. Han, S.R.; Wei, S.; Zhou, W.; Zhang, M.J.; Tao, T.T.; Oiu, L.; Liu, M.S.; Xu, C. Quantifying the spatial pattern of urban thermal fields based on point of interest data and Landsat images. Sci. Geogr. Sin. 2017, 37, 5305–5312. [Google Scholar]
  51. Ranagalage, M.; Stock, R.C.; Murayama, Y. An Urban Heat Island Study of the Colombo Metropolitan Area, Sri Lanka, Based on Landsat Data (1997–2017). ISPRS Int. J. Geo-Inf. 2017, 6, 189. [Google Scholar] [CrossRef]
  52. Yue, W.Z.; Xu, J.H. Impact of Human Activities on Urban Thermal Environment in Shanghai. Sci. Geogr. Sin. 2008, 63, 247–256. [Google Scholar]
  53. He, X.F.; Jiang, W.M.; Chen, Y.; Liu, G. Numerical simulation of the impacts of anthropogenic heat on the structure of the urban boundary layer. Chin. J. Geophys. 2007, 50, 75–83. [Google Scholar] [CrossRef]
  54. Zhang, J.; Wu, L.; Yuan, F.; Dou, J.; Miao, S. Mass human migration and Beijing’s urban heat island during the Chinese New Year holiday. Sci. Bull. 2015, 60, 1038–1041. [Google Scholar] [CrossRef]
  55. Wu, L.Y.; Zhang, J.Y.; Shi, C.X. Mass Human Migration and the Urban Heat Island during the Chinese New Year Holiday: A Case Study in Harbin City, Northeast China. Atmos. Ocean. Sci. Lett. 2015, 8, 63–66. [Google Scholar]
  56. Zhengzhou Statistical Yearbook; China Statistics Press: Beijing, China, 2015.
  57. Bernabé, A.; Musy, M.; Andrieu, H.; Calmet, I. Radiative properties of the urban fabric derived from surface form analysis: A simplified solar balance model. Sol. Energy 2015, 122, 156–168. [Google Scholar] [CrossRef]
  58. Morais, M.V.B.; Marciotto, E.R.; Urbina Guerrero, V.V.; Freitas, E.D. Effective albedo estimates for the Metropolitan Area of São Paulo using empirical sky-view factors. Urban Clim. 2017, 21, 183–194. [Google Scholar] [CrossRef]
  59. Xie, M.M.; Wang, Y.L.; Fu, M.C. An overview and perspective about Causative factors of surface urban heat island effects. Prog. Geogr. 2011, 30, 35–41. [Google Scholar]
  60. Statistical Communiqu for Zhengzhou’s National Economic and Social Development in 2016. Available online: http://tjj.zhengzhou.gov.cn/tjgb/418270. jhtml (accessed on 20 April 2018).
  61. USGS (United States Geological Survey). Available online: http://earthexplorer.usgs.gov/ (accessed on 20 April 2018).
  62. Zhengzhou Statistical Yearbook; China Statistics Press: Beijing, China, 2001.
  63. Zhengzhou Statistical Yearbook; China Statistics Press: Beijing, China, 2007.
  64. Zhengzhou Statistical Yearbook; China Statistics Press: Beijing, China, 2011.
  65. Purevdorj, T.; Tateishi, R.; Ishiyama, T.; Hondaet, Y. Relationships between percent vegetation cover and vegetation indices. Int. J. Remote Sens. 1998, 19, 3519–3535. [Google Scholar] [CrossRef]
  66. Weng, Q.; Lu, D.S.; Schubring, J. Estimation of land surface temperature—Vegetation abundance relationship urban heat island studies. Remote Sens. Environ. 2004, 89, 467–483. [Google Scholar] [CrossRef]
  67. Sobrino, J.A.; Jiménez-Muñoz, J.C.; Paolini, L. Land surface temperature retrieval from LANDSAT TM 5. Remote Sens. Environ. 2004, 90, 434–440. [Google Scholar] [CrossRef]
  68. Vlassova, L.; Perezcabello, F.; Nieto, H.; Martín, P.; Riaño, D.; Riva, J.D.L. Assessment of Methods for Land Surface Temperature Retrieval from Landsat-5 TM Images Applicable to Multiscale Tree-Grass Ecosystem Modeling. Remote Sens. 2014, 6, 4345–4368. [Google Scholar] [CrossRef] [Green Version]
  69. Benmecheta, A.; Abdellaoui, A.; Hamou, A. A comparative study of land surface temperature retrieval methods from. Can. J. Remote Sens. 2013, 39, 59–73. [Google Scholar]
  70. Zha, Y.; Gao, J.; Ni, S. Use of normalized difference built-up index in automatically mapping urban areas from TM imagery. Int. J. Remote Sens. 2003, 24, 583–594. [Google Scholar] [CrossRef]
  71. Liu, H.; Weng, Q. Enhancing temporal resolution of satellite imagery for public health studies: A case study of West Nile Virus outbreak in Los Angeles in 2007. Remote Sens. Environ. 2012, 117, 57–71. [Google Scholar] [CrossRef]
  72. Kikon, N.; Singh, P.; Singh, S.K.; Vyas, A. Assessment of urban heat islands (UHI) of Noida City, India using multi-temporal satellite data. Sustain. Cities Soc. 2016, 22, 19–28. [Google Scholar] [CrossRef]
  73. Zhao, S.Y. Principle and Method of Remote Sensing Application Analysis; The Science Publishing Company: Beijing, China, 2003. [Google Scholar]
  74. Mei, A.X. Introduction of Remote Sensing; Higher Education Press: Beijing, China, 2001. [Google Scholar]
  75. Artis, D.A.; Carnahan, W.H. Survey of emissivity variability in thermography of urban areas. Remote Sens. Environ. 1982, 12, 313–329. [Google Scholar] [CrossRef]
  76. Kan, Z.; Liu, C.; Zhou, C. Comparative analysis of land surface emissivity retrieval methods and the impact on the land surface temperature based on Landsat-8 thermal infrared data. In Remote Sensing and Modeling of Ecosystems for Sustainability XII; Optical Engineering + Applications; SPIE: Bellingham, WA, USA, 2015; Volume 961012. [Google Scholar]
  77. Na, Y.T. Study on the Application and Comparative Analysis of Land Surface Temperature Retrieval Method Based on Multi-Sensor Remote Sensing Data. Adv. Mater. Res. 2014, 1010–1012, 1276–1279. [Google Scholar] [CrossRef]
  78. Liu, J.Y.; Zhang, Z.X.; Zhuang, D.F.; Zhang, S.W.; Li, X.B. Spatio Temporal Information of Land Use Change in China in 1990s; Science Press: Beijing, China, 1994. [Google Scholar]
  79. Kerr, Y.H.; Lagouarde, J.P.; Nerry, F.; Ottlé, C.; Quattrochi, D.A.; Luvall, J.C. Land surface temperature retrieval techniques and applications. In Thermal Remote Sensing in Land Surface Processing; CRC Press: Boca Raton, FL, USA, 2000; pp. 33–109. [Google Scholar]
  80. China Meteorological Administration. Available online: http://www.cma.gov.cn/2011qxfw/2011qsjcx/ (accessed on 20 April 2018).
  81. Kalnay, E.; Cai, M. Impact of urbanization and land-use change on climate. Nature 2003, 423, 528–531. [Google Scholar] [CrossRef] [PubMed]
  82. Zhang, H.F.; Wang, Y.L.; Wu, J.S.; Li, W.F.; Li, Z.G. Study on land surface temperature vegetation cover relationship in urban region:a case in Shenzhen City. Geogr. Res. 2006, 25, 369–377. [Google Scholar]
  83. Huang, R.F.; Xu, H.Q. A study on the relationship between land cover/use and urban heat environment using Landsat ETM+ satellite imagery. Remote Sens. Inf. 2005, 0, 36–39. [Google Scholar]
  84. Gao, X.; Wu, G.X.; Du, G.Y.; Li, C.P.; Shen, H.F. A Spatio-temporal changes of thermal landscape pattern based on a multifractal model: A case study of Zhengzhou City. Acta Ecol. Sin. 2015, 35, 6774–6787. [Google Scholar]
  85. Rhee, J.; Park, S.; Lu, Z. Relationship between land cover patterns and surface temperature in urban areas. Map. Sci. Remote Sens. 2014, 51, 521–536. [Google Scholar] [CrossRef]
  86. Zhao, Z.C. The changes of temperature and the effects of the urbanization in China in the last 39 years. Meteorol. Mon. 1991, 17, 14–17. [Google Scholar]
  87. Ren, G.Y.; Xu, M.Z.; Chu, Z.Y.; Guo, J.; Li, Q.X.; Liu, X.N.; Wang, Y. Change of surface air temperature in China during 1951–2004. Clim. Environ. Res. 2005, 10, 717–727. [Google Scholar]
  88. Su, Y.F.; Foody, G.M.; Cheng, K.S. Spatial non-stationarity in the relationships between land cover and surface temperature in an urban heat island and its impacts on thermally sensitive populations. Landsc. Urban Plan. 2012, 107, 172–180. [Google Scholar] [CrossRef]
  89. Wang, J.; Huang, B.; Fu, D.; Atkinson, P.M. Spatiotemporal Variation in Surface Urban Heat Island Intensity and Associated Determinants across Major Chinese Cities. Remote Sens. 2015, 7, 3670–3689. [Google Scholar] [CrossRef] [Green Version]
  90. Yao, R.; Wang, L.; Huang, X.; Niu, Z.; Liu, F.; Wang, Q. Temporal trends of surface urban heat islands and associated determinants in major Chinese cities. Sci. Total Environ. 2017, 609, 742. [Google Scholar] [CrossRef] [PubMed]
  91. Du, S.; Wang, Q.; Guo, L. Spatially varying relationships between land-cover change and driving factors at multiple sampling scales. J. Environ. Manag. 2014, 137, 101–110. [Google Scholar] [CrossRef] [PubMed]
  92. Luo, X. Scale effect analysis of the relationships between urban heat island and impact factors: Case study in Chongqing. J. Appl. Remote Sens. 2014, 8, 284–292. [Google Scholar] [CrossRef]
Figure 1. Location of the research area: Zhengzhou, China.
Sustainability 10 01992 g001
Figure 2. The land use maps in (a) 1996, (b) 2000, (c) 2006, (d) 2010 and (e) 2014 in Zhengzhou, China.
Sustainability 10 01992 g002aSustainability 10 01992 g002b
Figure 3. Sampling directions used in the study area.
Sustainability 10 01992 g003
Figure 4. The land surface temperature (LST) maps of Zhengzhou, China in (a) 1996, (b) 2000, (c) 2006, (d) 2010, and (e) 2014.
Sustainability 10 01992 g004aSustainability 10 01992 g004b
Figure 5. The eight LST profiles in 1996, 2000, 2006, 2010, and 2014 in Zhengzhou, China (°C).
Sustainability 10 01992 g005
Figure 6. The LSTs for different land use types in 1996, 2000, 2006, 2010, and 2014 in Zhengzhou, China (°C).
Sustainability 10 01992 g006
Figure 7. The Normalized Difference Vegetation Index (NDVI) maps in (a) 1996, (b) 2000, (c) 2006, (d) 2010, and (e) 2014 in Zhengzhou, China.
Sustainability 10 01992 g007aSustainability 10 01992 g007b
Figure 8. The NDVI maps of Zhengzhou, China in (a) 1996–2000, (b) 2000–2006, (c) 2006–2010, and (d) 2010–2014.
Sustainability 10 01992 g008
Figure 9. The Normalized Difference Building Index (NDBI) maps in (a) 1996, (b) 2000, (c) 2006, (d) 2010, and (e) 2014 in Zhengzhou, China.
Sustainability 10 01992 g009aSustainability 10 01992 g009b
Figure 10. The NDBI maps of Zhengzhou, China in (a) 1996–2000, (b) 2000–2006, (c) 2006–2010 and (d) 2010–2014.
Sustainability 10 01992 g010
Figure 11. The population of Zhengzhou and its districts in 1996, 2000, 2006, 2010 and 2014.
Sustainability 10 01992 g011
Table 1. The values of K1 and K2 (revision coefficients) for different sensors.
SensorsTMETM+OLI
K1 (W/m2·sr·µm)607.76666.09774.89
K2 (K)1260.561282.711321.08
Table 2. The LST in Zhengzhou, China.
YearMaximum (°C)Minimum (°C)Amplitude (°C)Average (°C)Standard Deviation
199640.8 13.2 27.6 29.2 4.1
200049.6 7.2 42.4 29.7 4.4
200645.0 12.0 32.9 29.0 3.4
201045.1 13.9 31.3 32.0 3.2
201445.3 18.8 26.4 32.7 2.6
Table 3. Correlation analysis between the LST and three socio-economic driving factors in Zhengzhou, China.
Driving FactorRegression EquationCorrelation CoefficientR2p
Population densityy = 0.668x + 0.1880.7620.5800.01
Urban constructiony = 0.698x + 0.0830.7230.5230.01
Industrial developmenty = 0.818x + 0.0770.7740.6000.01

