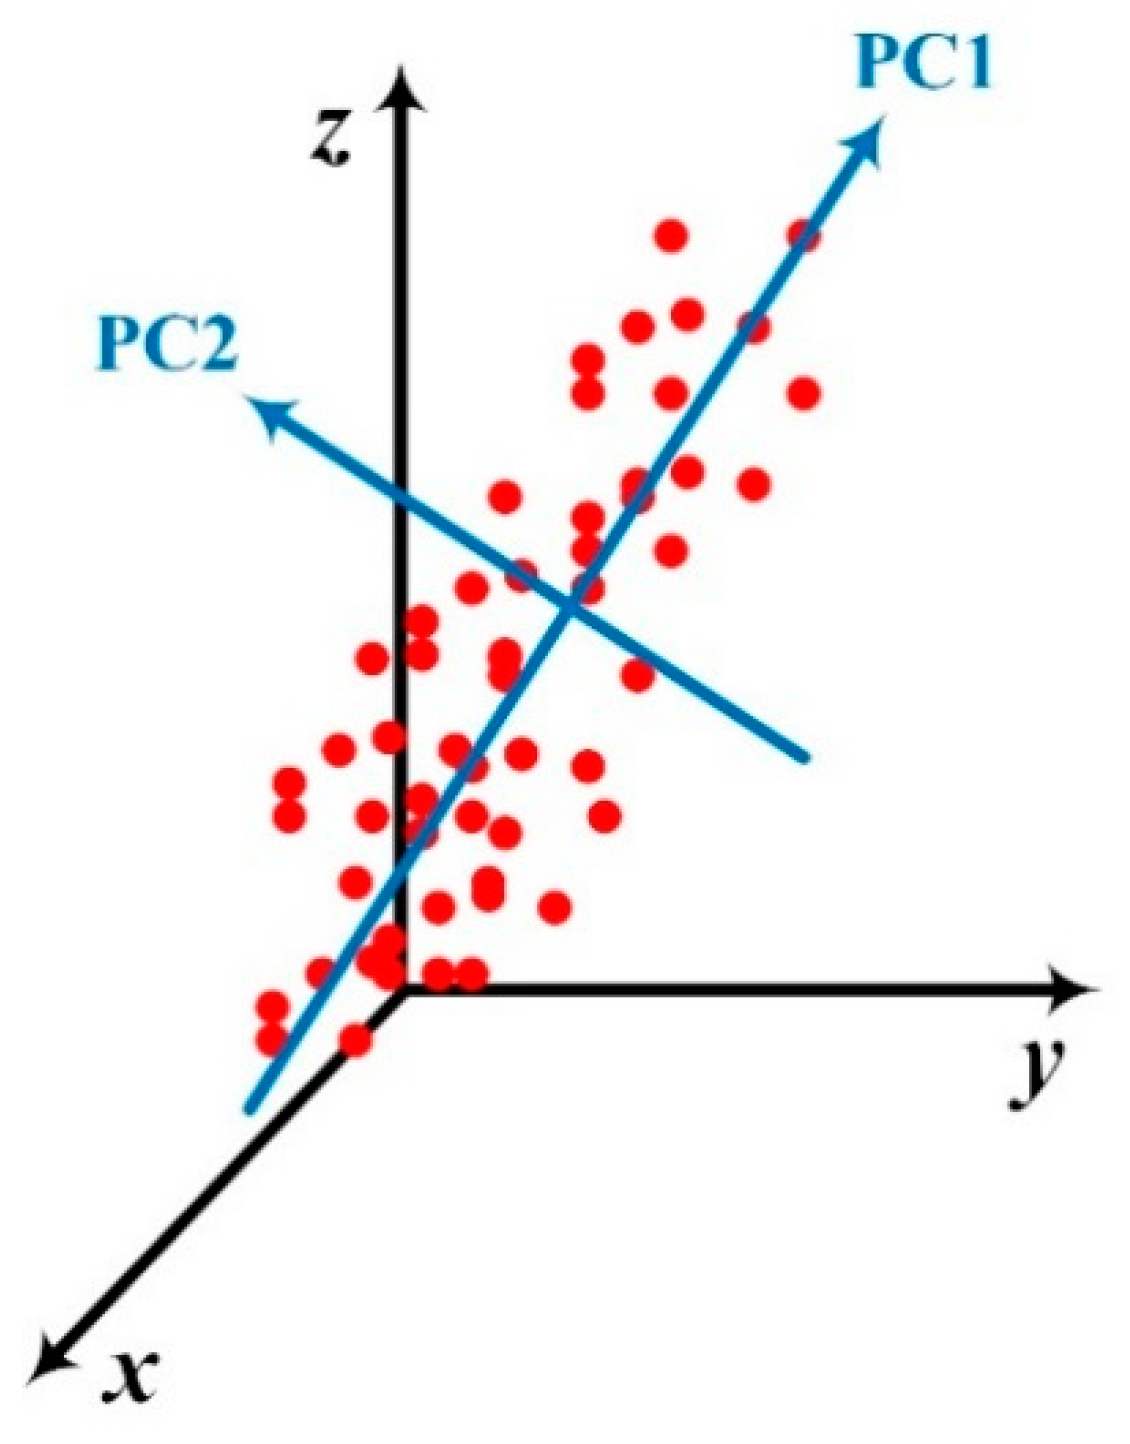
Article

A Questionnaire Case Study of Chinese Opinions on the Haze Pollution and Economic Growth

1
Central Bucks High School East, Doylestown, PA 18902, USA
2
Central Bucks High School South, Warrington, PA 18976, USA
3
Conestoga High School, Berwyn, PA 19312, USA
4
School of Environmental Science and Engineering, Nanjing University of Information Science and Technology, Nanjing 210044, China
5
Department of Environmental Engineering, Hebei University of Engineering, Handan 056038, China
6
Department of Chemical Engineering, Villanova University, Villanova, PA 19085, USA
*
Author to whom correspondence should be addressed.
Sustainability 2018, 10(6), 1970; https://doi.org/10.3390/su10061970
Submission received: 23 May 2018 / Revised: 3 June 2018 / Accepted: 4 June 2018 / Published: 12 June 2018
(This article belongs to the Section Environmental Sustainability and Applications)

Abstract

:
Haze pollution in China has reshaped daily life for the Chinese and led to serious health issues. At the same time, the Chinese have enjoyed the rapid economic growth that has contributed to this pollution. While questionnaire-based studies have been conducted within certain regions of China to learn the public’s opinions of haze pollution, little work has been done to understand how Chinese citizens value haze treatment in relation to their nation’s economic growth at a nationwide scale. To fill this knowledge gap, this project conducted a nationwide investigation of Chinese opinions on the benefits of economic growth versus the disadvantages of haze pollution, as well as their responses to efforts by the Chinese government to combat haze and to the influence of haze on Chinese daily life and on personal health. The study also sought suggestions for combatting haze. In particular, an anonymous questionnaire consisting of 29 questions was given in the summer and fall of 2017 to 1233 people of different genders, ages, child statuses, educational backgrounds, occupations, living areas (rural, suburban, and urban), and living regions. The statistical Chi squared test was then used to identify the demographic group of respondents supporting the economic slowdown policy or requesting more efforts from the Chinese government to combat haze pollution. A multivariate statistical approach—principal component analysis—was further applied to visualize respondents’ feedback on the impact of haze on their daily life and personal health, as well as the change of environment and economic conditions in the last 10 years. The results show that more than 50% of respondents, especially those with children, those between the ages of 31 to 50, and those living in high-pollution regions, supported the economic slowdown policy. Totally 40.63% of the entire group of respondents believed the government’s efforts to control haze were small or very small. Only 27.84% of respondents held the opposite opinions. In total, 72.91% of respondents believed the environment in China became worse or much worse in the past 10 years; however, most responded positively to the idea of resolving the haze issue within 15 or more years. Haze has caused health issues in and around half of the respondents and has significantly reshaped their outdoor activities.

1. Introduction

The economic boom in China following the reforms introduced by Deng Xiaoping during the 1980s turned the country into a global powerhouse [1]. Specifically, while 27.6% of China was urbanized in 1992, this percentage increased to 52.6% in 2012 (cited from China Statistical Yearbooks). The Gross domestic product (GDP) grew by an average of 9% or more each year from the late 1980s to 2014 [2]. This economic growth in China is largely reliant on the large industries powered by fossil fuels, including steel factories. For instance, the 6.9% GDP growth in the second quarter of 2017 was largely due to the growth of the steel, coal, and cement industries, which are regarded as some of the most damaging industries for the environment [3]. China has developed as the top producer of coal in the world, producing 3.46 billion tons in 2016 alone, according to the Chinese National Bureau of Statistics. Coal is proven to be harmful to the environment: emissions due to coal often release mercury upon combustion [4,5,6]. Additionally, coal has contributed to 40% of all fossil fuel CO2 emissions [7]. The rapid infrastructure construction and urban expansion in China impose the highest demand for cement in the world. In particular, China produced around 57% of global cement production (i.e., 1.87 billion metric tons of cement) in 2010, with an average annual growth rate of 11.6% in cement production over the past two decades. China’s recent rapid industrial and urban growth has resulted in environmental complications such as the haze that is the focus of this study. A slight obscuration of the atmosphere by small solid or liquid particles, haze represents a form of air pollution that has become a prevalent concern in China, especially near city clusters [1]. Particles in the air with a diameter of less than 2.5 micrometers (so-called PM2.5) has caused 652,000 premature deaths in 2015 in 161 cities within nine regions across China, accounting for a total of 6.92% of all deaths that year [8]. The air quality in China as of the winter of 2016 has far exceeded dangerous levels, causing cancelled flights, closed schools, and poor visibility. While a concentration of 300 micrograms per cubic meter of PM2.5 particles is considered hazardous, 74 Chinese cities exceeded this number in 2013, with some even reporting numbers as high as 700 [9]. The problem posed by Chinese air pollution can no longer be ignored. The rapid economic growth that is driven by coal, steel, cement and other industries presents a growing contrast between the country’s economic and environmental goals. It is thus crucial to understand where the public stands on the issue because it can reveal to government policy makers and industrial owners the best course of action for implementing changes that will most effectively improve the quality of life for the Chinese populations. It may influence future economic endeavors that China can take on to maintain an environmentally sustainable but also economically successful nation.
To address the aforementioned issues, this project presents a questionnaire to survey the opinions of the Chinese public on how they prioritize controlling haze pollution versus encouraging economic growth and their thoughts on efforts that might be made by the Chinese government to reduce haze pollution. Questionnaire survey approaches have been widely implemented as a means to obtain Chinese opinions on topics that are related to China’s haze pollution problem: (1) the annual consumption of various energy varieties (e.g., coal and fuel gas) in rural areas of northern China [10]; (2) tourists’ perception of haze pollution and the potential impacts on travel to Beijing in China [11]; (3) public awareness of smog pollution in China [12,13,14,15,16]; (4) the public’s willingness to pay (WTP) for reducing or tracking haze pollution [17,18,19,20,21,22]; (5) the public’s adaptive behavior responses to haze pollution in urban China [23,24]; (6) personal protection strategies from haze pollution [23,25]; and (7) consumers’ purchase intentions related to products that deal with haze pollution [26].
These studies indicate that the questionnaire-based survey is an effective approach for obtaining the public’s opinions on haze pollution in China. However, few of these studies have covered the topic of how far people are willing to go in sacrificing economic growth and halting the exacerbation of the environmental situation in China. This project aims to fill this knowledge gap. While several studies have been conducted to evaluate the government’s performance in responding to and controlling haze pollution [12,19], these were limited to either local areas (e.g., Xinjie, a rural area in central China) or specific populations (e.g., skilled workers). We revisit this question here by exposing it to more general populations with various demographic backgrounds (i.e., gender, age, child status, educational background, occupation, living area (rural, suburban, and urban), and living region in China). In addition, this work implements advanced multivariate statistics methods to extract important patterns from the wealth of data obtained through the 29-question survey, which includes seven demographics questions concerning gender, child status, age, education background, occupation, population density of the living area, and living region in China; 18 multiple choice questions surveying opinions regarding haze pollution and economic growth; three checklist questions (select all applicable answers); and one open-ended question asking for suggestions on battling the haze in China. The findings from this work can provide Chinese policymakers with information such as: (1) which demographic groups are satisfied/dissatisfied with the government’s performance in reducing haze pollution; (2) which demographic groups want to encourage/discourage slowing down economic growth to treat haze pollution; (3) a nation-wide investigation of the impact of haze pollution on Chinese daily life and public health; and (4) respondent’s suggestions on how to reduce haze pollution.

2. Materials and Methods

2.1. Questionnaire Design and Sampling

The questionnaire designed for this project relied on psychometric paradigm methods [27,28]. The detailed decription of the questionnaire is provided as follows. The questionnaire includes the following topics: (1) respondents’ demographic information; (2) respondents’ opinions on the relationship between haze pollution and economic growth in China; (3) respondents’ comments on the treatment of haze pollution in China; and (4) the impact of haze pollution on respondents’ daily life and personal heath. The demographic parameters included in the questionnaire have been found important for studying people’s opinions on haze pollution. In particular, the respondent’s age, gender, education [24], living regions [14], and occupation [29] were found to play an important role in determining respondents’ opinions on haze pollution. The study presented in Reference [16] considered all these demographic parameters. The aforementioned demographic parameters were investigated in Questions 1–7. Specifically, Questions 1–3 surveyed general information of the respondents including their gender, age, and child status; Questions 4 and 5 ascertained the level of knowledge of the respondent by questioning his/her education and occupation; and Questions 6 and 7 determined the location and living area of the respondent. These questions allowed us to analyze the severity of haze pollution in different parts of China and analyze the concern and awareness of the problem by those who experience it firsthand.
Questions 8–29 surveyed the respondent’s opinions on the experience with several issues regarding haze pollution versus the economic growth, haze pollution treatment, impact of haze pollution on the respondent’ daily life and personal health. In particular, Questions 8–12 studied the respondent’ opinions on quality of life and the environment pollution in China, including: whether the haze had negative impact on respondents’ life in the past 10 years (Question 8); how the environment changed in the past 10 years in China (Question 9); how the environment will change in China in the future (Question 10); how long the respondent thinks it will take for China to resolve the haze problem (Question 11); and how the respondent’ quality of life (with the consideration of both environment and economic conditions) has changed in the past 10 years (Question 12). Questions 13–17 further surveyed the respondent’s willingness to sacrifice economic growth in favor of controlling haze pollution: Question 15 asked about whether the government had done enough to combat haze; Question 16 was about whether the respondents supported potential policies that might slow down economic growth to work toward reducing haze pollution; and Question 17 listed options respondents could select to prioritize economic growth over reducing haze pollution or to prioritize reducing haze pollution over economic growth. Questions 18–22 were focused on haze pollution and its treatment, including: approaches for reducing haze pollution (Question 18); determinations of the global warming effect of haze pollution (Question 19); daily assessments by respondents to check the daily haze value, i.e., PM2.5 (Question 20); existence in the respondent’s city of haze pollution (Question 21); and possible troubles the haze may have caused in the respondent’s daily life or work (Question 22). Questions 23–28 collected information on the respondents’ personal experiences with haze pollution and the effects it had on the respondents’ families. Question 23 asked how much respondents had reduced their outdoor activities. Question 24 surveyed whether respondents changed their habits (e.g., taking buses instead of driving personal cars) due to the haze pollution. Question 25 studied whether respondents intended to leave if their city had haze. Question 26 investigated the approaches respondents used to protect themselves. Question 27 asked how often the respondents or their immediate families had contracted haze related health complications. Question 28 further studied the affected area in the respondents’ bodies if they got sick during periods of high haze pollution. Question 29 was an open-ended question that allowed respondents to input comments on haze pollution and thoughts on moving toward a sustainable environment in China.
The questionnaire survey was mainly conducted through one of the most popular online surveying websites in China (www.diaochapai.com) and distributed through the most common social media apps (e.g., WeChat) used by Chinese. To make as many Chinese aware of this survey as possible, the survey was disseminated by local Chinese people from different educational backgrounds throughout different regions of China and to as many people as they knew. The questionnaire ultimately surveyed 1233 people in total, gathering the demographics of each respondent and their opinions on many different subjects concerning haze pollution and the Chinese economy. The samples were mainly collected in the summer and fall of 2017. Since the policies in China may change with time, the survey results may not reflect the latest opinions on haze pollution and economic growth. To get more complete (e.g., more samples) and timely Chinese opinions on these issues, questionnaires need to be manually and frequently handed to people living all over China. With the consideration of time, the legal permit, and the cost for conducting such a survey in China, we conclude that a more complete and timely survey can only be done by the Chinese government. Nevertheless, this work aims to provide a reference that reflects the opinions of some Chinese people on the haze pollution.

2.2. Statistical Analyses

The survey data were analyzed to get the histogram for each of Questions 1–28. This can indicate the preference of respondents for the options listed for each question. Once the result for each question was shown, multivariate statistical methods, including Chi-squared test (CST) and principal component analysis (PCA), were further implemented to analyze respondents’ opinions on the key problems that this work was focused on. These problems are mainly related to respondents’ satisfaction on the government’s effort in preventing the haze pollution, respondents’ preference on slowing economics to prevent the haze pollution, and respondents’ opinions on the change in living environment, quality of life, and daily activities caused by haze pollution.
In this work, the CST is mainly used to determine whether respondents’ opinions on Question 15 (i.e., whether the government had done enough to combat haze,) and Question 16 (i.e., whether respondents supported the policy to slow down economic growth for reducing haze pollution) are independent of their demographic backgrounds (i.e., gender, child status, age, educational background, occupation, population density of the living area, and living region in China). For example, Table 1 shows the results of respondents’ opinions on Question 16 based on their ages. The null hypothesis is that respondents’ opinions are independent of their ages. As for the respondents between the ages of 41 and 50 years, they take 35.5% (calculated by 438/1233) of the whole 1233 respondents. It is thus expected that 35.5% of the 669 respondents who support the policy should be between the ages of 41 and 50 years. This expected number, represented by nexpected,i in Equation (1), equals 237 (calculated by 35.5% × 669). It is observed from the table that there are actually 273 people between 41 and 50 years supporting the policy. The difference between this observed number (represented by nobserved,i) and the expected number nexpected,i contributes one term in Equation (1) in the CST, i.e., (273 − 237)2/237 = 5.47. The same approach is used to quantify the difference between the observed and expected numbers for other age categories so that all age categories are considered in the Chi-squared value (i.e., χ 2 ). The Chi-squared value, along with the number of age categories (i.e., five age groups) and opinion categories (i.e., four different opinion, is then used as the input of the Chi-squared distribution to determine whether the difference is statistically significant. Typically, a p-value less than 0.05 is used to reject the null hypothesis (i.e., respondents’ opinions are independent of ages in this case). The command chisq.test in R was used in this work to perform the CST. Since the calculated p-value is 2.0 × 10⁻⁵, much less than 0.05, it is concluded that the alternative hypothesis (i.e., respondents’ opinions depend on ages) is correct. A CST was performed for all demographic categories for Questions 15 and 16 in this project.
χ 2 = i = 1 k ( n o b s e r v e d , i n e x p e c t e d , i ) 2 n e x p e c t e d , i
While the CST is used to identify the demographic groups who expect more efforts from the government toward haze prevention (Question 15) and who prefer to slow down economic growth for haze prevention (Question 16), principal component analysis is further used to visualize respondents’ opinions on the impact of haze pollution in respondents’ living environment, quality of life, and daily activities over the last few years. Principal component analysis (PCA) is one of the most commonly used multivariate statistical tools to analyze and visualize high-dimensional datasets [30,31]. The idea of PCA is to represent the original data using fewer new orthogonal variables called principal components that are obtained as linear combinations of the original coordinate variables. As shown in Figure 1, PCA can use a two-dimensional space that is represented by the first two principal components (i.e., PC1 and PC2) to present the original three-dimensional data. Each of individual principal components is essentially a linear combination of original coordinate variables. The essential idea of PCA is to rotate the original coordinate system so that the projections of the original data onto PC1 have the largest variance, which means that the PC1 can retain the largest portion of information from the original data. PC2 is orthogonal to PC1 and retains the second largest portion of information from the original data. Typically, the original data can be shown by the reduced dimensional space represented by the first few principal components. This explains why PCA has been widely used in high-dimensional data reduction and visualization. In this work, PCA was used to visualize the opinions of 1233 respondents on Question 8 (i.e., whether the negative impact on daily life was large), Question 9 (i.e., whether the environment became worse and worse in the last 10 years), Question 12 (i.e., whether the living quality, with the consideration of both economic and environment situations, became worse in the last 10 years), Question 22 (i.e., whether the haze pollution caused troubles in respondents’ work and daily life), and Question 23 (i.e., whether respondents reduced outdoor activities due to the haze pollution). The command prcomp in R, which is a popular programming language widely used in statistics analysis of statistical data [32] and data in engineering [33], was used to perform principal component analysis.

3. Results

After analyzing the statistics, an overview of the results for all questions in the survey is shown below. This is followed by the analysis of respondents’ opinions on Question 16 to study the influence from demographic parameters like age and educational background on respondents’ opinions on the policy that would slow down the economy to combat haze. This is followed by respondents’ satisfaction with government efforts in haze prevention (i.e., Question 15). While the CST can be applied to study other questions, this work is mainly focused on Questions 15 and 16, which were seldom studied in a nationwide scale in China. To get a comprehensive viewpoint of respondents on the change in their living environment, the life quality, and daily activities in the last few years, principal component analysis was used to project respondents’ feedback for Questions 8, 9, 12, 23 and 24 onto a two-dimensional space. Finally, results from the impact of haze on respondents’ daily life and personal health and from respondents’ suggestions for combating haze were presented.

3.1. Overview of the Survey Results

Questions 1–7 were designed for the demographic analysis of gender, child status, age, educational background, occupation, population density of the living area, and living region in China. Questions 8–29 then showed respondents’ opinions on the haze pollution and economic growth. Figure 2, Figure 3, Figure 4, Figure 5, Figure 6, Figure 7, Figure 8, Figure 9, Figure 10, Figure 11, Figure 12, Figure 13, Figure 14, Figure 15, Figure 16, Figure 17, Figure 18, Figure 19, Figure 20, Figure 21, Figure 22, Figure 23, Figure 24, Figure 25, Figure 26, Figure 27, Figure 28 and Figure 29 show Questions 1–28 and the survey results one by one. Both the question and the discussion of the result are given in the title of each figure. The result for Question 29, which was an open-ended question for respondents to input their comments on the haze pollution, is shown in the Section 3.5.

3.2. Respondents’ Opinions on Haze versus the Economic Growth

Respondents’ feedback on Questions 13 and 14 indicated that more than 50% of respondents agreed that the economic growth and the haze pollution were highly correlated, and that the rapid economic growth was one of the major factors leading to the haze pollution. Here, we further investigated respondents’ preference on rapid economic growth versus lower haze pollution (i.e., Question 16). The CST indicated that respondents’ opinions on the policy to slow down economic growth to combat haze were dependent on their genders (p-value of 1.06 × 10⁻³), their child statuses (p-value of 1.37 × 10⁻⁴), their ages (p-value of 1.98 × 10⁻⁵), and the regions they lived in (p-value of 3.52 × 10⁻⁴). Since the CSTs on respondents’ child statuses and ages were of the smallest p-value, detailed analysis of the results on these two demographic categories is given below. The results on respondents’ genders and living regions were then briefly summarized.
As shown in the previous section, 54.26% of respondents generally supported the policy to slow down economic growth to combat haze (i.e., Question 16). This implied that Chinese people may be willing to sacrifice economic growth for a better living environment. We further investigated respondents’ opinions from different demographic groups (i.e., gender, child status, age, educational background, occupation, population density of the living area, and living region). As shown in Figure 30, 57.48% of those currently with children stated that they would support government policy that slowed down the economy to prevent haze from worsening. This is compared to the weaker support coming from those planning to have children, only 39.51% of whom support the policy, and those not planning to have children, 45.69% of whom support the policy. For all three demographic groups, the percentage of people supporting the policy was much larger than the one opposing the policy and the one without preference (i.e., neutral). Among these three groups, the respondents with children were more supportive of government policies against haze. This is likely because the parents were more stressed by the health issues caused by haze pollution on their young children. We further analyzed respondents’ opinions to Question 16 based on respondents’ ages (Figure 31). A majority of respondents between the ages of 31 and 50 believed that the economic development should be slowed down to control the haze. However, for the older group (above 50 years old) or younger group (below 30 years old), people were more reserved and were neutral about economic slow-down as a government policy. This may be because these respondents need more stable employment or financial help. While economic slowdown may be beneficial for middle aged respondents in stable lifestyles, those just entering or about to leave the workforce may experience adverse results.
Similar analysis was performed on respondents’ opinions on the economic-slowdown policy according respondents’ genders and living regions. While more than 53% of respondents in each of the female and male categories supported the economic-slowdown policy, 19.2% of the male respondents, versus 13.8% of female respondents, opposed the policy. That may be because husbands contribute to the major financial income in most Chinese families. As for living regions, respondents from East China (55.8%), North China (56.4%), Northwest China (64%), and Southwest China (59.0%) showed stronger support of the economic-slowdown policy than other regions. On the other hand, respondents from Northeast China (34.14%) showed the least support on the policy. Since economic growth in Northeast China has slowed down recently, it is understandable that people living there are against the economic-slowdown policy.

3.3. Respondents’ Opinions about the Government Effort in Haze Prevention

A CST was performed for the seven demographic categories in Question 15 (i.e., whether the government’s effort in handling haze pollution was significant). It indicated that respondents’ opinions depended on their genders (p-value of 5.45 × 10⁻³), ages (p-value of 5.07 × 10⁻⁶), educational backgrounds (p-value of 1.45 × 10⁻⁵), occupations (p-value of 2.89 × 10⁻⁶), living area population density (p-value of 1.07 × 10⁻¹¹), and living region (p-value of 2.2 × 10⁻¹⁶). As mentioned above, 40.63% of all respondents believed the government’s efforts to control haze were small or very small, which represented the largest portion of respondents in the five options of “very small effort”, “small effort”, “medium effort”, “large effort”, and “very large effort”. A sum percentage of larger than 40.63% in the options of “very small effort” and “small effort” thus indicates the corresponding demographic categories of respondents desired more government effort to combat haze pollution. This may indicate that Chinese people are expecting more effort from the Chinese government to control haze. The following demographic categories of respondents requested more efforts from the government in handling the haze pollution: female respondents in the gender category, respondents below 40 in the age category, respondents with bachelor or high-school degrees in the education category, respondents working as farmers, doctors, students, and regular company employees in the occupation category, respondents living in rural areas in the category of population density, and respondents from Northeast China, South China, and Southwest China in the category of living region. It is interesting to see in Figure 32 that people with a Bachelor’s degree or lower mostly said that the government was not doing much about the haze problem, while people with Master’s degrees were less inclined to respond that way. People with PhDs were evenly split in their responses. The respondents with higher education levels may know more about the (technical) challenges involved in reducing haze pollution in a short time frame and thus appreciate the government’s effort. While at first glance it may seem that the national environmental effort is small, a deeper understanding of the laws and regulations being implemented may reveal stronger efforts by the government to treat haze. People from areas with less severe haze pollution, such as rural residents and people from Northeast China, South China, and Southwest China, requested more government effort in handling the haze pollution. A potential reason for this is that most of the government’s policies on haze pollution were applied to those areas with severe haze pollution. Respondents not living in those areas thus may not feel the government’s effort in handling the haze pollution.

3.4. The Impact of Haze on Respondents’ Daily Life and Personal Health

The following questions in the survey are related to the influence of haze on respondents’ daily life: Question 8 (i.e., whether the negative impact on daily life was large), Question 9 (i.e., whether the environment worsened progressively over the last 10 years), Question 12 (i.e., whether living quality—considering both economic and environmental situations—worsened over the last 10 years), Question 22 (i.e., whether the haze pollution caused troubles in respondents’ work and daily life), and Question 23 (i.e., whether respondents reduced outdoor activities due to haze pollution). Respondents’ opinions on these five questions may be correlated to each other. For instance, respondents agreeing with that the haze pollution caused troubles in their work and daily life (i.e., Question 23) may also feel that the negative impact of the haze pollution on their daily life was large. To project the opinions of respondents on these five questions, principal component analysis was implemented to identify a two-dimensional space defined by the first two principal components PC1 and PC2 that are orthogonal (or uncorrelated). Both PC1 and PC2 are the linear combination of the variables representing the respondents’ answers to the five questions. To facilitate the understanding of the projections of original data onto the PC1-PC2 space, vectors representing respondents’ opinions of the five questions were also plotted in Figure 33. Vectors in similar directions indicate that respondents’ answers to those questions are correlated. For instance, respondents whose daily life was impaired by haze (Question 8) tended to agree that haze caused troubles in their work and daily life (Question 22). Similarly, respondents who thought the environment got worse or much worse in the last 10 years (Question 9) tended to agree that life quality got worse (Question 12) and tended to reduce outdoor activities (Question 23). The power of principal component analysis is in its ability to visualize five-dimensional data so that we can get a more comprehensive view. In Figure 33, bubbles were used to represent an assembly of respondents, with larger sizes indicating more respondents. For example, the large bubble along the direction of Question 8 indicated that many respondents agreed that the negative impact on their daily life was large. Similar, the respondents’ opinions on other questions can be visualized in the figure. Figure 33 also shows that the large bubbles are mainly located in the sector from vector Q#12 clockwise to Q#22. This means that respondents generally agreed that the environment became worse and that haze caused trouble in their daily life. This resulted in reduced outdoor activities. Figure 34 shows the reduction of outdoor activities for respondents living in areas with different population densities (Q#23). Those living in rural districts did not reduce their outdoor activity (due to haze) as much as those living in urban and suburban zones.
While Figure 5 and Figure 6 show that respondents’ daily life was significantly influenced by haze, we further studied the impact of the haze pollution on respondents’ personal heath. Since most respondents were adults, the results shown below were not applied to young children who generally have weaker immune systems to defend against diseases. As mentioned before, 45.66% of respondents had family members suffering from haze, but another half did not (Question 27). A CST indicated that respondents’ feedback was mainly dependent on the regions they lived in (Figure 35). Specifically, respondents living in Northeast China, South China, Southwest China, and East China were mostly unaffected or affected relatively little by haze in terms of health. On the other hand, respondents living in the more polluted regions such as Northern, Central and Northwestern China were more likely to be afflicted by health problems. Among those respondents having health issues during the haze periods, a majority (54.59%) of respondents had complications with their respiratory tracts (Figure 36). In addition, 21.51% of them had lung problems.
While haze has reshaped Chinese daily life and caused health issues, people in China have found or created different solutions for protecting themselves during the haze attack (Question 26). Figure 37 shows that 67.56% of the people surveyed combatted haze by going out less and another majority (61.15%) wore masks. Another common haze protection approach used by 46.07% of people was installing air purifiers in homes. In the survey, respondents were allowed to choose multiple approaches they used to protect themselves from haze. Therefore, respondents might simultaneously reduce outdoor activities, wear masks, and install air purifiers at home.

3.5. Respondents’ Suggestions for Combating Haze

Although more than 35% of respondents did not think the environment in China would be better in the coming 10 years, more than 50% of respondents still expressed positive feelings about the improvement of the environment in China (Question 10). On the other hand, more than 43% of respondents agreed that it will take 15 years or longer to resolve the haze pollution issue in China (Question 11). This section shows the suggestions provided by respondents for handling haze pollution. Question 18 asked respondents to select all applicable solutions for reducing the haze pollution (Figure 38). The most popular solutions chosen by respondents were as follows: develop new forms of clean energy (67.9% of respondents); design and strictly enforce environmental law (67.7% of respondents); increase the use of existing clean energy (63.5% of respondents); and prioritize haze prevention policy (64.5% of respondents). In total, 45.2% of respondents thought that companies with high energy consumption should face penalties. Only 25.5% thought that establishing organizations similar to the United States Environmental Protection Agency in China would be beneficial for haze prevention, with even fewer people supporting strict regulation of the number of motor vehicles or the development of real estate (21.5% and 15.5%, respectively).
While Question 18 allowed respondents to select among several suggested strategies for combatting the haze pollution, Question 29, which was an open-ended question, offered a chance for the respondents to input their own suggestions for haze prevention/protection (Figure 39). The most popular comments given by respondents focused on the use of alternative vehicle transportation or the reduction of automobile exhaust. This was found in 39 responses. Many who were polled felt that industrial emissions were too high. Suggestions included supervision and reduction of polluting enterprises (36 mentions), complete shutdown of those polluting enterprises (13 mentions), and stronger governmental legislation and enforcement of pollution-preventing policies (30 mentions). The following suggestions/comments were mentioned more than eight times by respondents: a need for public awareness (25 mentions), decreasing coal usage (18 mentions), afforestation (17 mentions), use of clean/renewable energy (15 mentions), reducing construction/infrastructure projects (11 mentions), decentralizing overcrowded urban population (10 mentions), enforcing effective waste treatment (9 mentions), and reshaping economic structure (8 mentions). In terms of general solutions to the haze issue, it was unsurprising that most respondents endorsed the search and production of clean energy, which, when replacing traditional energy gradually, can maintain the nation’s needs while fighting haze. Controlling the number of cars or the development of real estate was not as popular as expected, as this approach would require direct sacrifice on the part of respondents. Another trend observed from respondents’ comments was the willingness of respondents to support a shift from traditional fossil fuel emissions toward new renewable and efficient energy methods. All of these suggestions show that respondents were willing to seek change, minor and drastic, in order to suit the needs of haze prevention, through decreased industrial pollution.

4. Discussion

It is interesting to see from the results that most respondents supported the policy of slowing down economic growth to prevent the deterioration of the haze pollution. Certain respondents also suggested switching coal energy to clean energy so that China can still keep the rapid economic growth without causing more pollution. In addition, more than 40% of respondents expected more effort from the government in treating the haze pollution. All of these are helpful for the policy makers in China to make the right regulation on their economic and environmental policies. While tremendous effort was spent in outreach to as many respondents as possible in China, the sampled respondents may not completely reflect the opinions of most Chinese on the haze pollution and economic growth issues in China. In addition, questionnaires were mainly distributed via social media, and people living in remote areas with limited access to internet may not have been able to participate in the survey. As shown in Figure 34, urban residents changed their outdoor habits the most compared to their suburban and rural counterparts. This is because haze is most densely concentrated in industrial zones, which are often located near cities. Another issue is that the samples were mainly collected in the summer and fall of 2017. Thus, the results shown in this work mainly reflect the opinions of respondents in that period. To obtain the public’s opinion in a timely manner, the survey should be provided more frequently to more people in various locations across China. This can only be done by the Chinese government. Nevertheless, the obtained results can still provide a reference that reflects the opinions of some Chinese people on the haze pollution. Relating to the collected data itself, more analysis still needs to be performed. While a thorough breakdown of Questions 1–7 was conducted along with specific cases pertaining to the questions addressed in this study, the influence of the combination of these seven demographic questions on respondents’ opinions has not been thoroughly explored, which would be time-consuming and thus delay the publication of these timely survey results.

5. Conclusions

This study presented the first nationwide investigation of Chinese opinions on economic growth in relation to haze pollution. It applied multivariate statistical methods to analyze questionnaire data from 1233 respondents. Most respondents agreed that rapid economic growth was one of the main causes of haze pollution. More than half of respondents supported a policy that would slow down economic growth to combat haze, especially the respondents that had children at the time of the study, that were aged 31–50, or that were living in regions with high haze pollution. The respondents who believed the government’s efforts to control haze to be small or very small outnumbered those with opposite opinions almost two times. CST showed that the respondents below 40 years of age, with Bachelor’s degrees or high-school diploma, working as farmers, doctors, students, and regular company employees, desired more effort from the government to control haze. Most respondents thought the environment became worse or much worse in the past 10 years. The haze pollution also significantly influenced their daily life and personal health, especially for the respondents living in the more polluted regions such as Northern, Central, and Northwestern China. Most respondents protected themselves from the haze pollution by going out less, wearing masks, and installing air purifiers in their homes. Most respondents were positive about the potential improvement of the environment in China, although most of them thought it would take more than 10 years to resolve the haze issue. Suggestions from respondents for reducing pollution included, but were not limited to: developing new forms of clean energy, designing and strictly enforcing environmental law, using alternative vehicle transportation to decrease automobile exhaust, prioritizing haze prevention policy, and regulating highly-polluting enterprises. There are many elements to explore that can develop from this project. The most obvious would be to obtain a larger sample. Certain demographics were not fully represented because there were not enough of respondents. This would need the support of the Chinese government. Nevertheless, this work serves as a starting point for getting a more timely and complete survey of Chinese opinions on haze pollution and its relation to economic growth.

Author Contributions

Conceptualization, H.L., L.W. and Z.H.; Formal Analysis, F.Q., E.W., M.F. and Z.H.; Data Curation, all authors.; Writing-Original Draft Preparation, F.Q., E.W. and M.F.; Writing-Review & Editing, H.L., L.W. and Z.H.; Supervision, Z.H.

Funding

This research received no external funding.

Conflicts of Interest

The authors declare no conflict of interest.

References

  1. Shao, M.; Tang, X.Y.; Zhang, Y.H.; Li, W.J. City clusters in China: Air and surface water pollution. Front. Ecol. Environ. 2006, 4, 353–361. [Google Scholar] [CrossRef]
  2. Wang, S.J.; Li, Q.Y.; Fang, C.L.; Zhou, C.S. The relationship between economic growth, energy consumption, and CO2 emissions: Empirical evidence from China. Sci. Total Environ. 2016, 542, 360–371. [Google Scholar] [CrossRef] [PubMed]
  3. Tan, H. China Reports 6.9% Second-Quarter GDP Growth on Year, Topping Expectations. CNBC: 2017. Available online: https://www.cnbc.com/2017/07/16/china-q2-gdp-second-quarter-data-as-stability-reigns-ahead-of-party-congress.html (accessed on 20 December 2017).
  4. Kolker, A.; Senior, C.L.; Quick, J.C. Mercury in coal and the impact of coal quality on mercury emissions from combustion systems. Appl. Geochem. 2006, 21, 1821–1836. [Google Scholar] [CrossRef]
  5. Baba, A.; Gurdal, G.; Yucel, D.S. Enrichment of trace element concentrations in coal and its combustion residues and their potential environmental and human health impact: Can Coal Basin, NW Turkey as a case study. Int. J. Environ. Technol. Manag. 2016, 19, 455–480. [Google Scholar] [CrossRef]
  6. Carlson, C.L.; Adriano, D.C. Environmental Impacts of Coal Combustion Residues. J. Environ. Qual. 1993, 22, 227–247. [Google Scholar] [CrossRef]
  7. Le Quere, C.; Raupach, M.R.; Canadell, J.G.; Marland, G.; Bopp, L.; Ciais, P.; Conway, T.J.; Doney, S.C.; Feely, R.A.; Foster, P.; et al. Trends in the sources and sinks of carbon dioxide. Nat. Geosci. 2009, 2, 831–836. [Google Scholar] [CrossRef] [Green Version]
  8. Maji, K.J.; Dikshit, A.K.; Arora, M.; Deshpande, A. Estimating premature mortality attributable to PM2.5 exposure and benefit of air pollution control policies in China for 2020. Sci. Total Environ. 2018, 612, 683–693. [Google Scholar] [CrossRef] [PubMed]
  9. Xu, N.; Zhang, C. How Did China’s Air Pollution Get This Bad? China Dialogue, 2013. Available online: https://www.chinadialogue.net/article/show/single/en/5604-How-did-China-s-air-pollution-get-this-bad- (accessed on 20 December 2017).
  10. Zhi, G.R.; Zhang, Y.Y.; Sun, J.Z.; Cheng, M.M.; Dang, H.Y.; Liu, S.J.; Yang, J.C.; Zhang, Y.Z.; Xue, Z.G.; Li, S.Y.; et al. Village energy survey reveals missing rural raw coal in northern China: Significance in science and policy. Environ. Pollut. 2017, 223, 705–712. [Google Scholar] [CrossRef] [PubMed] [Green Version]
  11. Zhang, A.P.; Zhong, L.S.; Xu, Y.; Wang, H.; Dang, L.J. Tourists’ Perception of Haze Pollution and the Potential Impacts on Travel: Reshaping the Features of Tourism Seasonality in Beijing, China. Sustainability 2015, 7, 2397–2414. [Google Scholar] [CrossRef] [Green Version]
  12. Jiang, L.; Hiltunen, E.; He, X.L.; Zhu, L.D. A Questionnaire Case Study to Investigate Public Awareness of Smog Pollution in China’s Rural Areas. Sustainability 2016, 8, 1111. [Google Scholar] [CrossRef]
  13. Lan, G.L.; Yuan, Z.K.; Maddock, J.E.; Cook, A.; Chu, Y.Y.; Pan, B.B.; Tu, H.; Fan, S.; Liao, X.; Lu, Y.N. Public perception of air pollution and health effects in Nanchang, China. Air Qual. Atmos. Health 2016, 9, 951–959. [Google Scholar] [CrossRef]
  14. Yang, S.C.; Shi, L.Y. Public perception of smog: A case study in Ningbo City, China. J. Air Waste Manag. Assoc. 2017, 67, 219–230. [Google Scholar] [CrossRef] [PubMed]
  15. Huang, L.; Rao, C.; van der Kuijp, T.J.; Bi, J.; Liu, Y. A comparison of individual exposure, perception, and acceptable levels of PM2.5 with air pollution policy objectives in China. Environ. Res. 2017, 157, 78–86. [Google Scholar] [CrossRef] [PubMed]
  16. Qian, X.J.; Xu, G.Z.; Li, L.; Shen, Y.P.; He, T.F.; Liang, Y.J.; Yang, Z.Y.; Zhou, W.W.; Xu, J.Y. Knowledge and perceptions of air pollution in Ningbo, China. BMC Public Health 2016, 16, 1138. [Google Scholar] [CrossRef] [PubMed]
  17. Sun, C.W.; Yuan, X.; Yao, X. Social acceptance towards the air pollution in China: Evidence from public’s willingness to pay for smog mitigation. Energy Policy 2016, 92, 313–324. [Google Scholar] [CrossRef]
  18. Wang, Y.T.; Sun, M.X.; Yang, X.C.; Yuan, X.L. Public awareness and willingness to pay for tackling smog pollution in China: A case study. J. Clean. Prod. 2016, 112, 1627–1634. [Google Scholar] [CrossRef]
  19. Lu, H.; Yue, A.L.; Chen, H.; Long, R.Y. Could smog pollution lead to the migration of local skilled workers? Evidence from the Jing-Jin-Ji region in China. Resour. Conserv. Recycl. 2018, 130, 177–187. [Google Scholar] [CrossRef]
  20. Tang, C.X.; Zhang, Y.C. Using discrete choice experiments to value preferences for air quality improvement: The case of curbing haze in urban China. J. Environ. Plan. Manag. 2016, 59, 1473–1494. [Google Scholar] [CrossRef]
  21. Sun, C.W.; Yuan, X.; Xu, M.L. The public perceptions and willingness to pay: From the perspective of the smog crisis in China. J. Clean. Prod. 2016, 112, 1635–1644. [Google Scholar] [CrossRef]
  22. Chu, Y.Y.; Liu, Y.S.; Lu, Y.N.; Yu, L.C.; Lu, H.S.; Guo, Y.L.; Liu, F.F.; Wu, Y.Y.; Mao, Z.F.; Ren, M.; et al. Propensity to Migrate and Willingness to Pay Related to Air Pollution among Different Populations in Wuhan, China. Aerosol Air Qual. Res. 2017, 17, 752–760. [Google Scholar] [CrossRef] [Green Version]
  23. Wei, J.C.; Zhu, W.W.; Marinova, D.; Wang, F. Household adoption of smog protective behavior: A comparison between two Chinese cities. J. Risk Res. 2017, 20, 846–867. [Google Scholar] [CrossRef]
  24. Ban, J.; Zhou, L.; Zhang, Y.; Anderson, G.B.; Li, T.T. The health policy implications of individual adaptive behavior responses to smog pollution in urban China. Environ. Int. 2017, 106, 144–152. [Google Scholar] [CrossRef] [PubMed]
  25. Johnson, T.; Mol, A.P.J.; Zhang, L.; Yang, S. Living under the dome: Individual strategies against air pollution in Beijing. Habitat Int. 2017, 59, 110–117. [Google Scholar] [CrossRef]
  26. Wu, X.; Qi, W.; Hu, X.; Zhang, S.S.; Zhao, D.T. Consumers’ purchase intentions toward products against city smog: Exploring the influence of risk information processing. Nat. Hazards 2017, 88, 611–632. [Google Scholar] [CrossRef]
  27. Huang, L.; Zhou, Y.; Han, Y.T.; Hammitt, J.K.; Bi, J.; Liu, Y. Effect of the Fukushima nuclear accident on the risk perception of residents near a nuclear power plant in China. Prac. Natl. Acad. Sci. USA 2013, 110, 19742–19747. [Google Scholar] [CrossRef] [PubMed] [Green Version]
  28. Slovic, P. Perception of Risk. Science 1987, 236, 280–285. [Google Scholar] [CrossRef] [PubMed]
  29. Cheng, P.; Wei, J.C.; Ge, Y. Who should be blamed? The attribution of responsibility for a city smog event in China. Nat. Hazards 2017, 85, 669–689. [Google Scholar] [CrossRef]
  30. Wold, S.; Esbensen, K.; Geladi, P. Principal Component Analysis. Chemometr. Intell. Lab. Syst. 1987, 2, 37–52. [Google Scholar] [CrossRef]
  31. Jolliffe, I.T.; Cadima, J. Principal component analysis: A review and recent developments. Philos. Trans. R. Soc. A 2016, 374. [Google Scholar] [CrossRef] [PubMed]
  32. Virag, K. A Handbook of Statistical Analyses Using R. Acta Sci. Math. 2015, 81, 356–357. [Google Scholar]
  33. Nadarajah, S. Simple R Programs for Statistical Distributions Most Commonly Used in Engineering. Comput. Appl. Eng. Educ. 2011, 19, 826–834. [Google Scholar] [CrossRef]
Figure 1. An illustrative diagram for principal component analysis. The red color points show the three-dimensional data, which can be represented by their projections onto a two-dimensional space coordinated by the first two principal components (i.e., PC1 and PC2). In this figure, the projects onto PC1 has higher variance than those onto PC2.
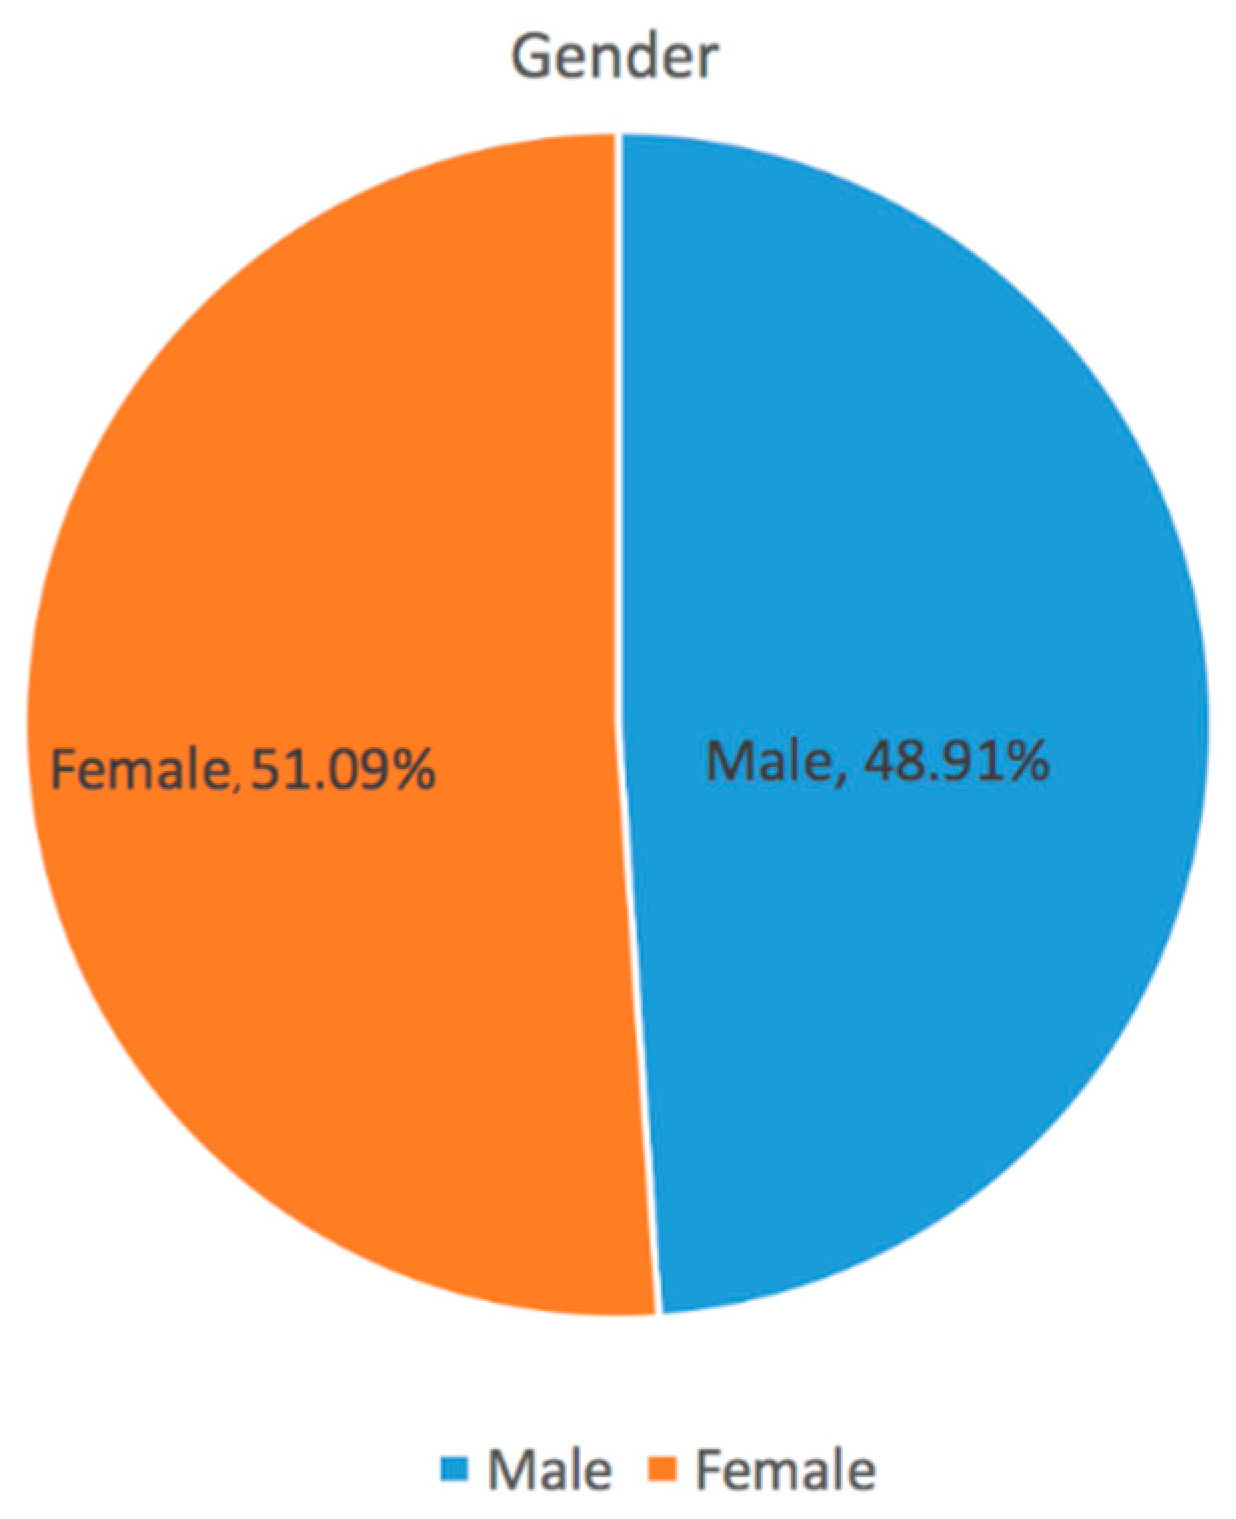
Sustainability 10 01970 g001
Figure 2. The result for Question 1 “What is your gender?”: The number of males and females that responded to the survey were roughly equal.
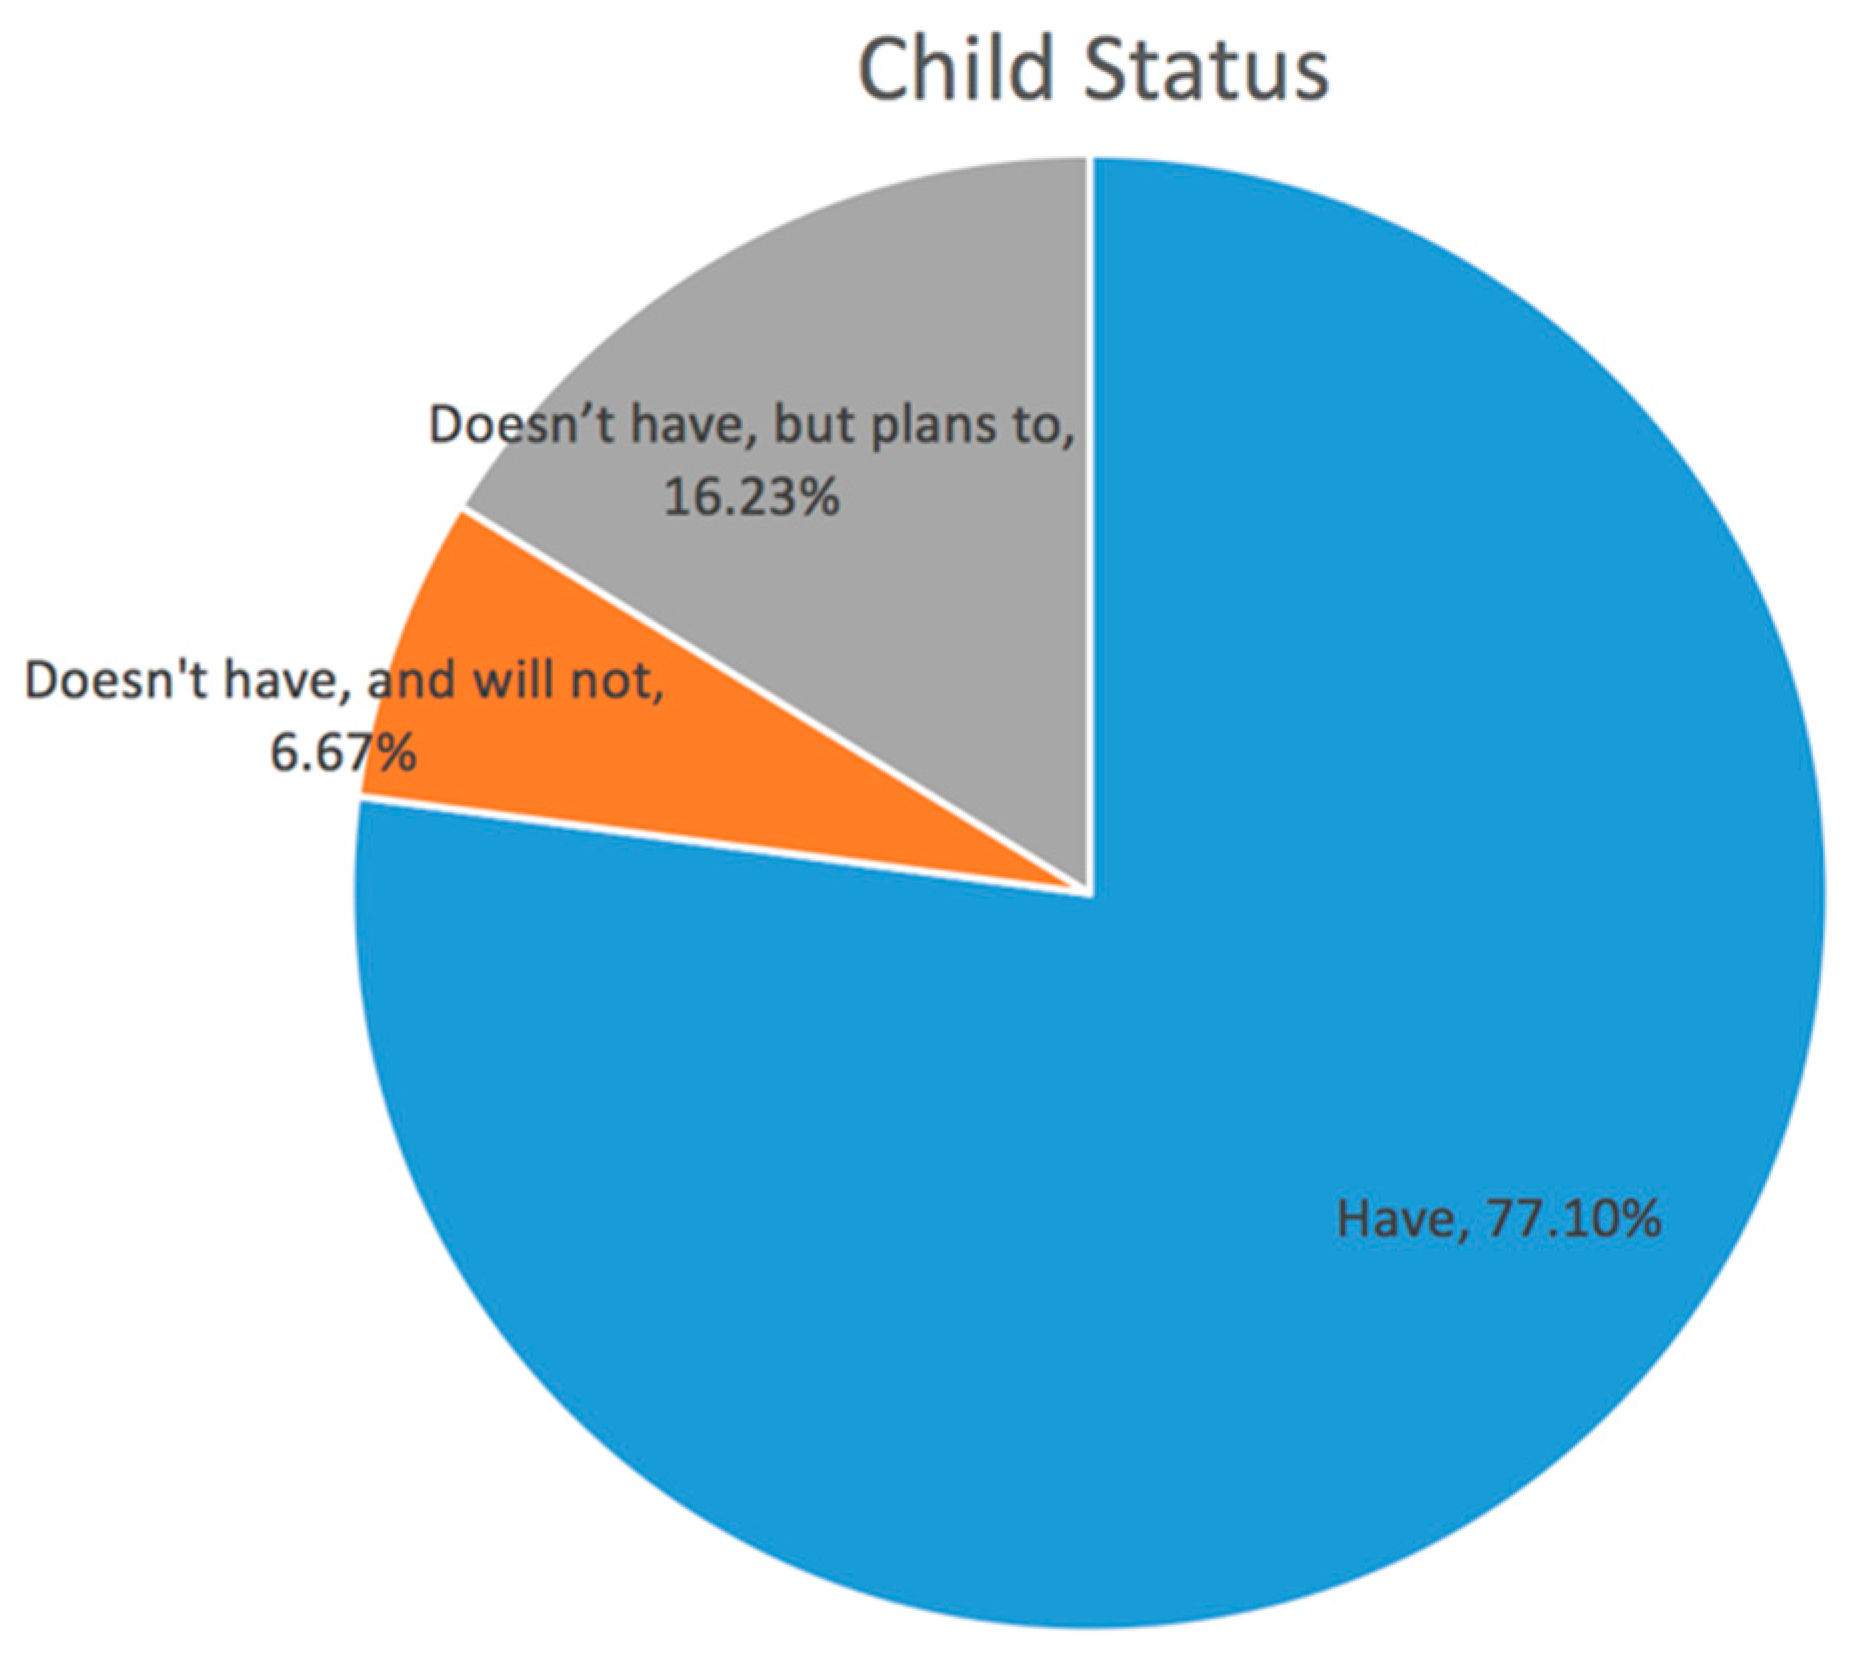
Sustainability 10 01970 g002
Figure 3. The result Question 2 “Do you have children?”: Most respondents had children, and only 6.67% of respondents did not plan to have children.
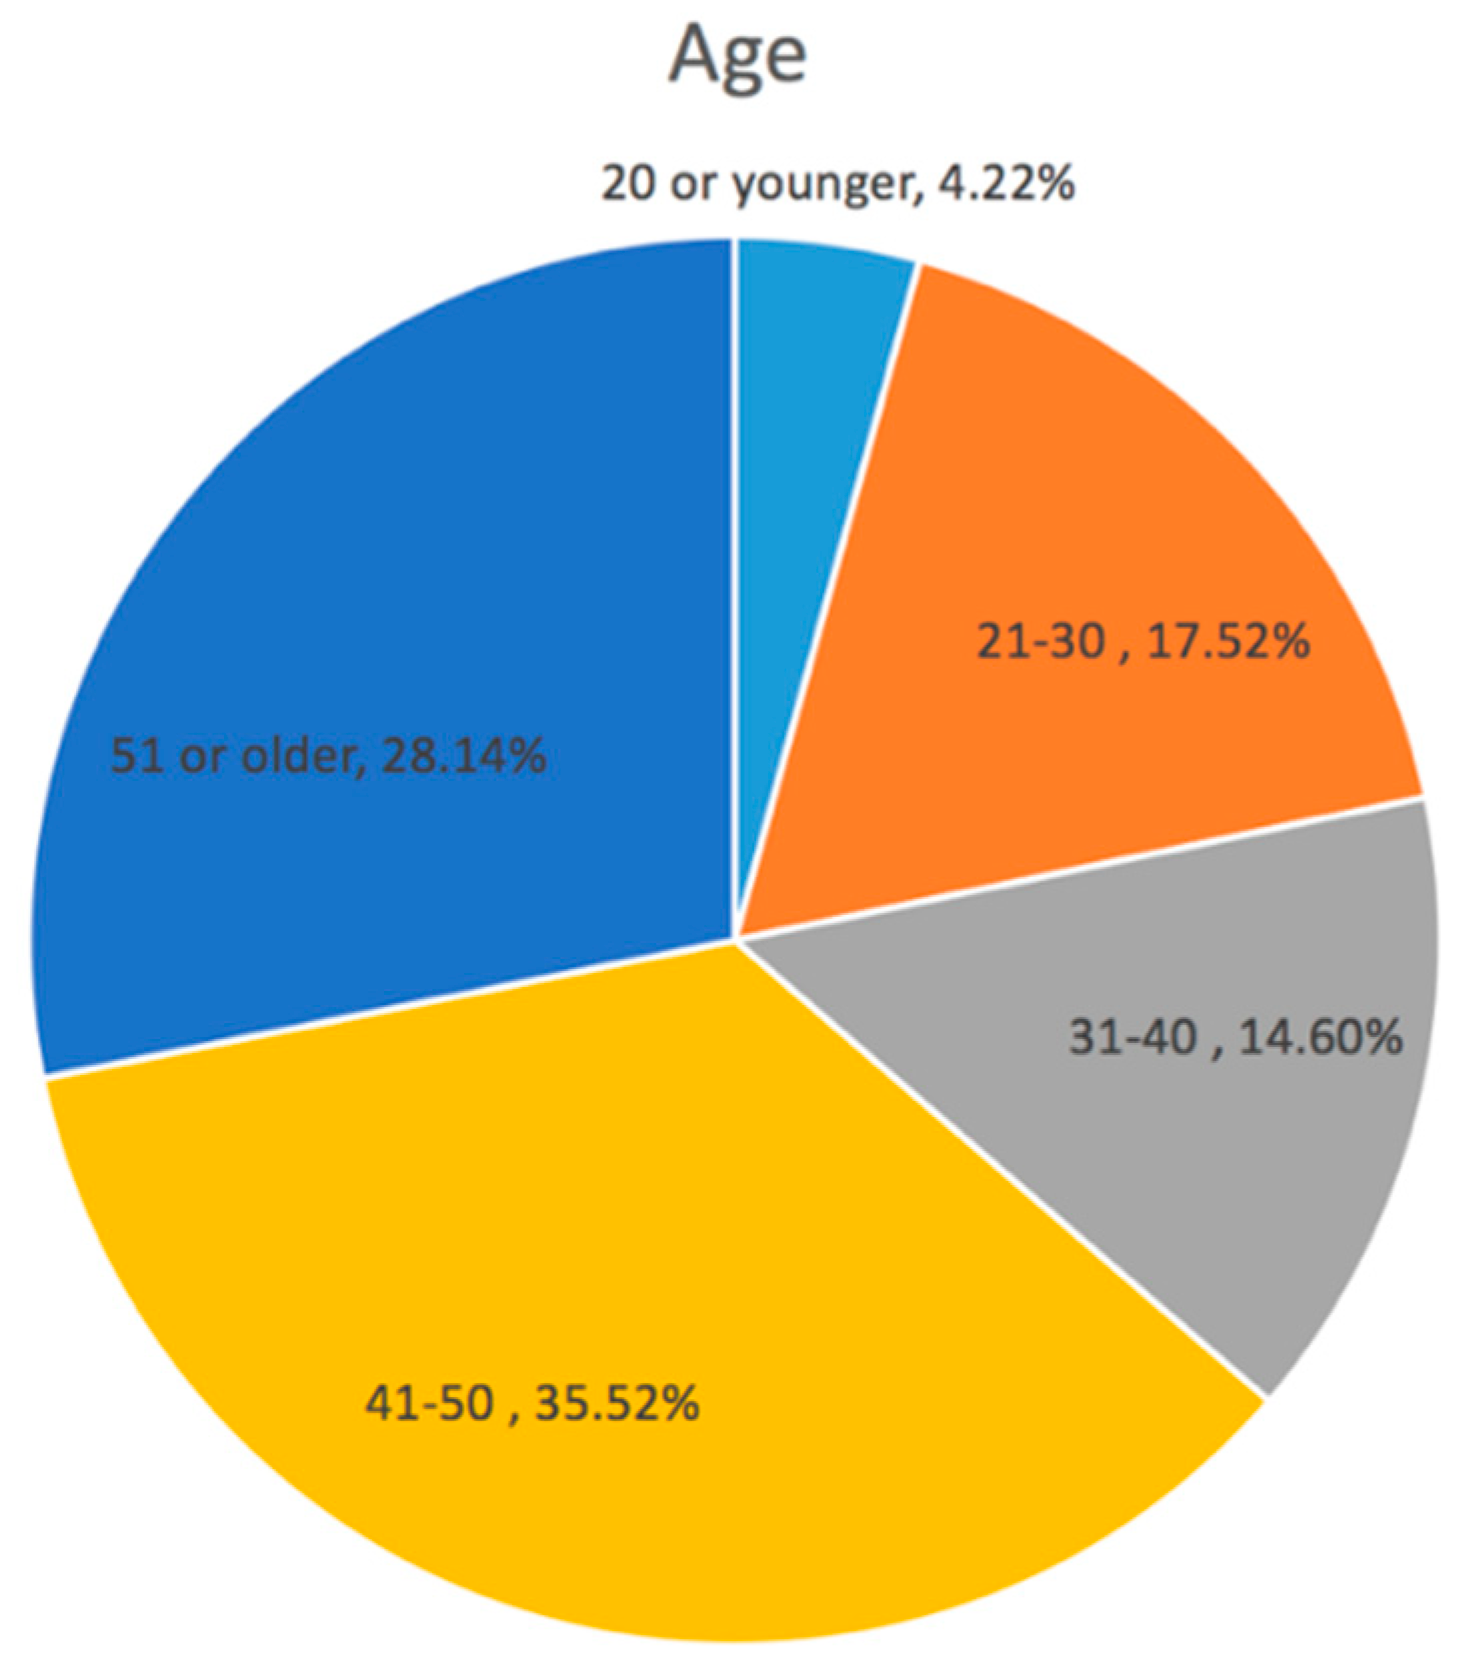
Sustainability 10 01970 g003
Figure 4. The result for Question 3 “How old are you?”: There were more older people than younger people, with 63.66% of the respondents being above 40.
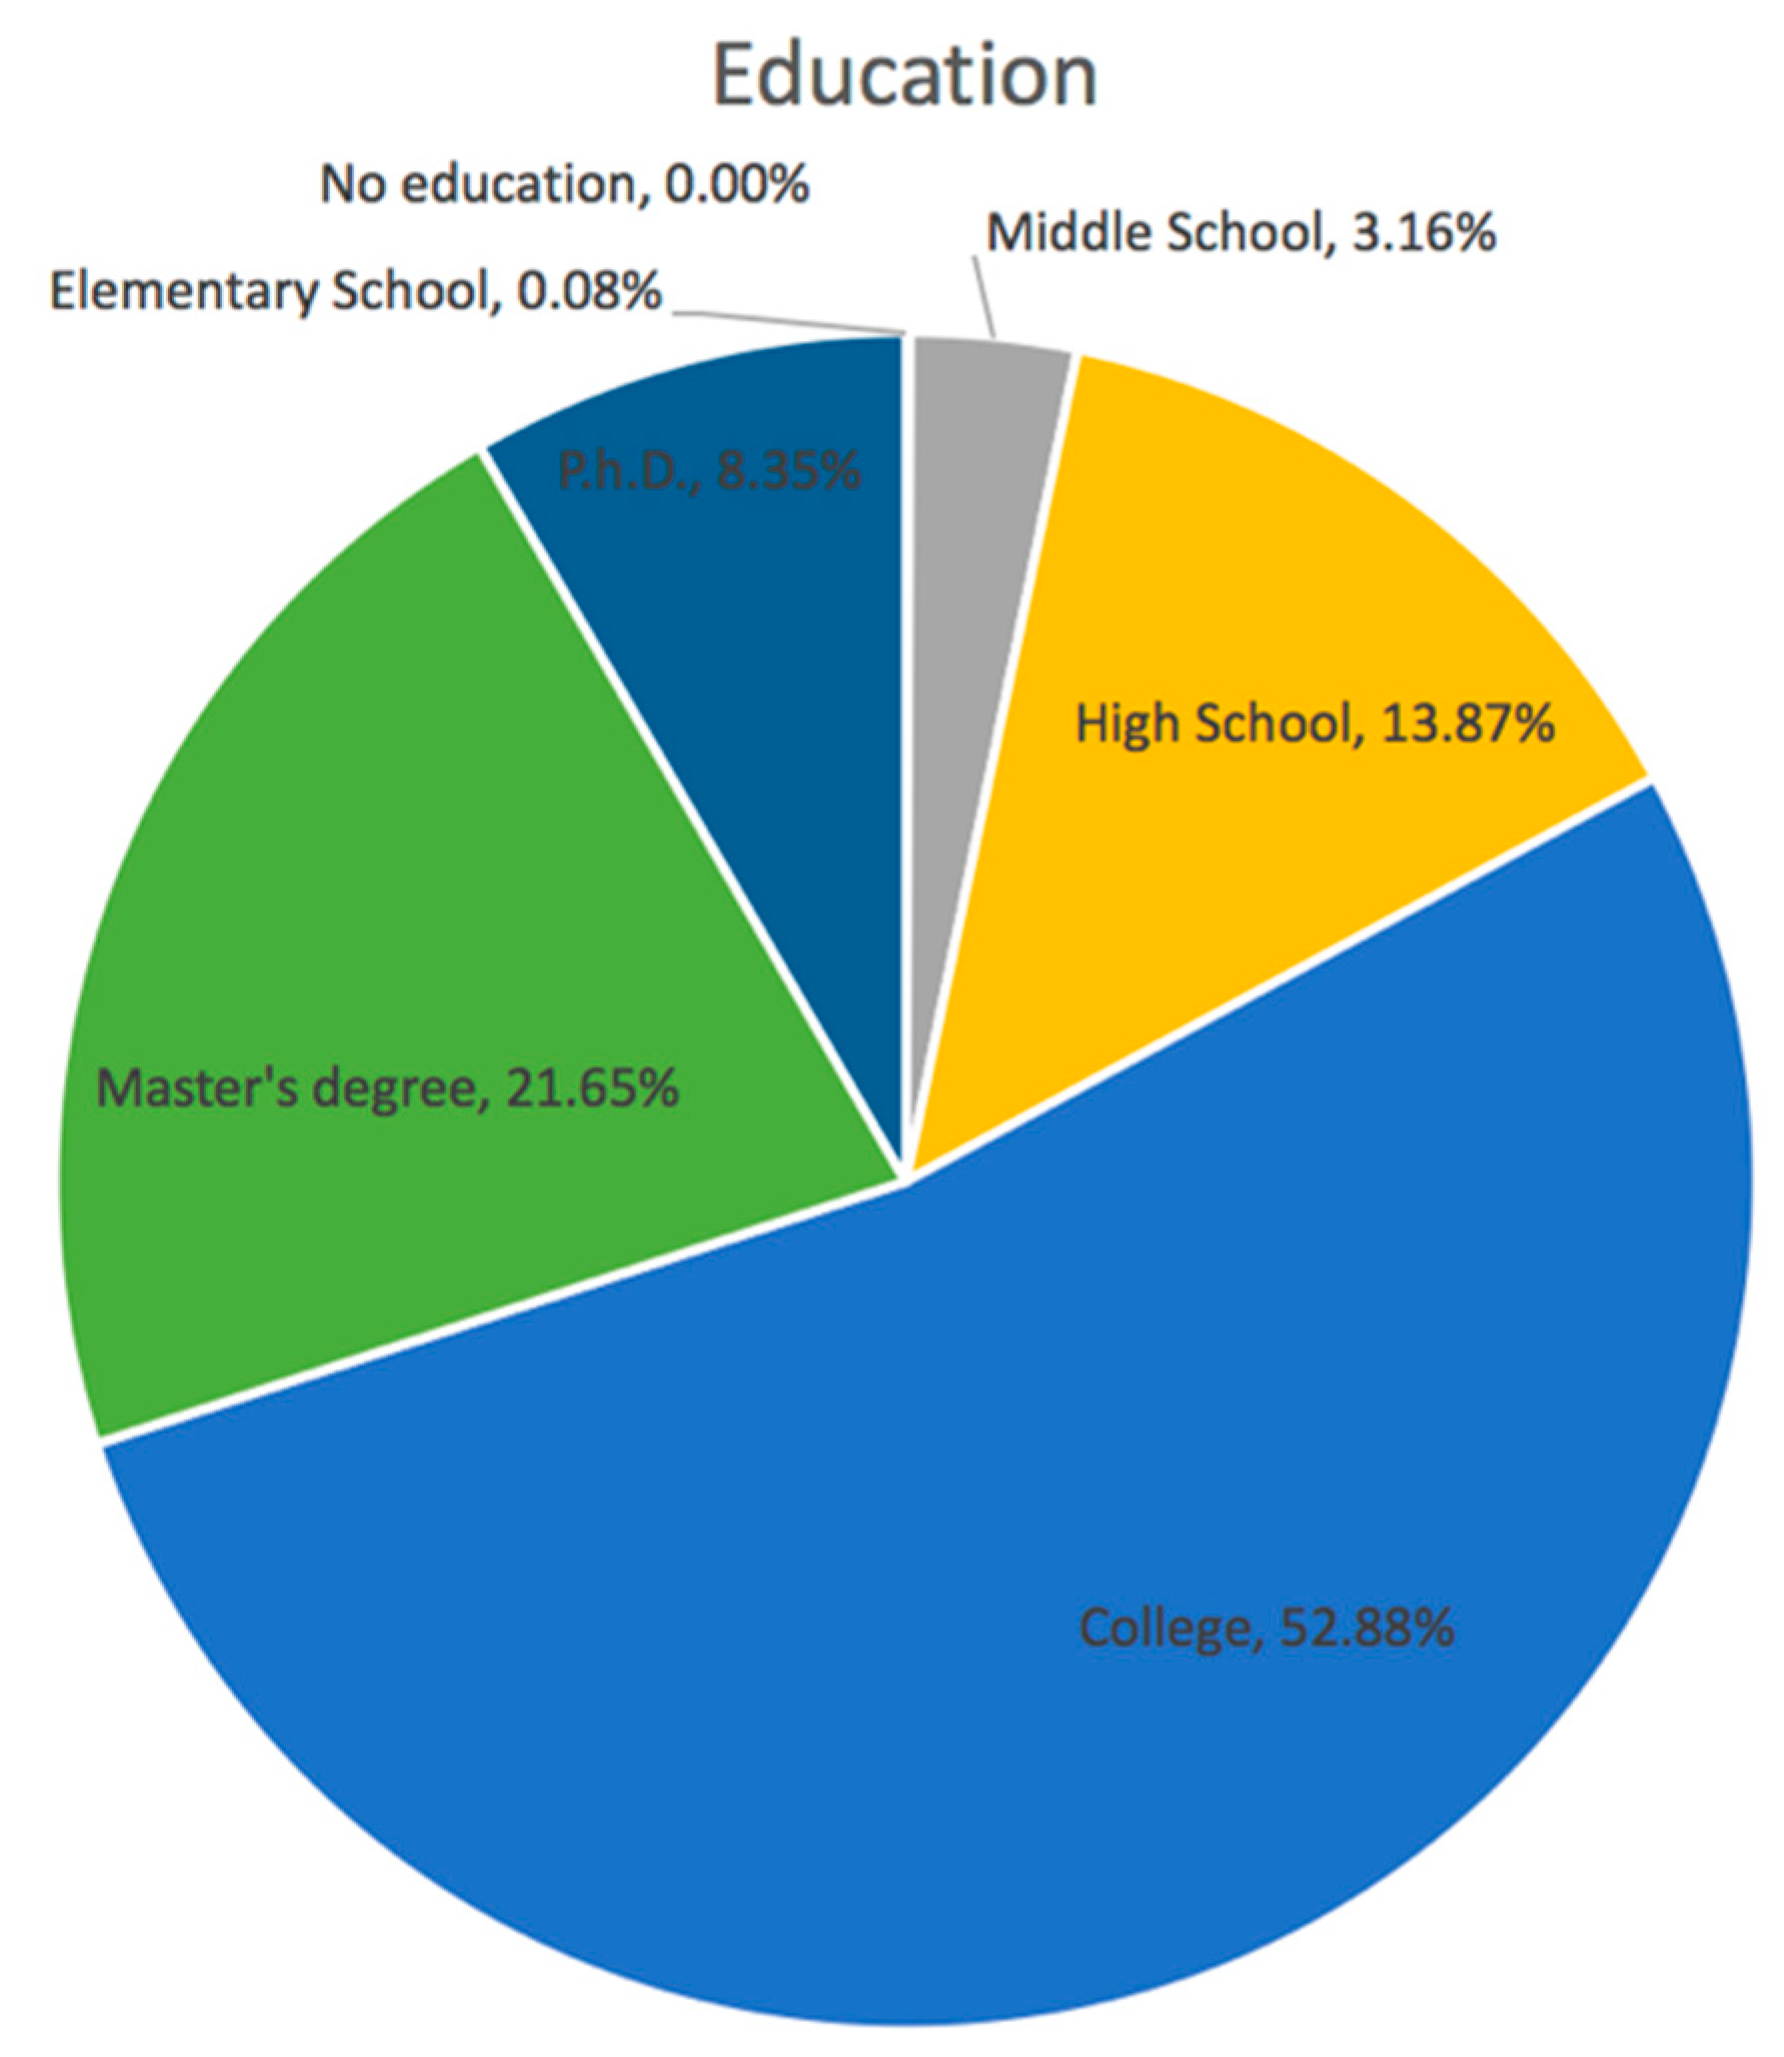
Sustainability 10 01970 g004
Figure 5. The result for Question 4 “What is your education background?”: The respondents were generally well-educated, with 82.88% having college diplomas or higher.
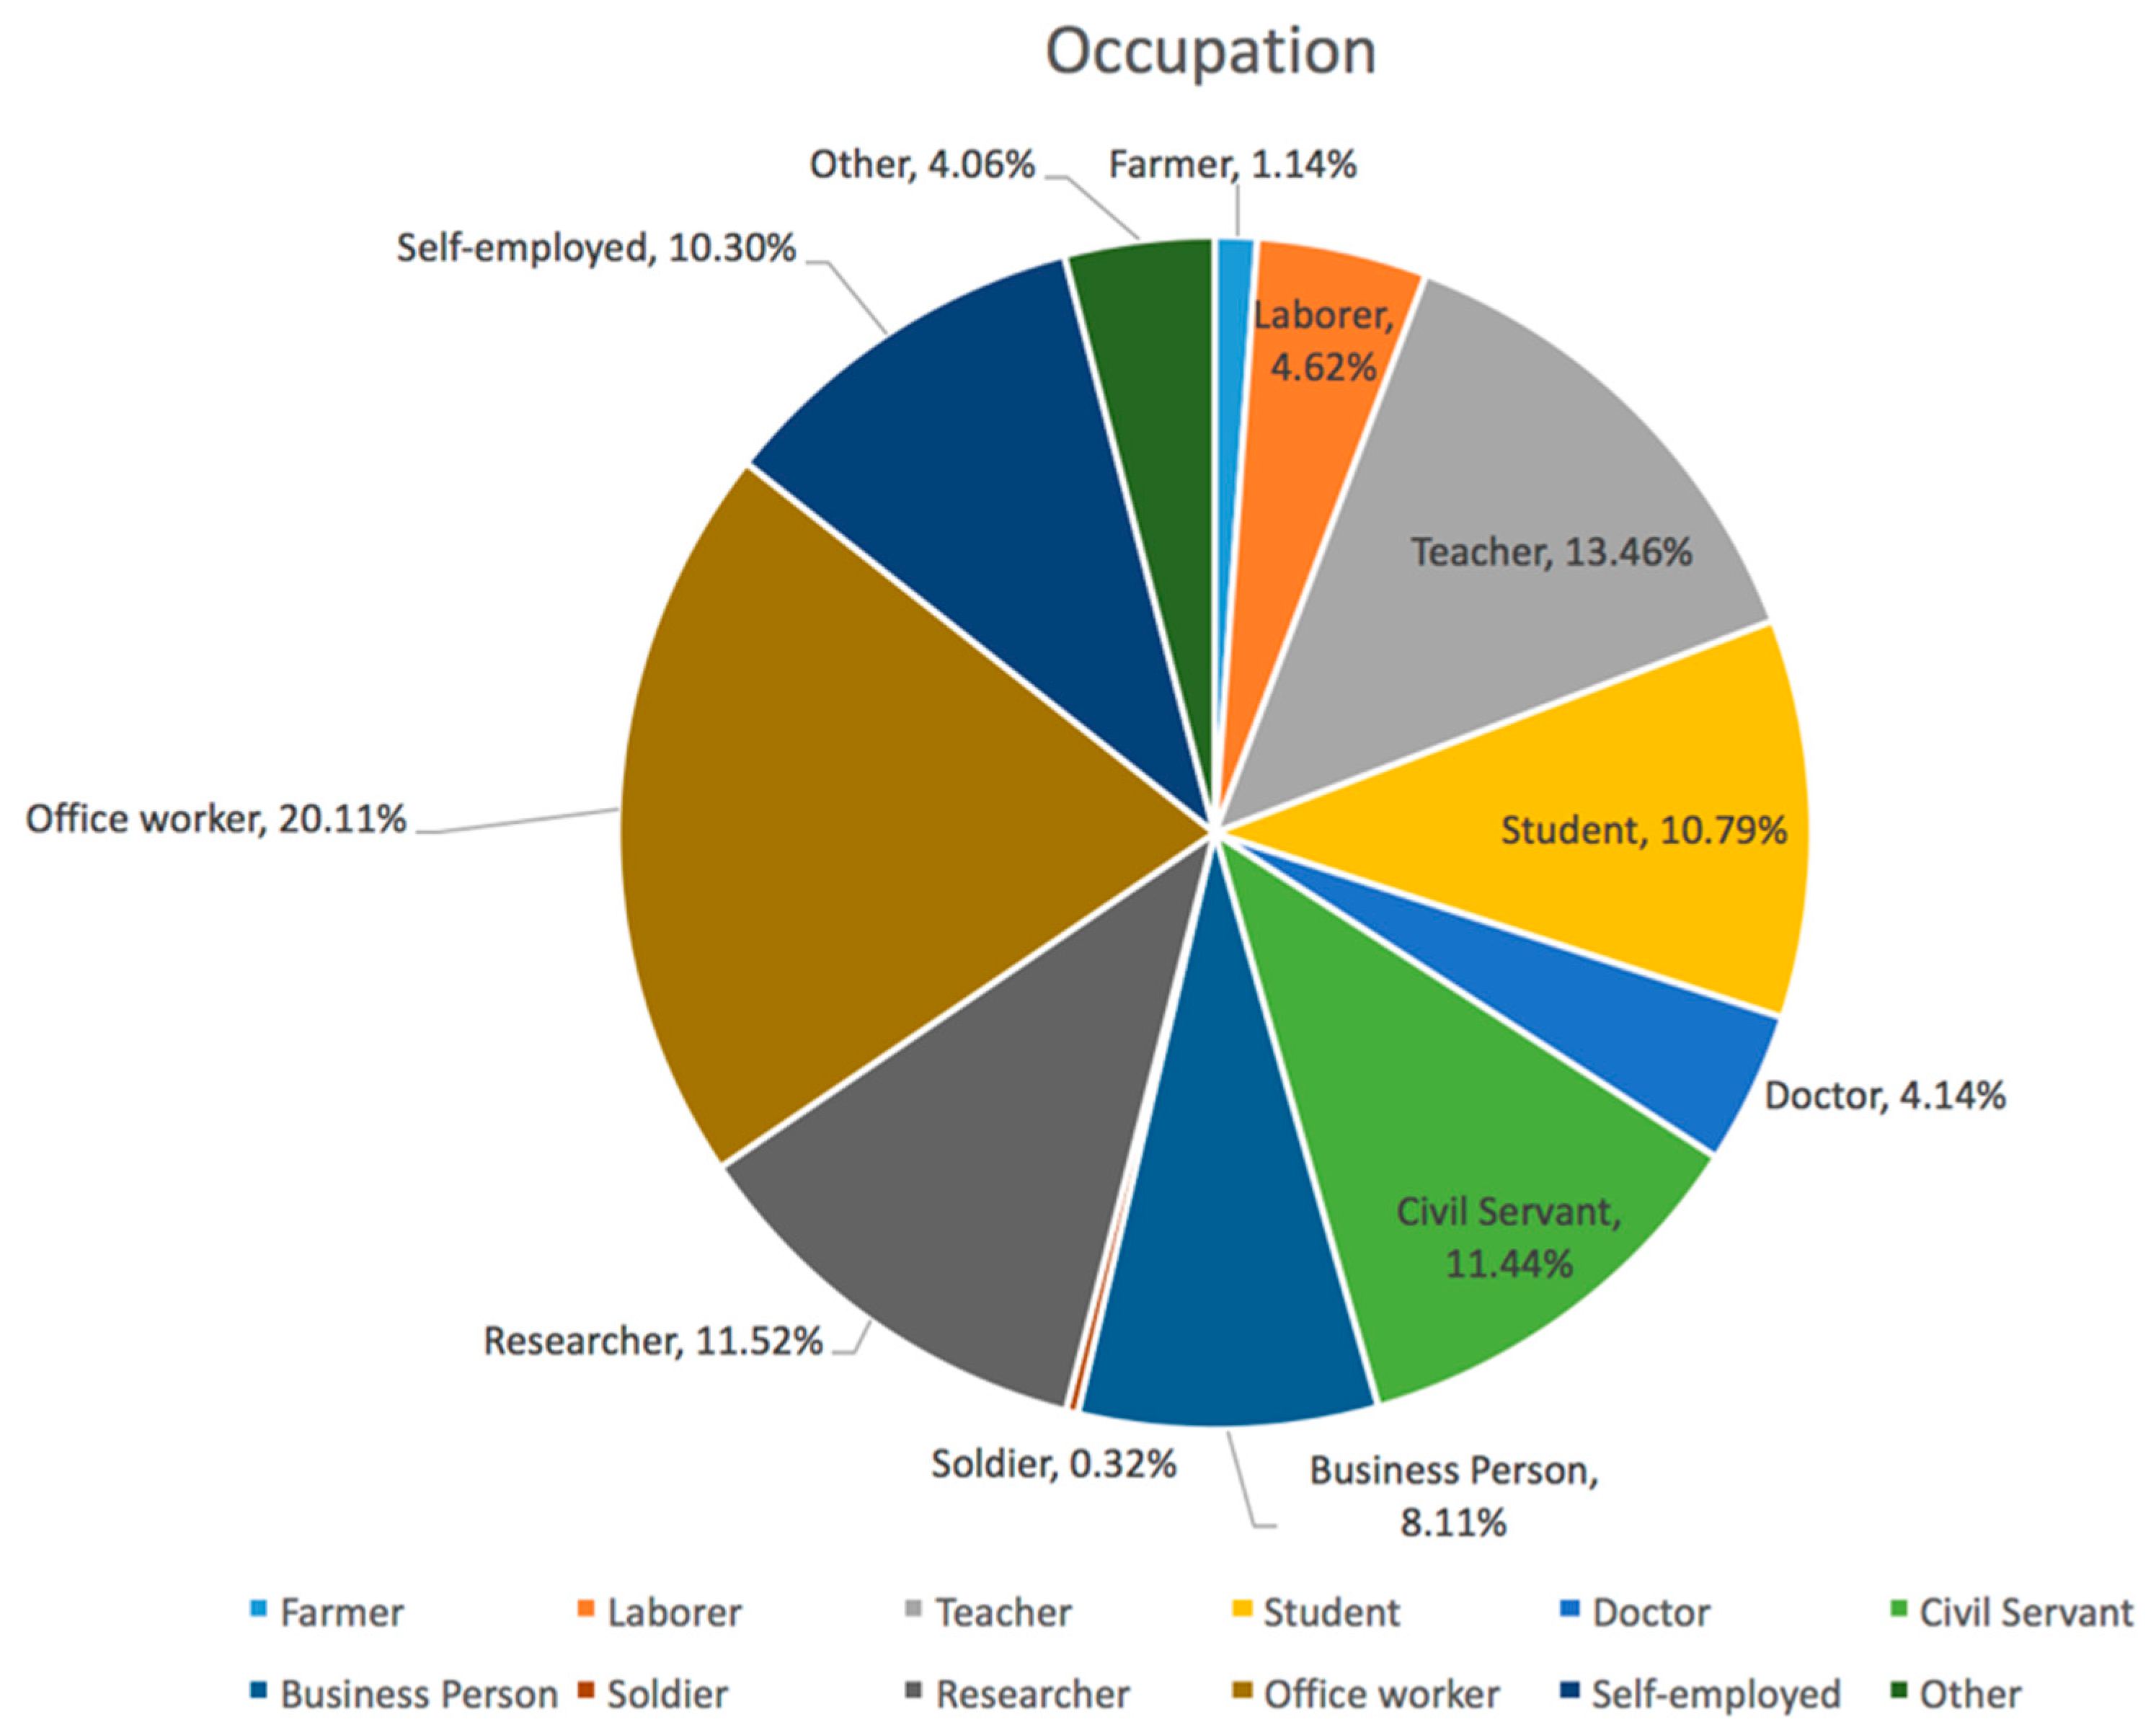
Sustainability 10 01970 g005
Figure 6. The result for Question 5 “What is your occupation?”: Office workers pulled ahead numerically, making up 20.11% of the participants.
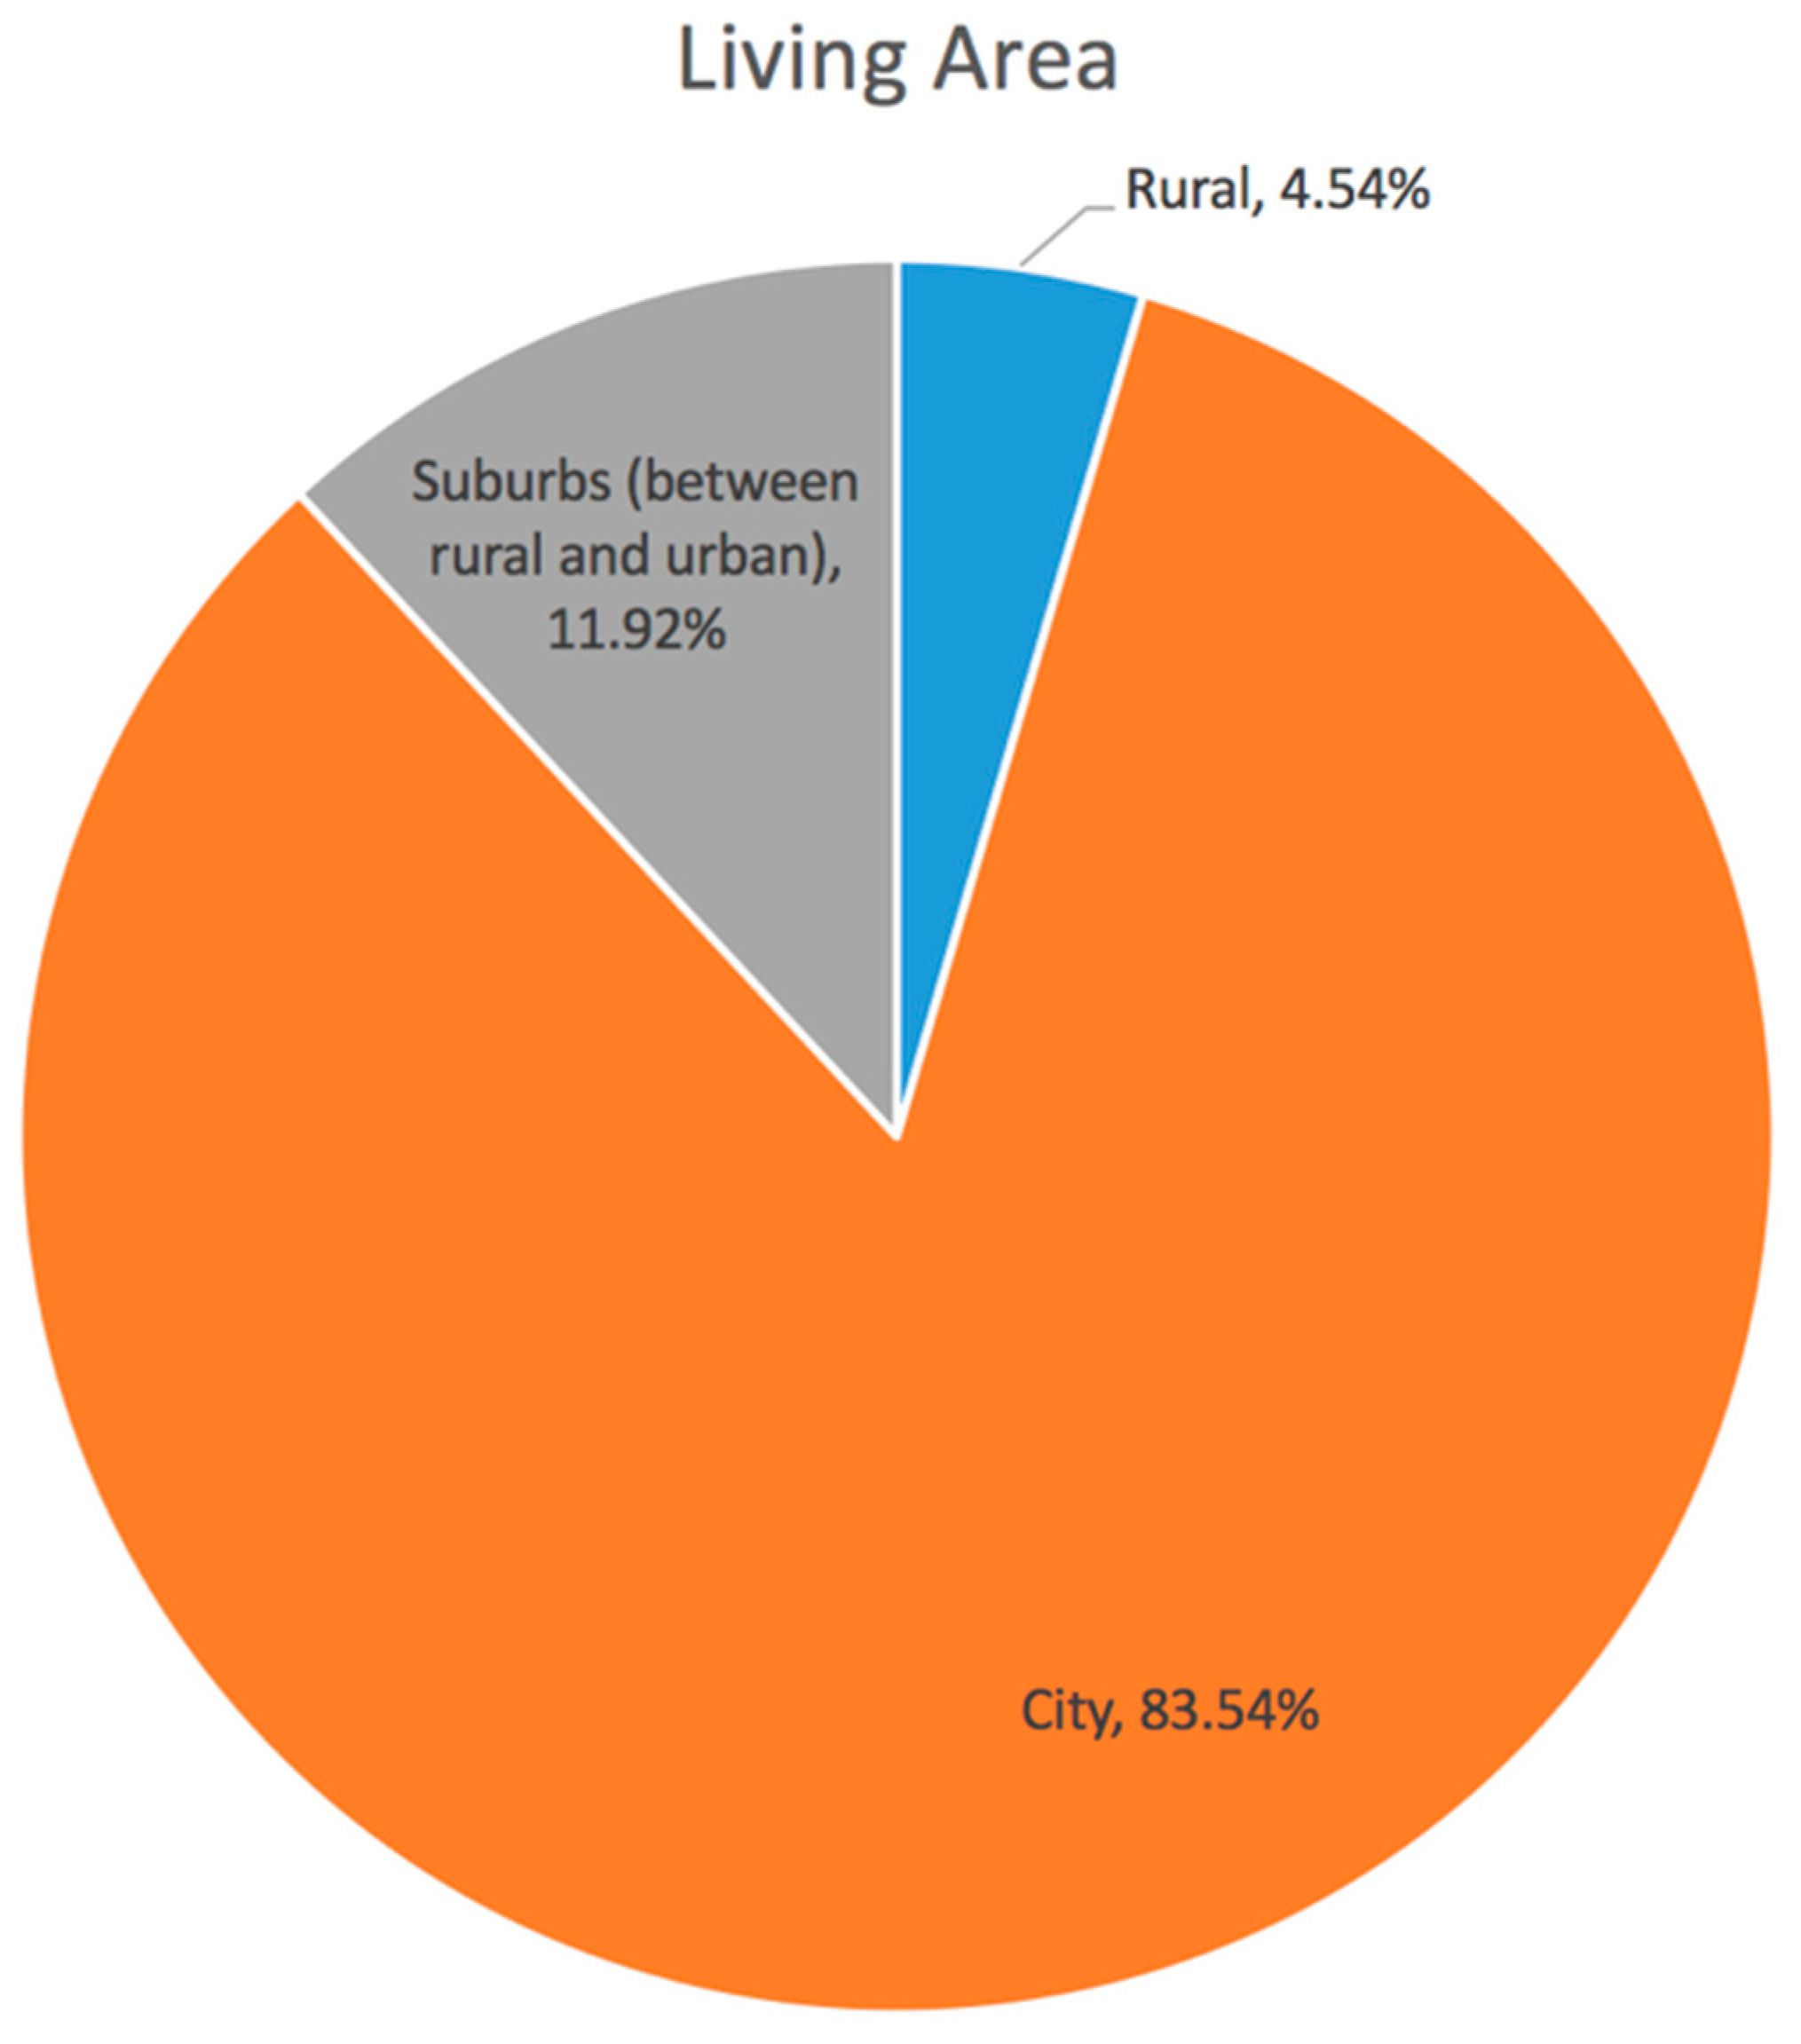
Sustainability 10 01970 g006
Figure 7. The result for Question 6 “What area (population density) do you live in?”: Most of the people surveyed live in cities.
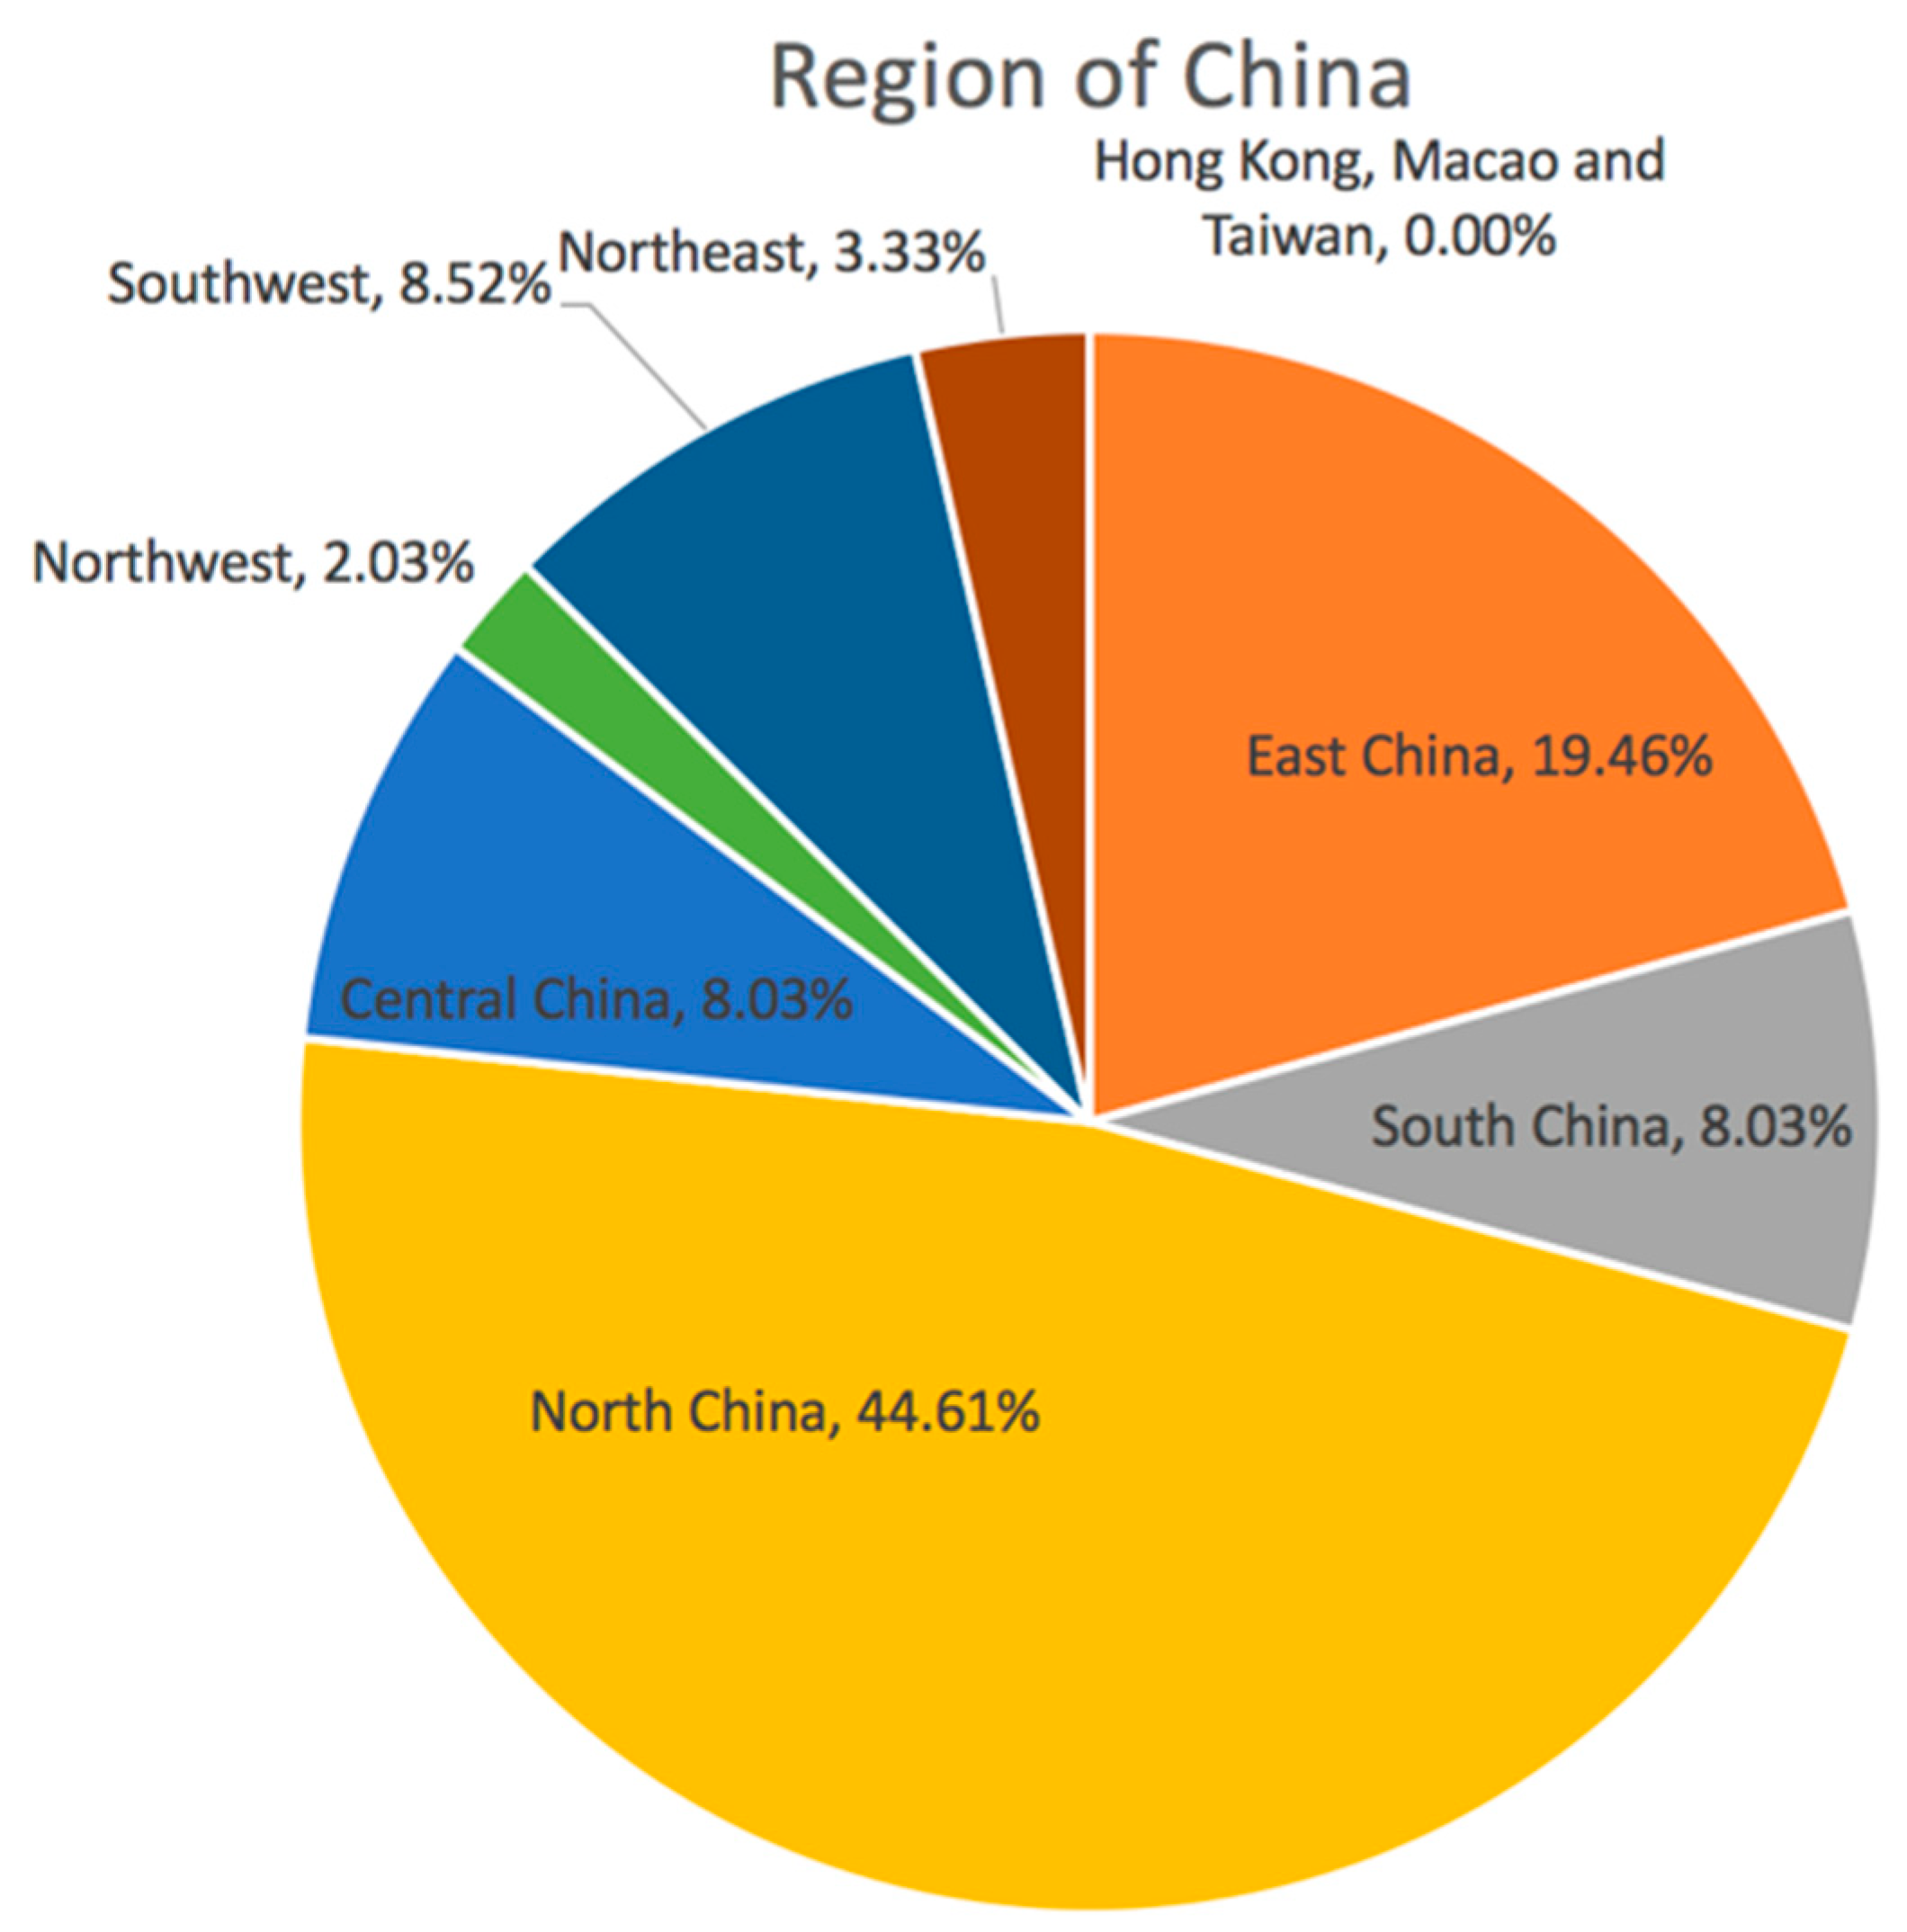
Sustainability 10 01970 g007
Figure 8. The result for Question 7 “What region of China do you live in?”: It seems that 67.40% of the respondents lived in northern, eastern, or northeastern China.
Sustainability 10 01970 g008
Figure 9. The result for Question 8 “What impact did haze have on your life in the past 10 years?”: 28.39% of respondents stated that haze had a medium level negative impact on their lives. Overall, 22.47% of respondents said haze had a big impact on their lives, and 18.82% stated it had a very large impact. A small impact was selected by 18.57%, and very small impact was selected by 9.08%.
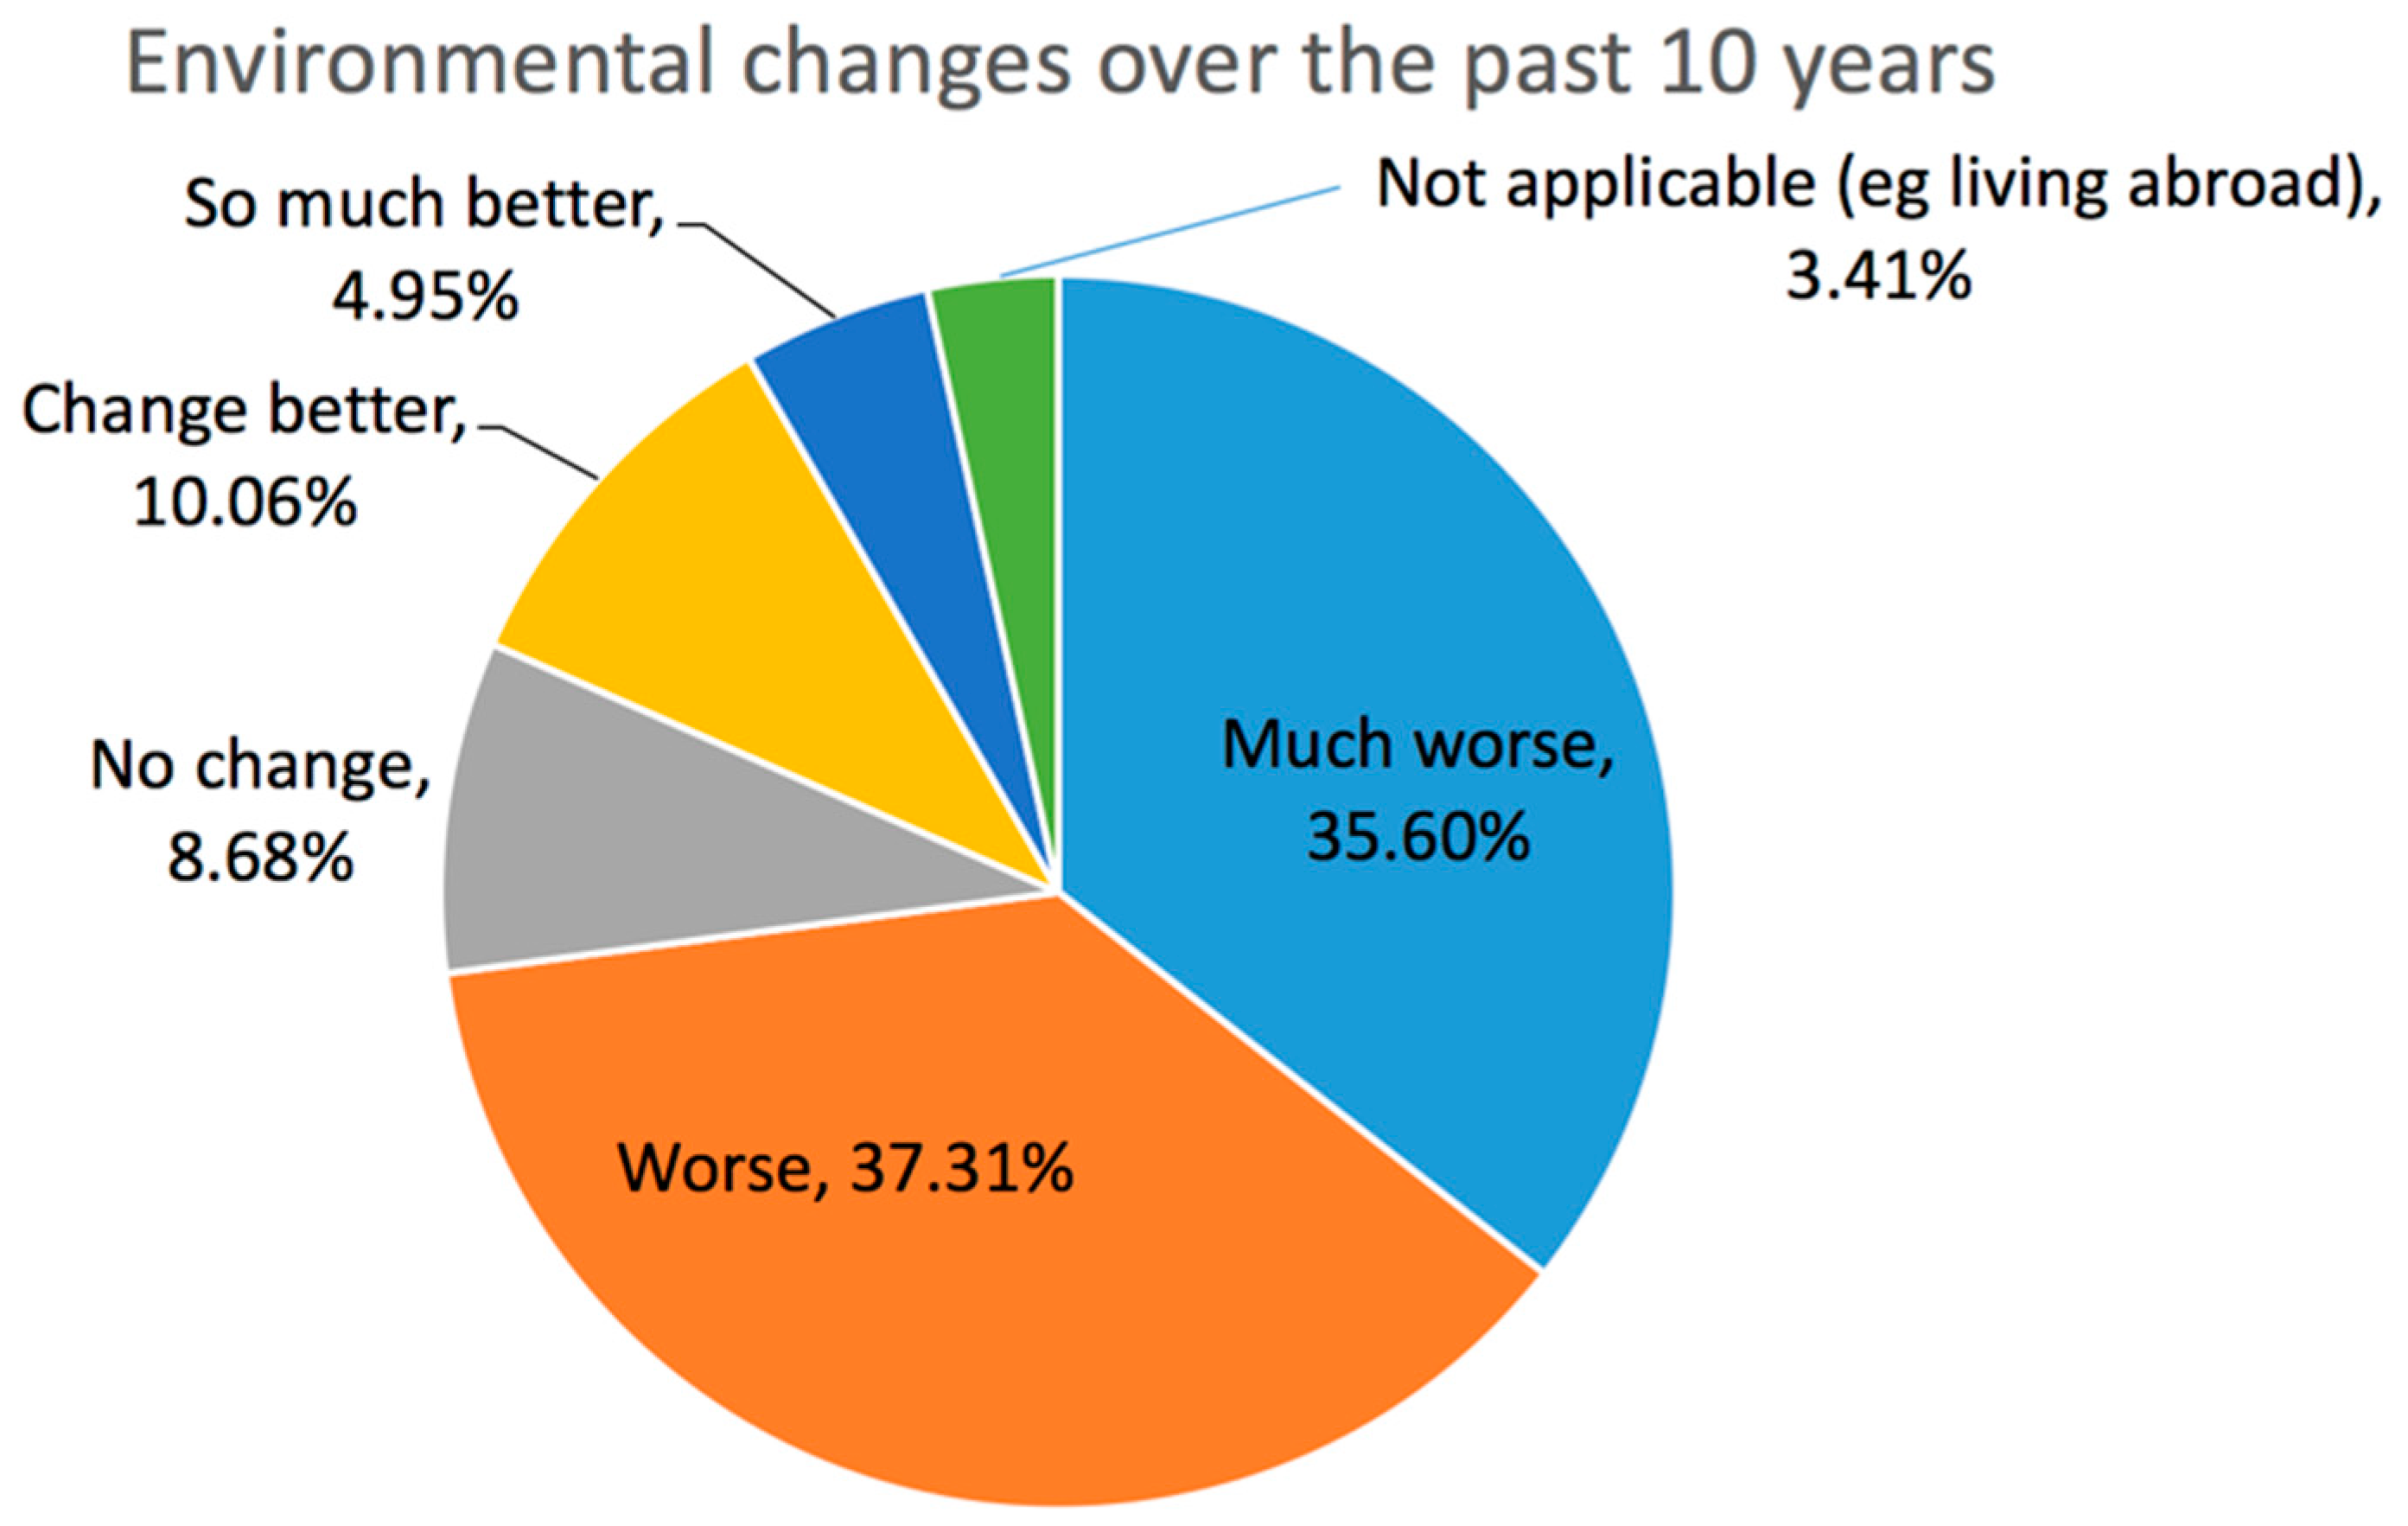
Sustainability 10 01970 g009
Figure 10. The result for Question 9 “How did the environment change in the past 10 years?”: 72.91% of those surveyed stated that the environment had gotten worse or much worse in the past ten years.
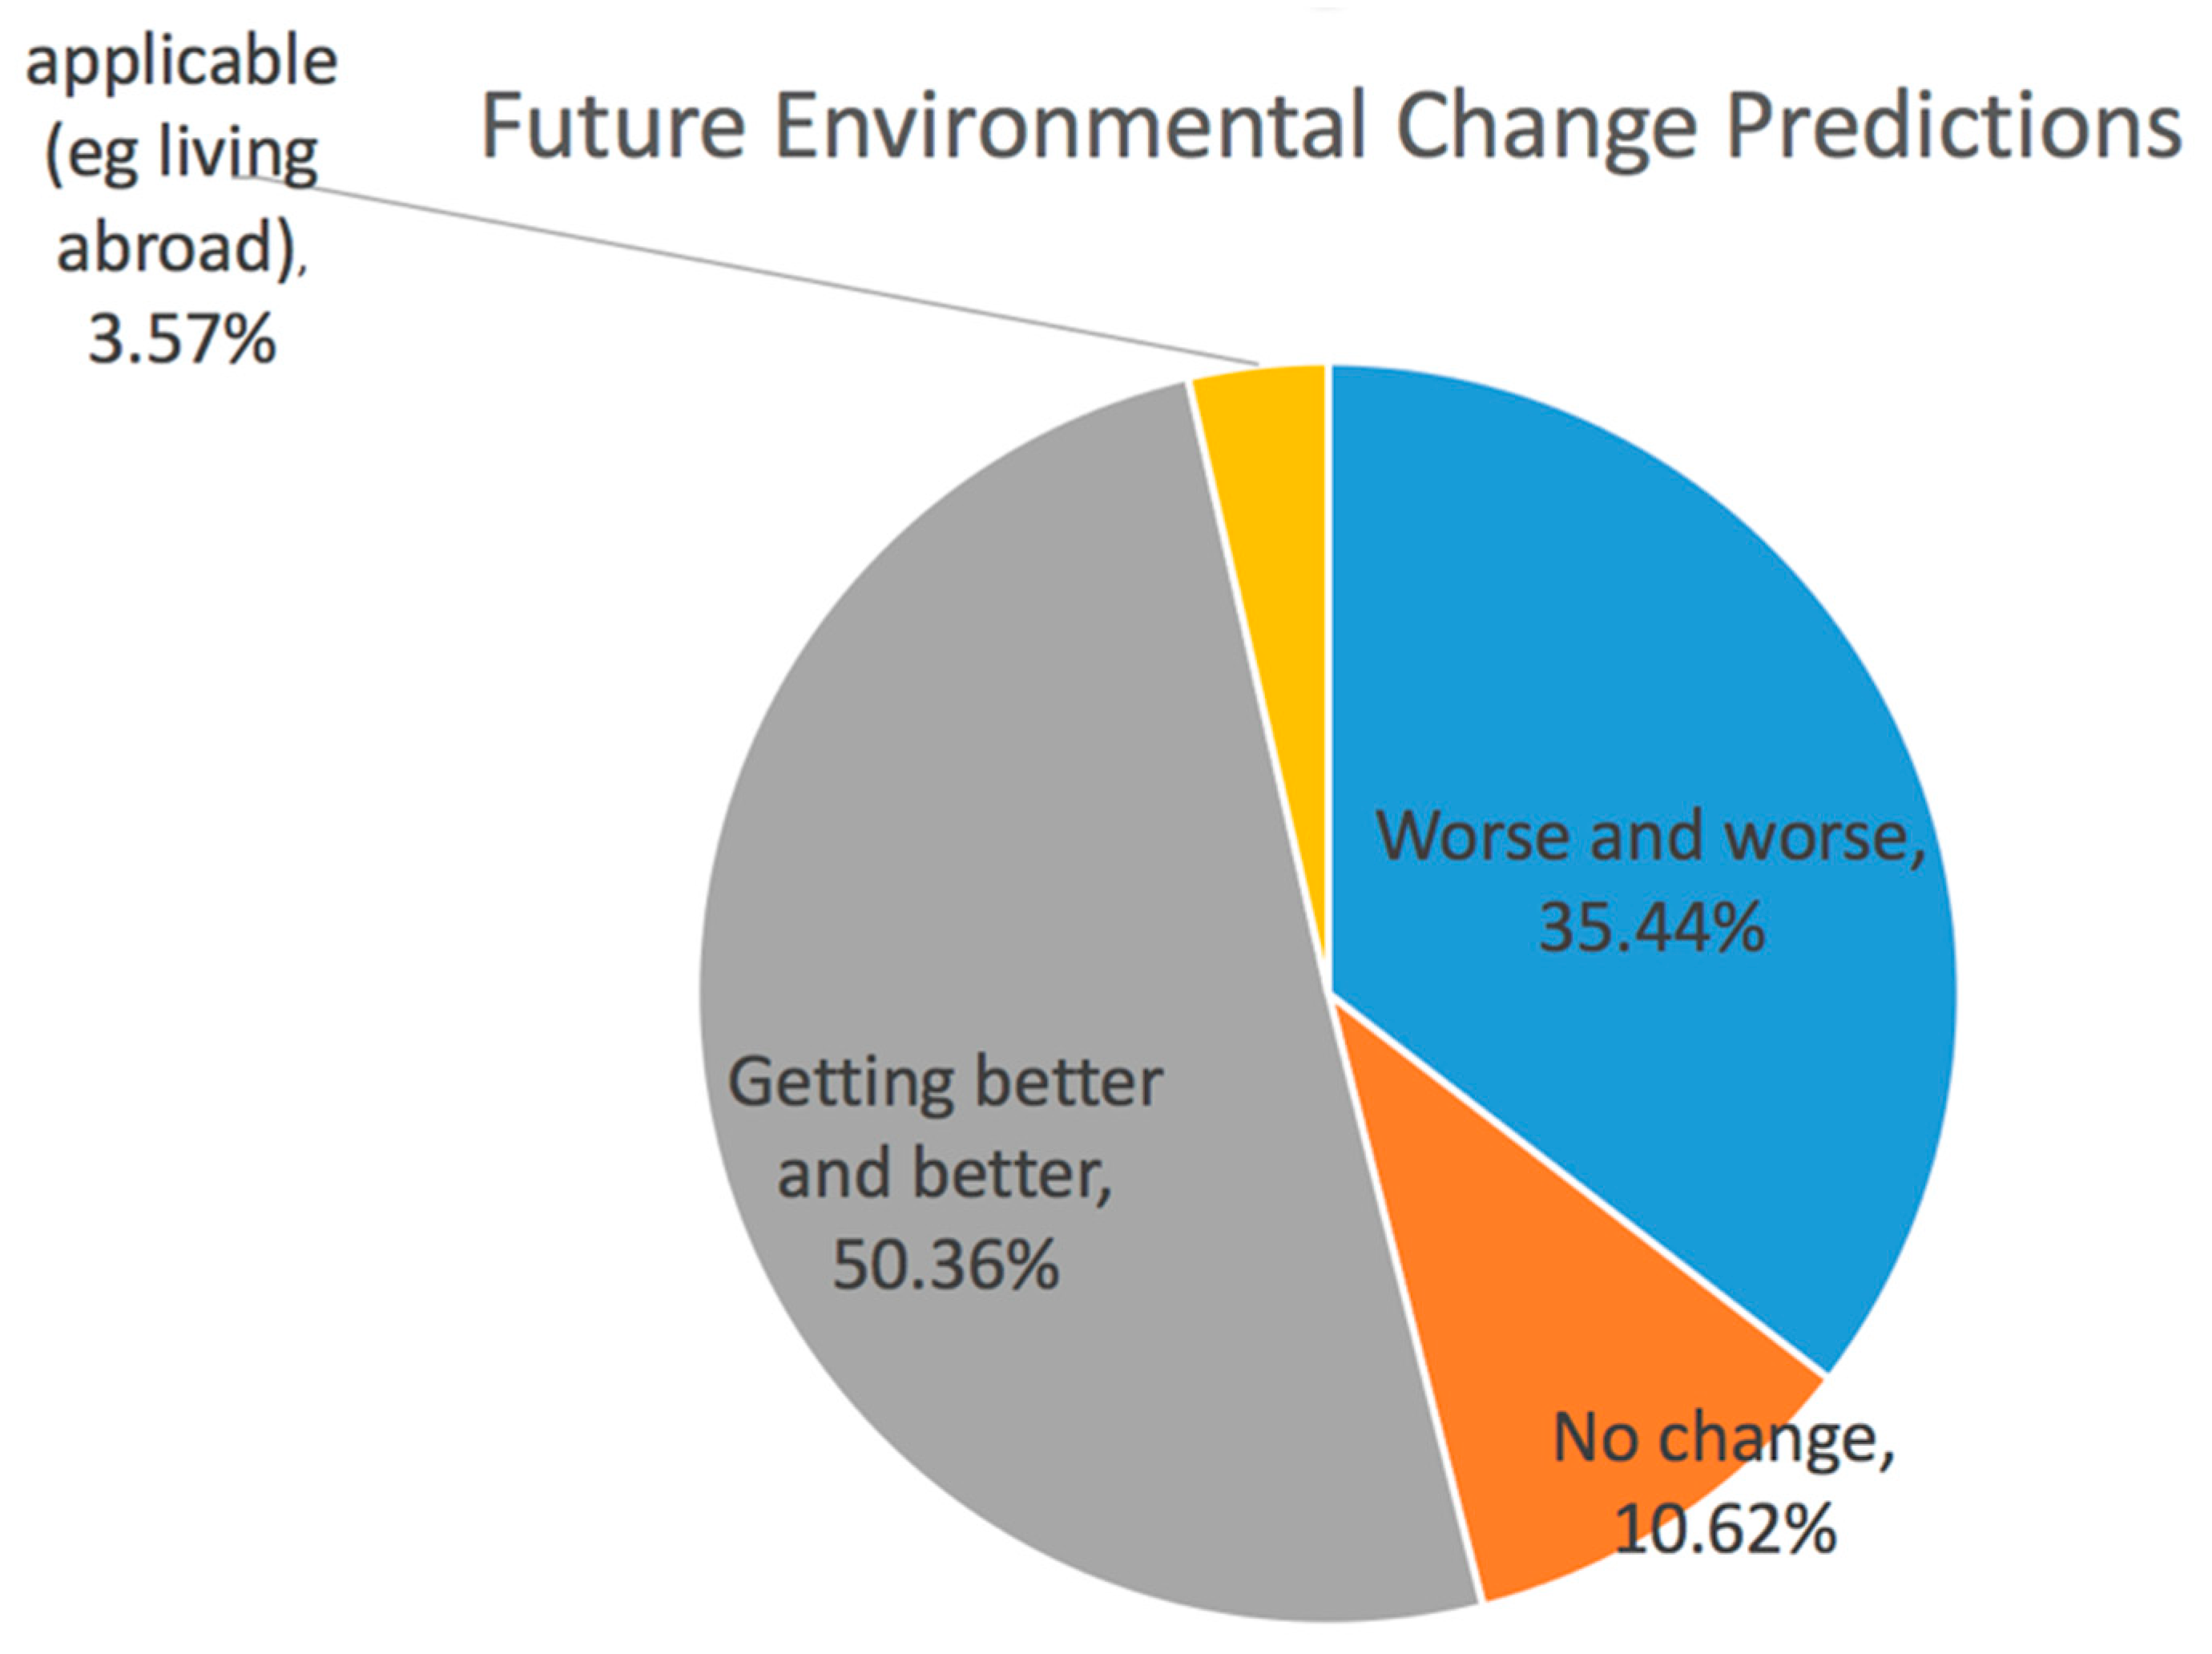
Sustainability 10 01970 g010
Figure 11. The result for Question 10 “How will the environment change in China in the future?”: It is noted that 35.44% of people had a negative prediction on the potential for improvement of the environment China, but 50.36% believed the environment would get better.
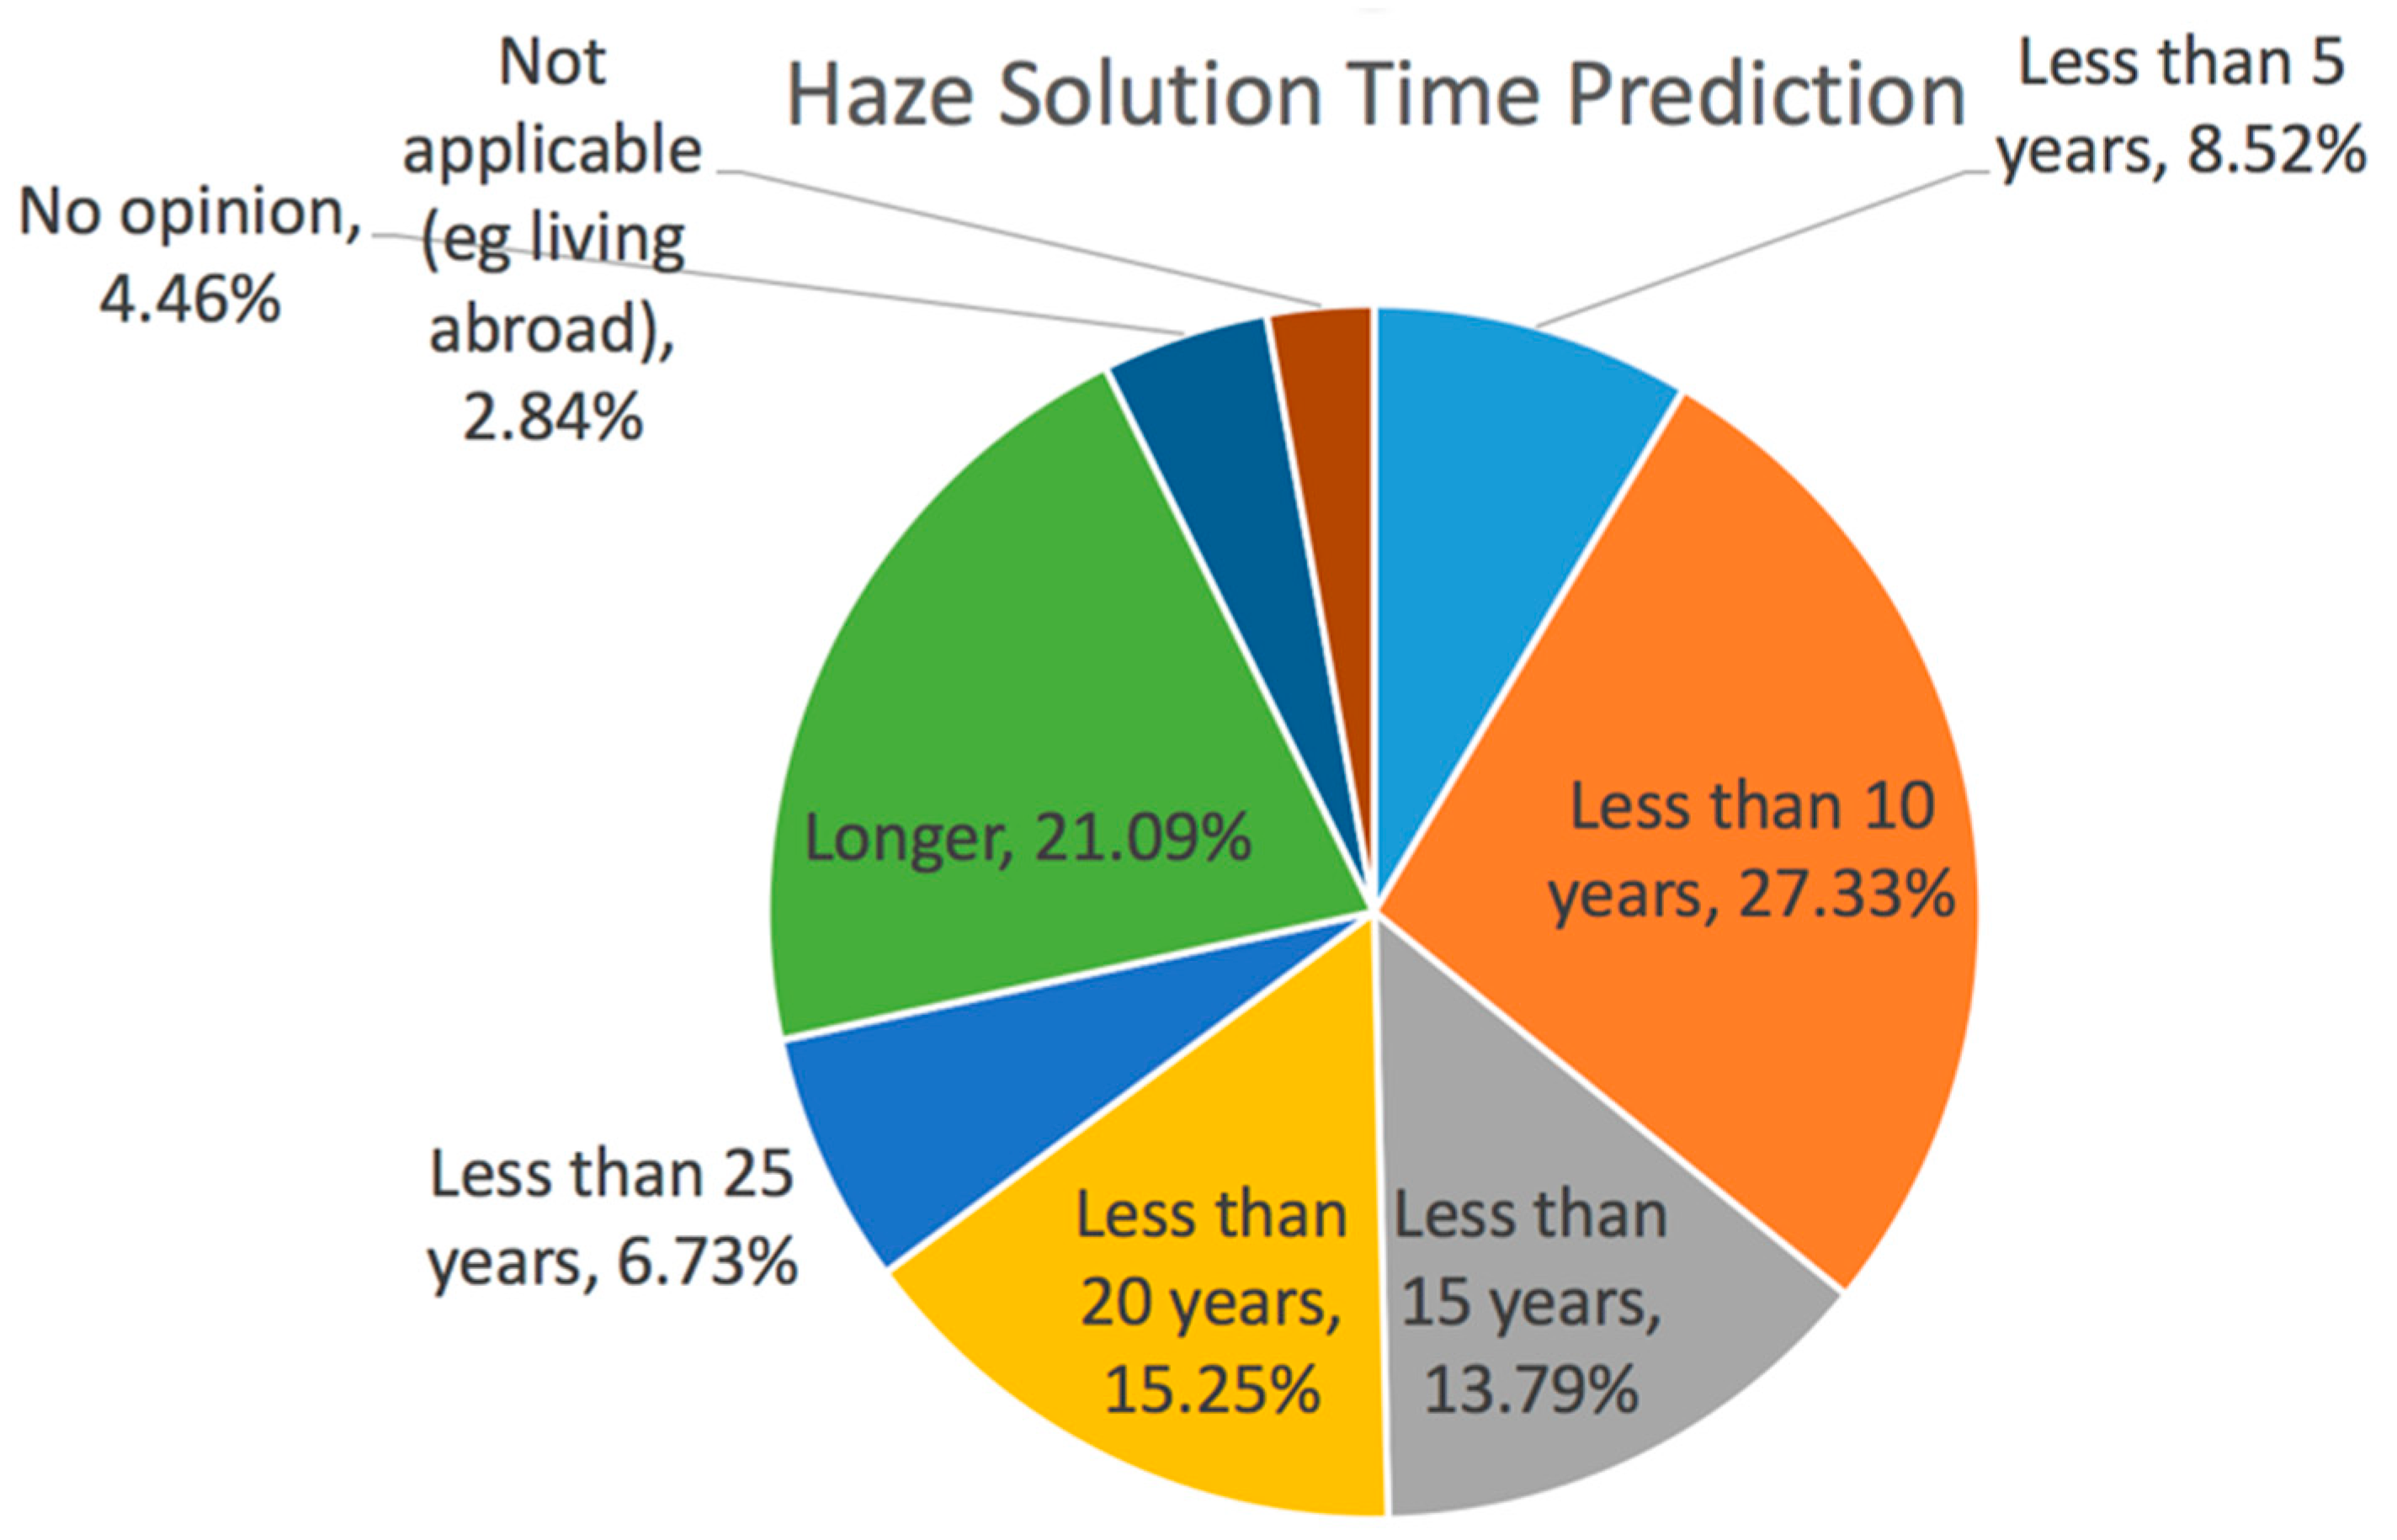
Sustainability 10 01970 g011
Figure 12. The result for Question 11 “How long do you think Chinese can get haze resolved?”: 27.33% of people believed that haze pollution in China would be solved in 5–10 years, with 8.52% of people choosing less than 5 years; 13.79% of people chose 10–15 years; 15.25% of people chose in 15–20 years; and 27.82% of people chose 20 years or longer to solve haze.
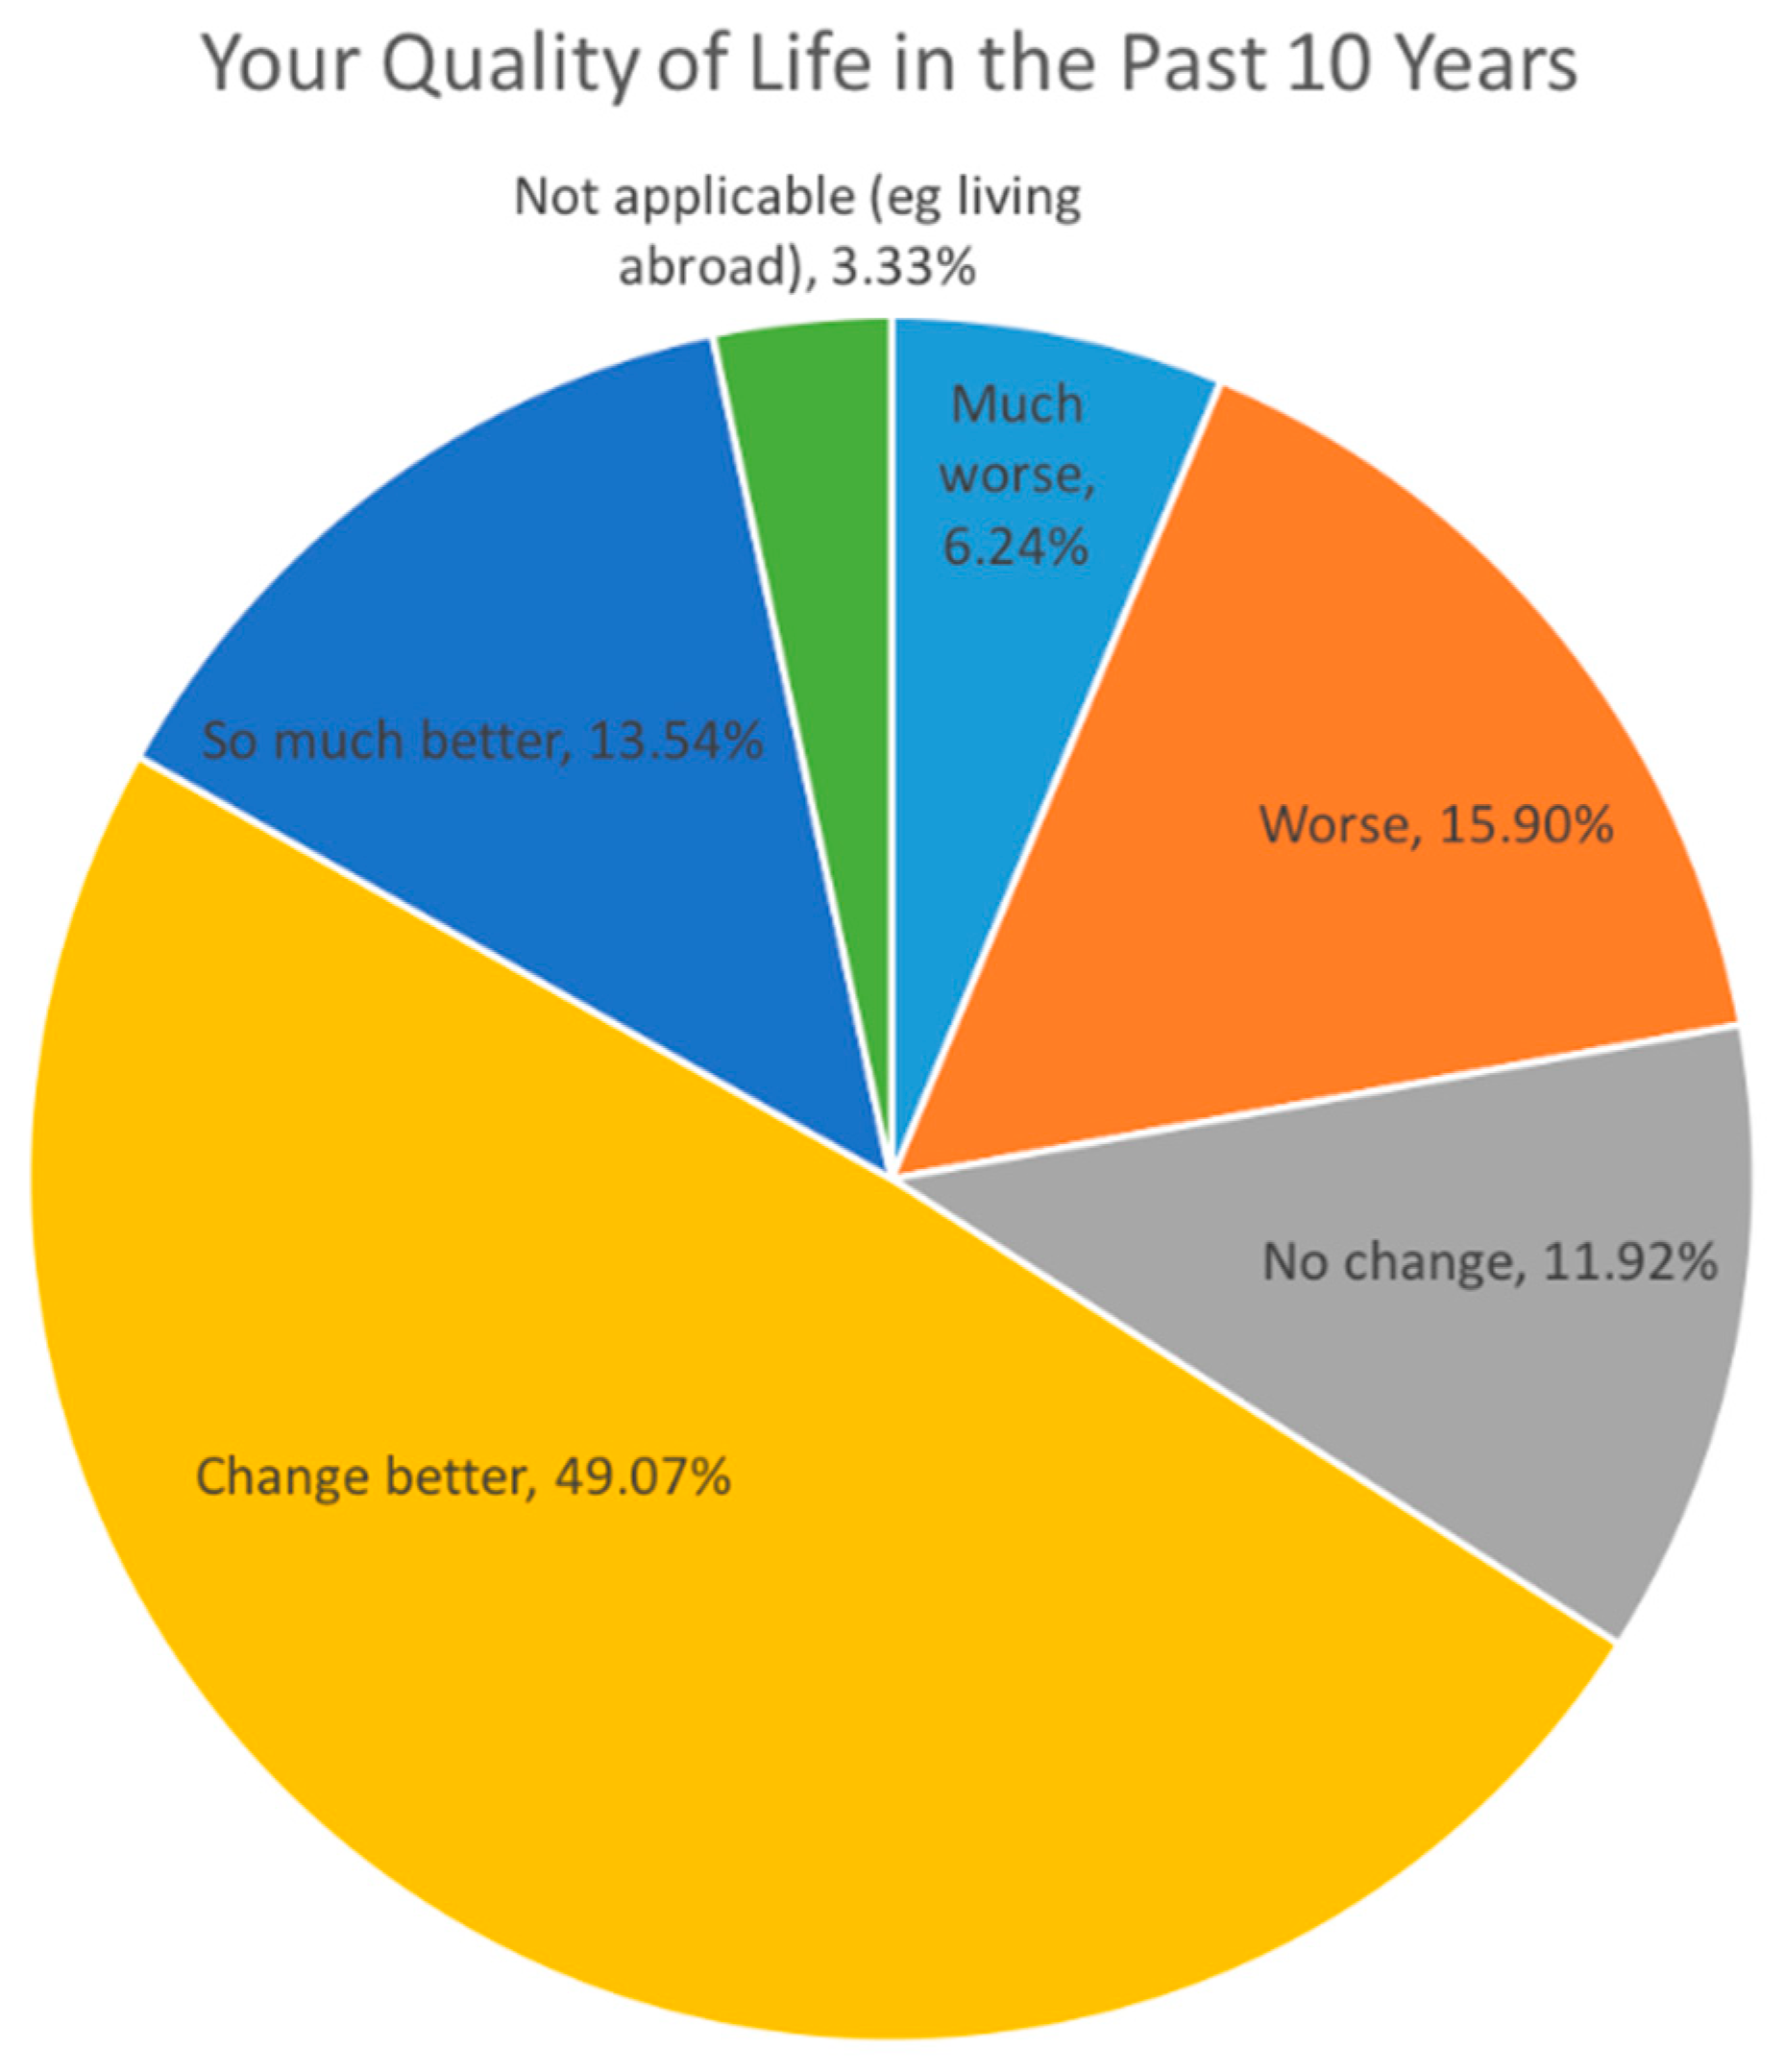
Sustainability 10 01970 g012
Figure 13. The result for Question 12 “How did your life quality (with the consideration of both environment and economic conditions) in the past 10 years?”: 49.07% and 13.54% of people agreed that quality of life (with the consideration of economic conditions) in the past years for the general population changed for the “better” and “much better”, respectively. On the contrary, 15.9% said quality of life got worse, and for 6.24%, it got much worse, while 11.92% said their life quality did not change.
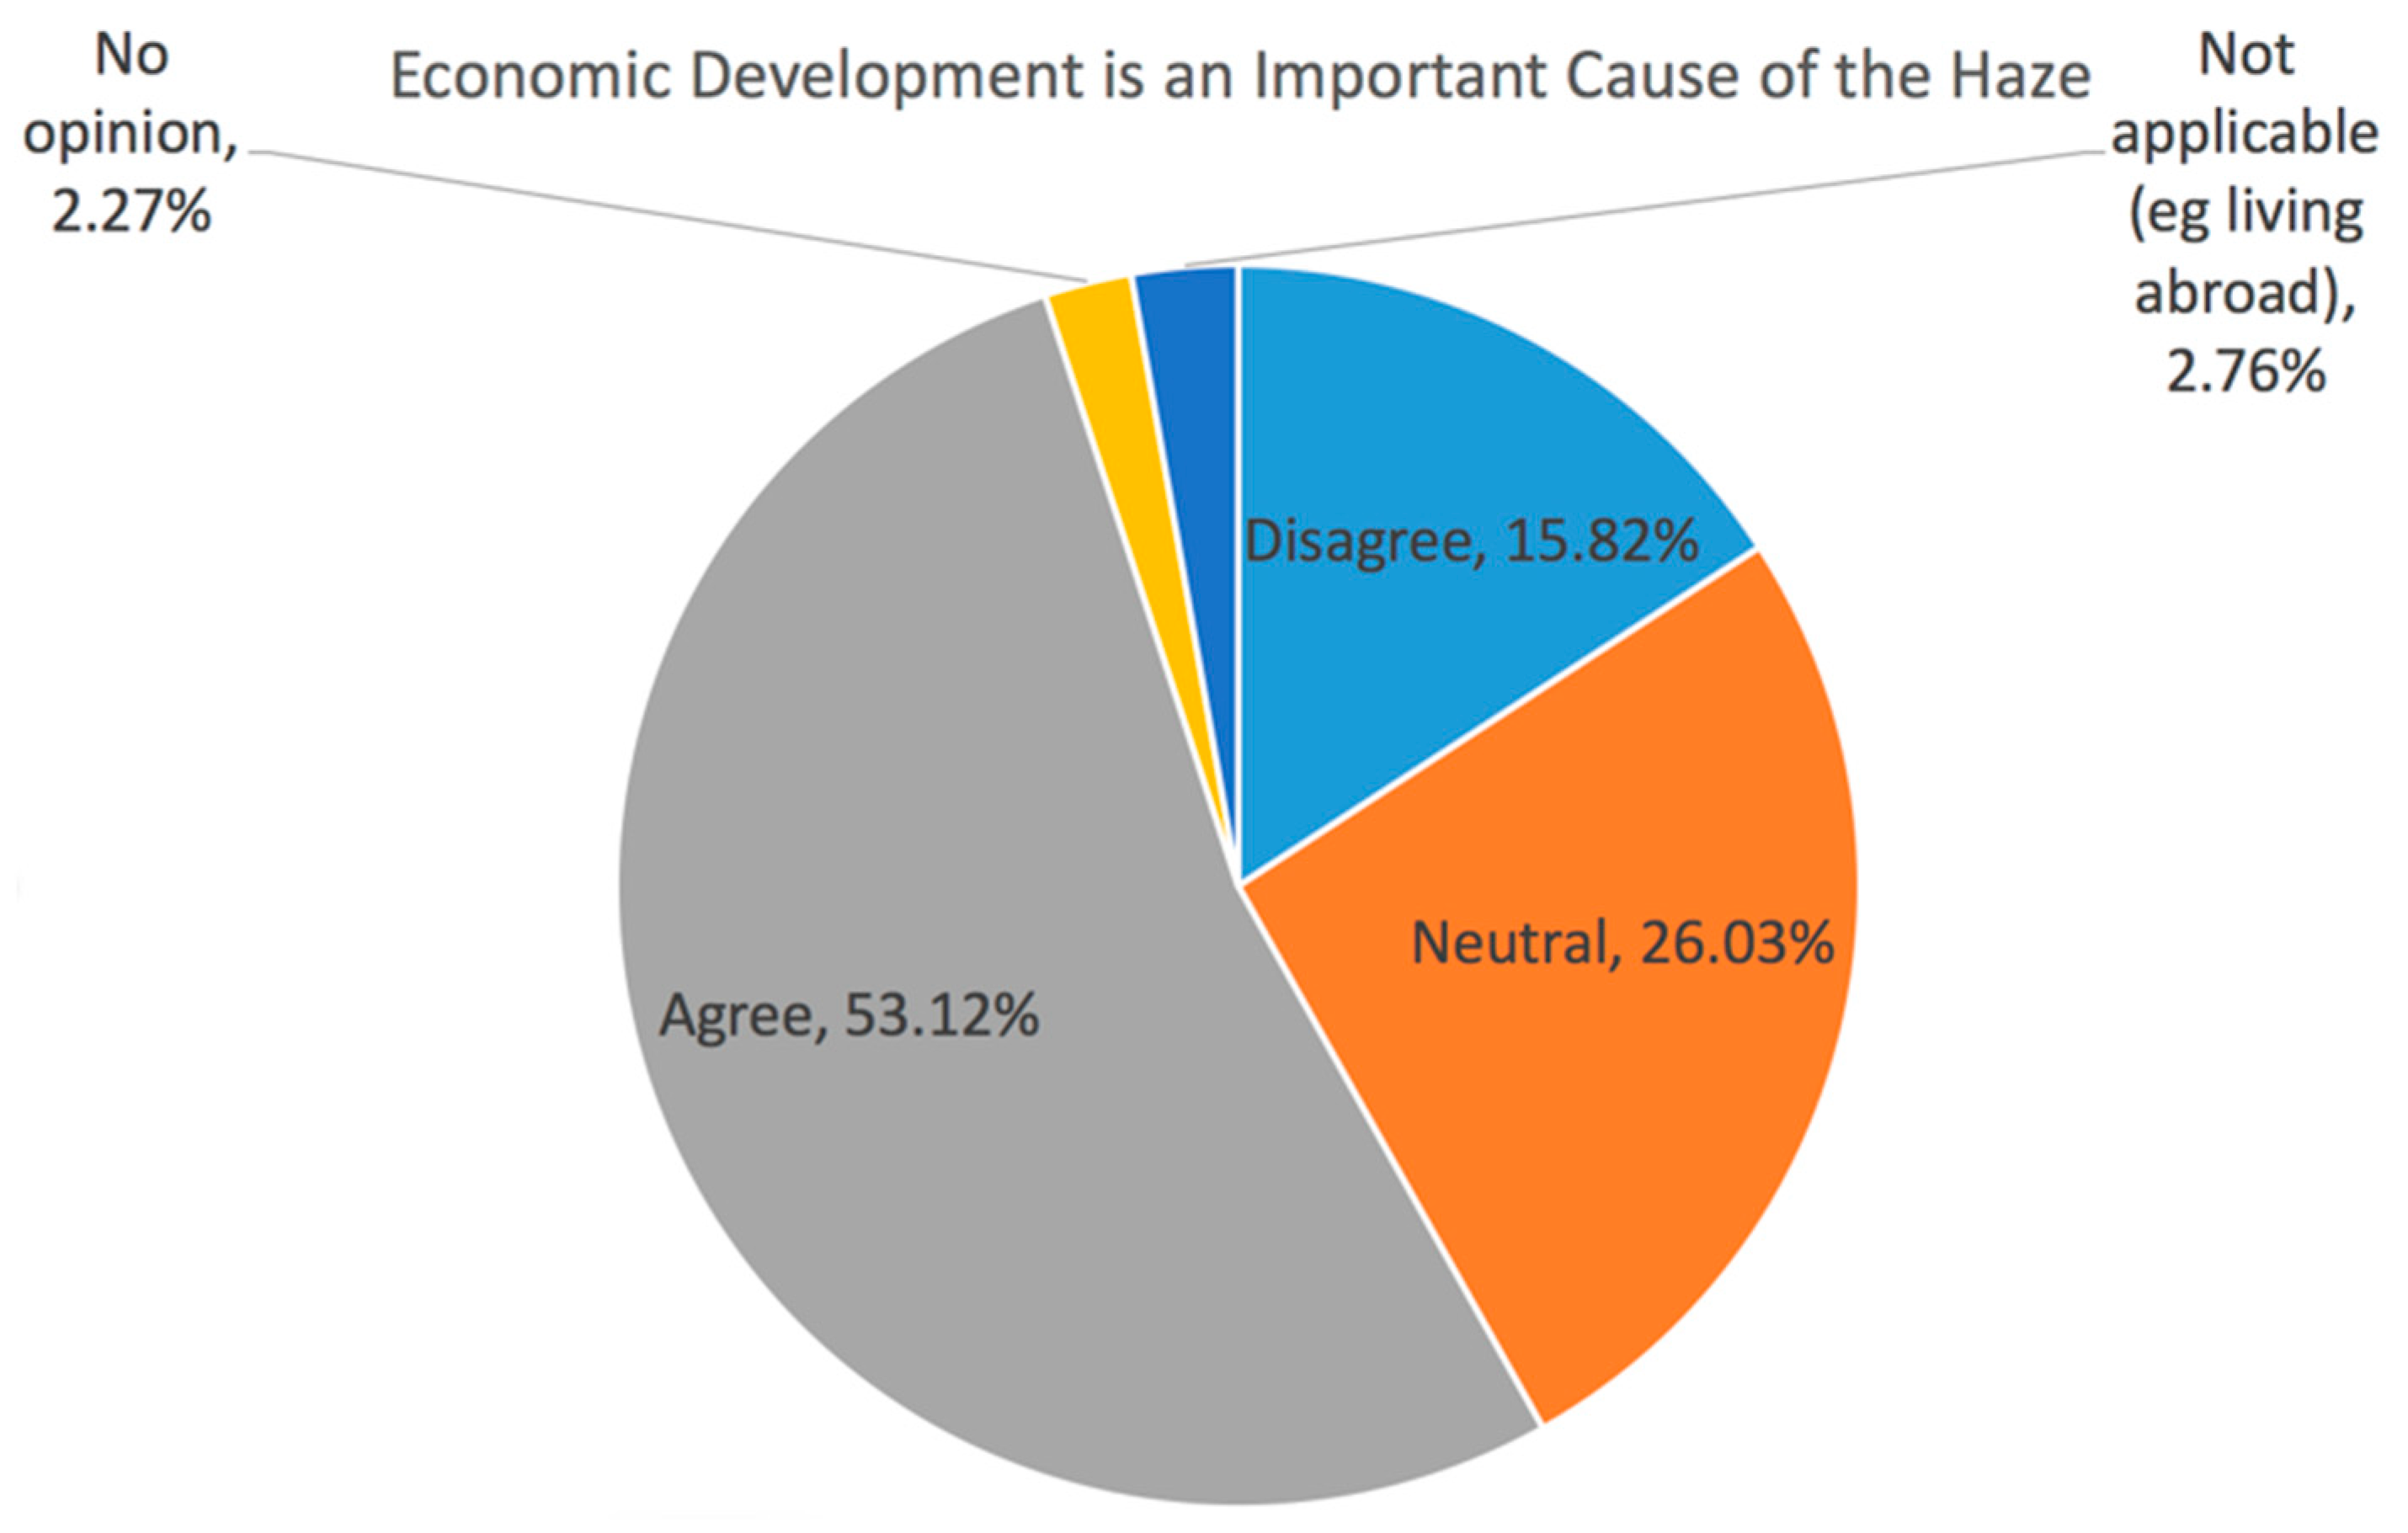
Sustainability 10 01970 g013
Figure 14. The result for Question 13 “Do you think the economic development is a prominent cause of haze?”: 53.12% of respondents agreed that economic development and haze are connected by causation. In contrast, 15.82% disagreed that economic development has led to haze pollution, and 26.03% were neutral.
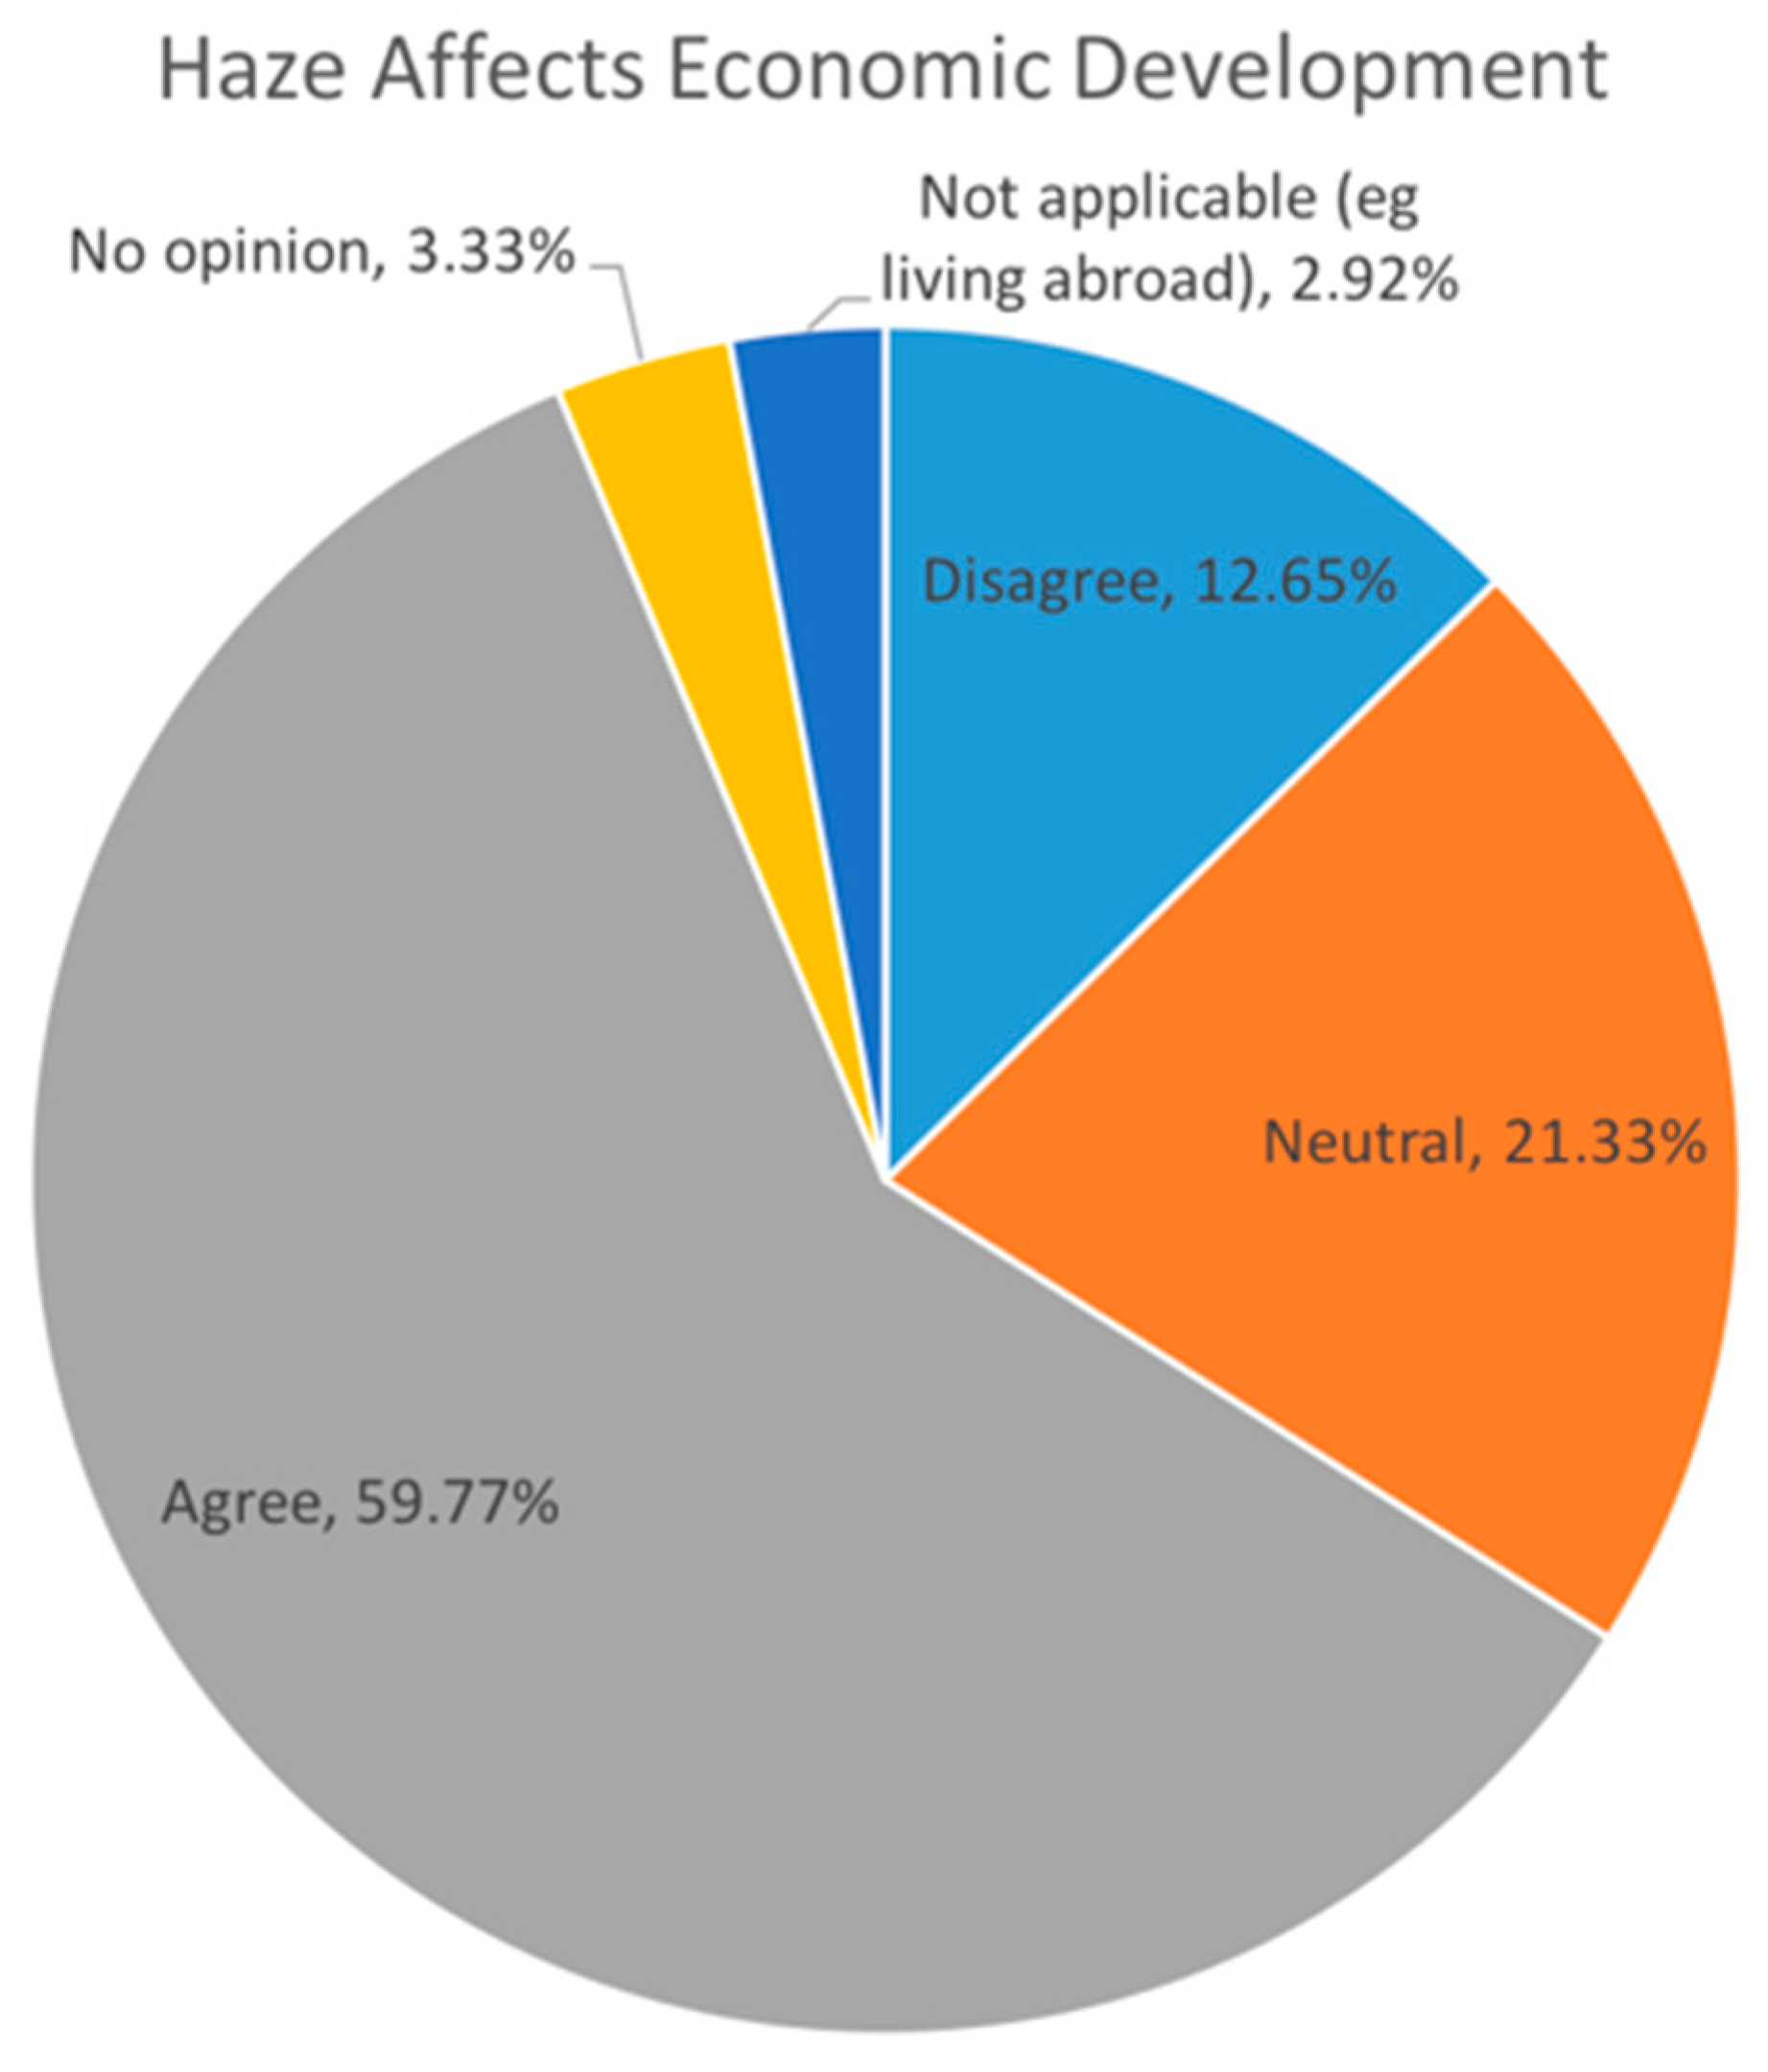
Sustainability 10 01970 g014
Figure 15. The result for Question 14 “Do you agree the haze pollution impair the economic growth?”: 59.77% of respondents agreed that haze affected economic development, 12.65% disagreed that haze affected economic development, and 21.33% were neutral.
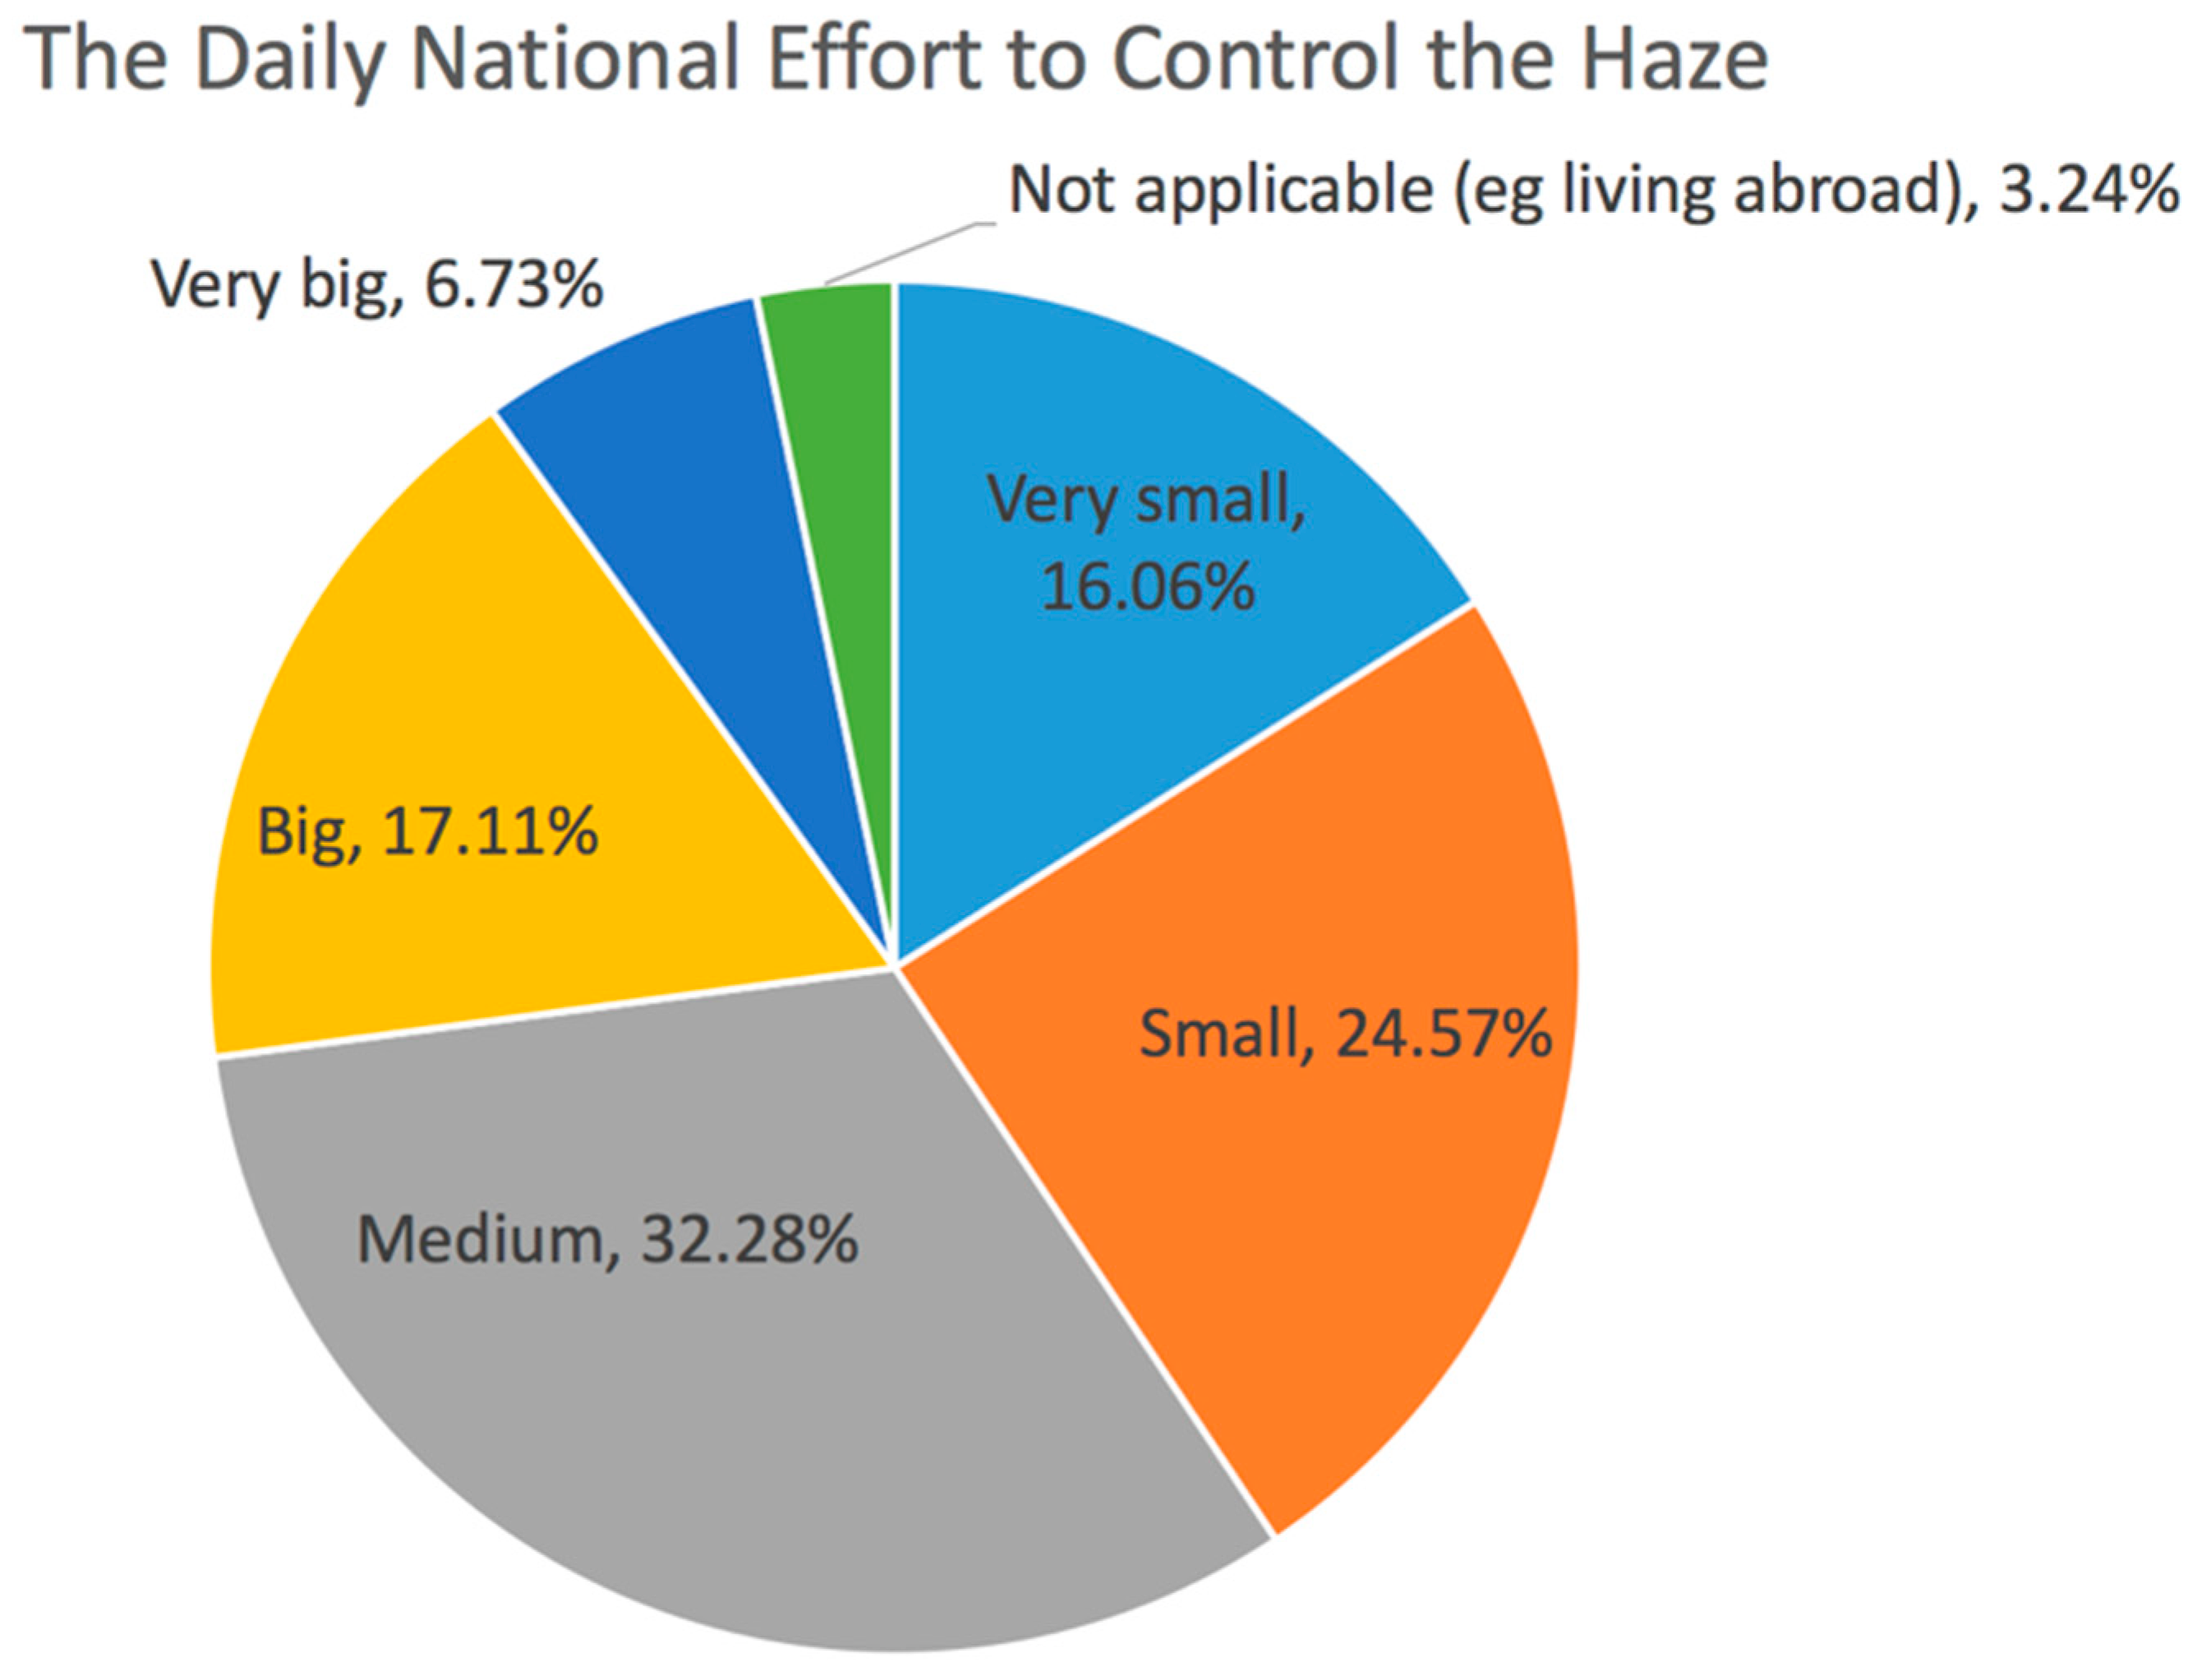
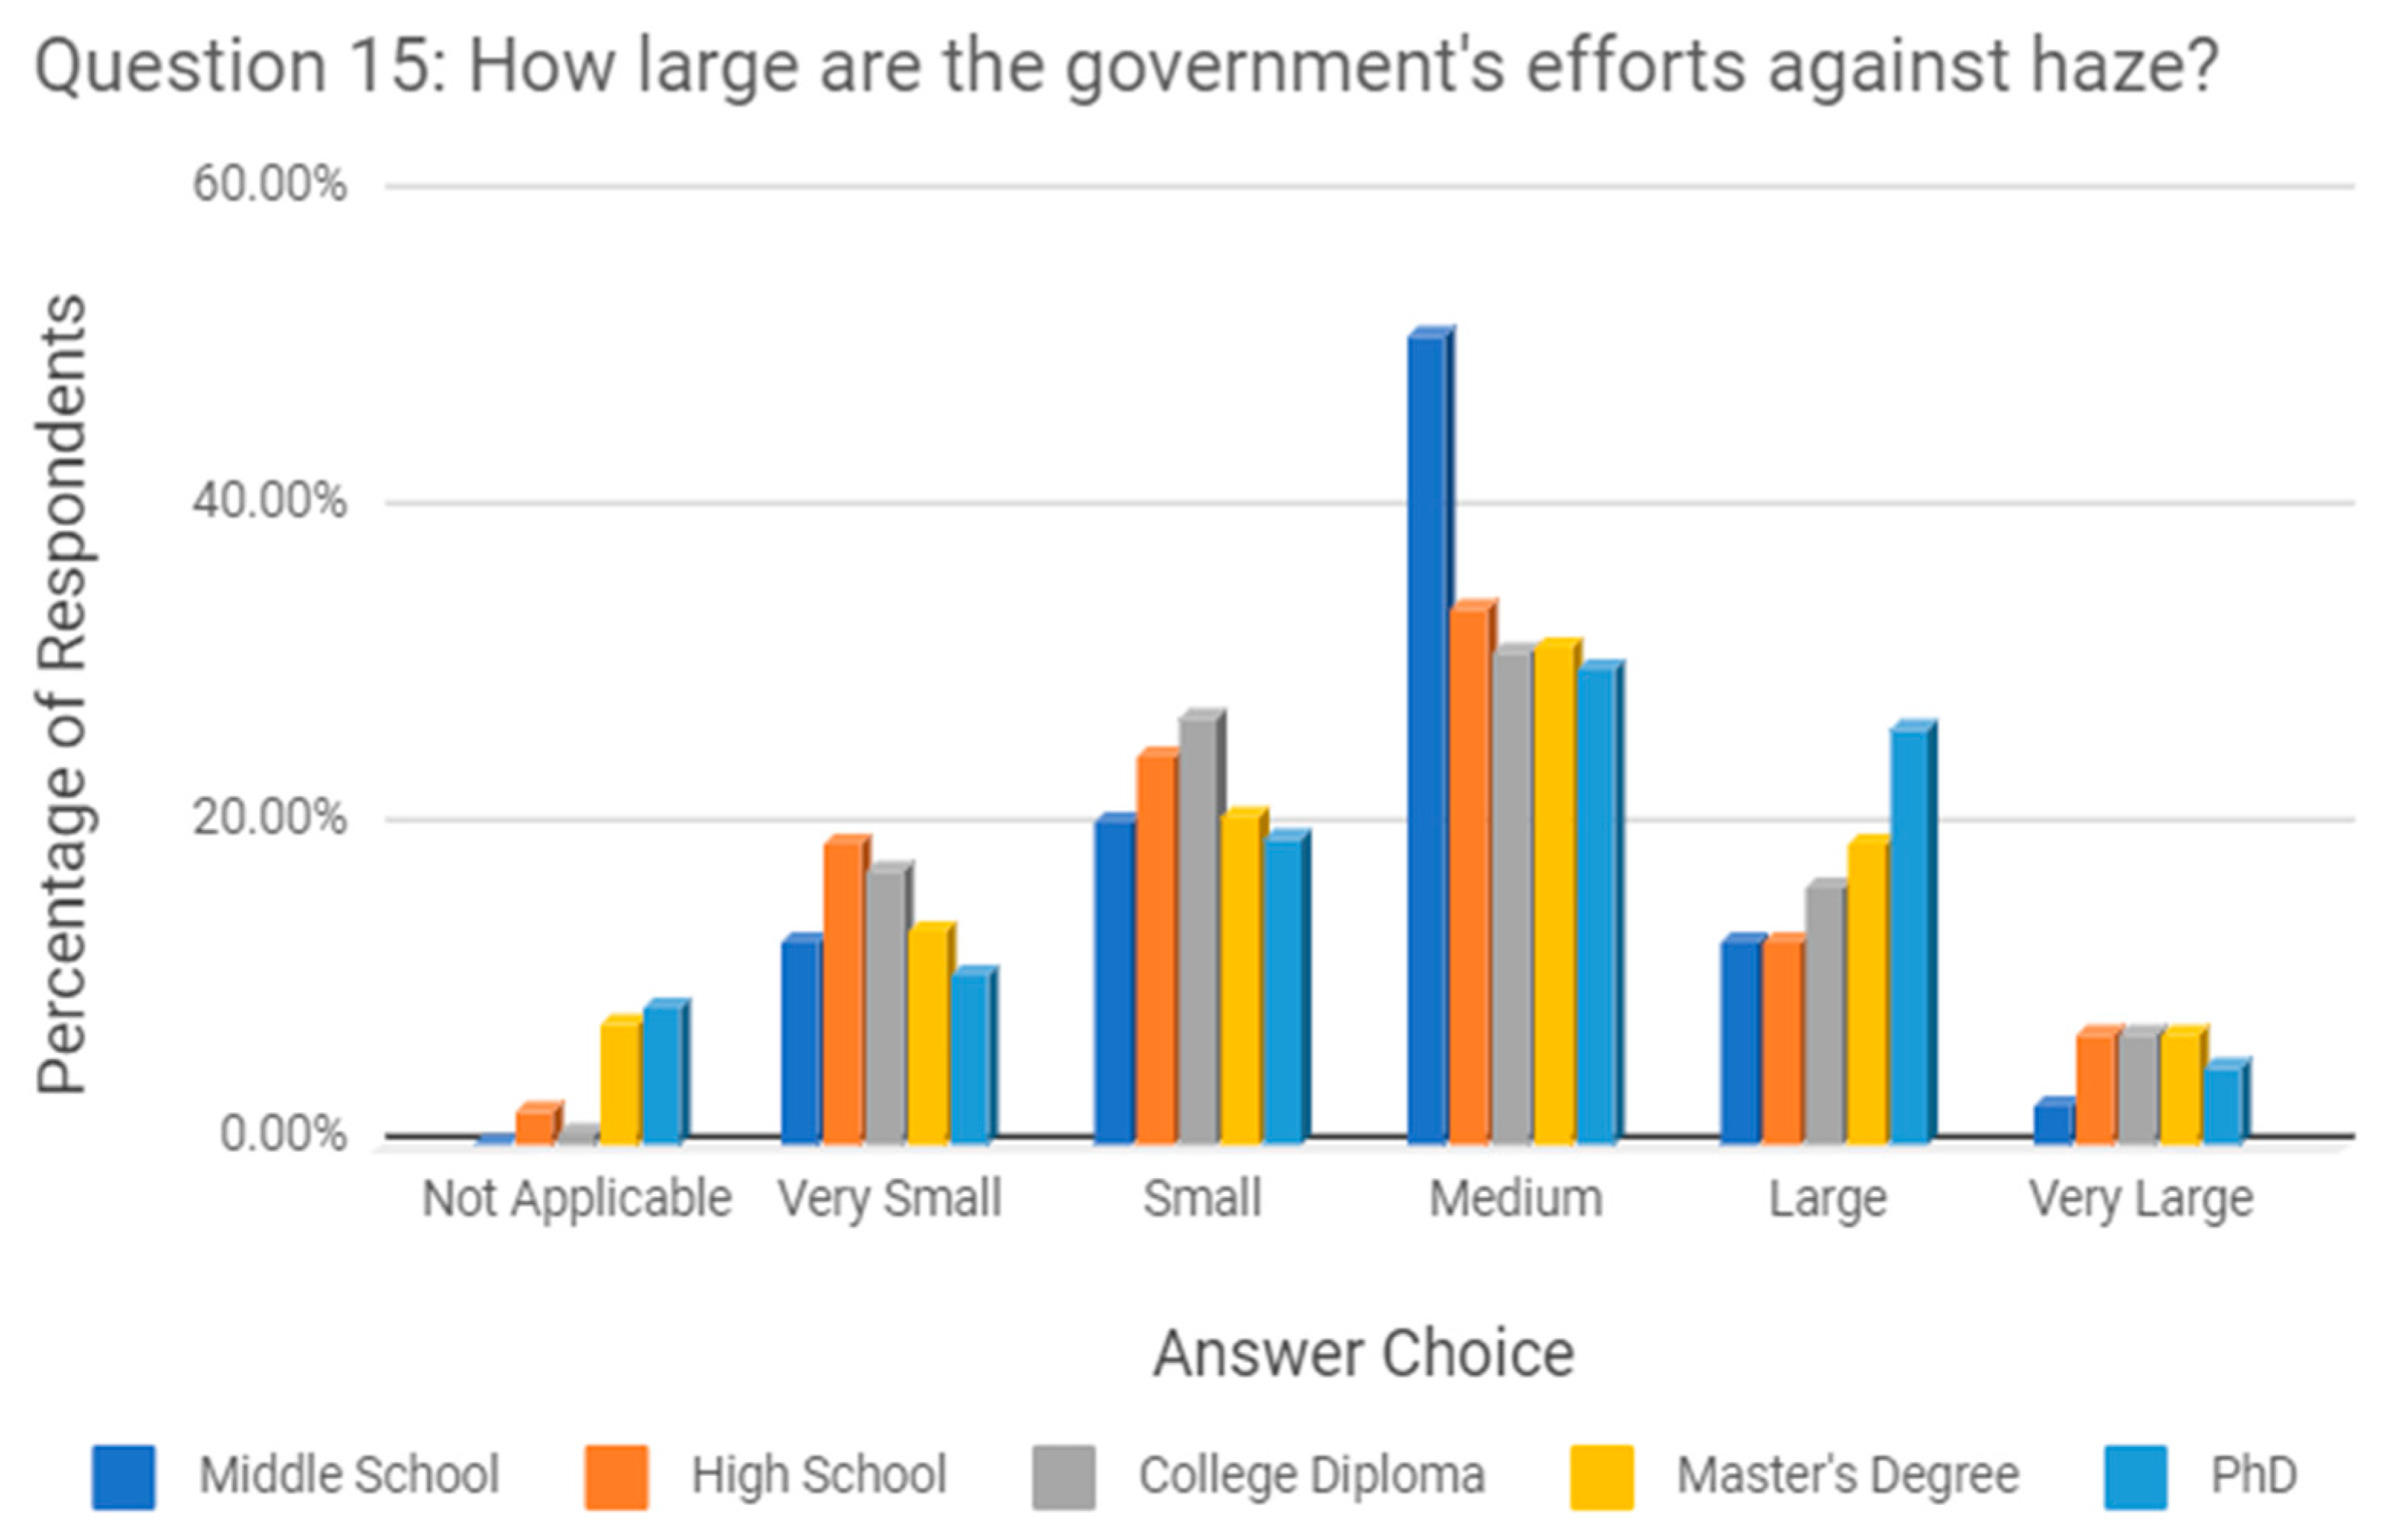
Sustainability 10 01970 g015
Figure 16. The result for Question 15 “How do you rate the government’s effort in handling the haze pollution?”: 24.57% believed national efforts to control haze were small, and 16.06% believed the efforts were very small, totaling 40.63% who believed efforts were small or very small. Overall, 17.11% believed the efforts were big, 6.73% believed the efforts were very big, for a total of 23.84% who believed there was a large effort. Overall, 32.28% believed there was medium national effort.
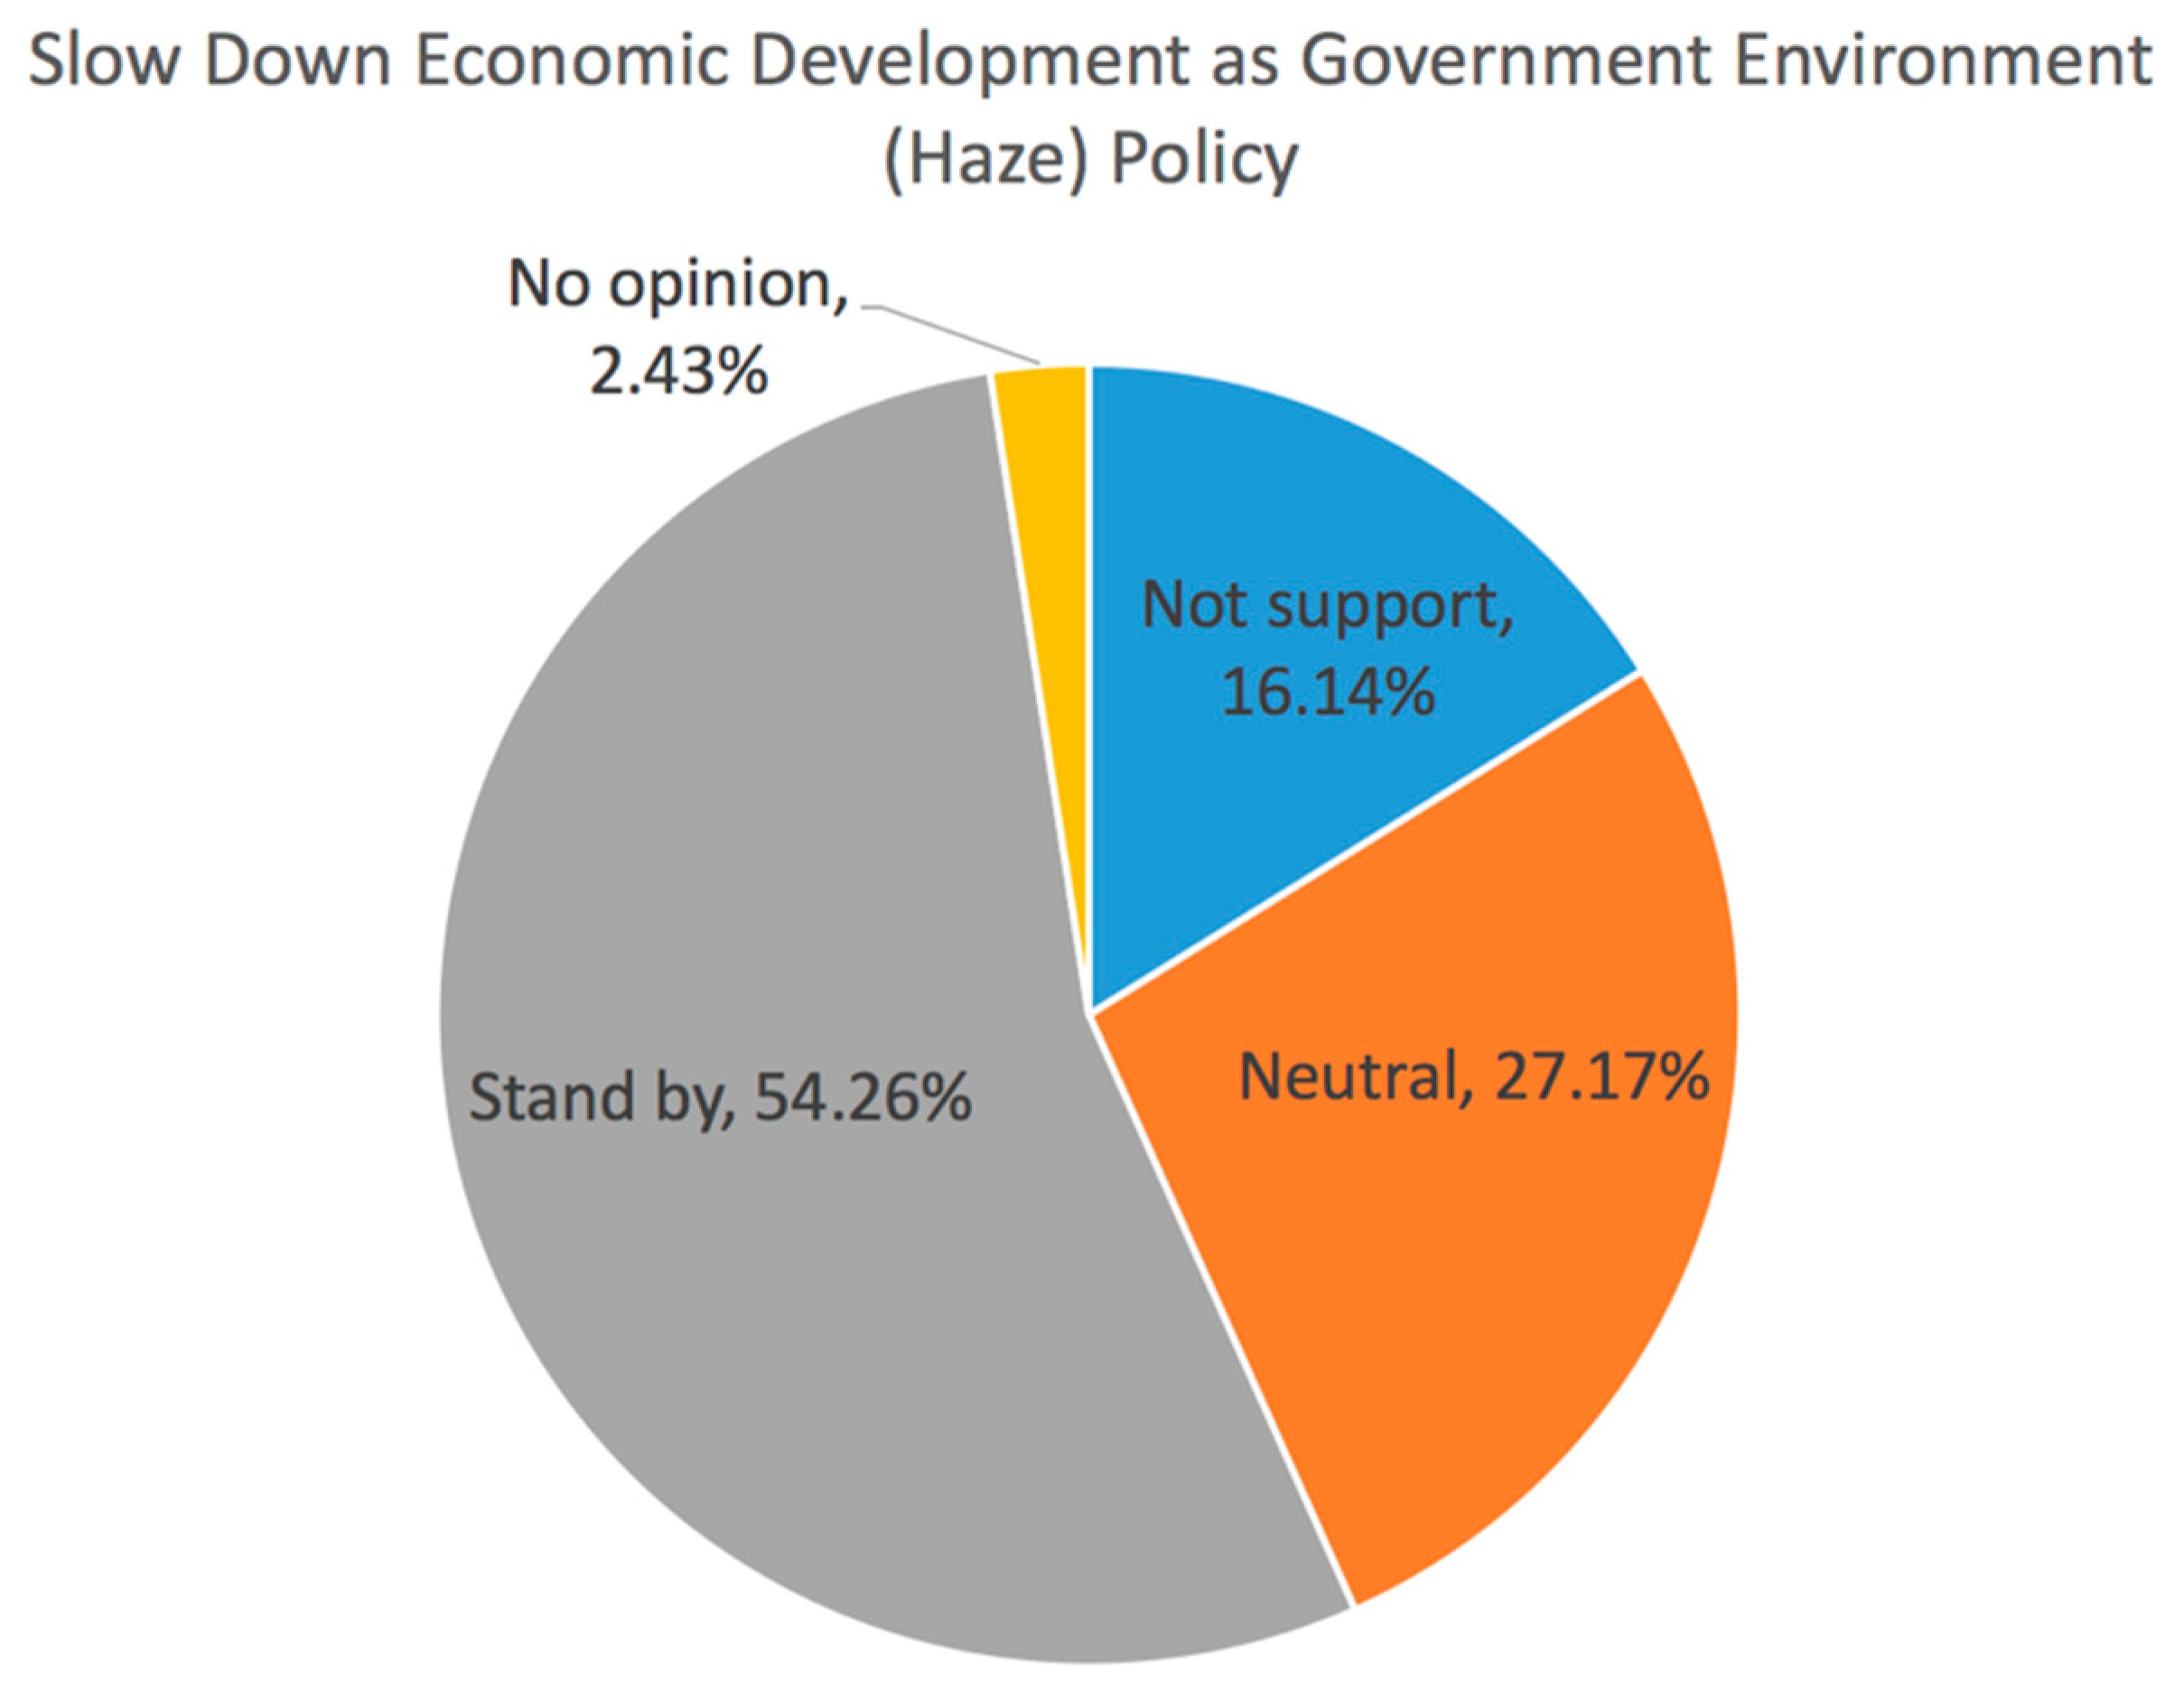
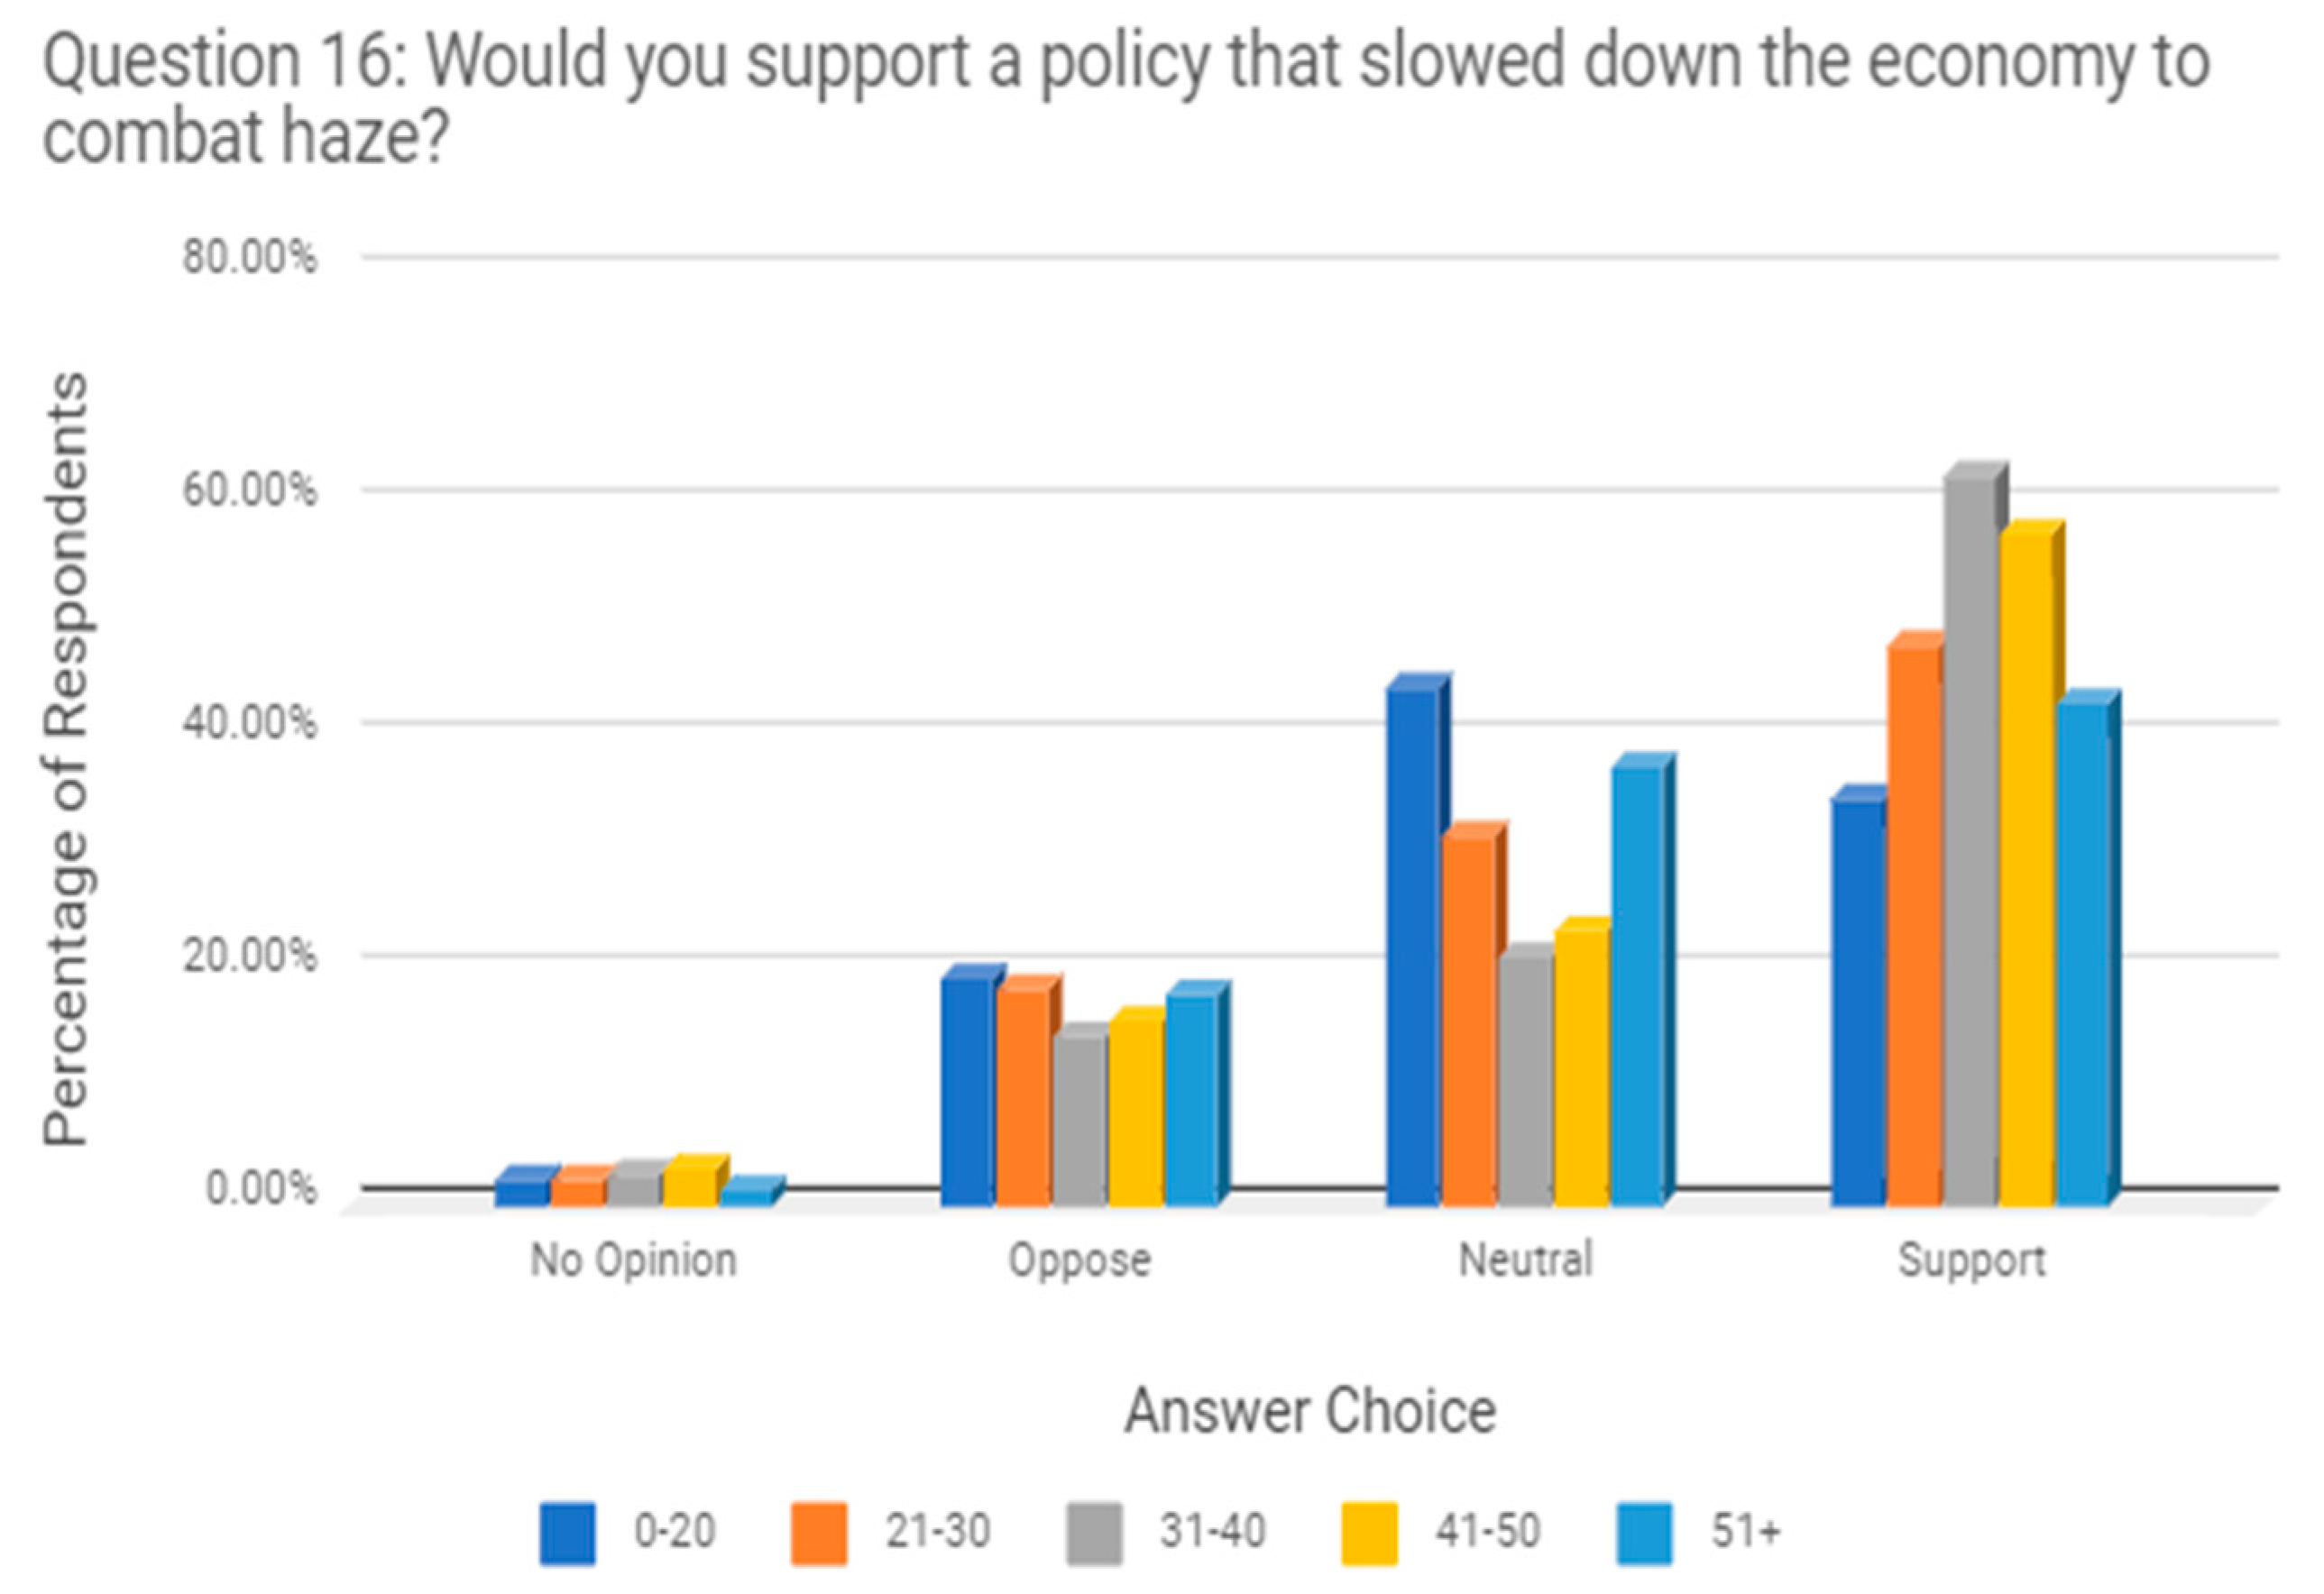
Sustainability 10 01970 g016
Figure 17. The result for Question 16 “Do you support the policy of slowing down the economic growth to reduce the haze pollution?”: 54.26% of respondents stood by a government policy that would slow down economic growth to focus on haze policy and prevention. Overall, 27.17% were neutral, and 16.14% disagreed with such a policy.
Sustainability 10 01970 g017
Figure 18. The result for Question 17 “Which option do you agree to handle the economic growth versus the haze pollution?”: 76.32% of people agreed that a clean economic development plan would be the best course of action as a measure to control the haze. This is opposed to 17.44% who believed that haze prevention should be vigorously managed before economic growth is considered, and only 2.35% who believed in an economy-first plan over environmental protection.
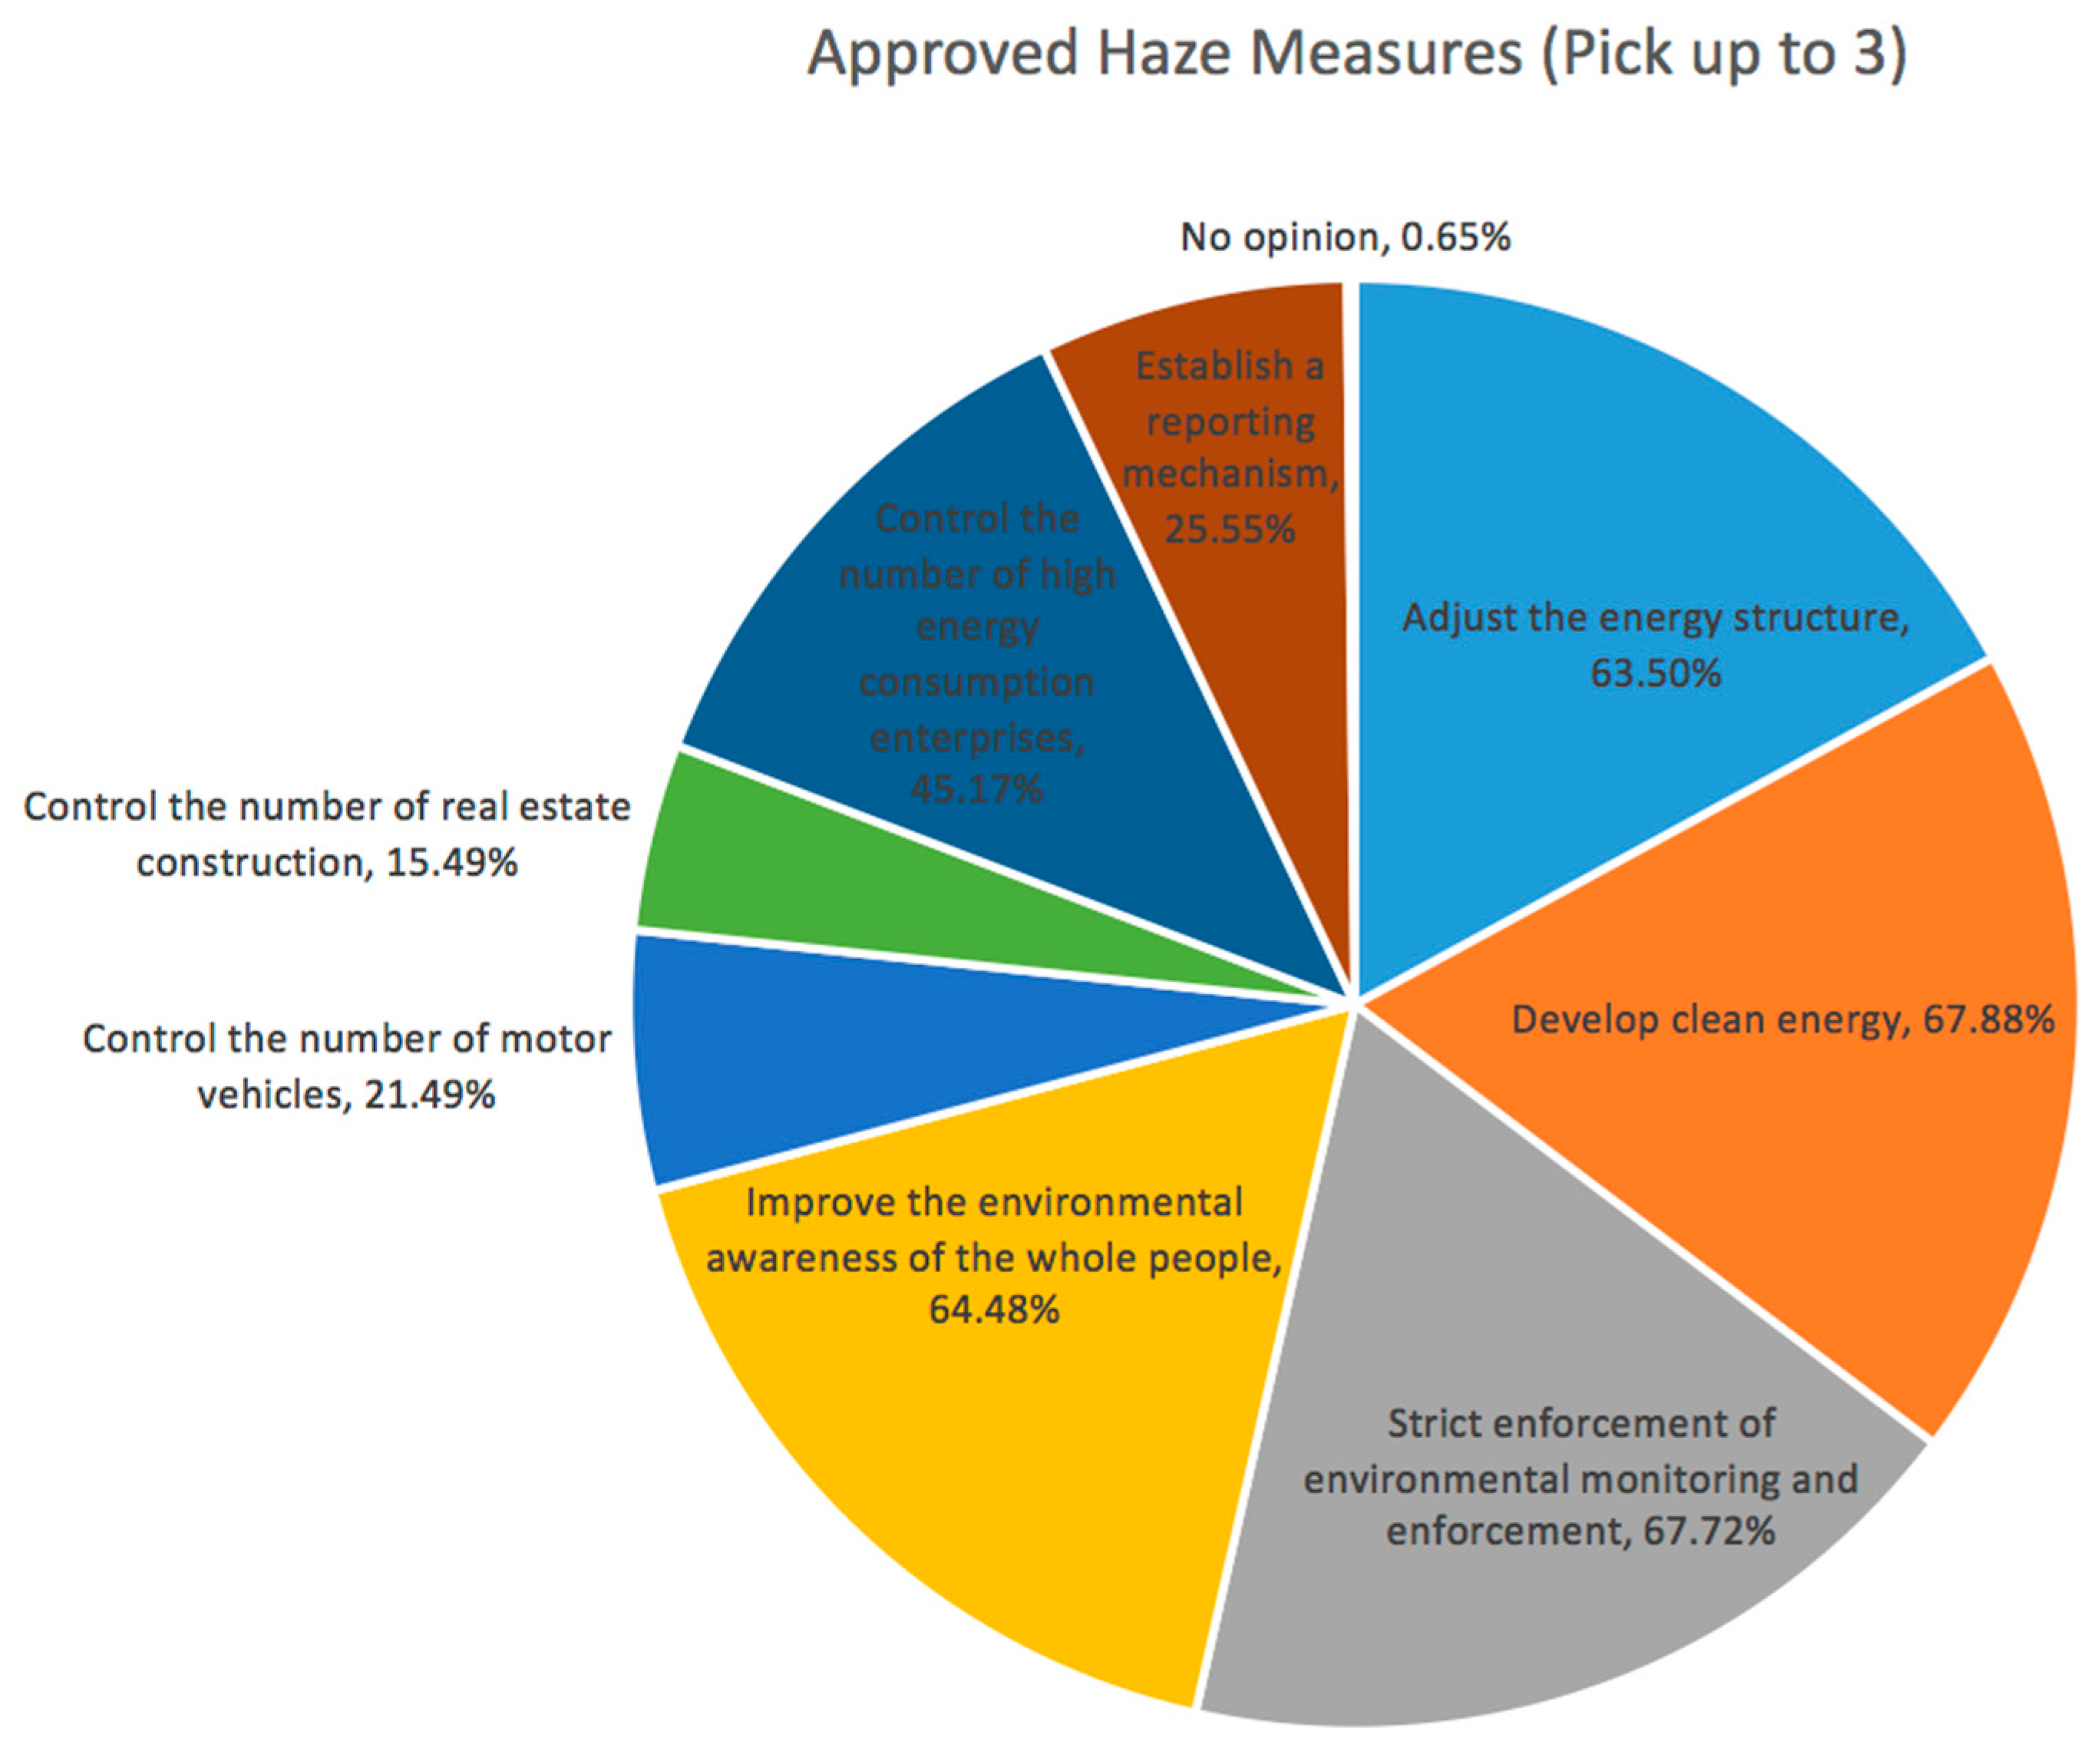
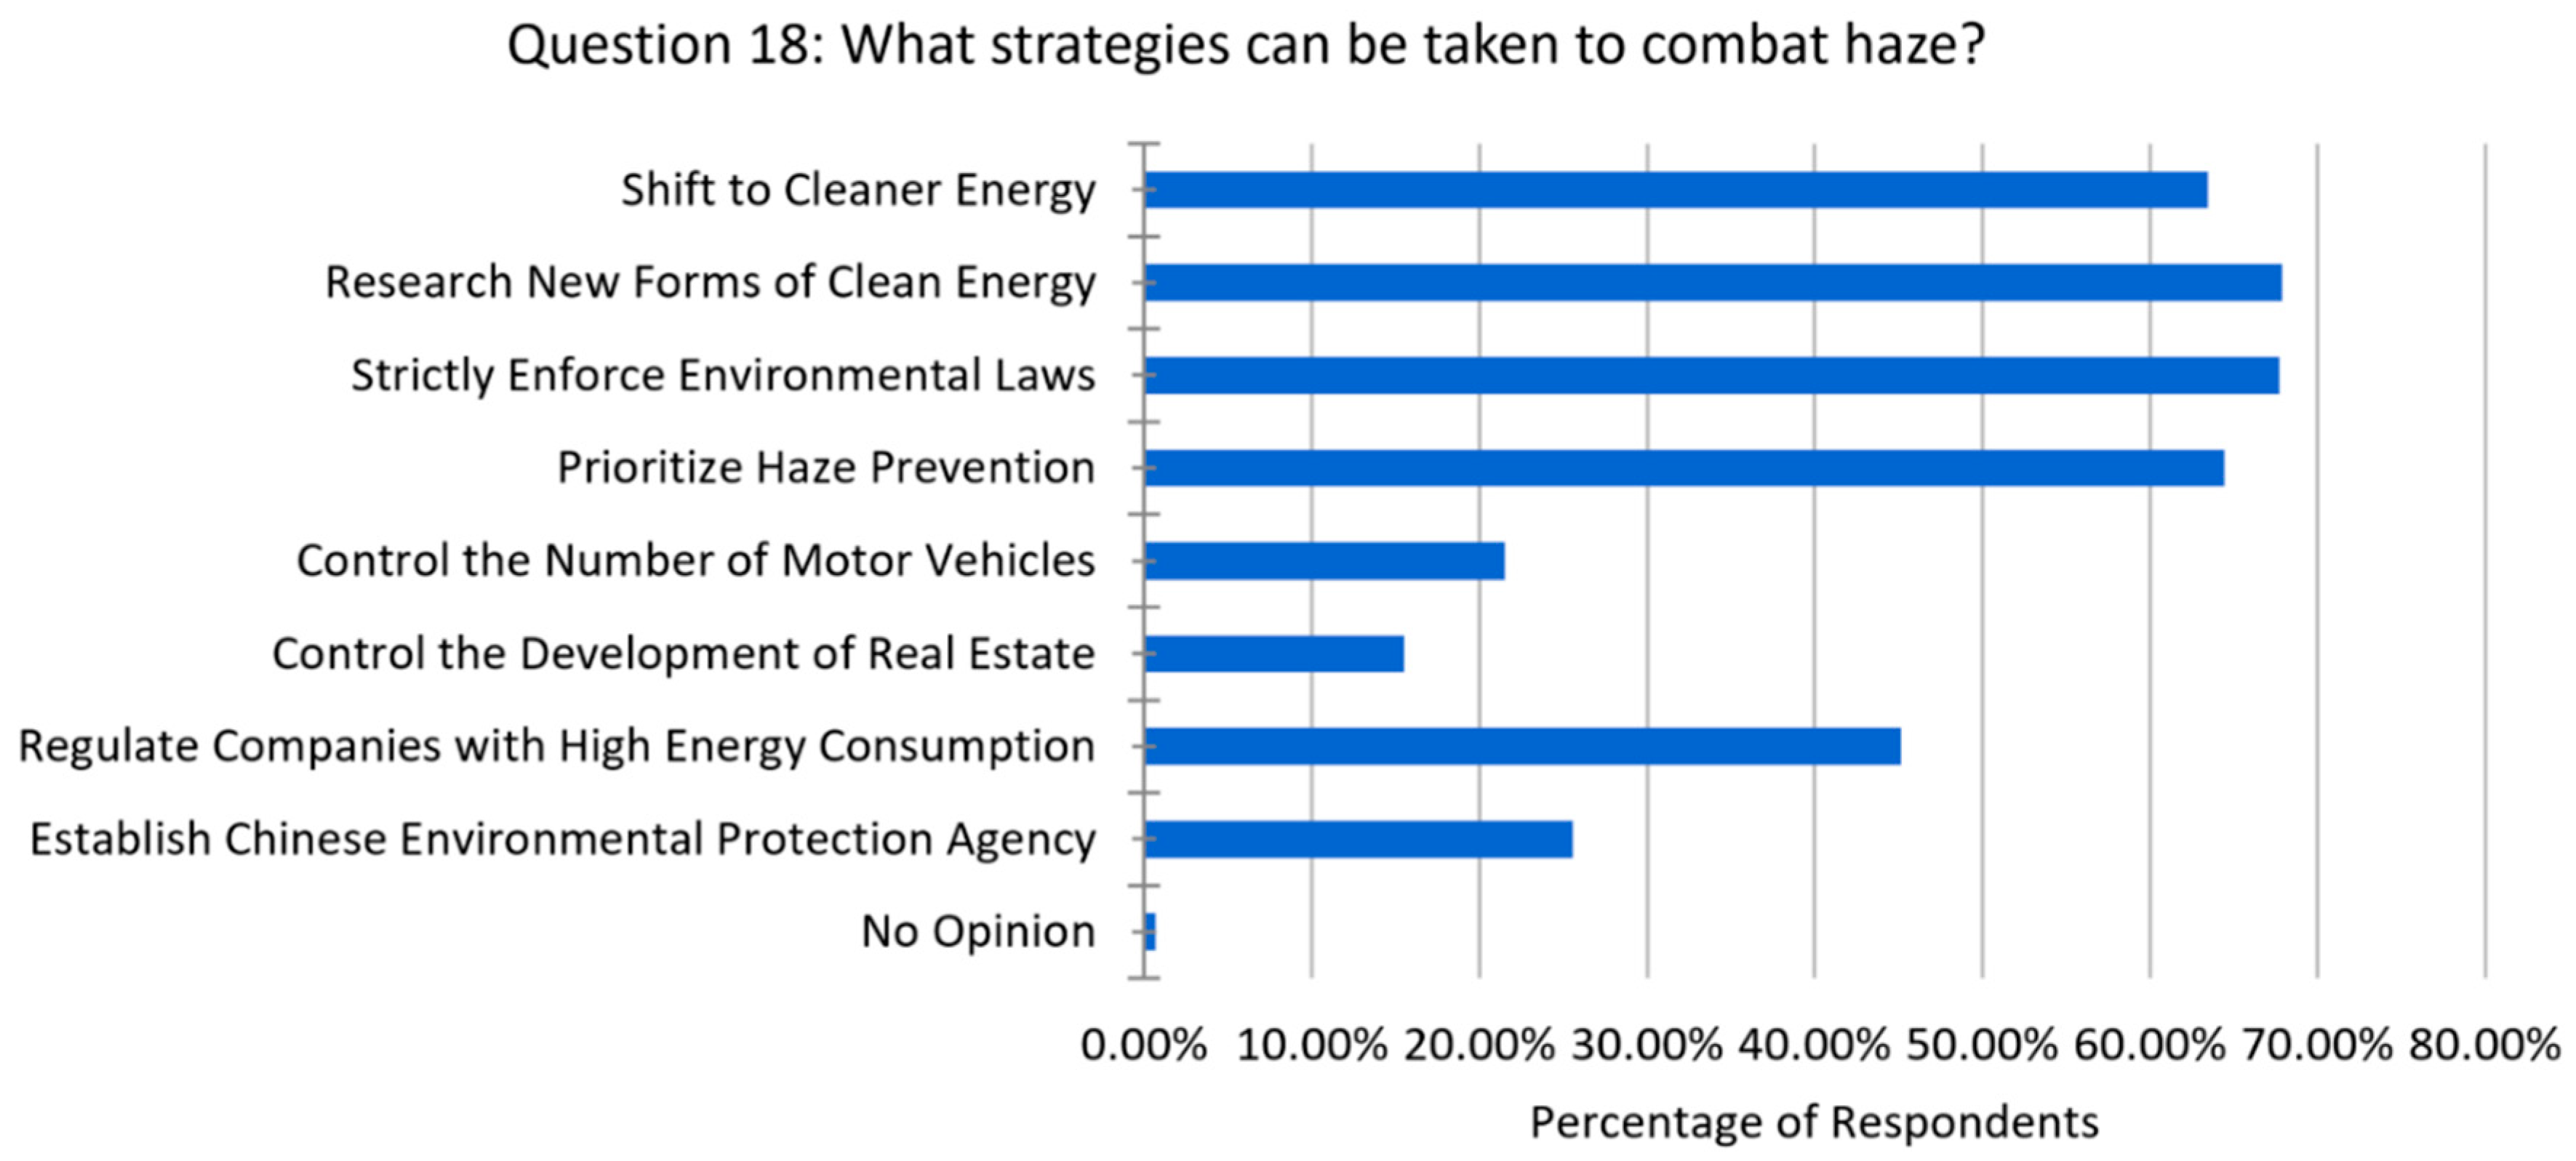
Sustainability 10 01970 g018
Figure 19. The result for Question 18 “Which three approaches do you choose to handle the haze pollution?”: A majority of people supported the need for an increase in environmental awareness, strict environmental monitoring, the development of clean energy, and the adjustment of energy structure. Specifically, 67.88% of those surveyed preferred the development of clean energy.
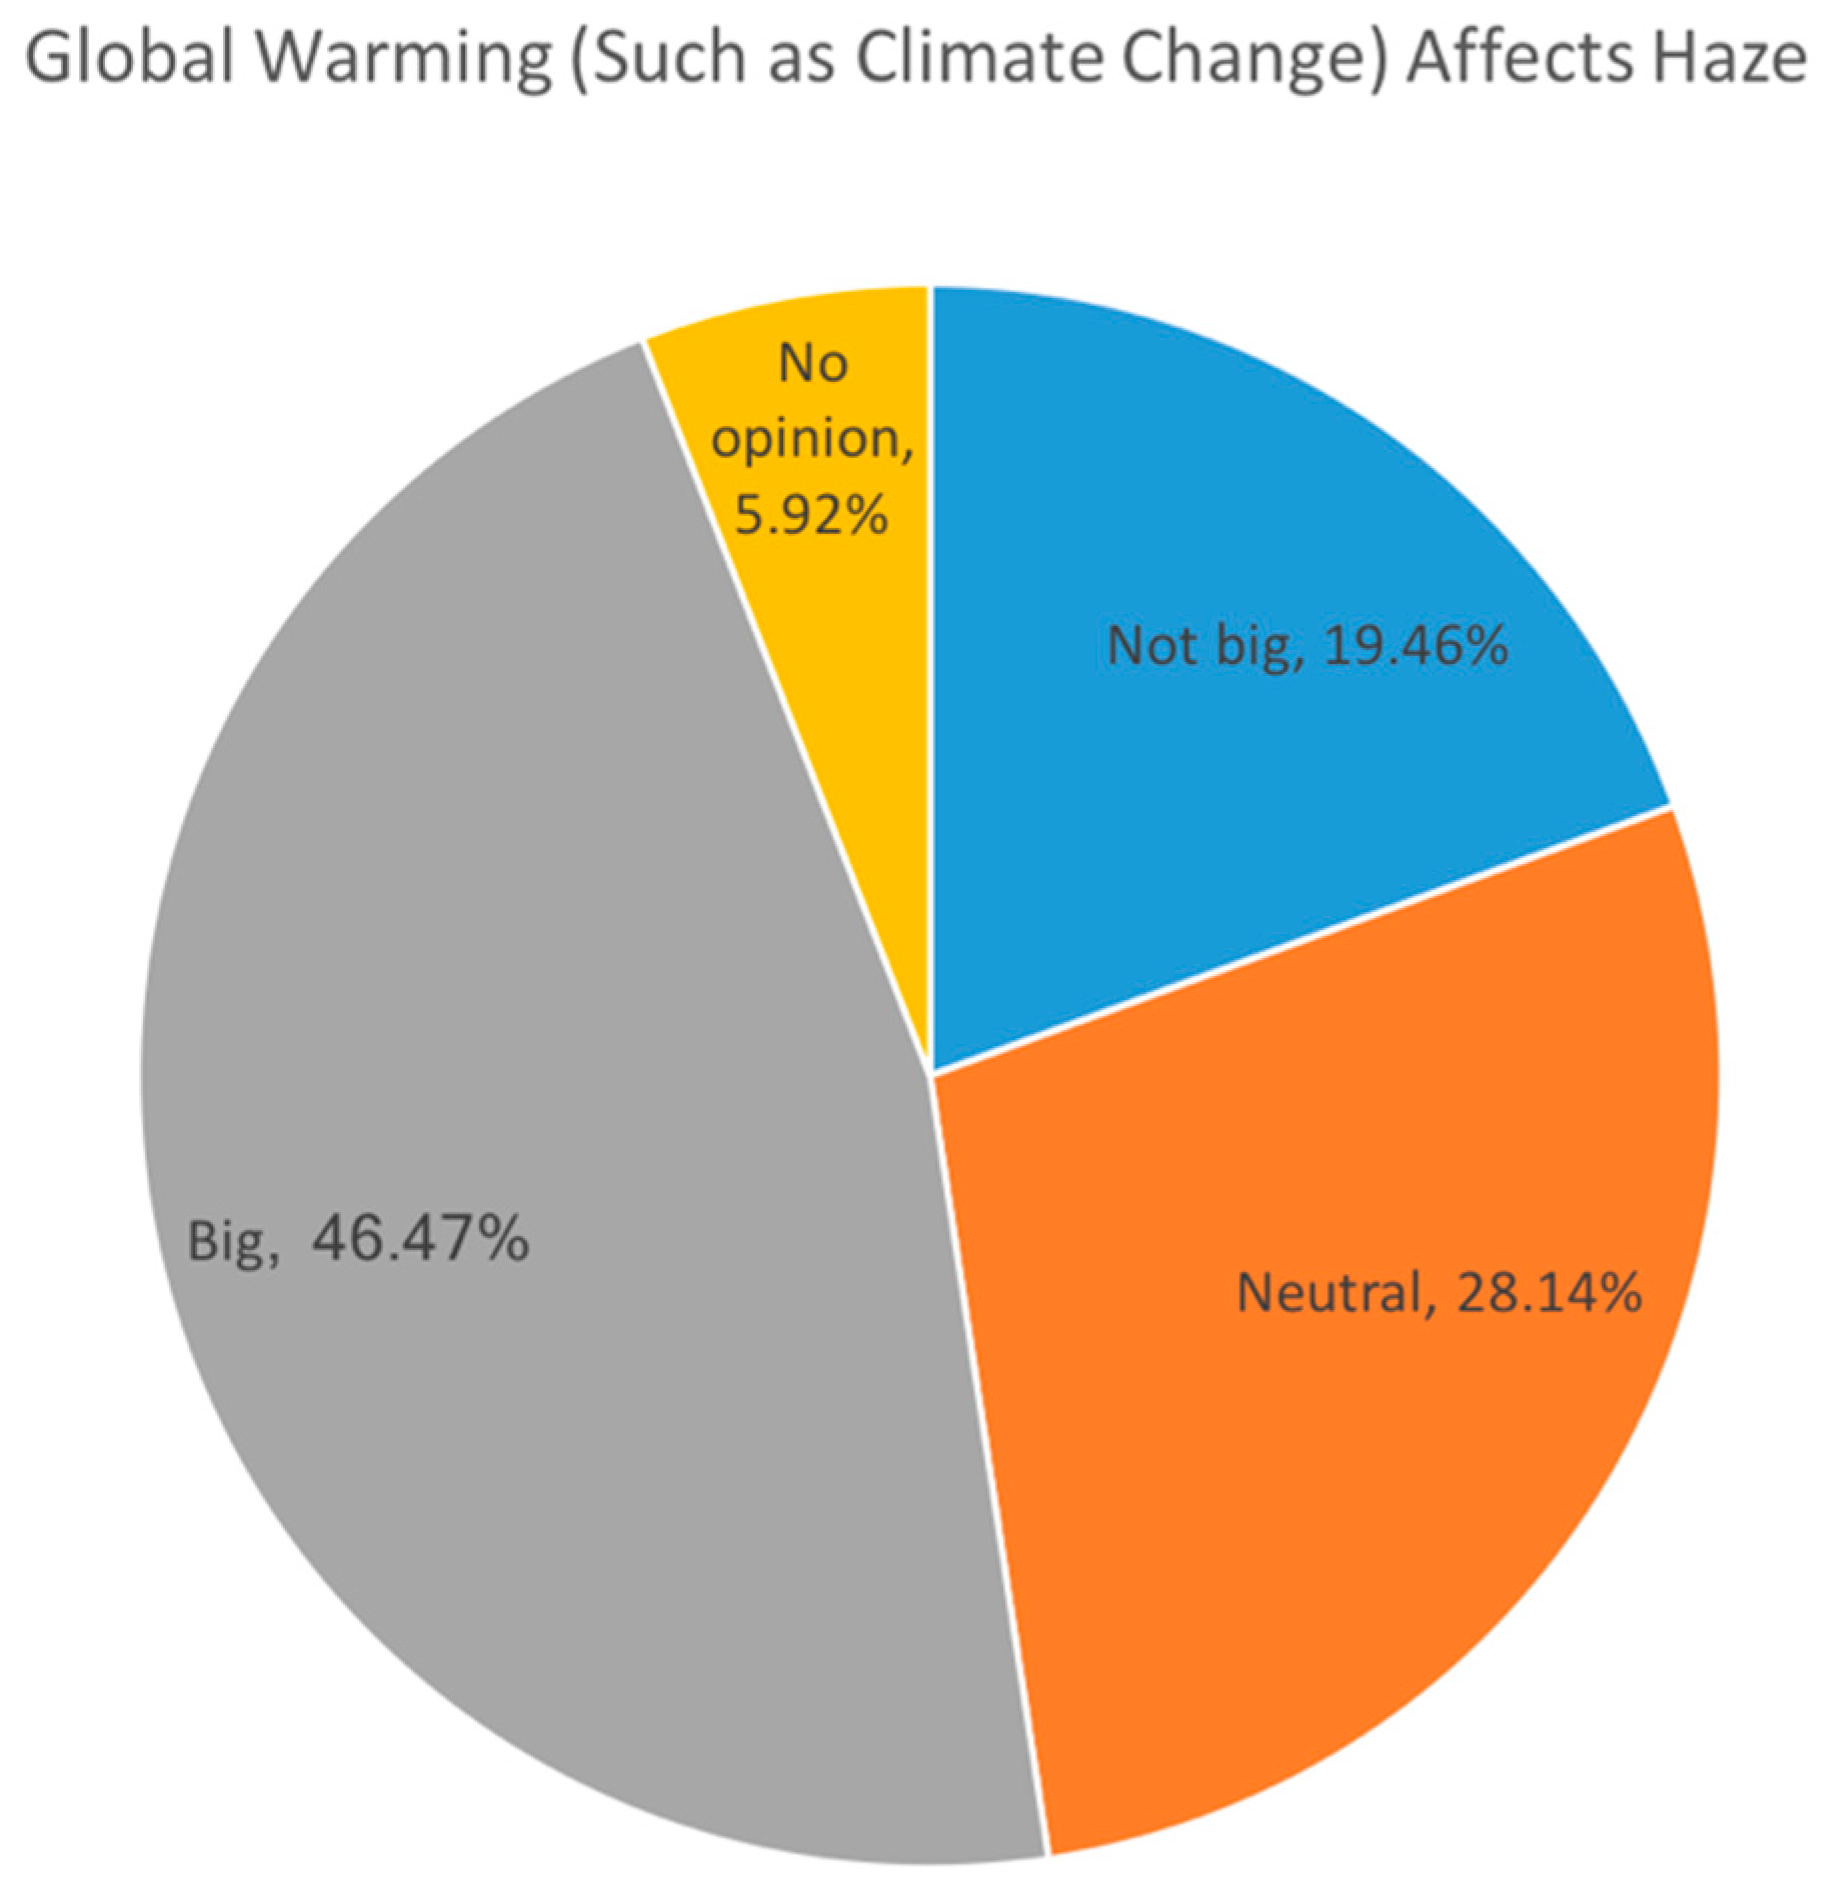
Sustainability 10 01970 g019
Figure 20. The result for Question 19 “Does the global warming affect the haze pollution?”: Almost half the people (46.47%) thought that climate change affected haze.
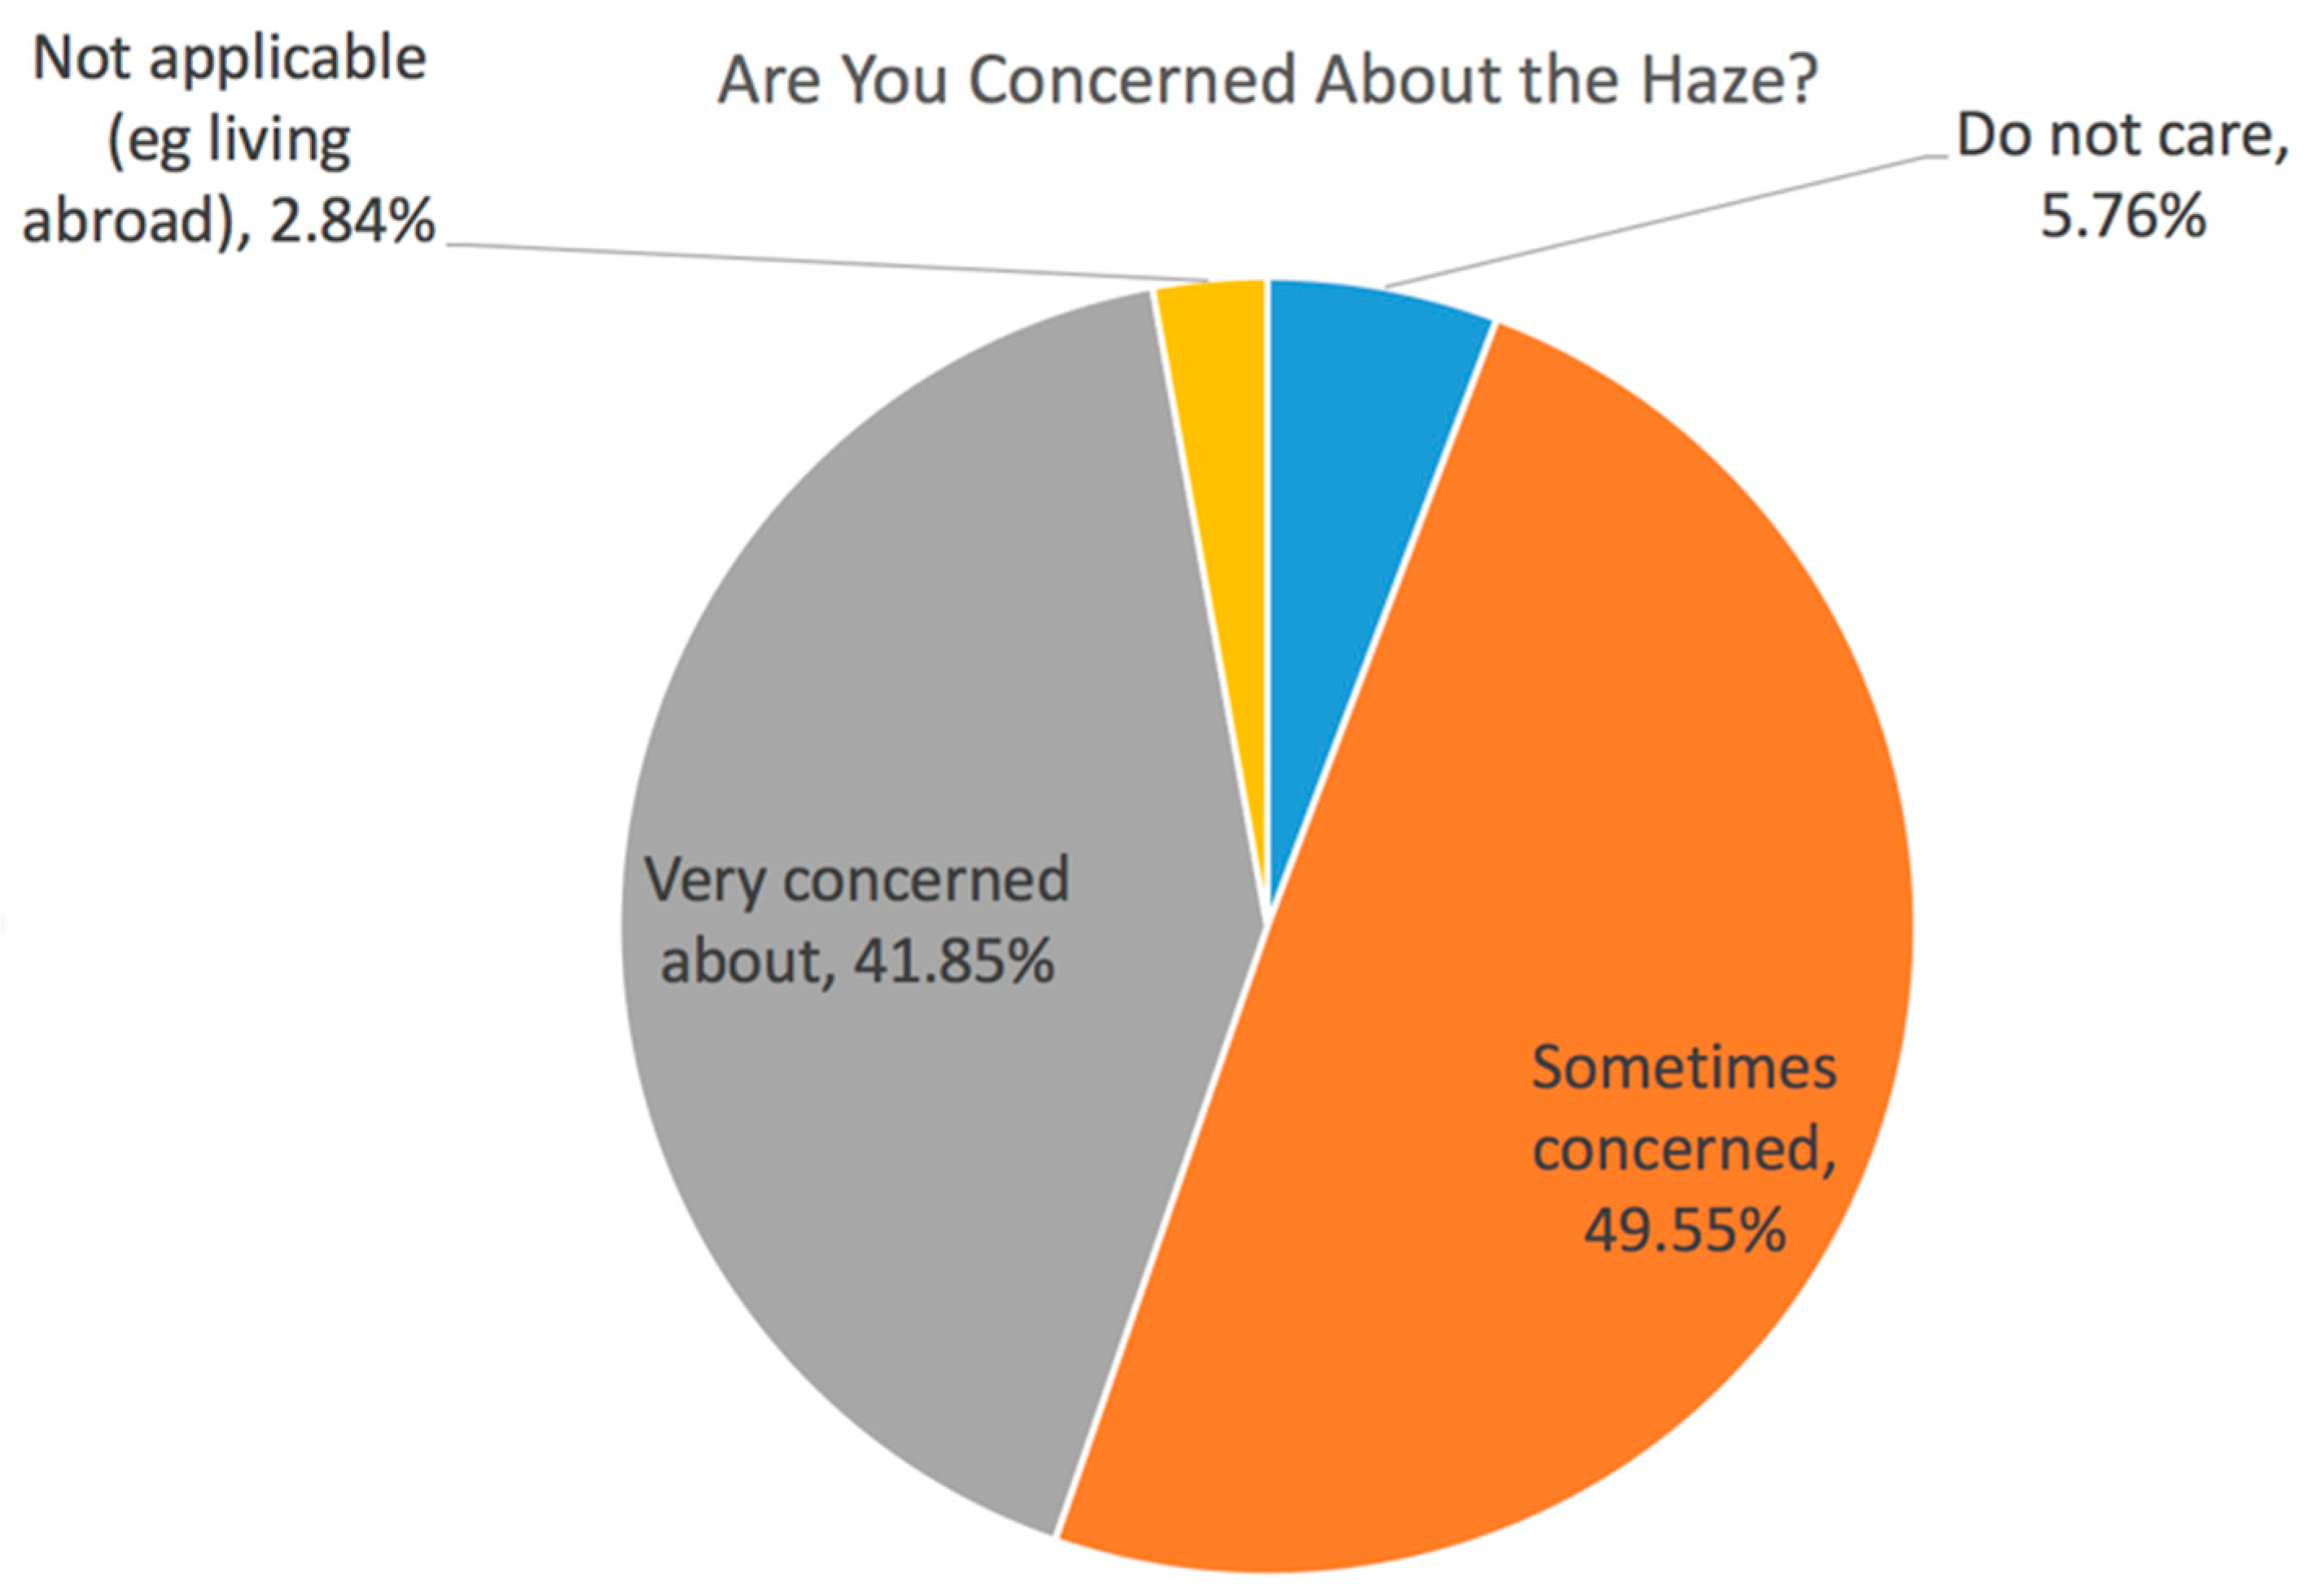
Sustainability 10 01970 g020
Figure 21. The result for Question 20 “Are you concerned about the haze pollution (e.g., check daily PM2.5)?”: 91.40% of the Chinese people were sometimes or very concerned about the haze and checked daily PM2.5 value.
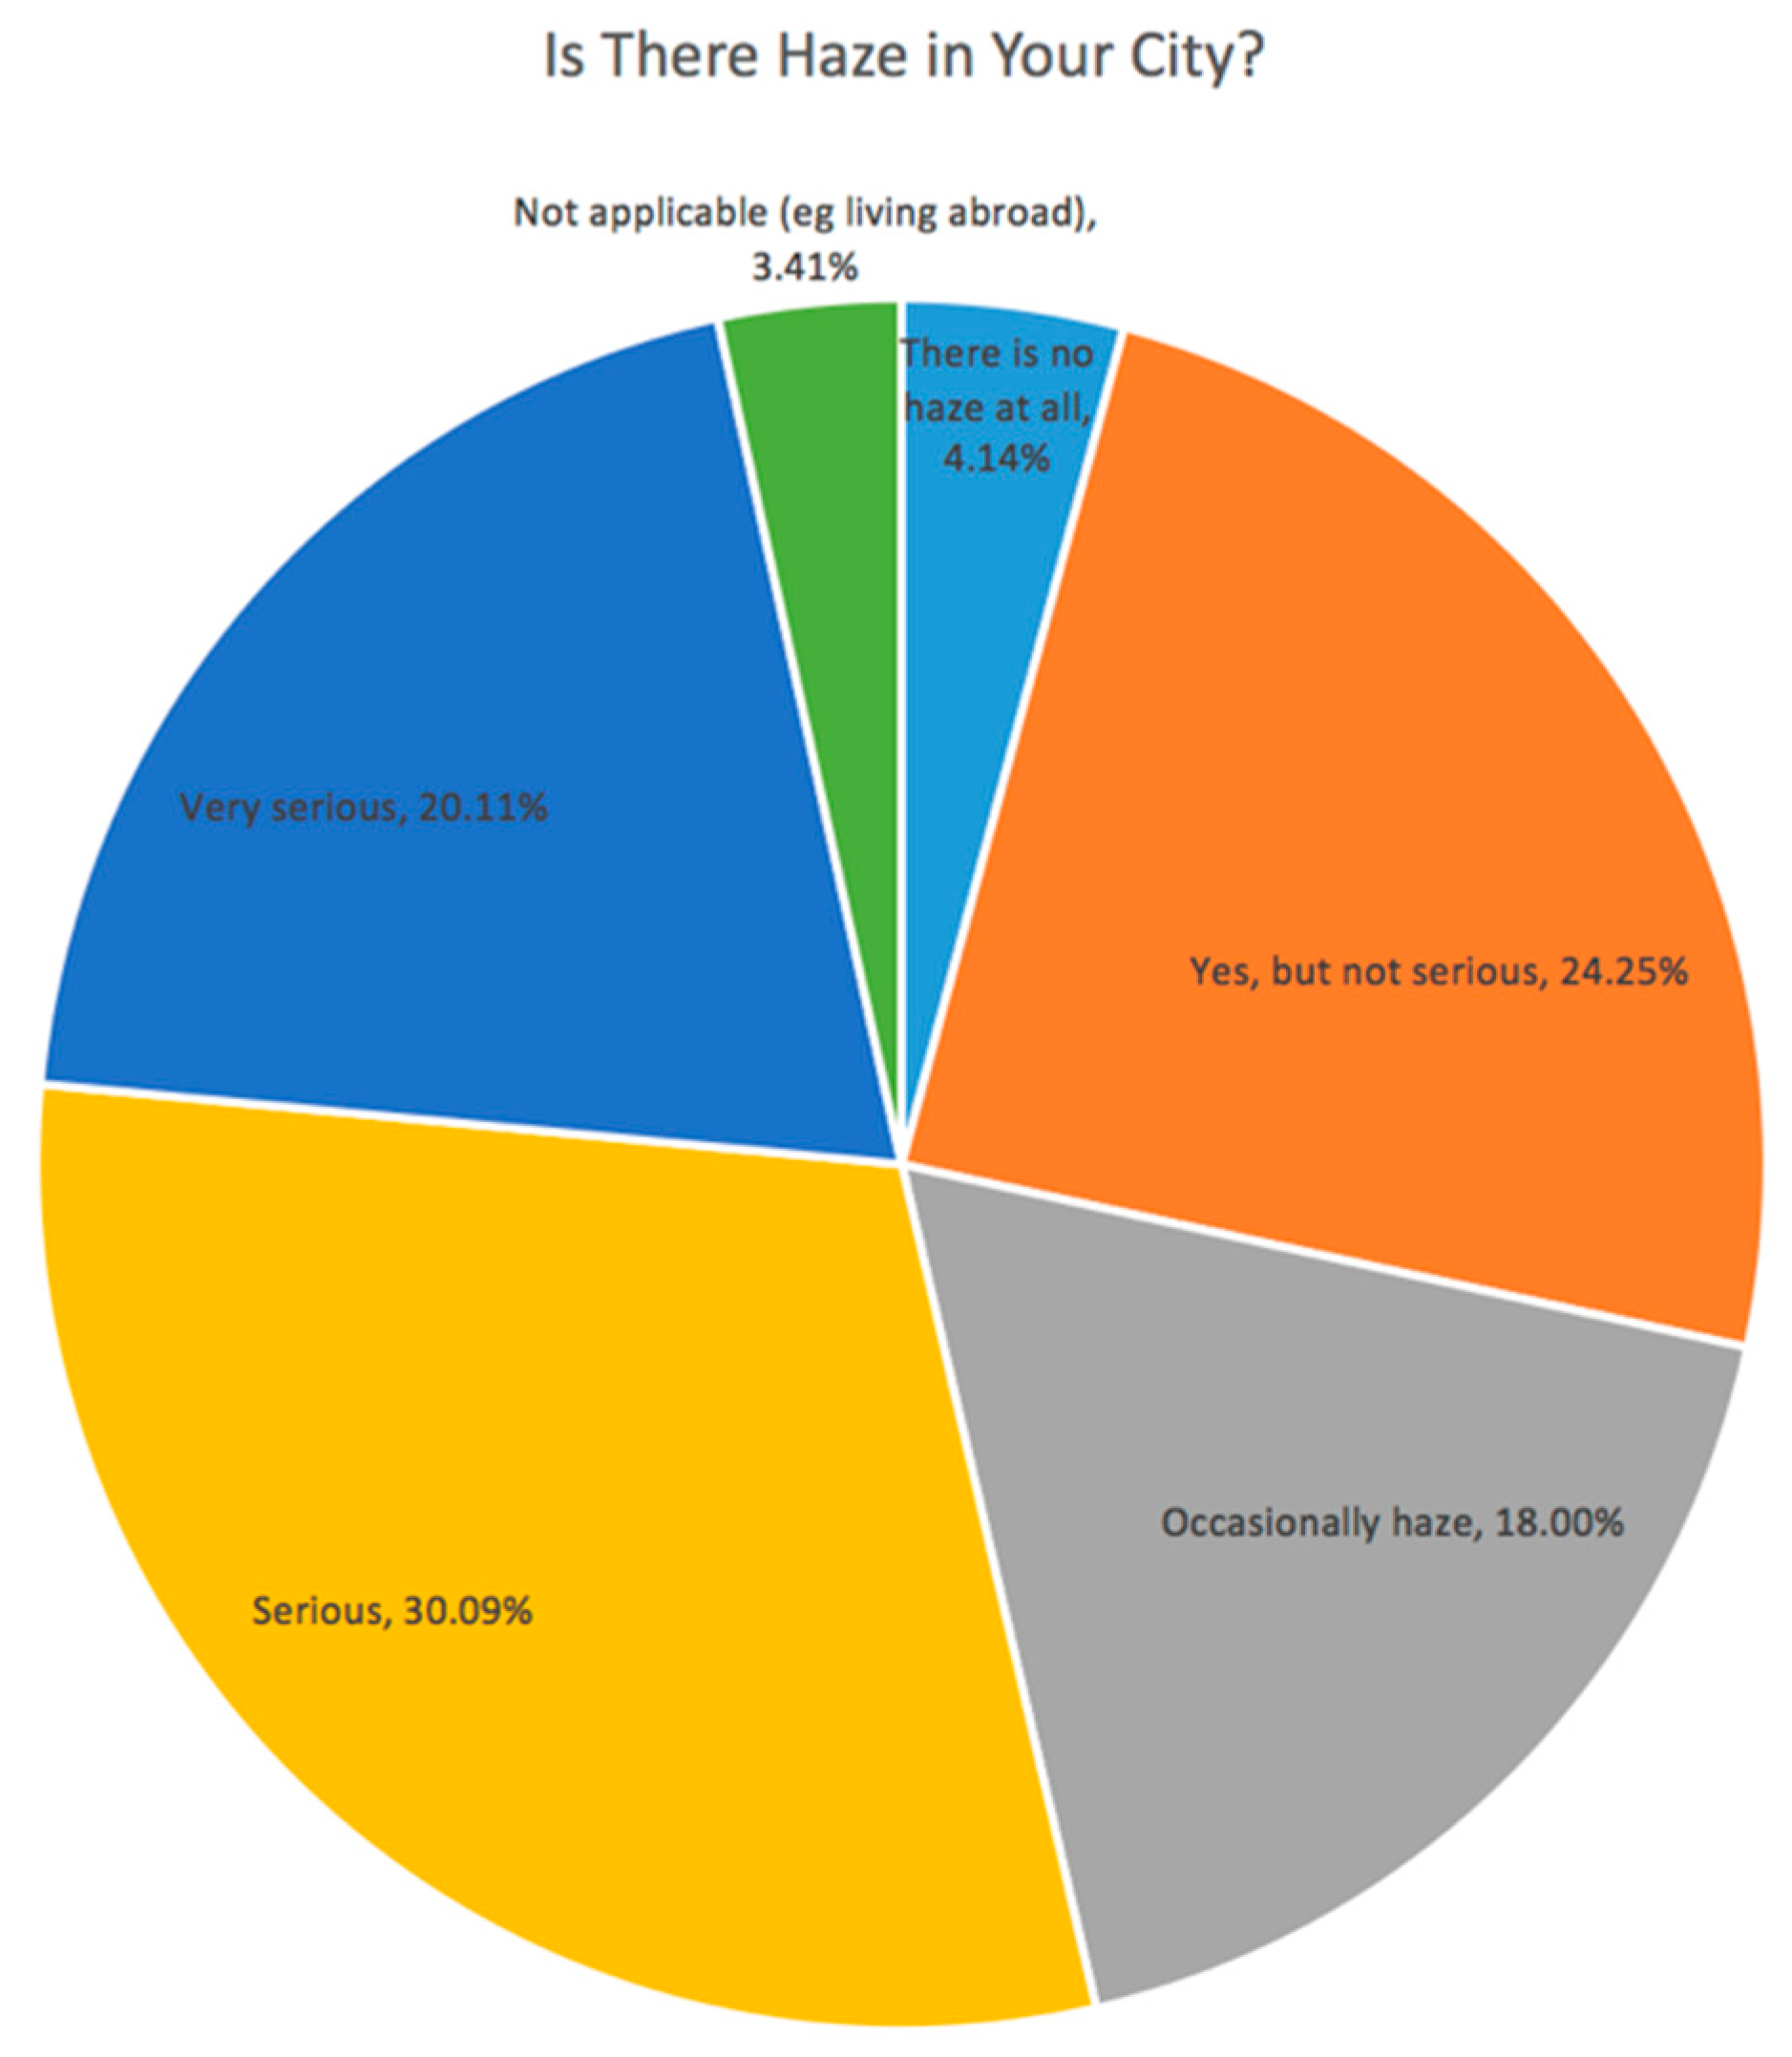
Sustainability 10 01970 g021
Figure 22. The result for Question 21 “Is there haze in the city you live in?”: Only 4.14% said that there was no haze in their city, while 50.20% had serious or very serious haze in their cities.
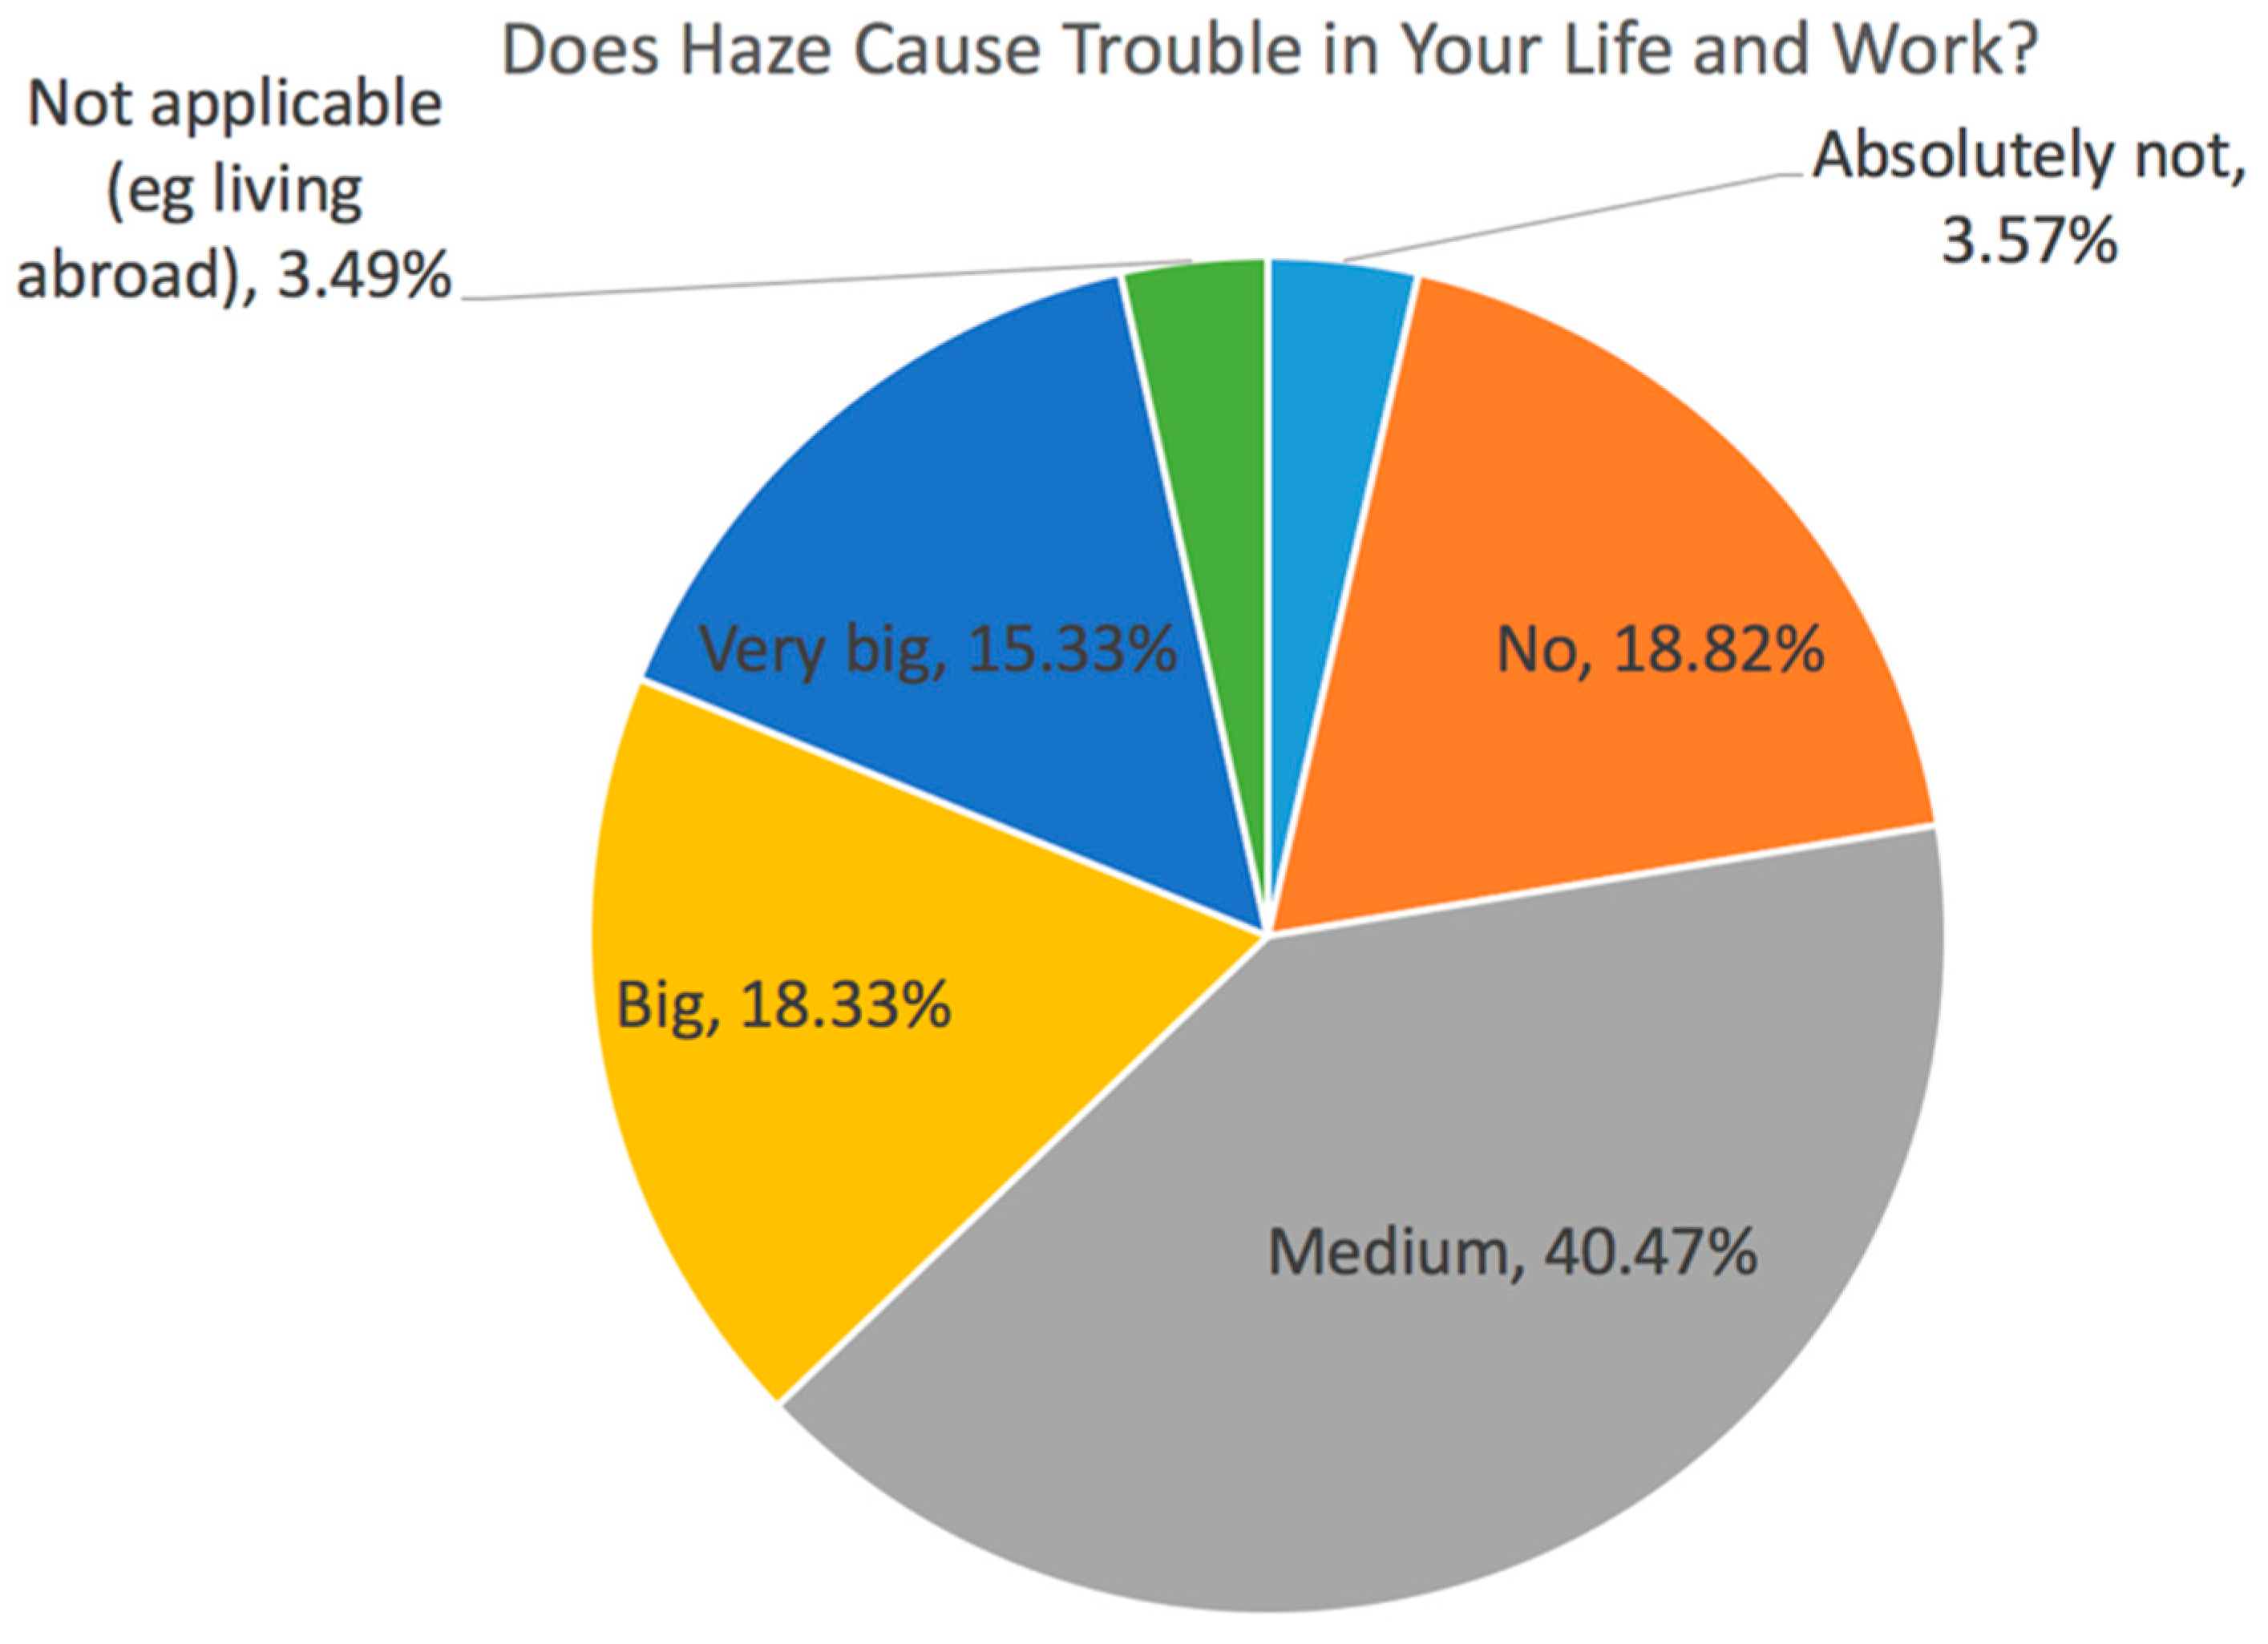
Sustainability 10 01970 g022
Figure 23. The result for Question 22 “Does haze cause trouble in your daily life or work?”: 74.13% of those surveyed were affected in life and at work.
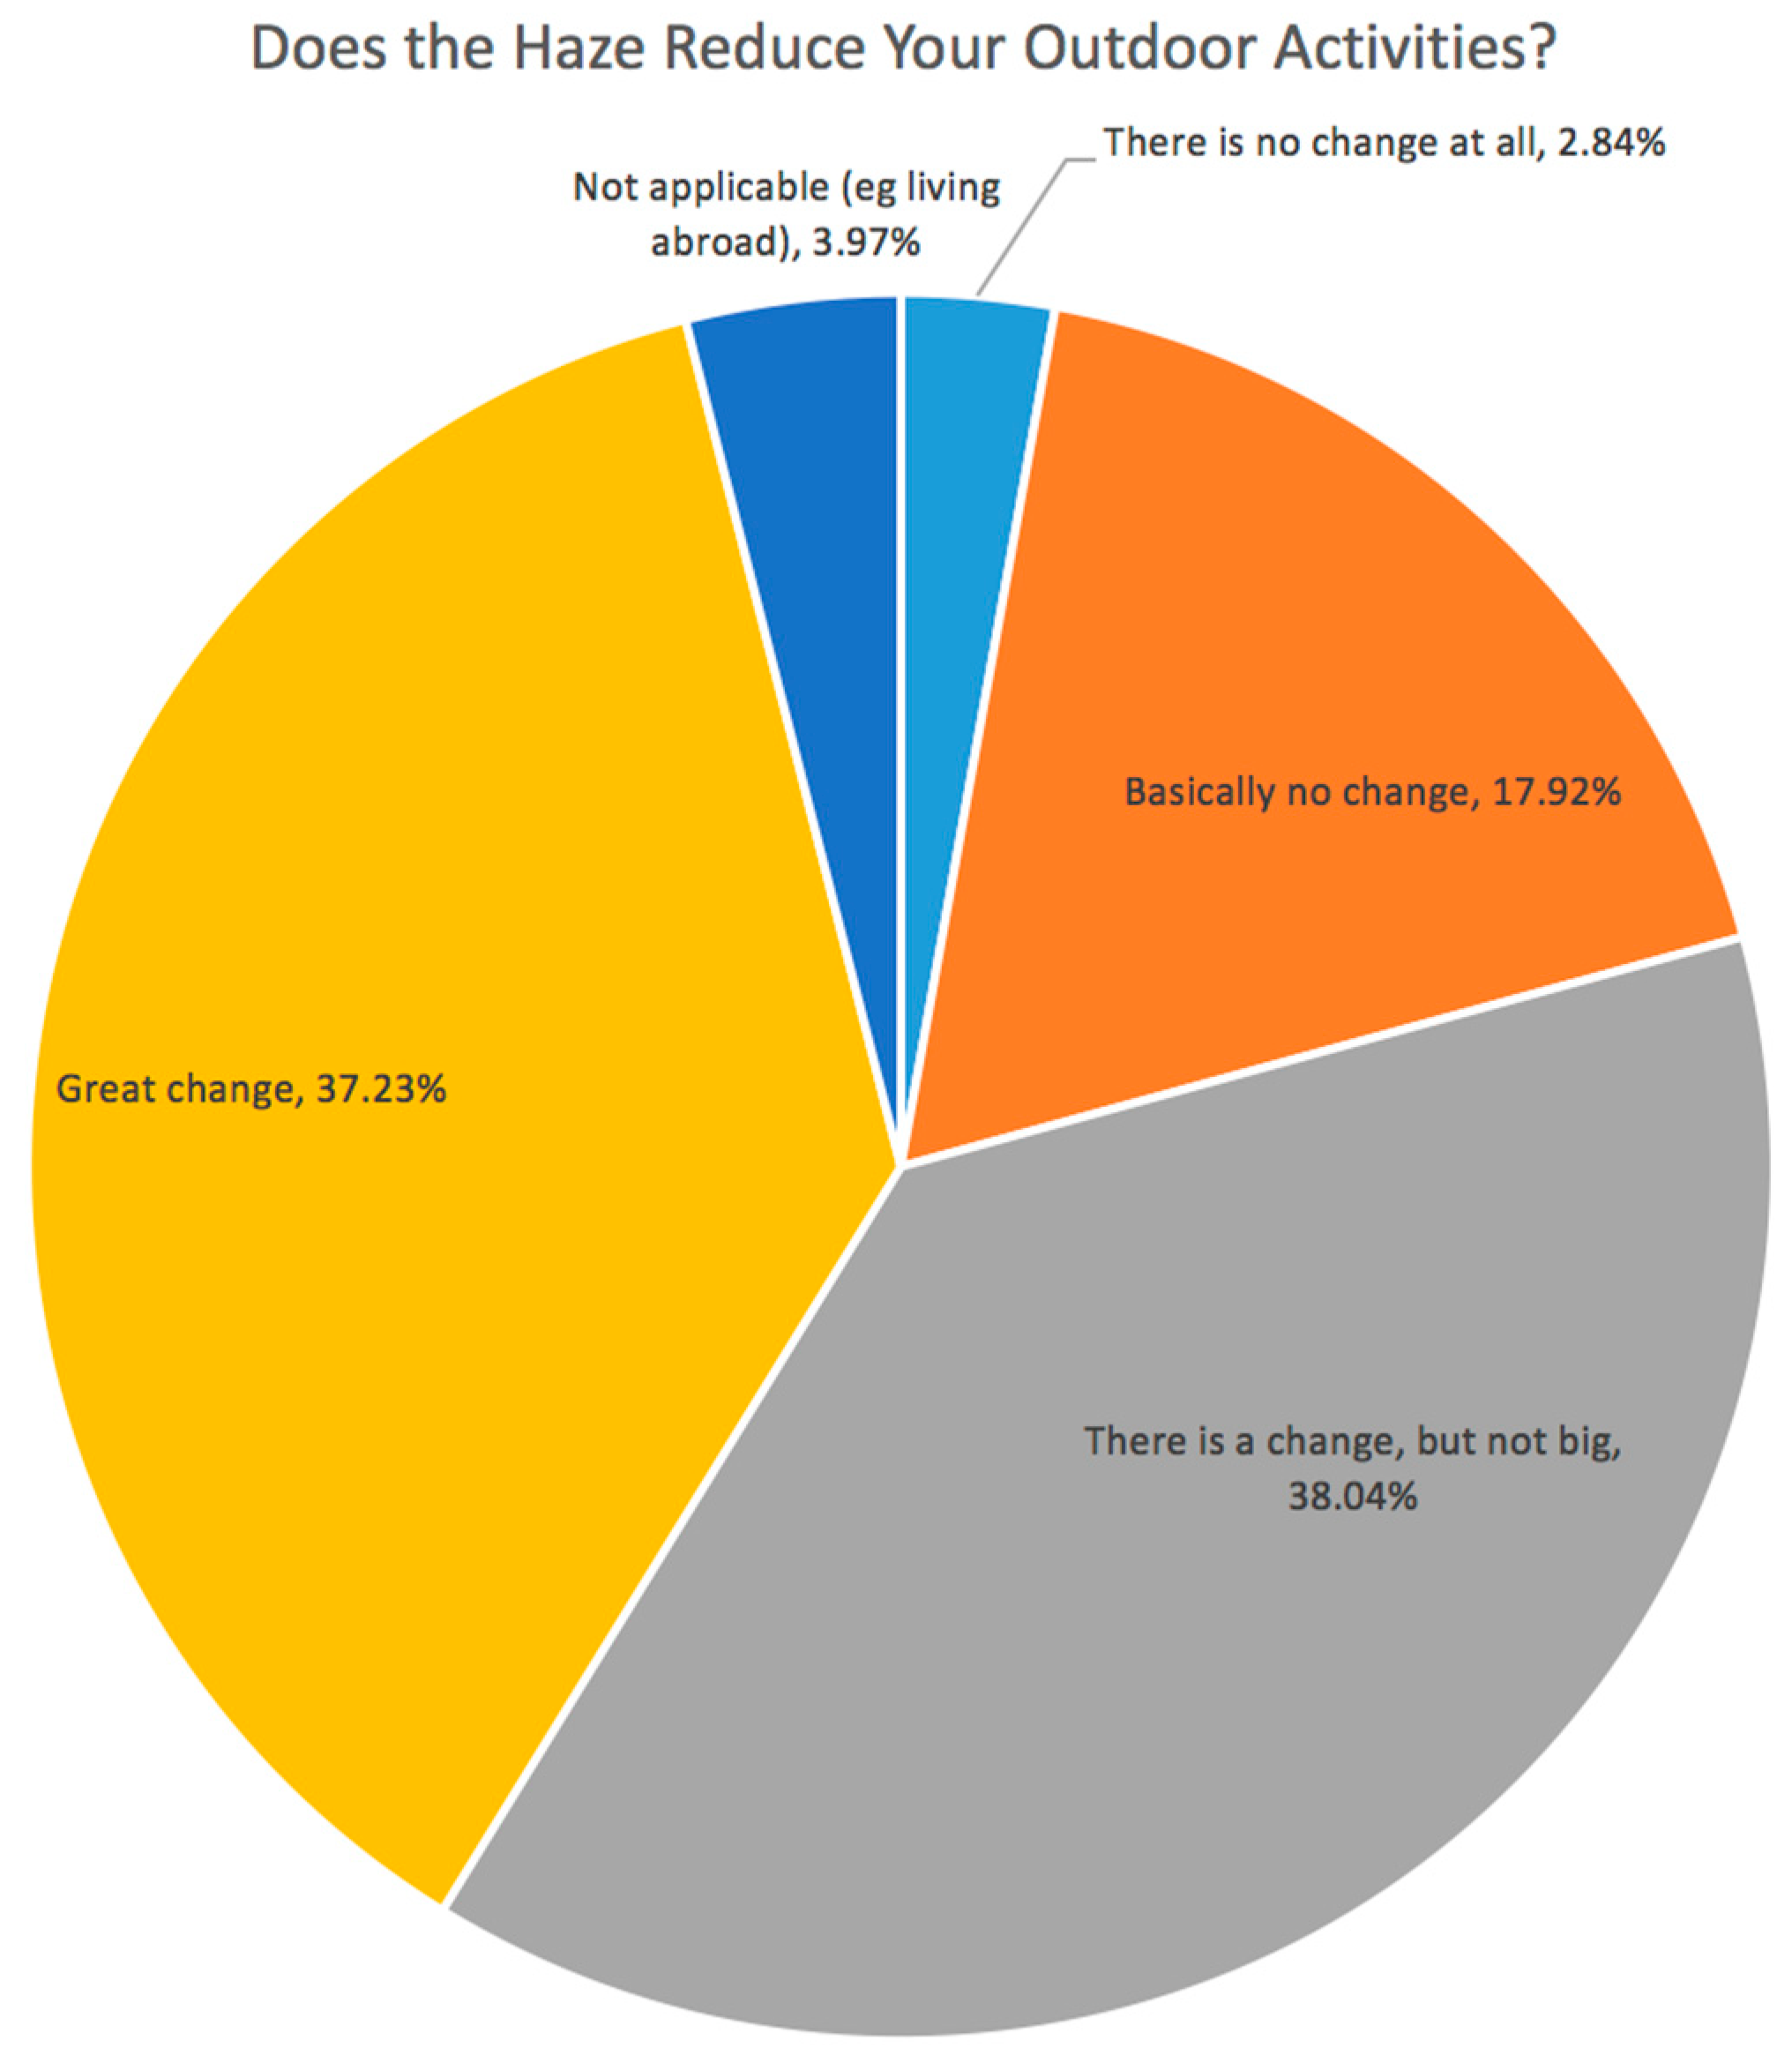
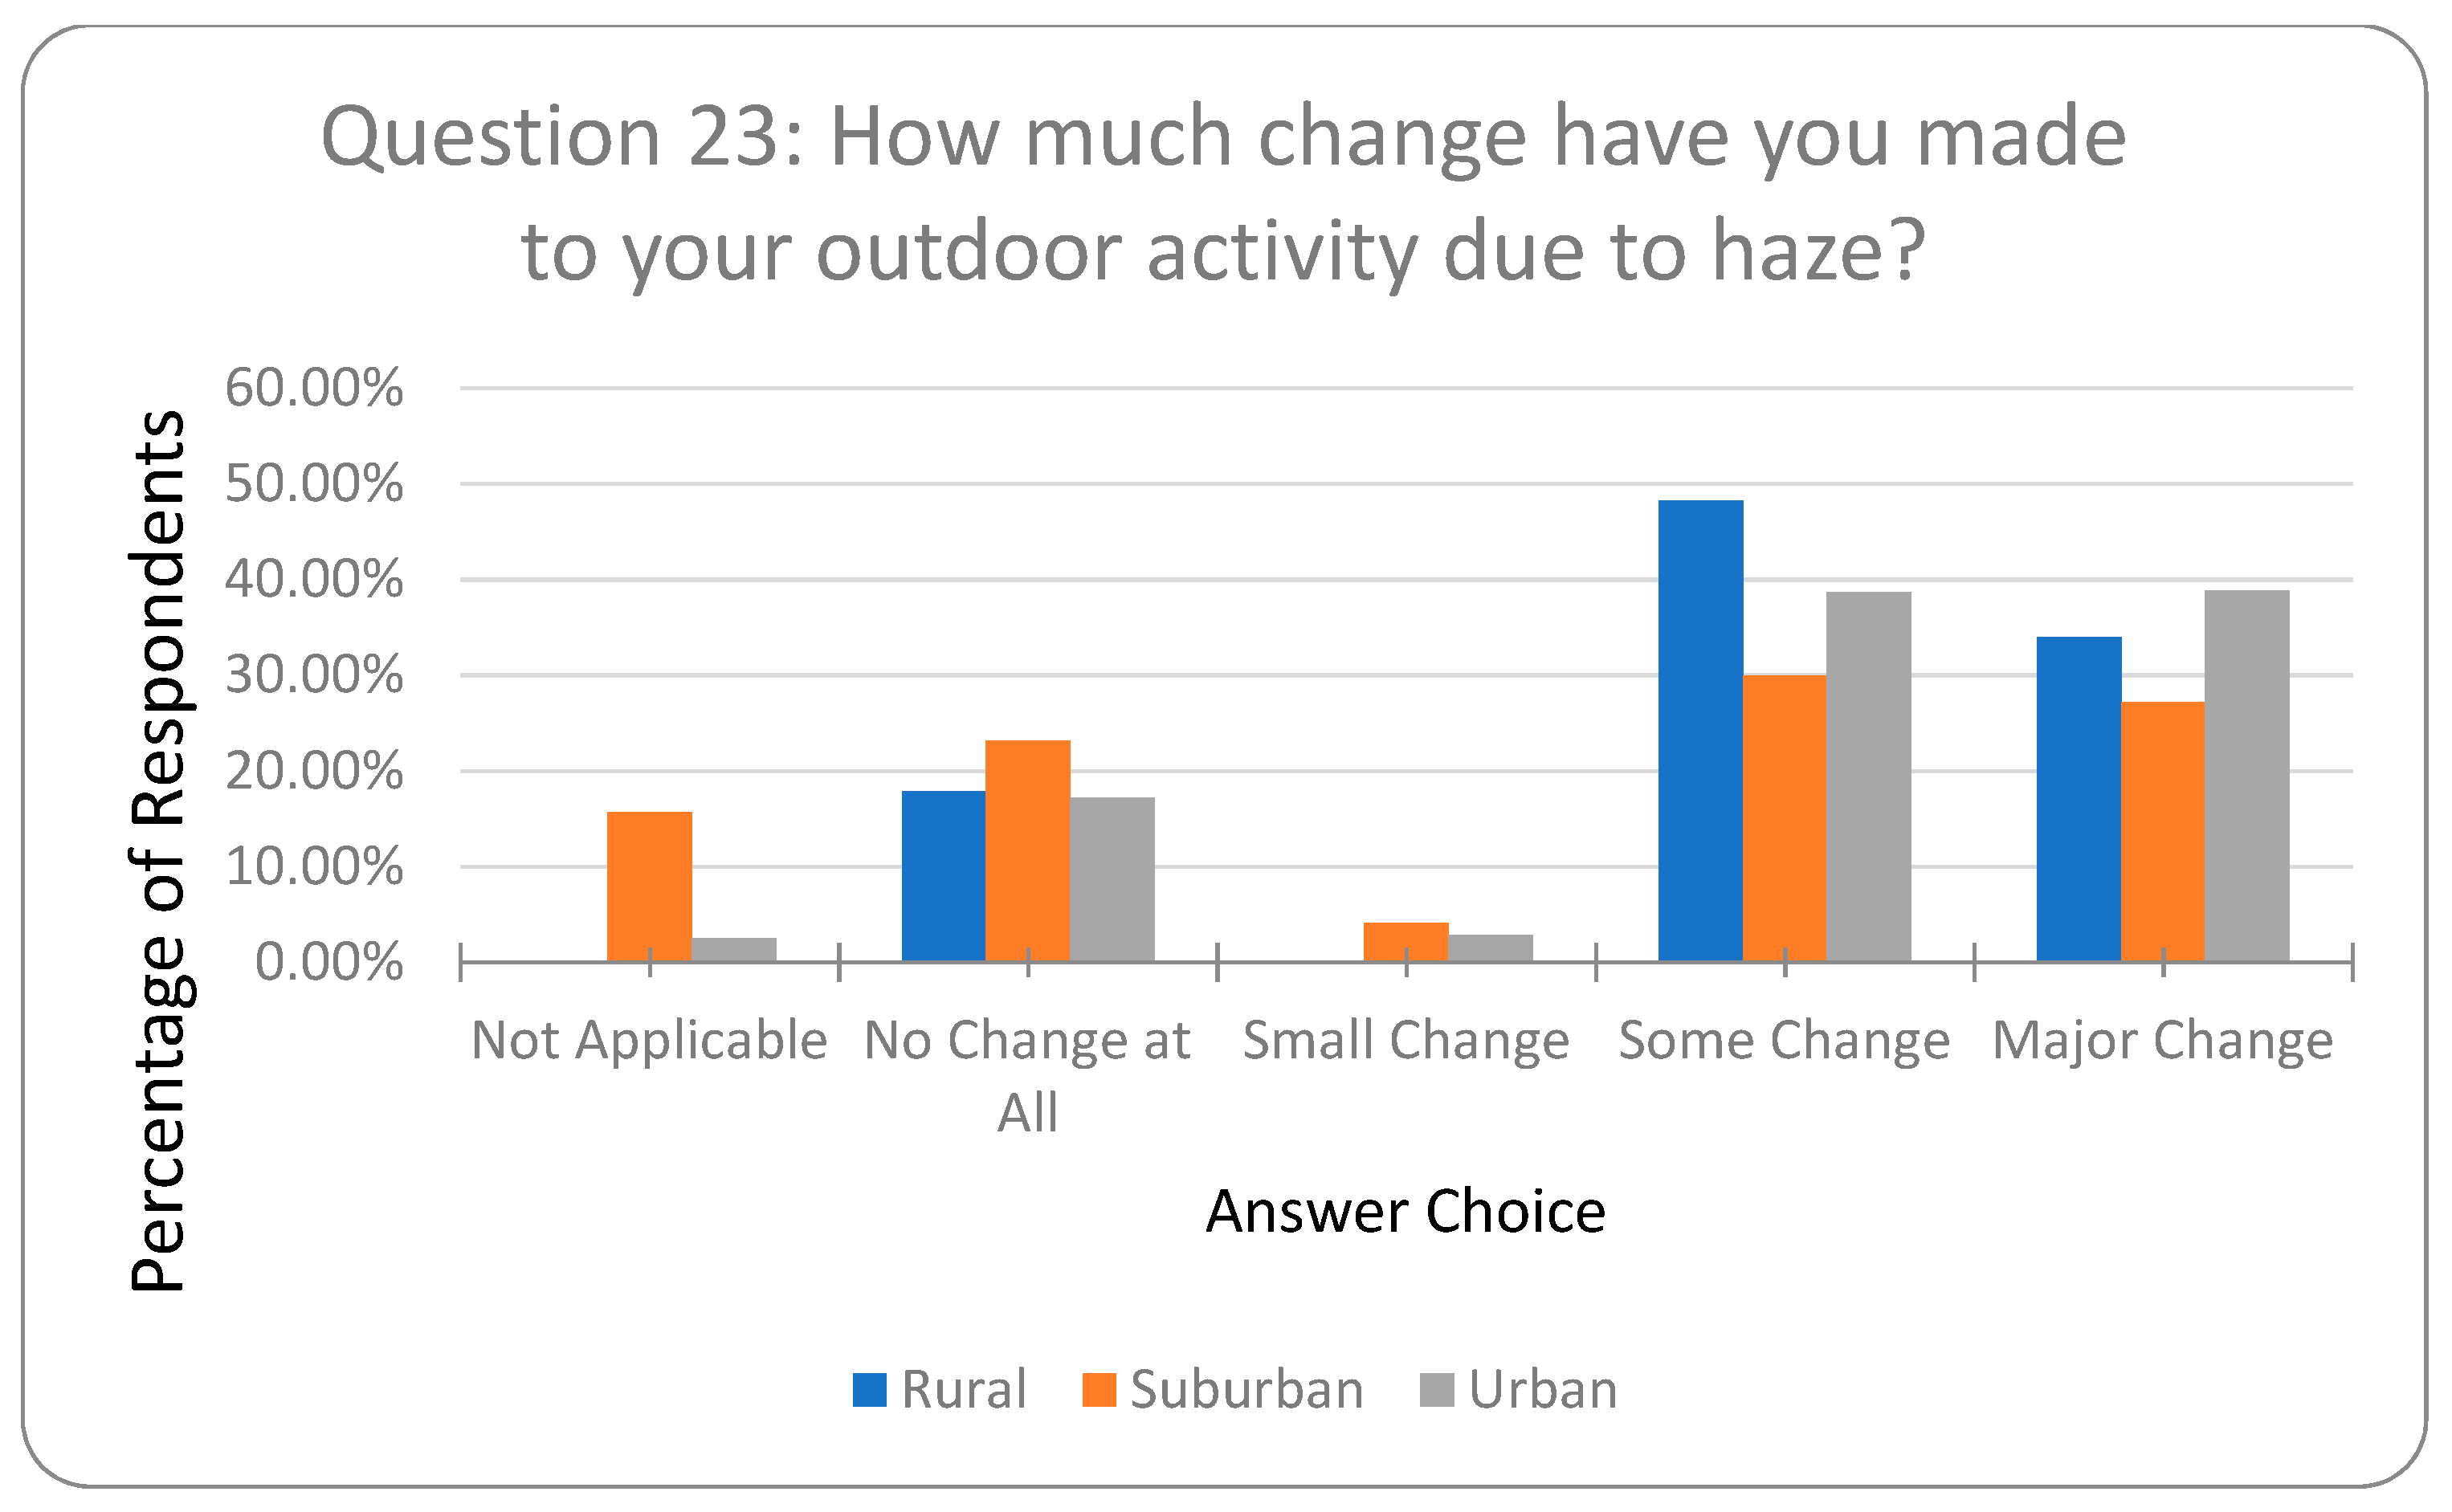
Sustainability 10 01970 g023
Figure 24. The result for Question 23 “Does haze change your outdoor activities?”: 75.27% reduced outdoor activity because of the haze.
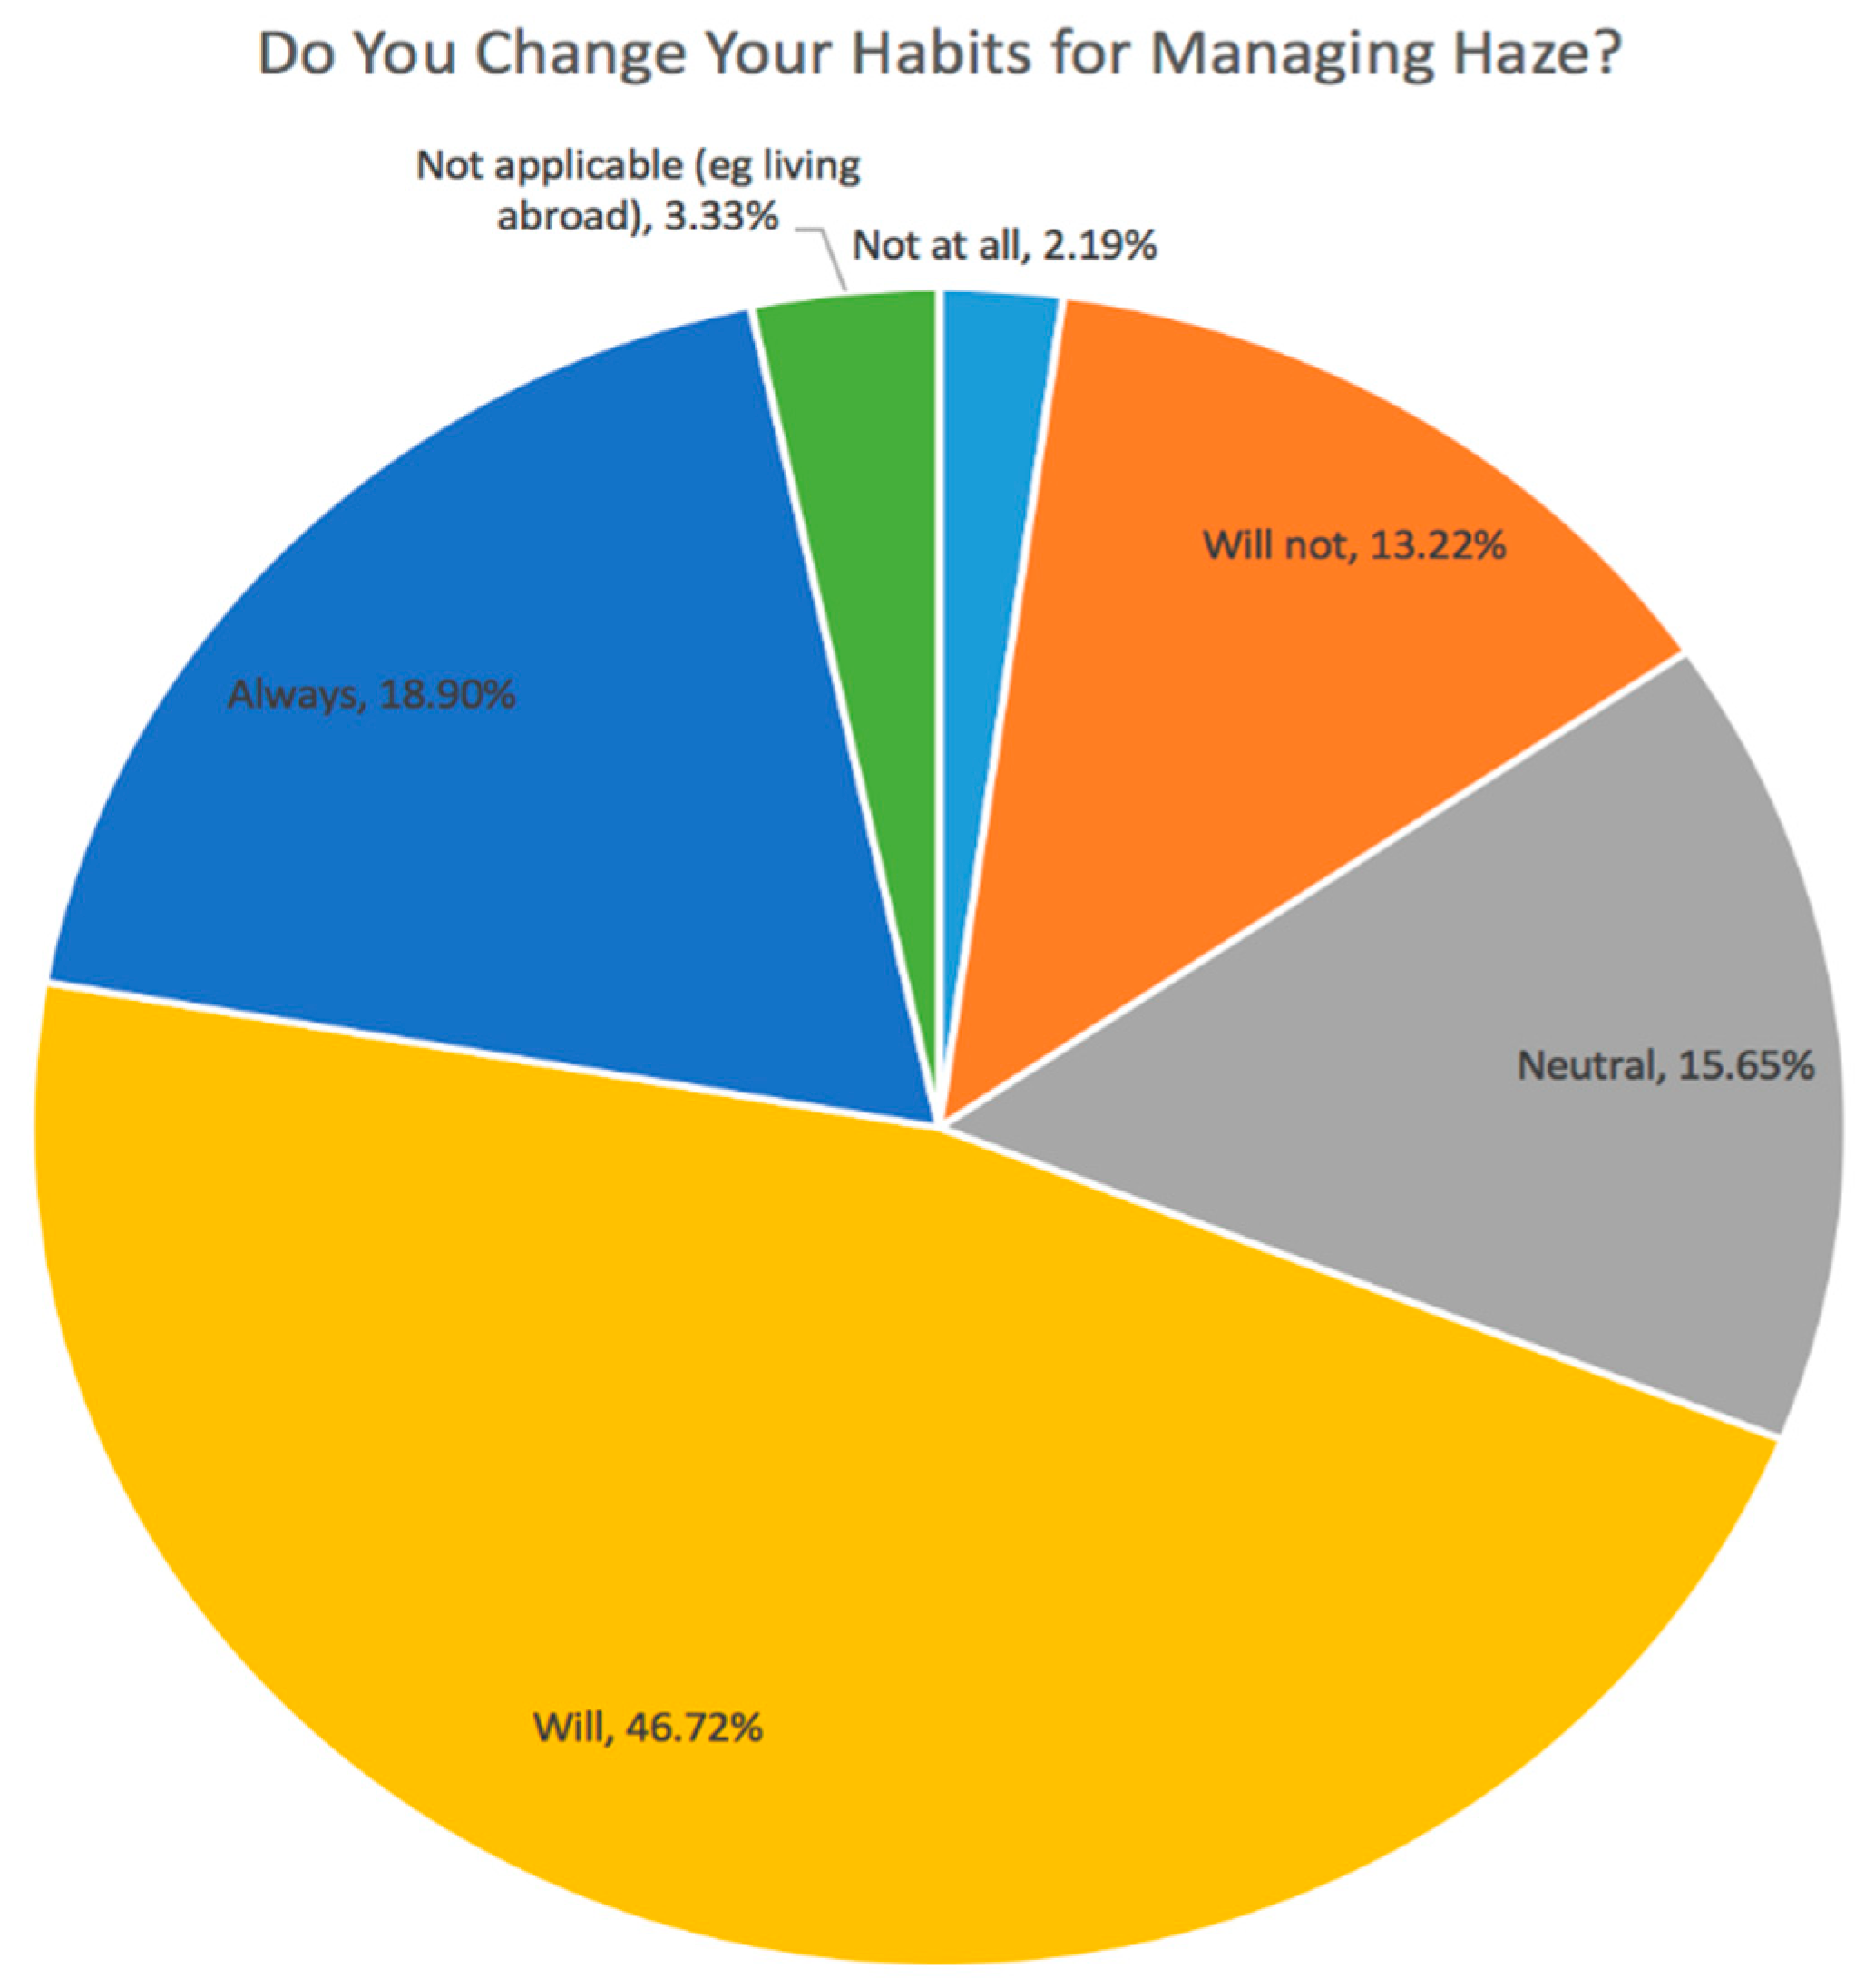
Sustainability 10 01970 g024
Figure 25. The result for Question 24 “Do you change your habits (e.g., taking buses instead of driving personal cars) due to the haze pollution?”: 65.62% changed their habits to adjust to the haze.
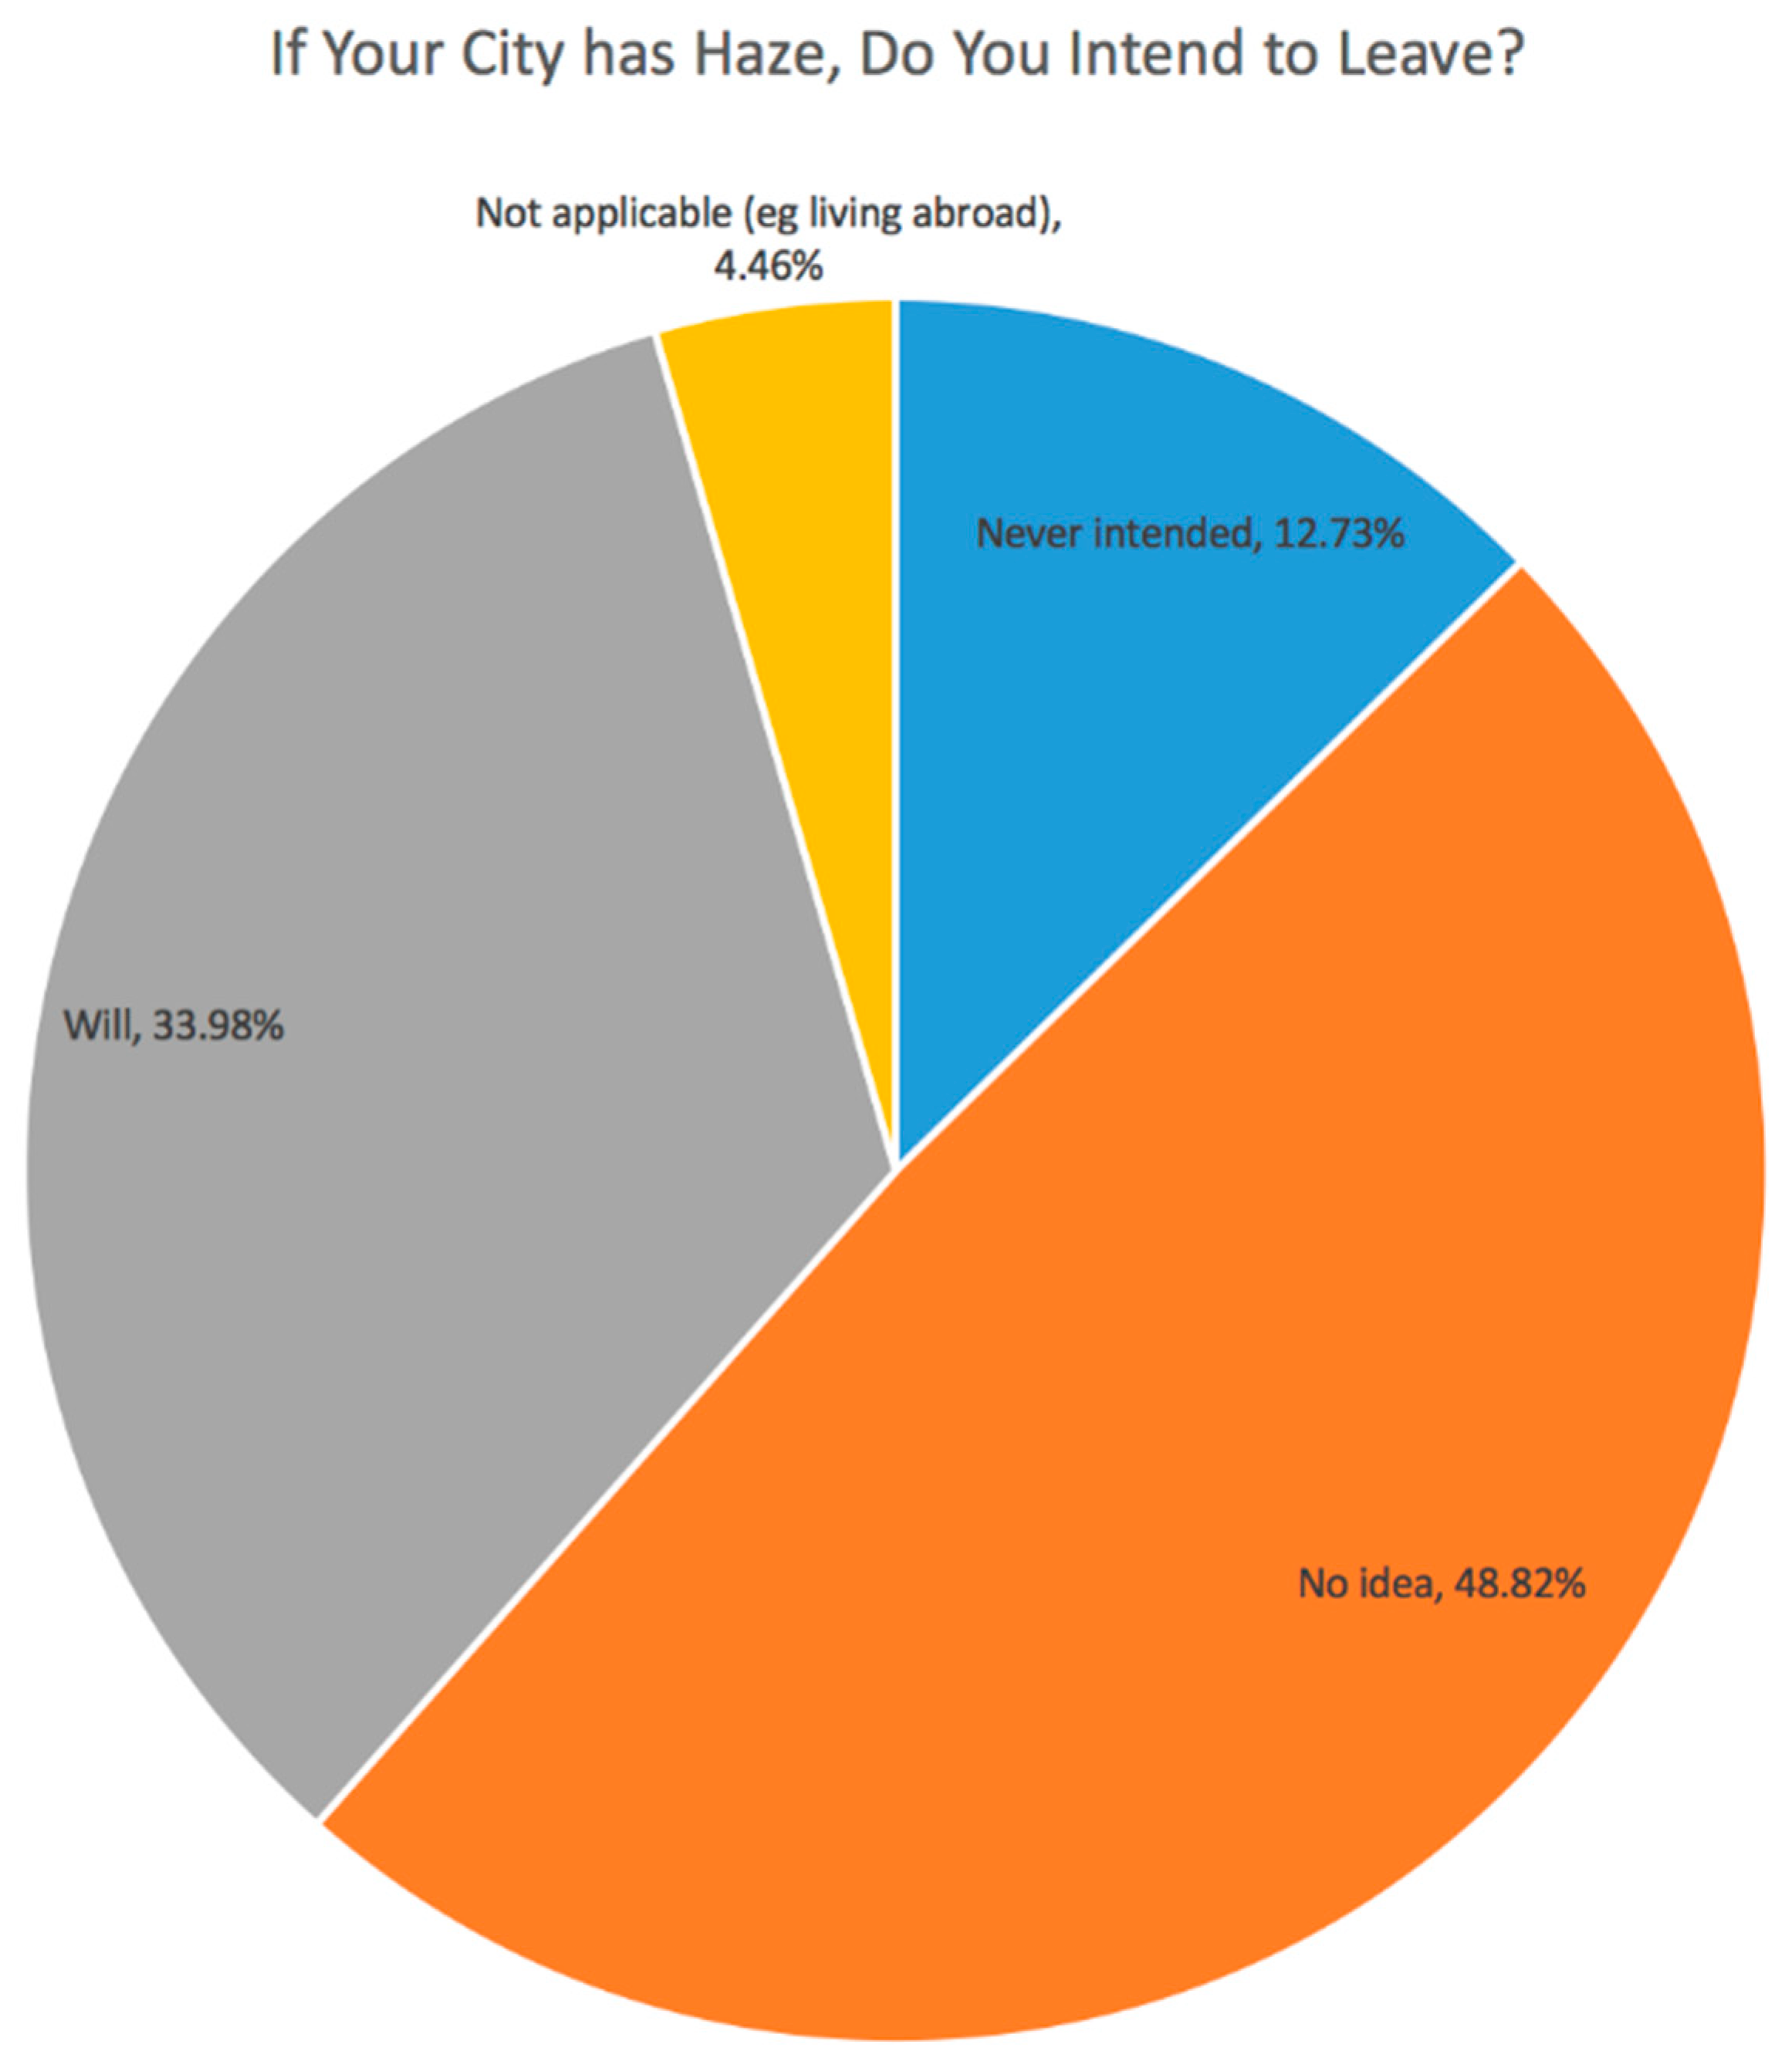
Sustainability 10 01970 g025
Figure 26. The result for Question 25 “Do you intend to leave if your city has haze?”: 48.82% of the people did not know if they would leave their city because of the haze, but 33.98% of them planned to leave.
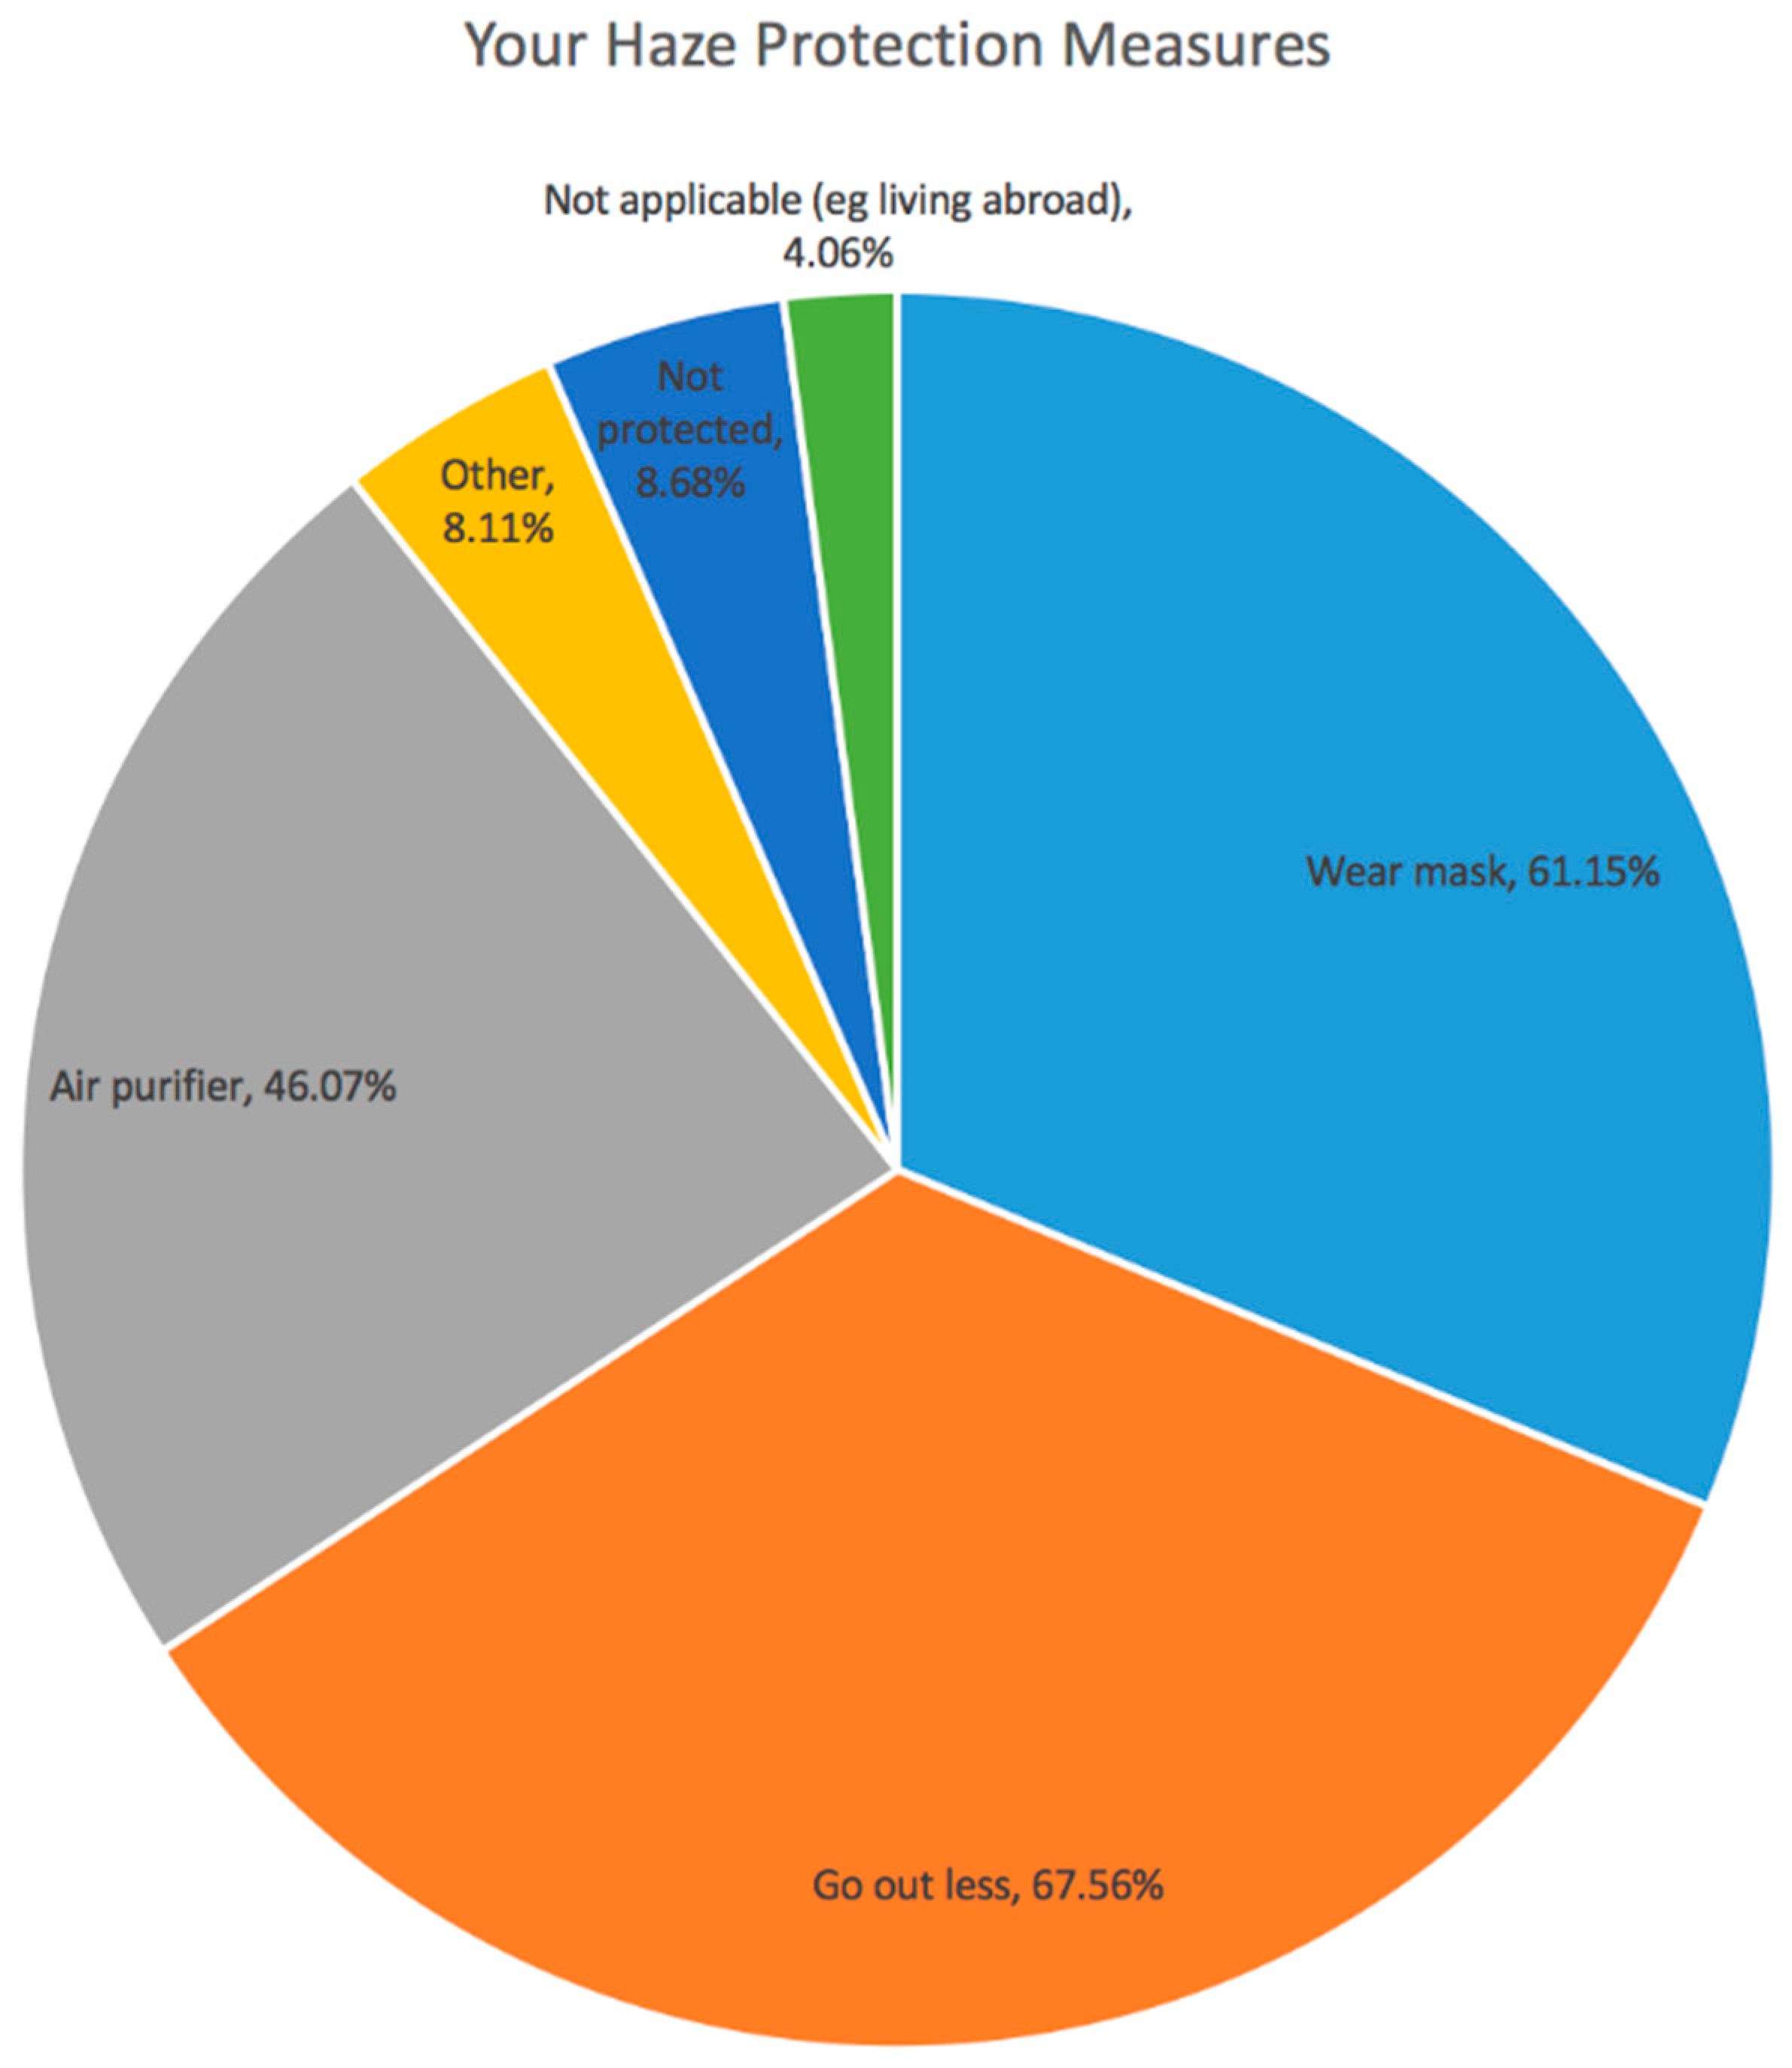
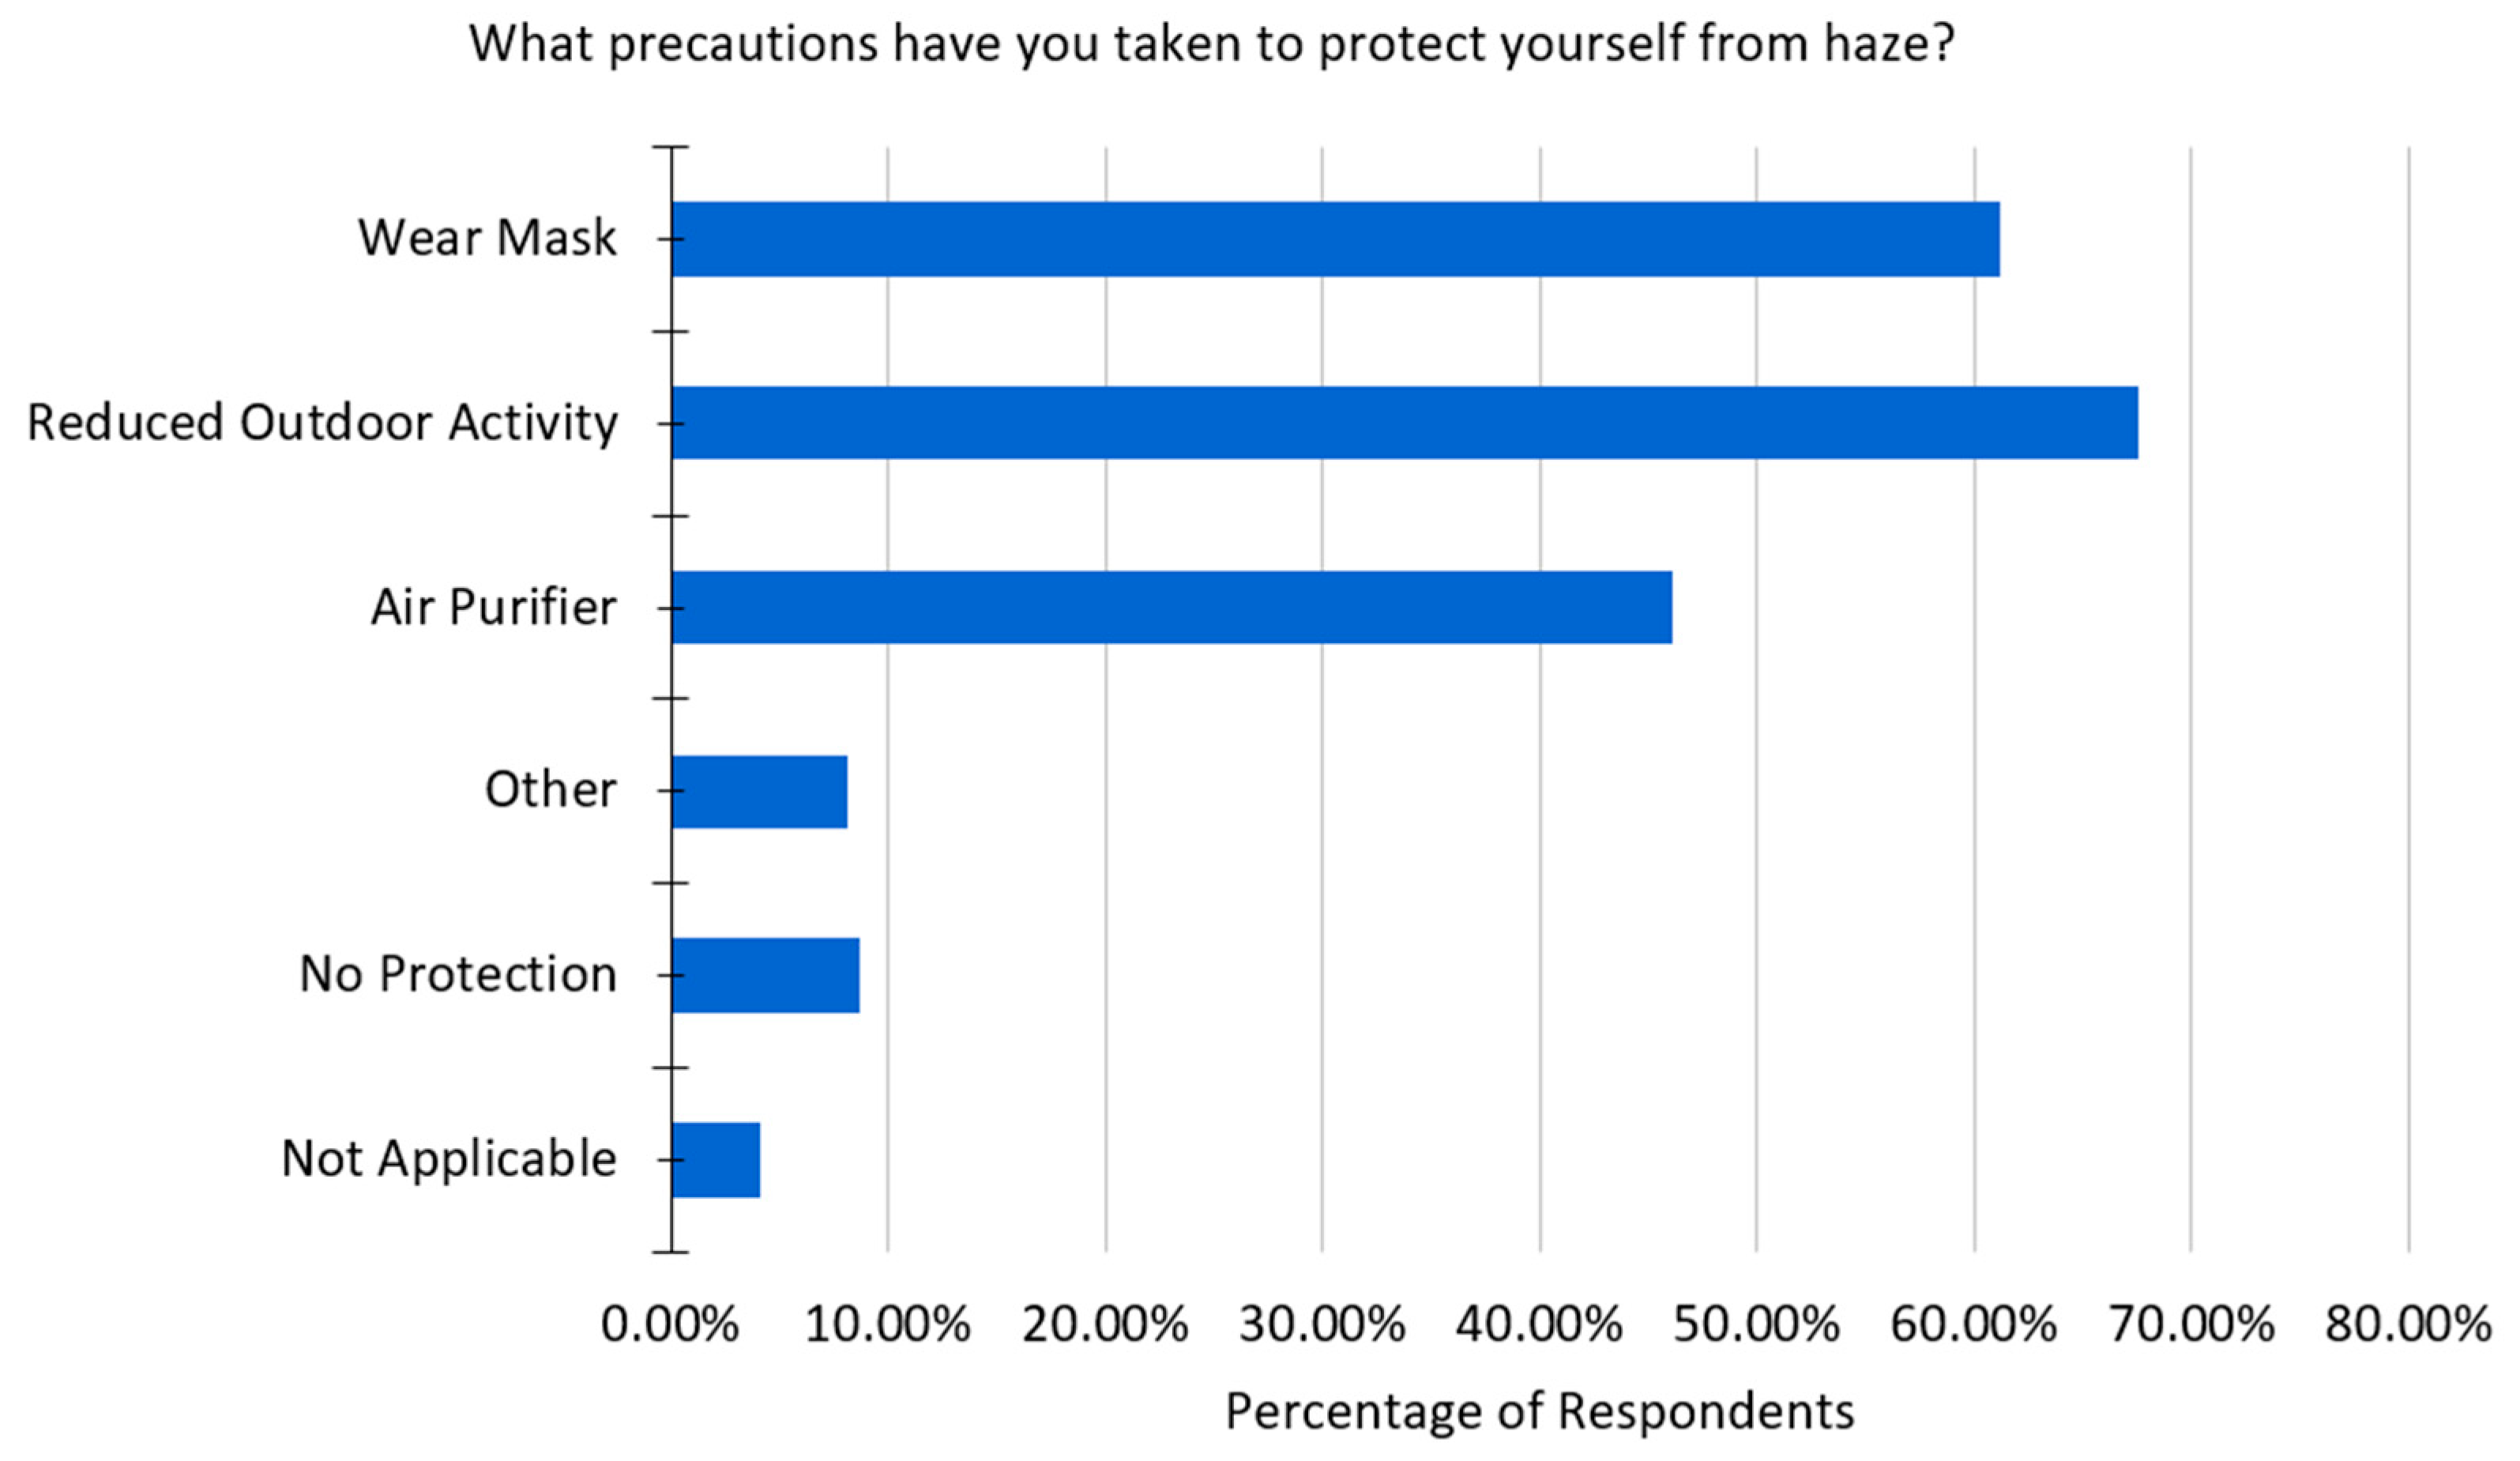
Sustainability 10 01970 g026
Figure 27. The result for Question 26 “Which approaches did you use to protect yourself (multiple options can be chosen)?”: Many people said they used an air purifier (46.07%), went out less (67.56%), and wore masks (61.15%) to protect themselves from haze.
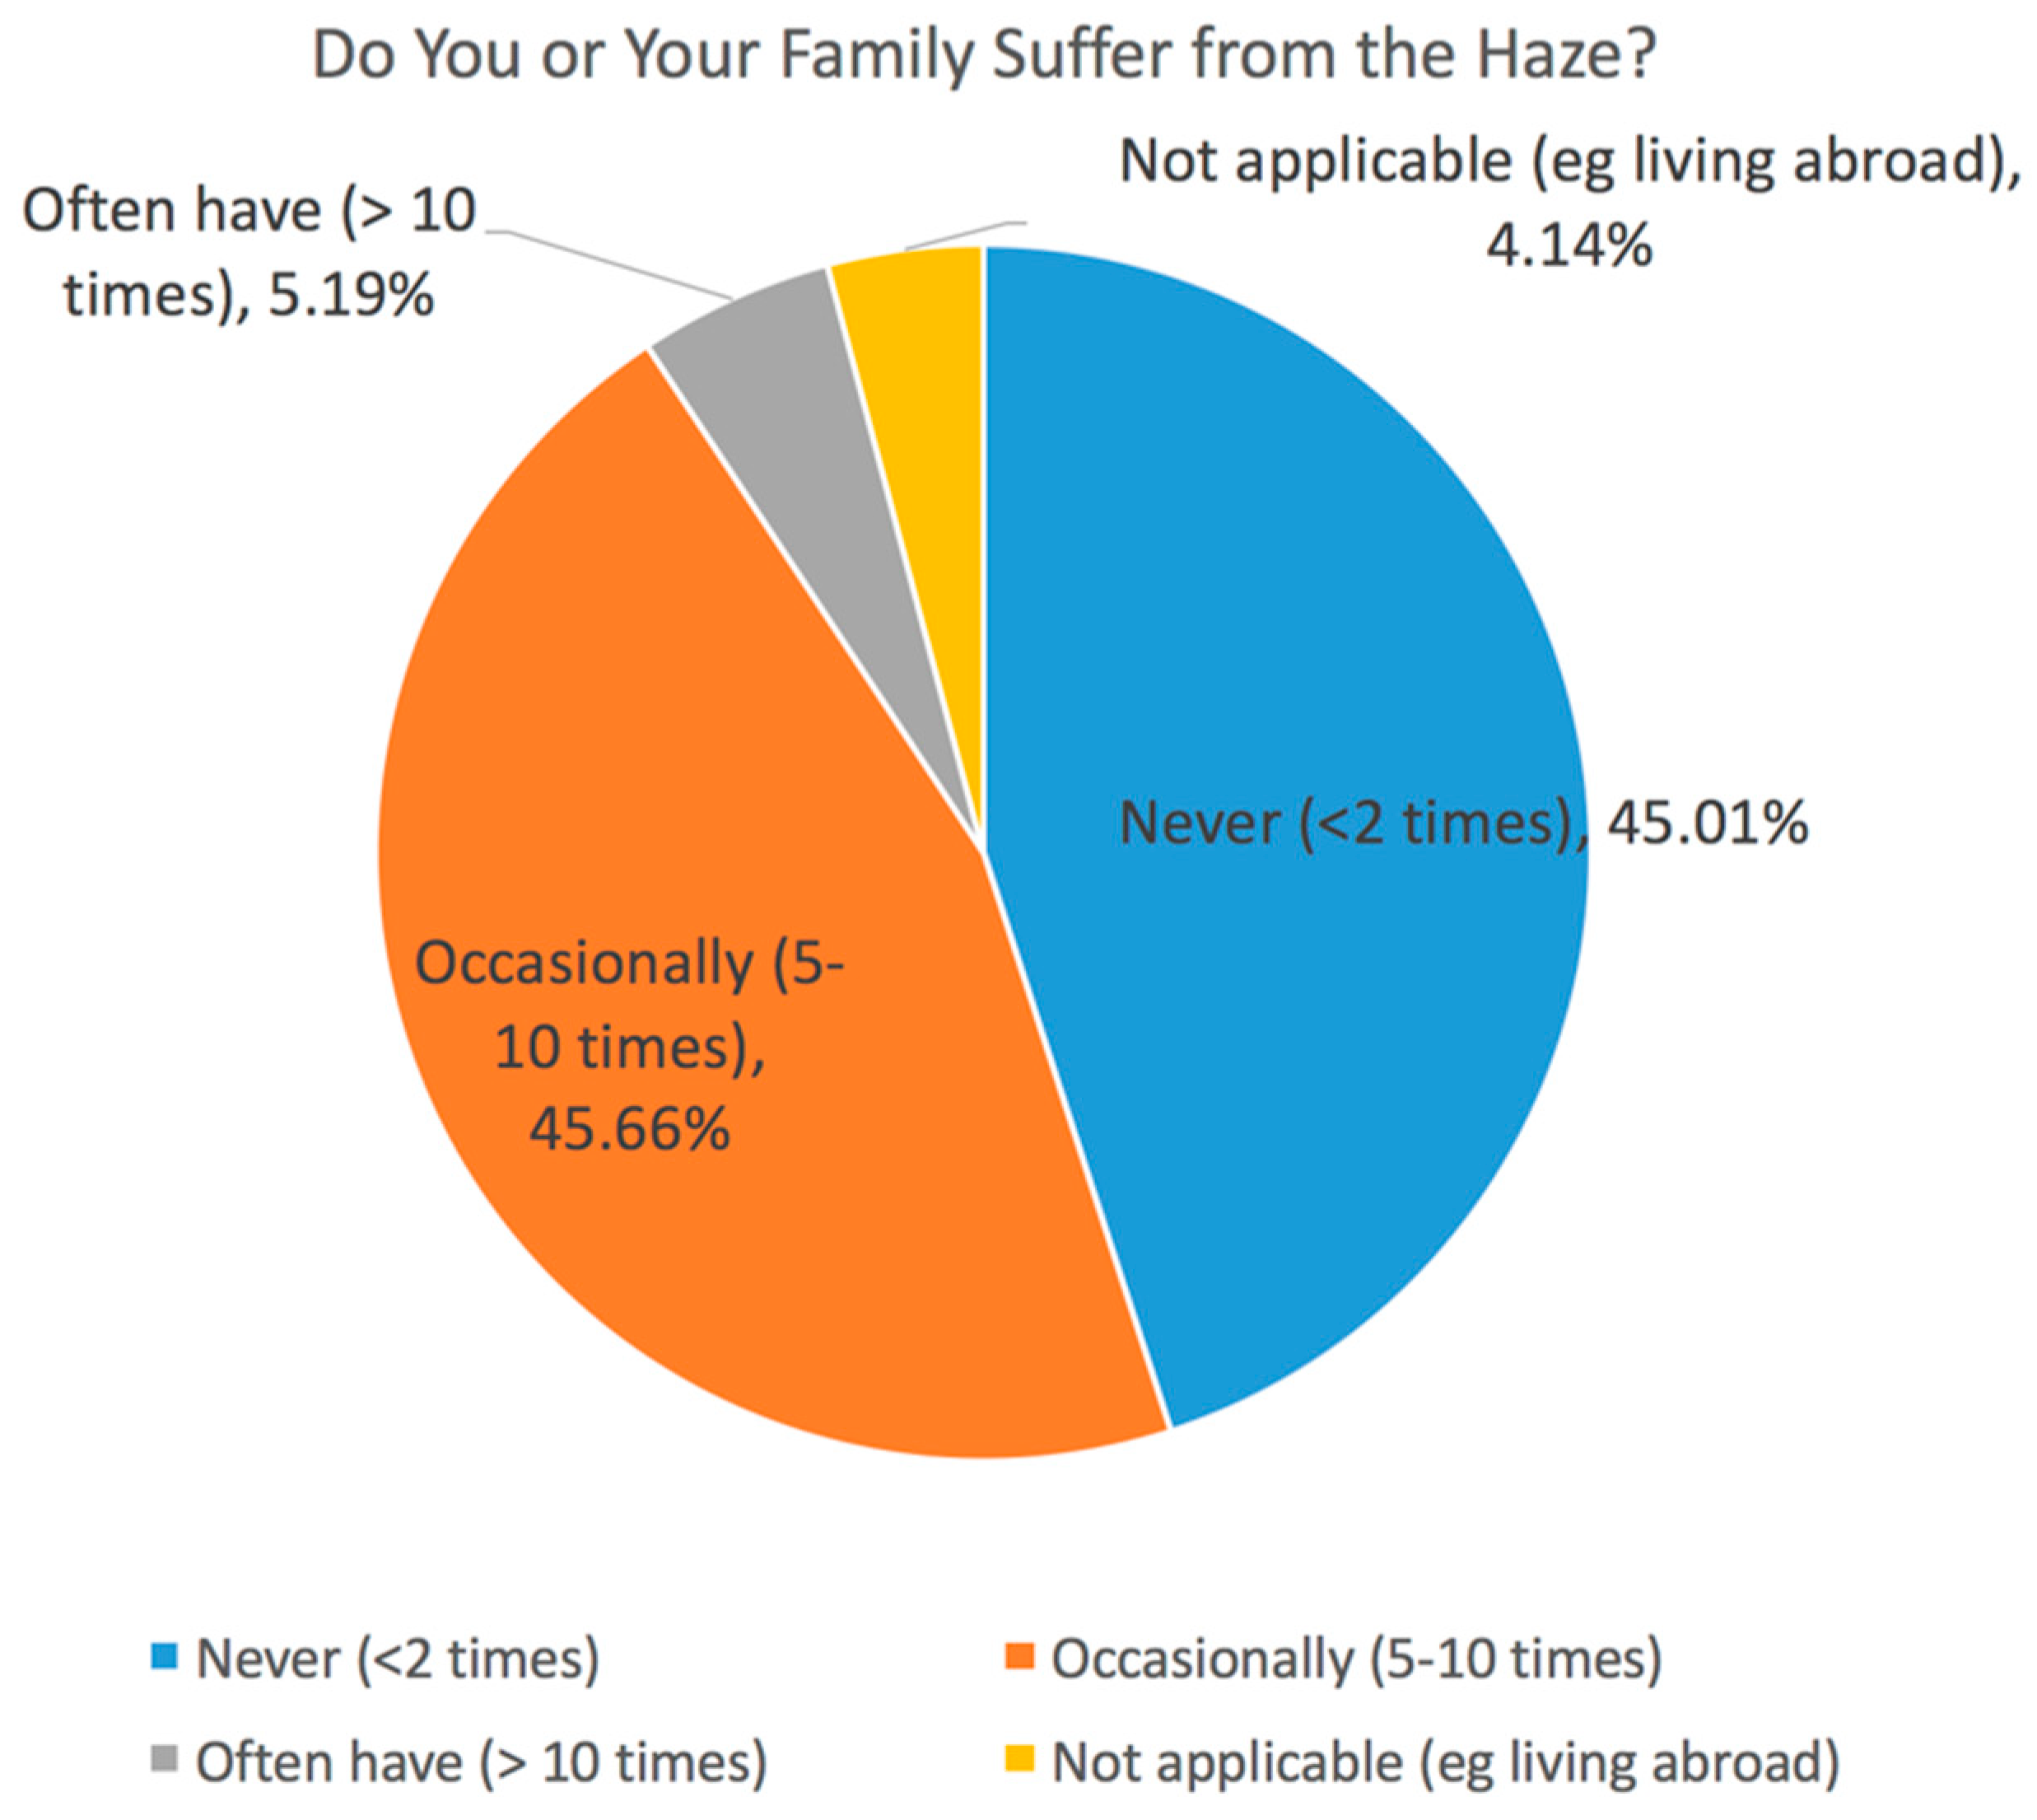
Sustainability 10 01970 g027
Figure 28. The result for Question 27 “Did you or your family members get sick during the haze period?”: 45.66% of respondents had family that suffered from haze or suffered from it themselves, but another half did not.
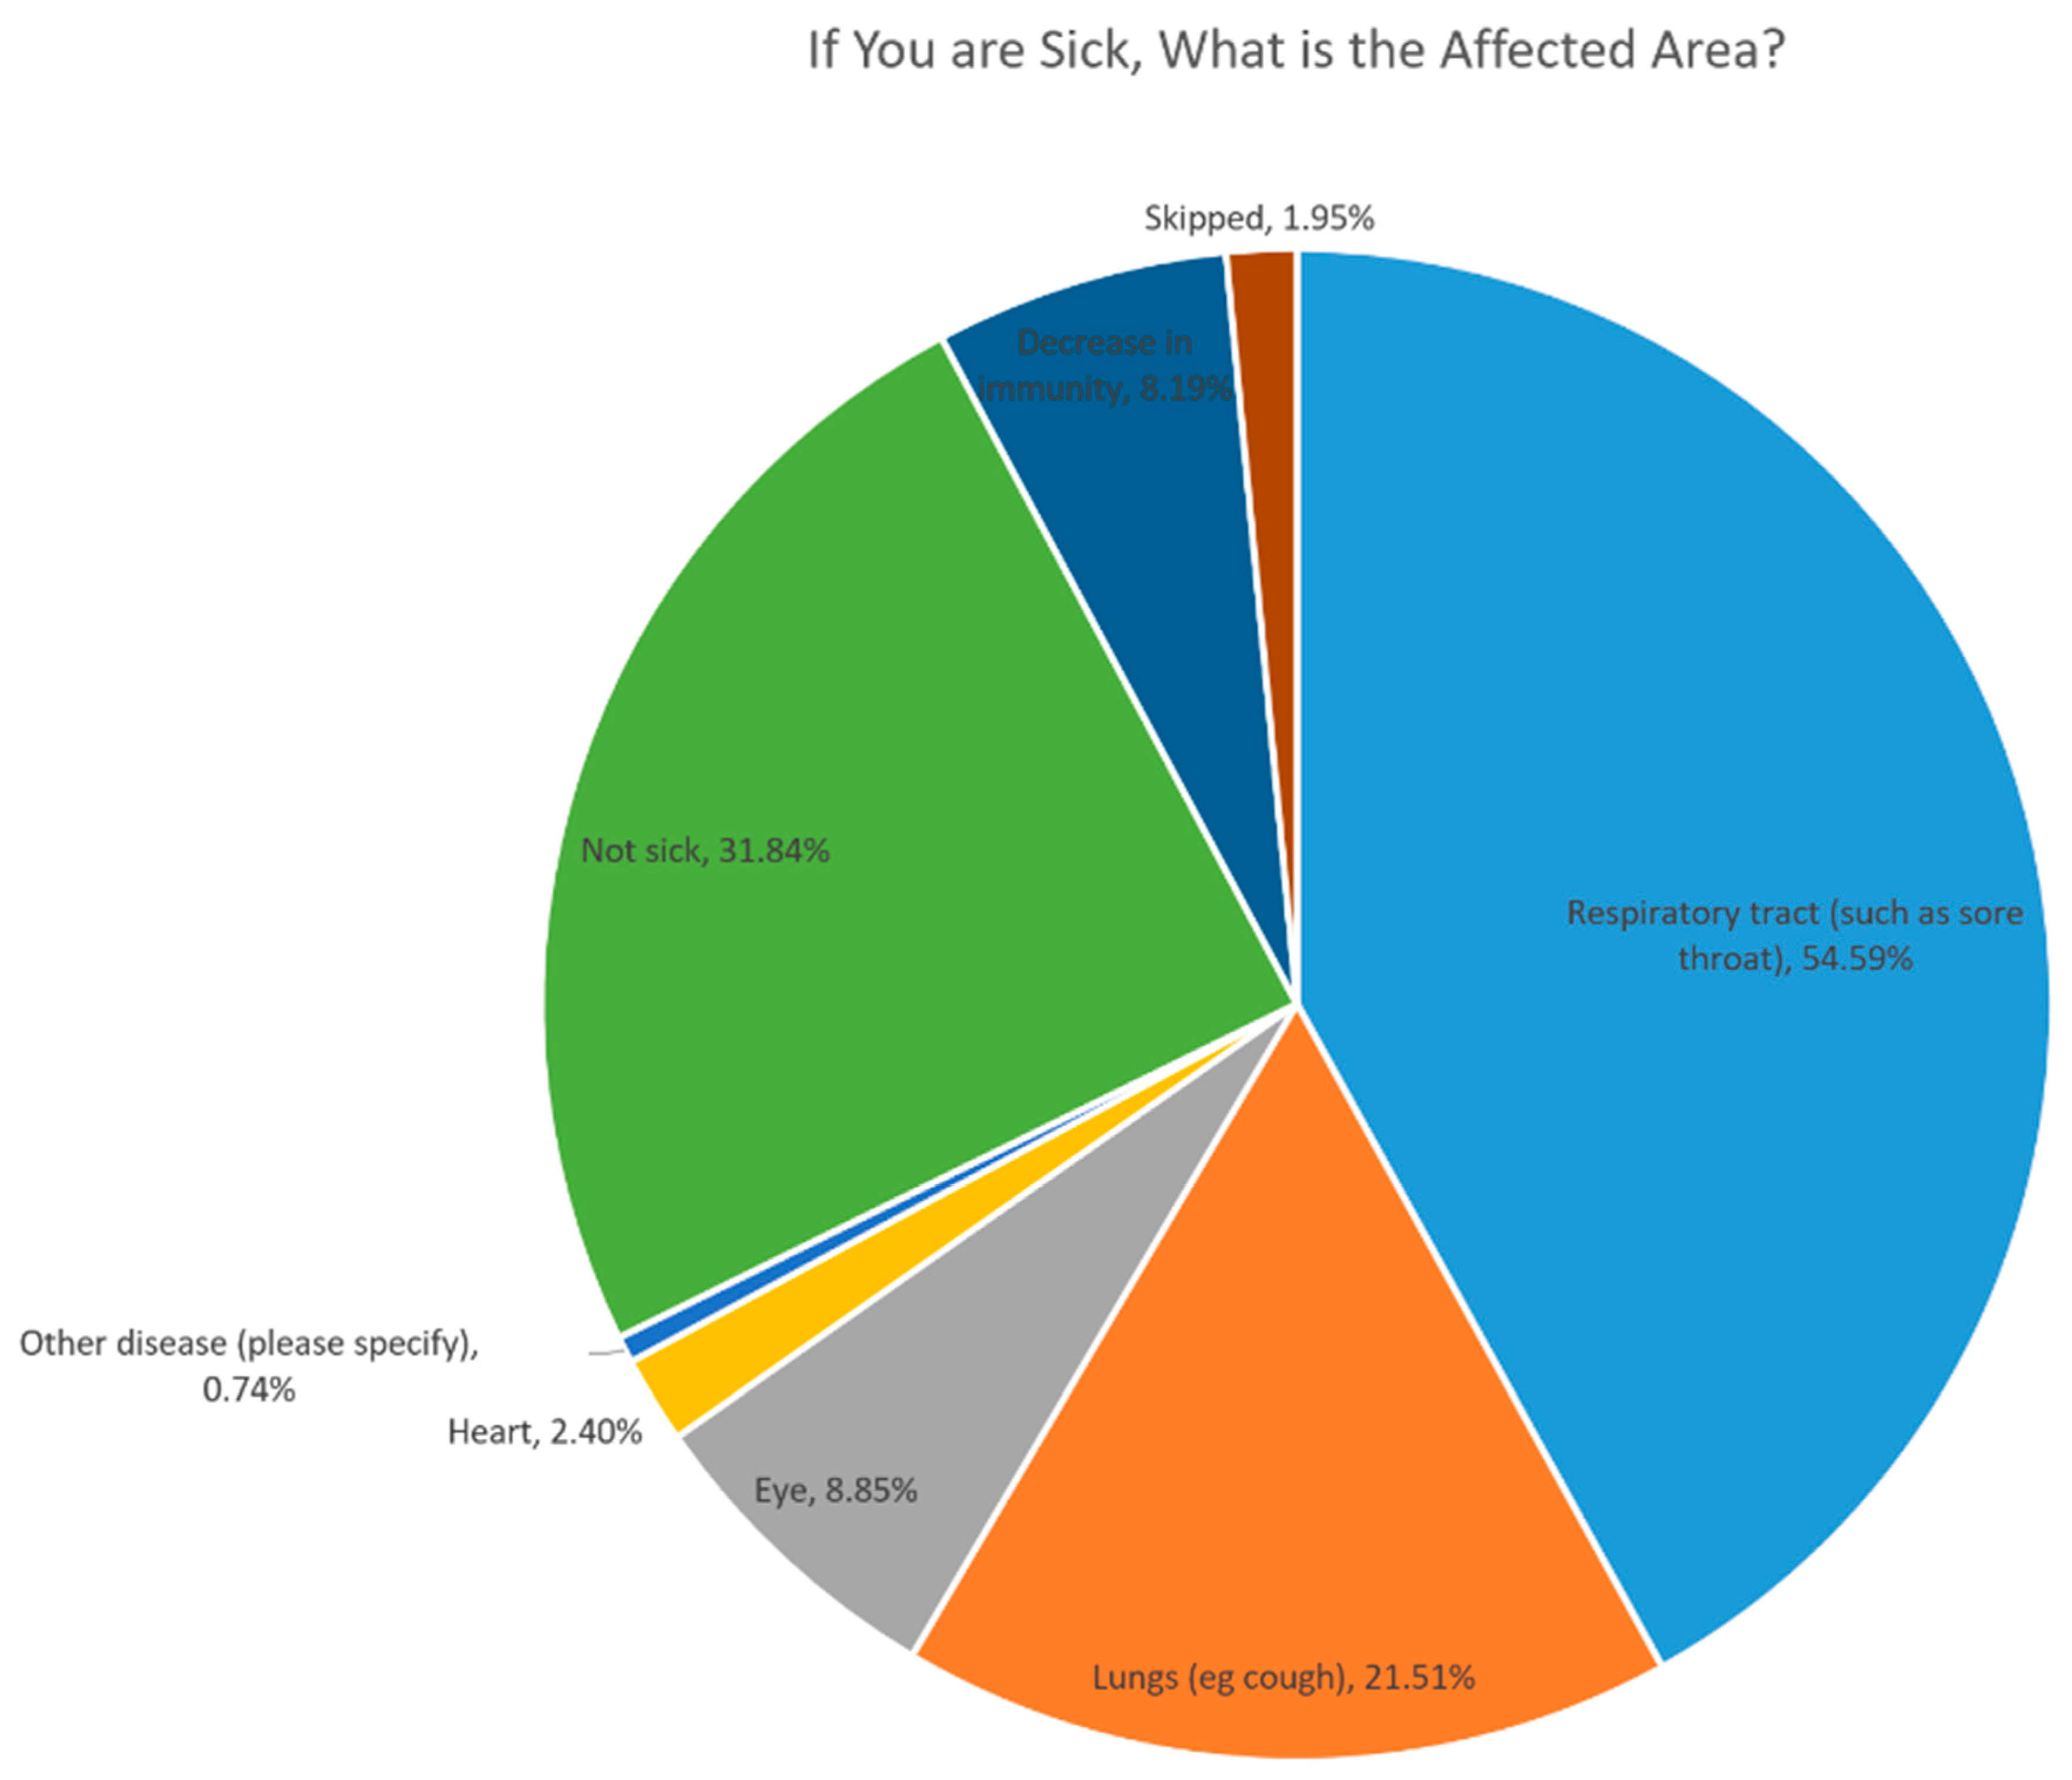
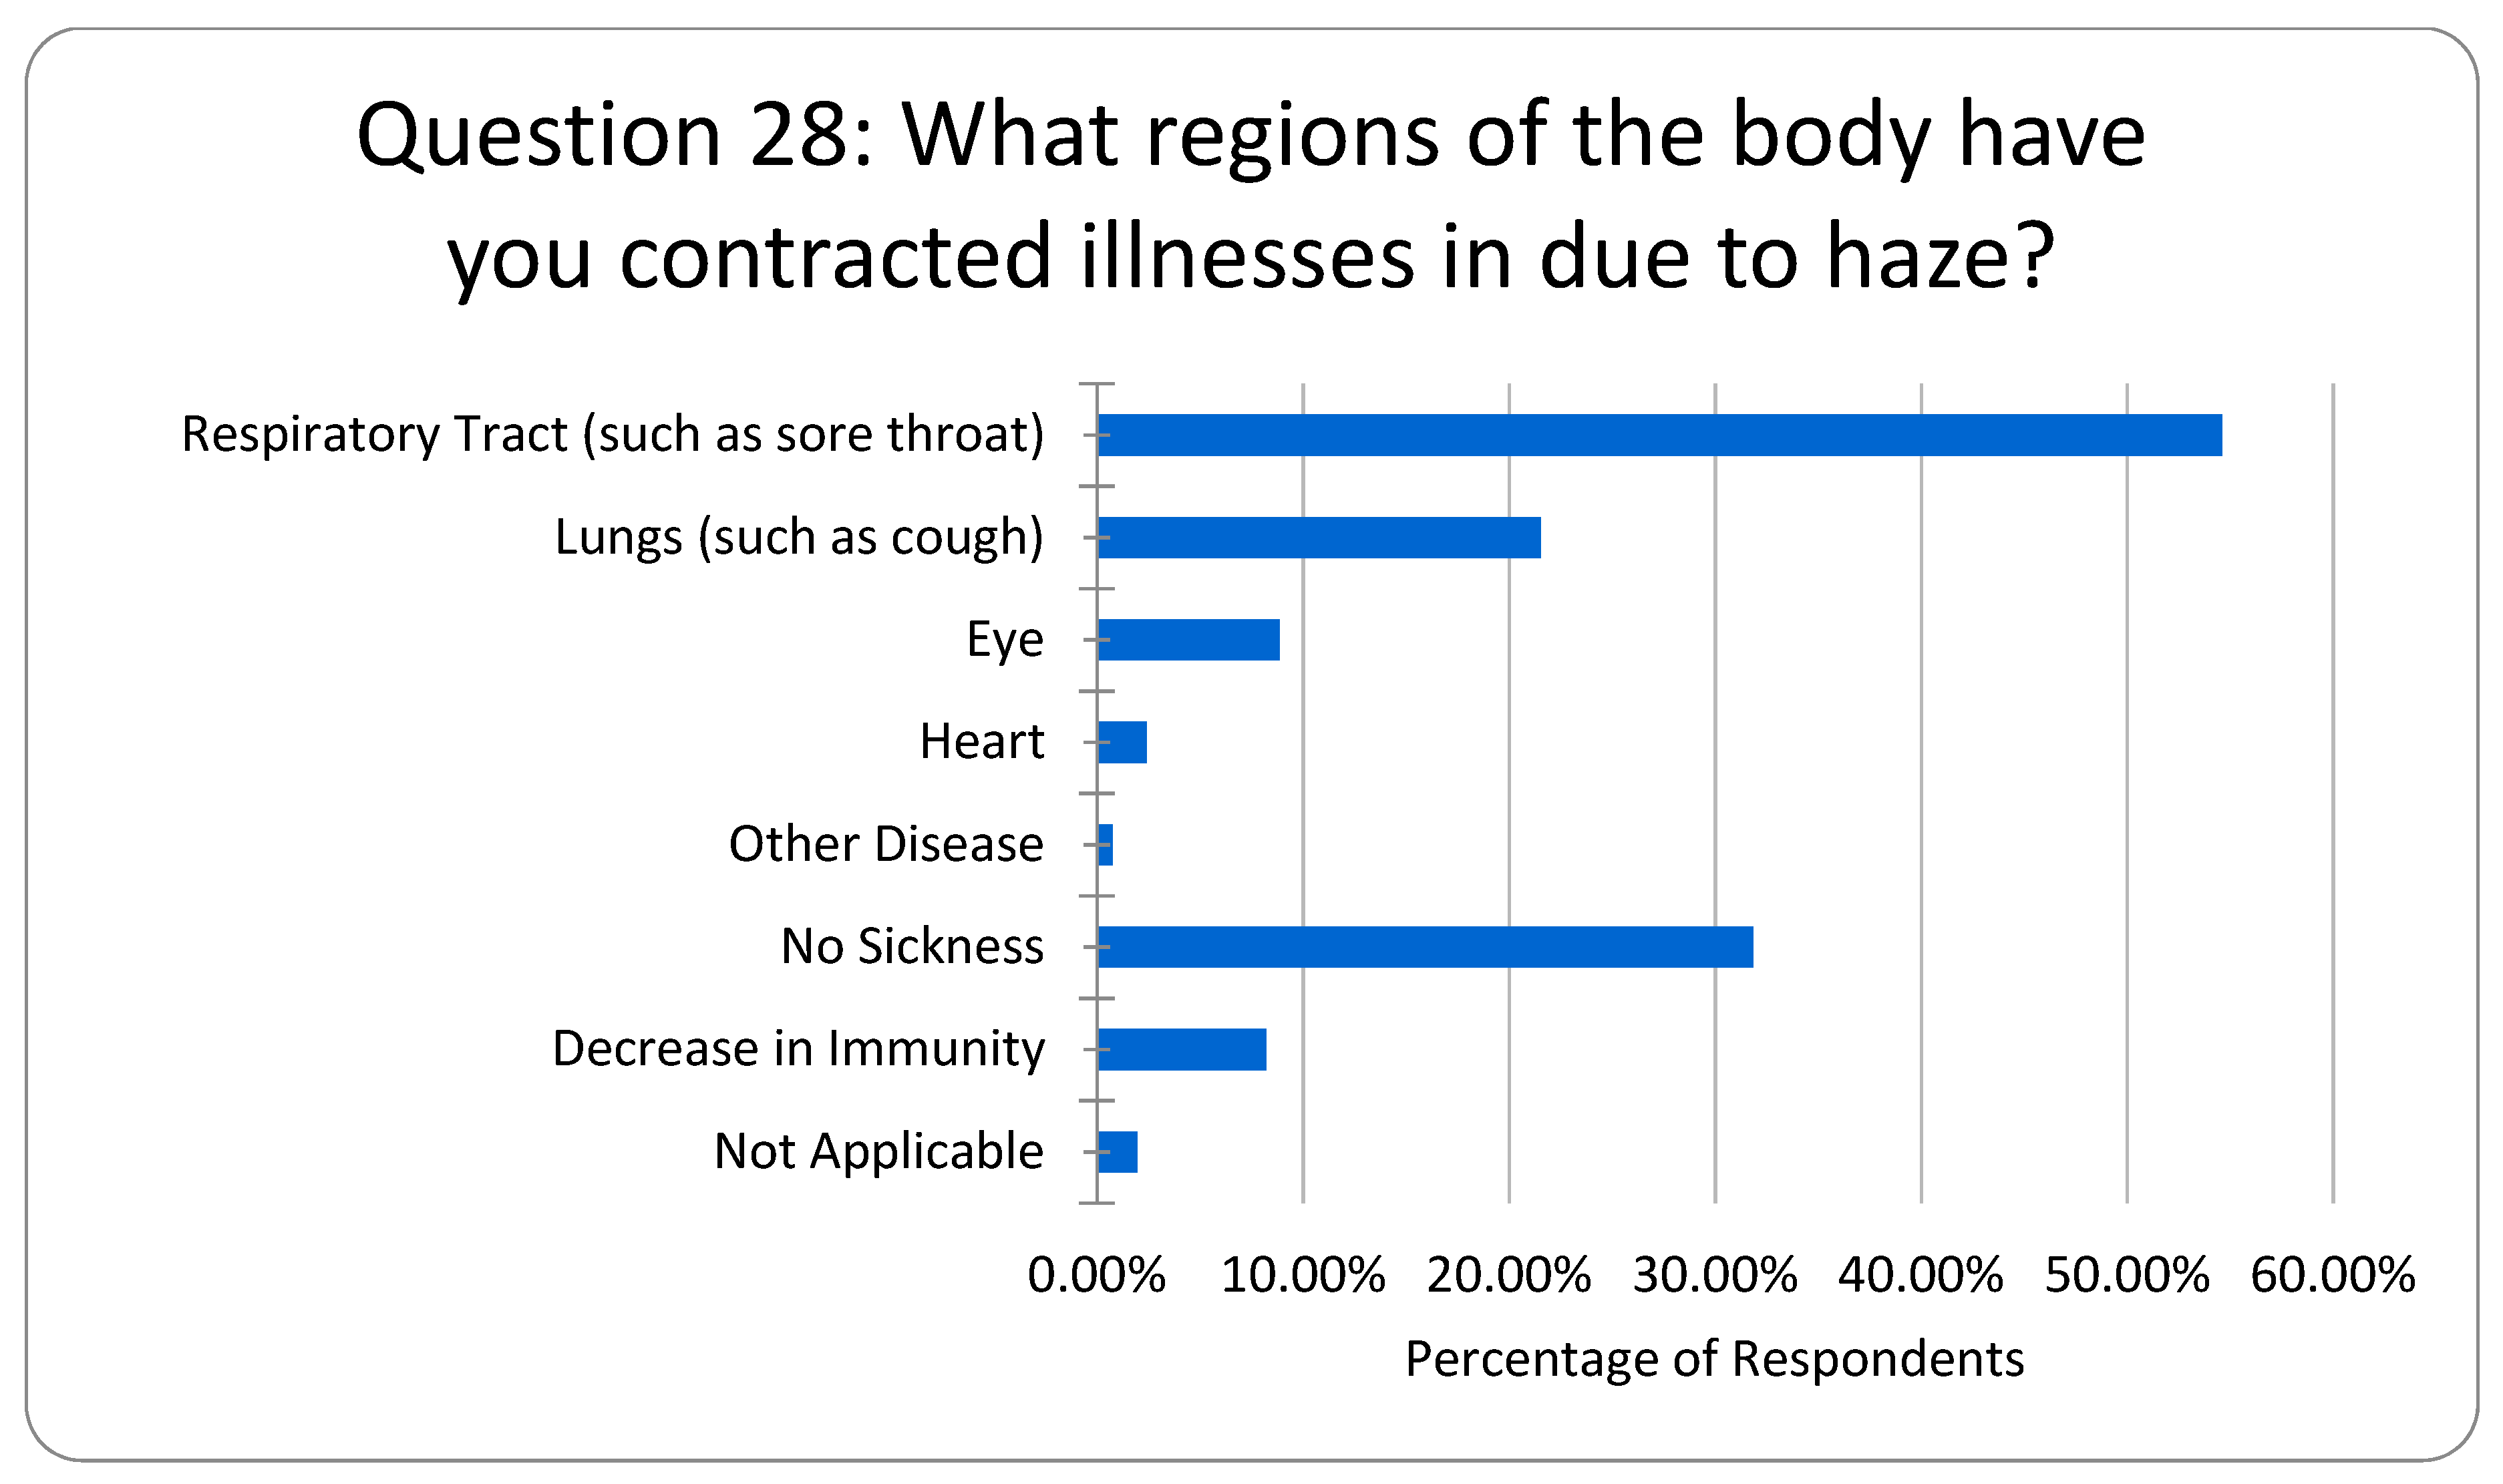
Sustainability 10 01970 g028
Figure 29. The result for Question 28 “If you are sick, what is the affected area in your body?”: 54.59% of respondents were affected in their respiratory tract by haze. The lungs and eyes were the other major areas where respondents got sick.
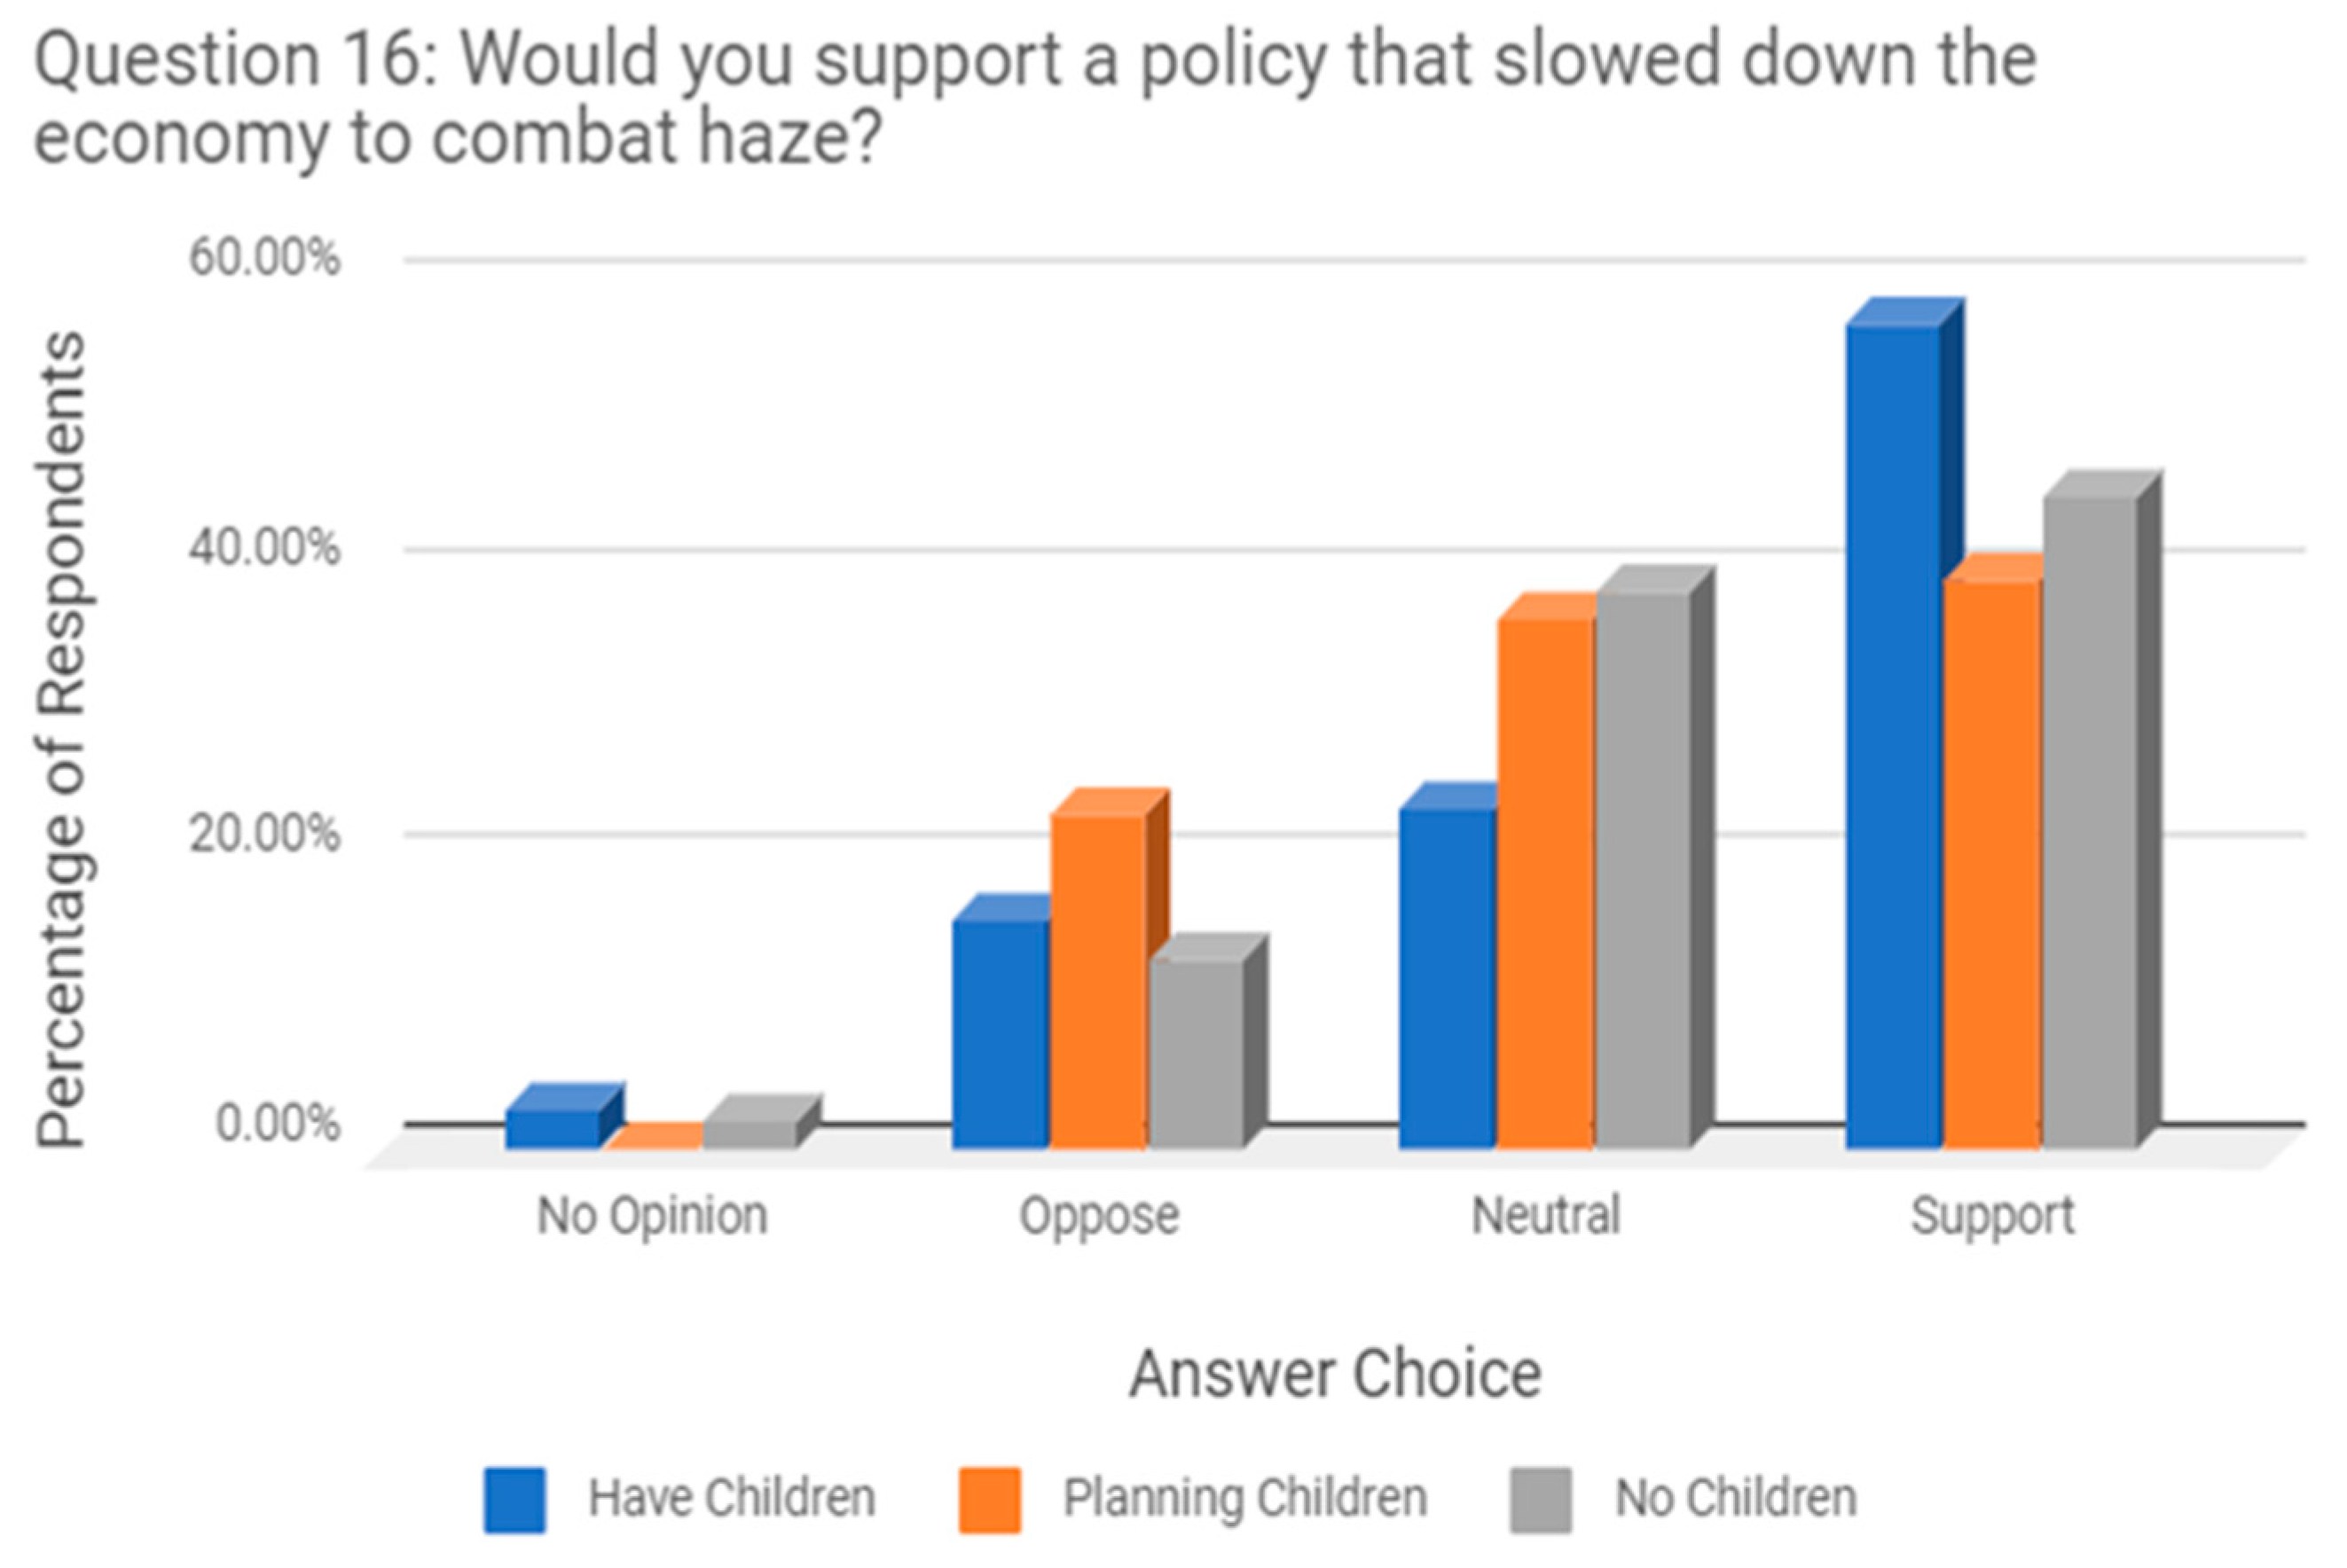
Sustainability 10 01970 g029
Figure 30. Grouping of support for potential government policy by respondents’ child status. The percentage on the Y-Axis represents the percent of respondents in the specific group. For example, summing the percentages for all the bars representing people with children yield 100%.
Sustainability 10 01970 g030
Figure 31. Grouping of support for potential government policy by ages. Respondents were categorized into five age groups: 0–20, 21–30, 31–40, 41–50, and above 50.
Sustainability 10 01970 g031
Figure 32. Respondents’ opinion on government’s current policies against haze according to their educational backgrounds.
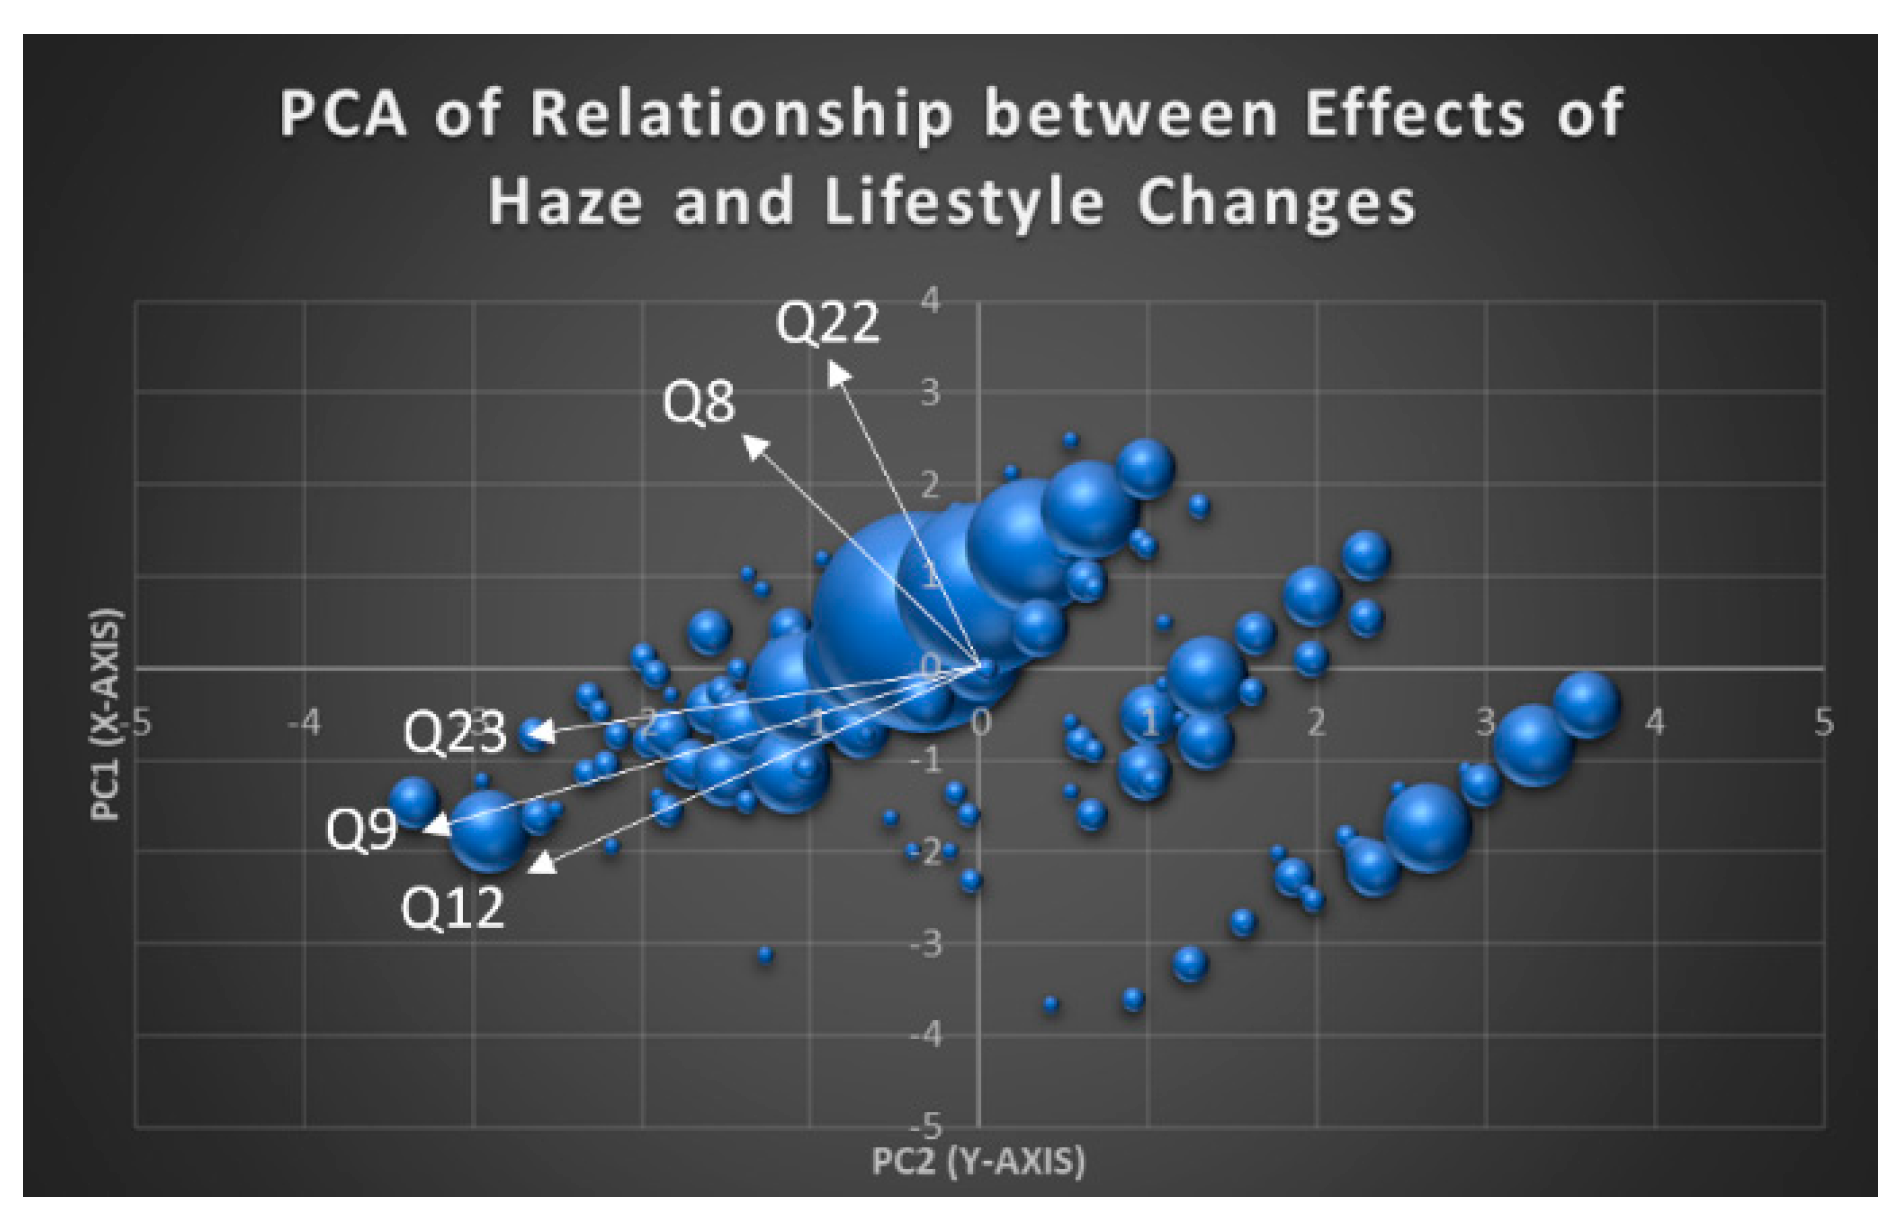
Sustainability 10 01970 g032
Figure 33. Projections of respondents’ opinions on Q#8 (i.e., whether the negative impact on daily life was large), Q#9 (i.e., whether the environment became worse and worse in the last 10 years), Q#12 (i.e., whether the living quality, with the consideration of both economic and environment situations, became worse in the last 10 years), Q#22 (i.e., whether the haze pollution caused troubles in respondents’ work and daily life), and Q#23 (i.e., whether respondents reduced outdoor activities due to the haze pollution) onto a two-dimensional space coordinated by the first two principal components, i.e., PC1 and PC2. Bubbles represent an assembly of respondents, with larger sizes indicating more respondents. Vectors representing the five questions are shown in White color. The bubbles show the distribution of respondents’ opinions among the five questions.
Sustainability 10 01970 g033
Figure 34. The change of outdoor activities in respondents living in rural, suburban, and urban areas.
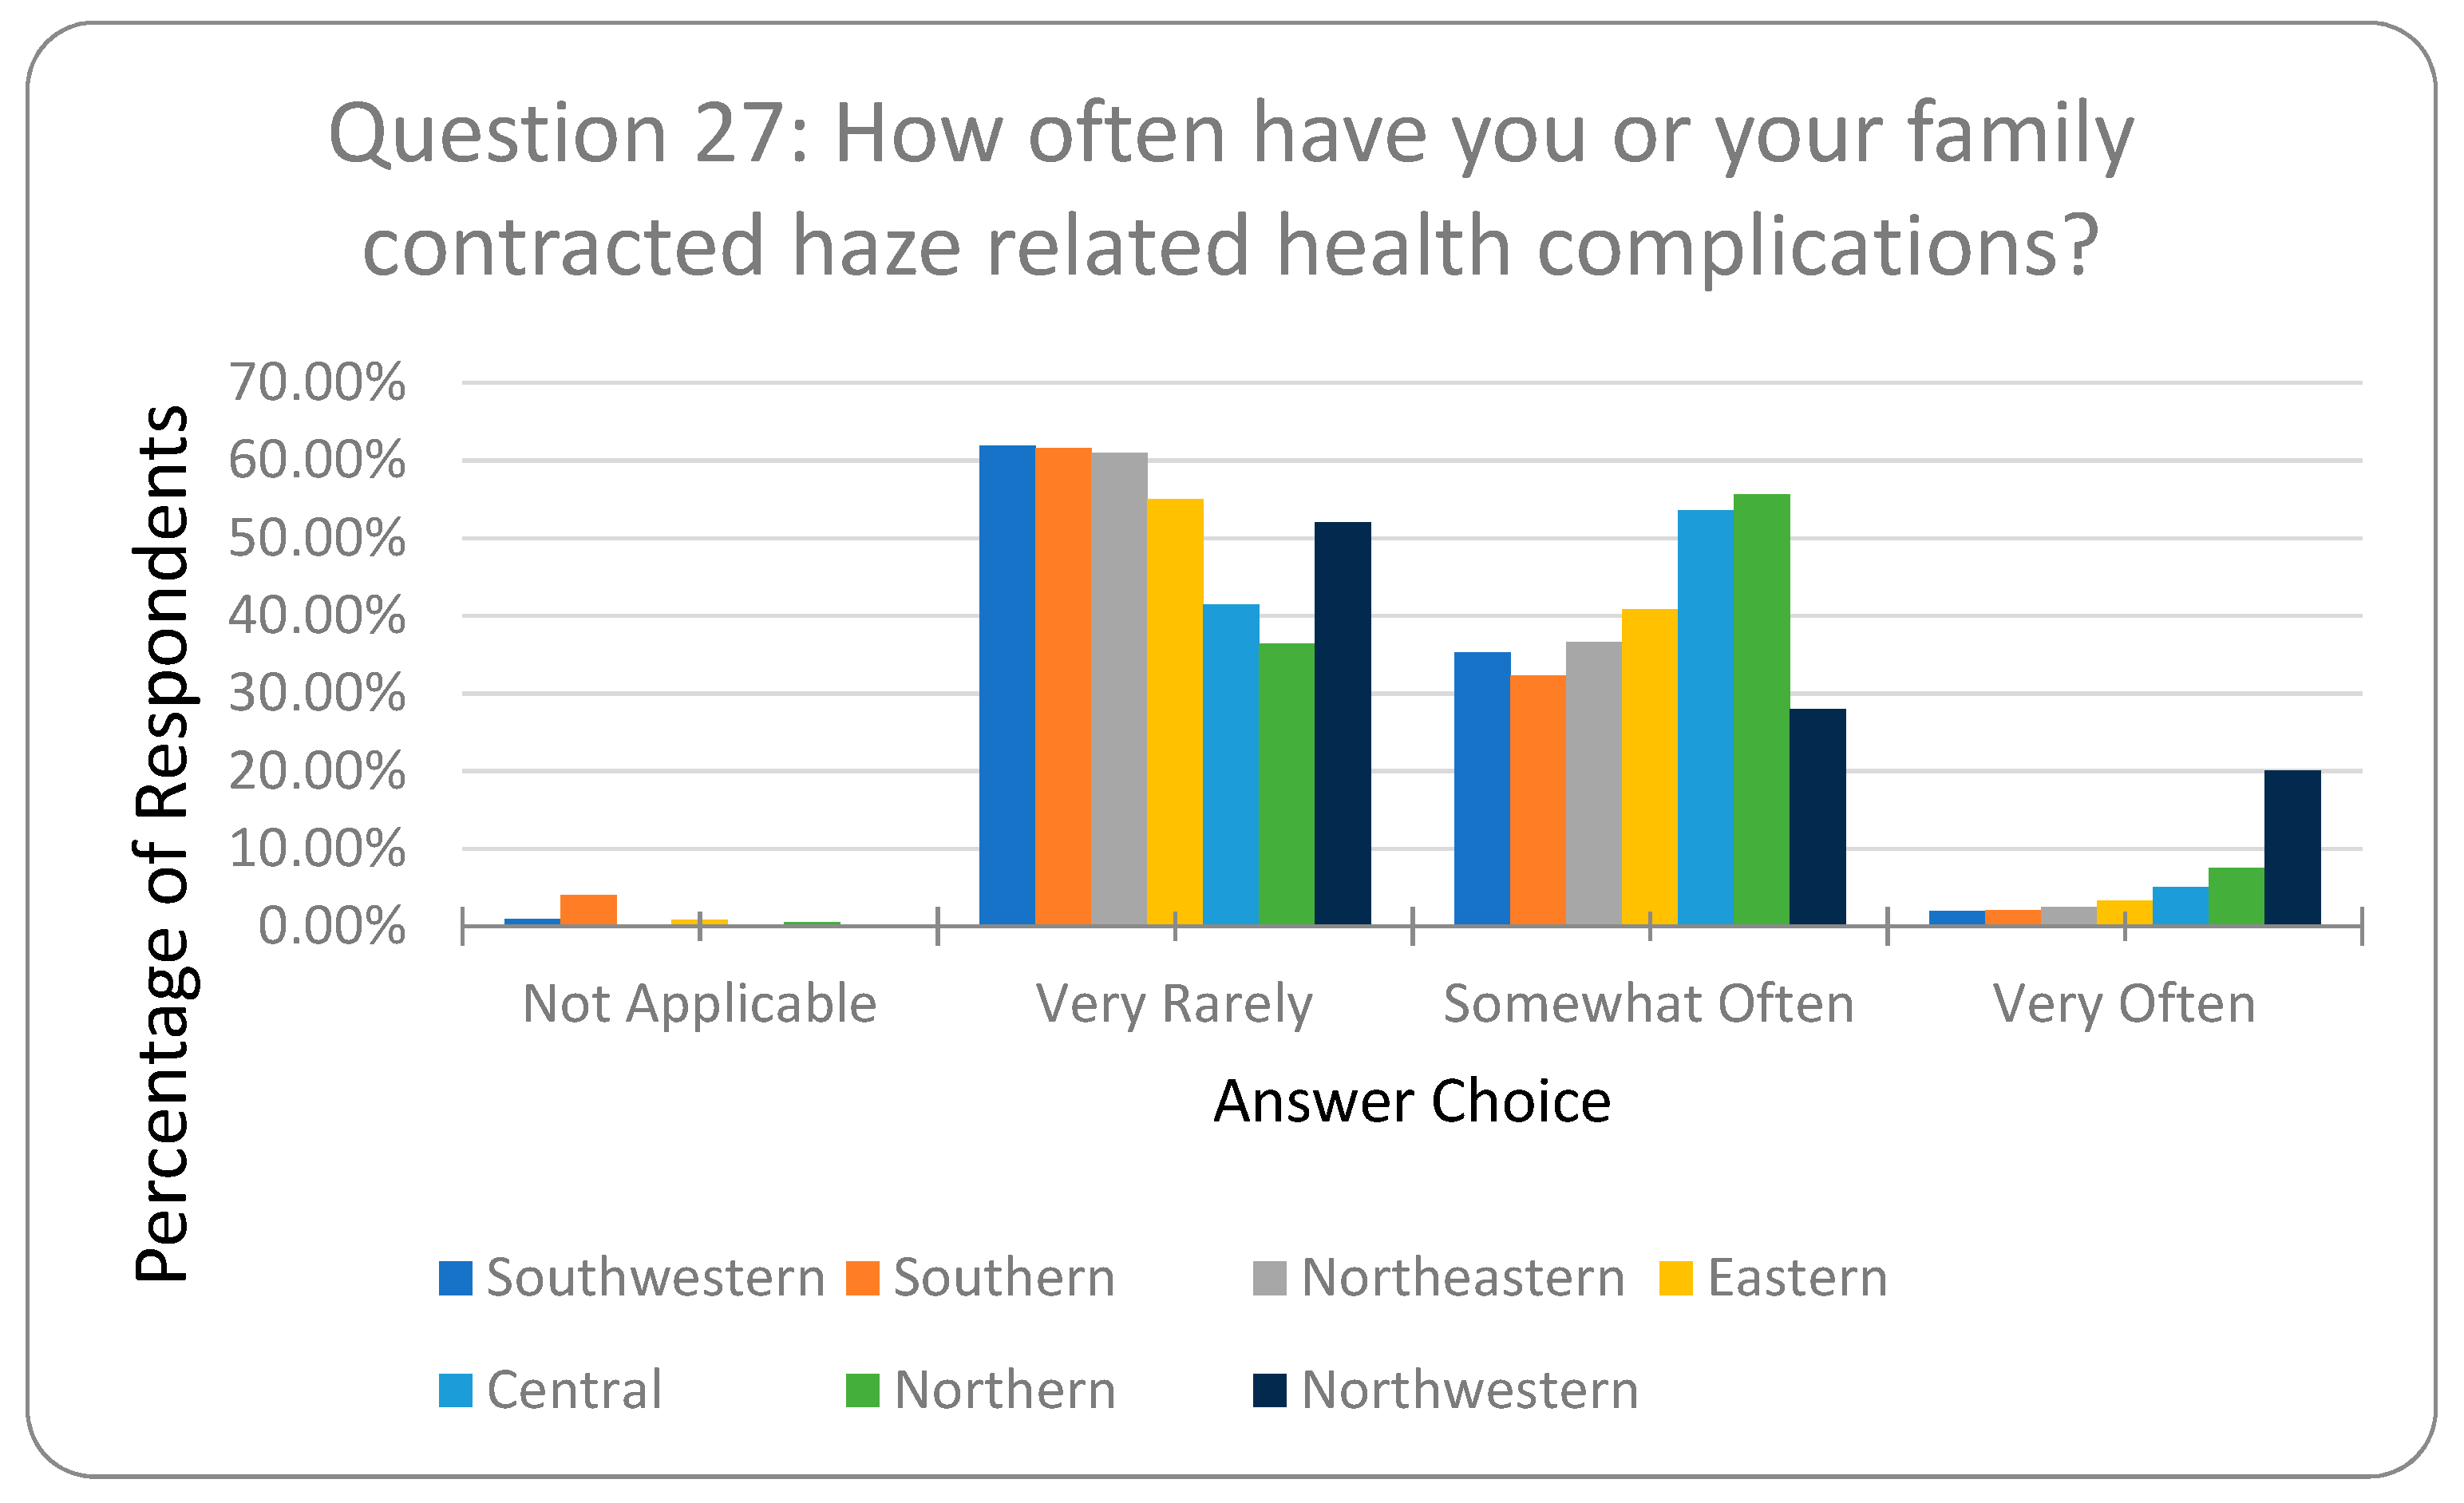
Sustainability 10 01970 g034
Figure 35. Grouping of frequency of haze related sickness by respondents’ living regions. Respondents living in North China, Central China, and Northwest China suffered more in their health.
Sustainability 10 01970 g035
Figure 36. Areas of the body of respondents having health issues likely caused by haze. Multiple choices could be selected by respondents. No sickness option shown in the figure means the respondents did not have any illness during the haze periods.
Sustainability 10 01970 g036
Figure 37. Actions taken or items used by respondents to protect themselves from haze pollution. Multiple choices could be selected by respondents.
Sustainability 10 01970 g037
Figure 38. Strategies selected by respondents for combatting haze. Multiple choices could be selected by respondents.
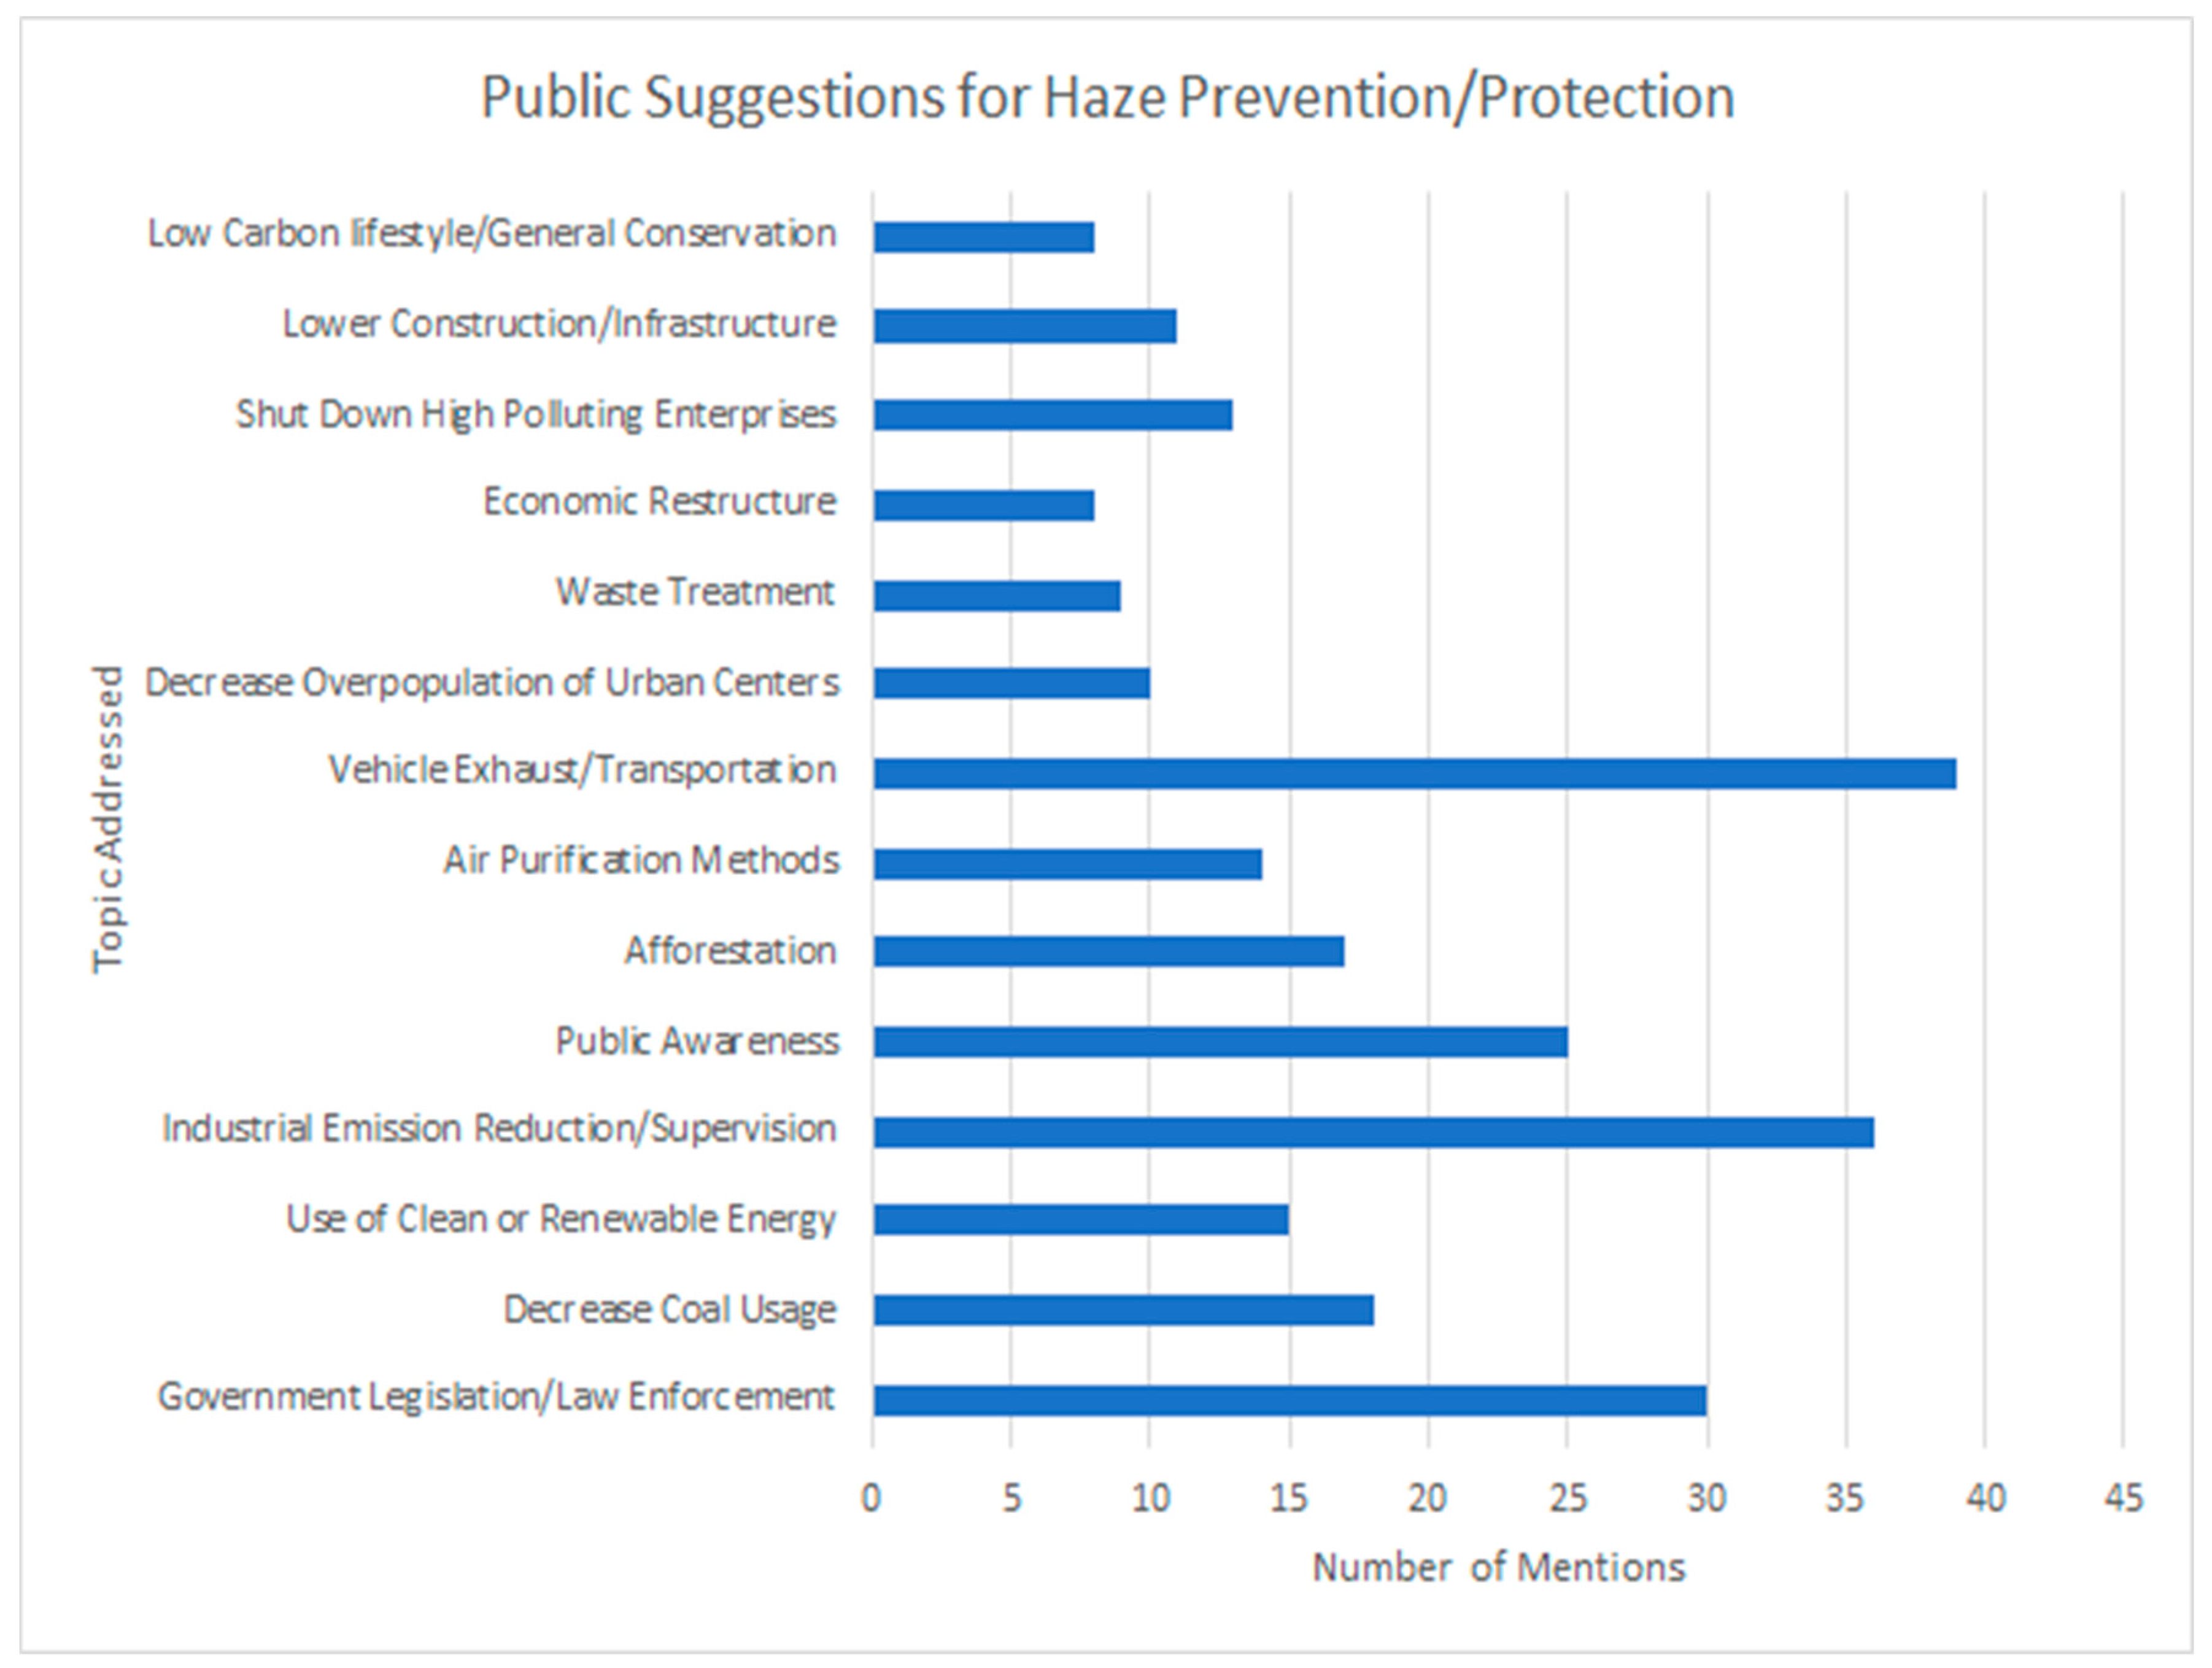
Sustainability 10 01970 g038
Figure 39. Suggestions from the public for haze prevention or protection.
Sustainability 10 01970 g039
Table 1. The opinions of respondents to policy that would slow down economic growth to reduce haze pollution.
Respondents’ Opinions of Policy That Would Slow down Economic Growth in Order to Reduce Haze PollutionTotal
No SupportNeutralSupportNo Opinion
AgesBelow 21 years102318152
21 to 30 years3981933216
31 to 40 years3357864180
41 to 50 years629227311438
Above 50 years558219911347
Total199335669301233
Note: the highlighted numbers in the table are used to illustrate the principal of the CST.

