Abstract
Public administrations’ commitment to improving tourist destinations has contributed to a consensus in the Canary Islands, particularly with the private sector, about regulations for urban development and the necessary financing alternatives for the rehabilitation of lodgings. The objective of the study is to demonstrate their favorable impact on companies’ profitability, a significant variable to consider in the decision-making process of managers. The analysis of incentives as well as urban planning and financing requirements, comparing some of them to other regions, is carried out. The study concludes that the more ambitious the project is in terms of the increase in the number of beds and the category, the better the company’s position will be, because the revenues increase without a proportional growth in costs.
1. Introduction
The Canary Islands (Spain) is one of the main tourist destinations in Europe. It is a referential model to take into consideration due to its efforts to achieve greater competitiveness. In the past five years, rehabilitation of the tourism offer, both public and private, has been encouraged. This sector made up approximately 31.9% of the GDP of this Autonomous Region in 2015 and indirectly stimulated the rest of the economy. This effort has led to different regulations, as well as lines of collaboration, essentially in terms of financing and urban planning, to enable business owners in the sector to make investments with guarantees of success.
In this regard, occupancy and building incentives have been provided through flexibility in territorial planning regulations, allowing specific plans in zones of specific tourism interest. These plans have allowed lodging establishments to increase their number of units and category, which has contributed to obtaining a larger amount of income.
Likewise, financing from the administration—European, national, and regional—has been decisive, as well as from intermediate tour operations agents that have contributed with loans and/or contracts for medium-term periods of time. These sources of financing guarantee that income will be obtained that will provide security to the owners of tourism establishments and buffer the uncertainties that arise when taking on an important investment project.
A determinant variable in a business owner’s decision to undertake a tourism rehabilitation and modernization project is future profitability. In other words, through the appropriate analyses, it is necessary to verify whether the investments to be made will really provide greater income, and if this income, when compared to the costs incurred, will provide enough profitability to make it possible to amortize the investments in a logical period of time and pay back the external financial resources obtained, in addition to generating sufficient profits to compensate the owners of the lodging establishments. In this regard, we use the data from the Canary Island Institute of Statistics (ISTAC) and other public organizations that generate technical and economic-financial information on tourism, as well as the cases of five referential extrahotel rehabilitation and modernization models in the Canary Islands, specifically on Gran Canaria Island.
2. Bibliographical Review and Background
The rehabilitation and modernization of tourist establishments has become a priority for public administrations, particularly in mature destinations that need to increase their competitiveness through higher quality as a path to future survival in the market. When governments choose to definitively favor this sector, it is basically because these destinations contribute significantly to the gross national product (GNP) of the regions and the country. Without government mediation in this effort through regulatory reforms and economic-financial assistance, the small- and medium-sized business owners would find it difficult to take on these projects.
One relevant aspect of the rehabilitation and modernization of mature tourist destinations is how to finance the proposed investment projects, and whether this financing should be public or private. In this regard, public aid for private investment has been proposed as a necessity so that economic agents can develop ambitious projects, following the guidelines marked by the administration. However, part of the financing must be used for investments in basic local infrastructures, and governments have often had to resort to private investment for their execution. Therefore, public and private investments have gone hand in hand, as can be seen in various initiatives proposed and included in different research studies. Thus, Lee and Yu [1] highlight the importance of the participation of the private sector in financing infrastructure projects through the use of a public–private association model.
In an analogous way, Albu [2] defends public–private alliances as a prerequisite for guaranteeing coherence and transparency in the execution of sustainable tourism projects at the local level and the creation, following the inherent principles of sustainability, of important economic, environmental, and social benefits. The author understands that the contribution of the private sector consists of contributing capital or goods and participating actively with the administration in contracts with public–private management in order to ensure the financing, construction, renewal, management, or maintenance of infrastructure or the offer of a certain service.
Likewise, Morar [3] understands that tourism development requires public and private financing, arguing that there are different financing routes. Among them, the author highlights structural funds, especially the European Fund for Regional Development, the objectives of which include the reactivation of the local economy and the transformation of cities into centers of regional economic competitiveness. This fund assists with the promotion of tourist destinations, investments in infrastructure for lodging and road transportation, and public investments in cultural and environmental areas through the rehabilitation or development of water supply networks and sewer systems in order to protect biodiversity and reduce contamination. Finally, he emphasizes the role of structural funds for business tourism.
With regard to European Union financing of tourism projects, Balogh, Coroş, and colleagues [4] indicate that there are traditionally three limitations that characterize the actions that need to be performed before they can be executed and completed. These aspects are the reach (activities to be developed in order to produce the proposed outcome of the project), the time available to finish the project (it has a beginning and an end), and the cost (amount budgeted for the project = available resources). Gruescu, Pirvuy, and Nanu [5] also focus on European funds as a way to finance tourism interventions, transforming zones with low economic competitiveness into desirable areas for investment. Moreover, Hawkins and Mann [6] show the role of the World Bank in supporting tourism initiatives in order to contribute to development, whereas Hayakawa and Rivero [7] highlight that certain projects of this institution have focused on improving specific tourist destinations (favoring cultural aspects, infrastructure, environmental conservation, among others, and in general, the local economic activity) to stimulate an increase in visitors and in the quality of life of the residents.
In a similar way, Rosenberg and Larkin [8] defend public investment in cultural rehabilitation or modernization (the cultural treasures) in the conservation of these treasures and in other places that attract tourists, which in their opinion, will contribute to guaranteeing the future quality of life of the communities. These authors emphasize, in addition, the contribution of public investment to employment and learning. However, according to Dorta [9] (p. 35), “the most successful interventions within this field of action have come from a considerable improvement in strategic planning and the capacity for cooperation among the different public/private stakeholders intervening in the management of the tourism space, a sine qua non condition for starting up various urban action plans that have been translated into noteworthy improvements for the tourism regeneration of many of these destinations”.
An important determining factor when deciding whether to make an investment is the high cost of tourism rehabilitation and modernization; therefore, many business owners hope for financing from public administrations. In this regard, Simancas [10] (p. 37) indicates that “in this context, the tourism sector is one of the private business fields in which the business owner is not only in favor of government interventionism, but also demands it. Thus, it is common for the competent public administrations to formulate a set of policies, plans, programs, and projects that, as in industrial conversion processes, try to redefine, restructure, and in some cases, reinvent the tourist destination”.
When the public financing routes are known, the business owner must decide how to obtain the rest of the necessary resources to make the proposed investment for the rehabilitation and modernization of his or her establishment. However, we must take into account the time delay operating in this matter, mainly due to the economic recession in European tourism. Thus, Marinoiu and Viciu [11] point out that the year 2009 represented a turning point in this industry, particularly in hotel and leisure activity, because families prioritized other types of more necessary expenses. According to these authors, the financial crisis was accompanied, more than ever, by a reduction in loans for new hotel projects, and very few investment projects were registered in this sector in 2009, so that restructuring strategies have focused on optimizing existing properties.
In Spain, a country where tourism has great relevance, different administrations have favored tourism rehabilitation and modernization. According to the World Tourism Organization (OMT, Madrid, Spain) [12], this country has broken records and, in 2015, continued to be positioned as the third tourist destination in the world in terms of tourist arrivals, after France and the United States and ahead of China. It is also in third position in terms of income, after the United States and China. It has acquired such relevance that the Spanish tourism GNP ended the year 2015 with a growth of 3.7%. Moreover, 84.7% of Spanish tourism companies have improved their sales, due to the gradual recovery of prices, with a percentage of 56%, where this increase exceeds 5% as indicated by the Report on Tourism Perspectives [13]. According to the same report (p. 3), “this increase in sales, along with the results of operational efficiency policies applied during the years of the crisis and the considerable reduction in energy and financial costs in 2015, has led to a notable improvement in margins and final outcomes for 83.4% of Spanish tourism companies”.
According to the National Institute of Statistics (INE, Madrid, Spain) [14], of the total number of international tourists who visit Spain, 28.86% visit the Canary Islands, followed by Catalonia, with 22.99%, which shows the relevance of the Canary Islands in the winter season compared to any other season of the year. In the Canaries, which occupies 3.8% of Spain’s territory, tourism is the fundamental sector of its economy, not only because it represents 31.9% of its GNP, according to IMPACTUR [15], and contributes 37.6% to employment and 32.1% to the volume of taxes collected, but also due to its strong effect on the other productive sectors.
In addition, this Autonomous Community has a strong interest in improving its position at the national level because, according to the tourism competitiveness monitor of the Spanish autonomous communities in 2014, it is in fourth place. However, it is in first place among communities specialized in coastal tourism, whereas Catalonia leads the general ranking and that of communities with a high level of development and income [13].
With regard to the estimated number of extrahotel establishments and/or companies open, that is, apartments that provide paid lodging services some days of the month in question, in the ranking of autonomous communities and cities at the end of 2015 [14], the Canary Islands continued to be the leader in the national ranking, with 906 establishments open, out of a total of 4369, representing 22.74% in the month of December.
However, in the Canaries, there are mature tourism zones that need overall renovation. As Santos, Simancas, and Hernández [16] indicate, 81% of the lodging establishments identified on islands with consolidated tourism were built before 1995. Specifically, and based on the analysis carried out by Cáceres and Palop [17] in Playa del Inglés, 71% of the tourist establishments were more than 25 years old. This situation is manifested in a clear level of obsolescence, that is, the deterioration of buildings and installations, the age of the buildings, and, definitively, a lack of modernity and a gradual decline in image, which makes them less attractive as tourism lodgings. However, they also show a lack of quality and variety of services, basically complementary services, which translates into a lack of competitiveness and, thus, a reduction in sales prices. Obsolescence and lack of competitiveness, from an economic-financial point of view, lead companies to a progressive decline in profits. Even so, many business owners and/or managers do not see the need to renovate because favorable tourism perspectives will allow them to subsist on the market in the short term, but without projecting any strategy for the medium and long term.
In this regard, González and León [18] (p. 174) conclude in their study on obsolescence and environmental renovation policies in the tourism sector that “private agents can develop profit maximization strategies that essentially involve a reduction in the quality of the services they provide and in their contribution to the quality of the destination. Either due to their financial incapacity to make investments that maintain the quality of their services, or because the quality of the destination overall allows them to reap profits that compensate for their lack of an investment strategy, these businesses produce negative external effects on other agents that can extend until they involve each and every agent in the private sector”.
For Simancas [10] (p. 32), the age of the buildings does not necessarily imply their obsolescence, although in most cases, there is a certain parallelism, basically in smaller segments. He adds that “the oldest areas, with the greatest degrees of aging and obsolescence and worse operating and competitiveness conditions are located in the most privileged and strategic coastal areas from the point of view of potential tourism. Building remodeling is proposed as a mechanism to correct this situation, converting these lodgings into a strength instead of a weakness”.
In this context, the actions carried out initially were not very successful, being limited in certain towns to performing certain rehabilitation work in the public space, which, in the opinion of Simancas, de Souza, and Núñez [19], has a more palliative or cosmetic nature. However, beginning with the Agreement on the Competitiveness and Quality of Tourism in the Canaries 2008–2020 [20], this dynamic started to change, articulating the current tourism organization strategy in the Canaries, related to urban and building renovation of tourism lodgings and areas that can be classified as obsolete [16].
Likewise, public administrations have contributed to this effort because the Canary Islands is a pioneer in tourism sector regulation. In the past 20 years, different regulations have been dictated with the intention of protecting and fomenting tourism. Some of them are: Law 7/1995, the Canary Islands Tourism Ordinance [21]; Law 5/1999, which modifies the law on the Canary Islands Tourism Ordinance [22]; and Law 6/2001, on Urgent Measures in matters of Territorial and Tourism Management in the Canaries [23]. In addition, with regard to the study carried out here, we highlight the lines of action included in later laws, which appear in Table 1.

Table 1.
Regulations of reference in the Canary Islands. Source: Elaborated by the authors.
In addition, Simancas [10] (p. 30) highlights the predominance of extrahotel establishments. Of all the islands, Gran Canaria has the most weight in terms of the number of tourist apartments, reaching 37.24% in 2016, and even increasing its relative weight with regard to 2010 [29]. This fact, along with the tourism rehabilitation data revealed through the Plans for Modernization, Improvement, and Increase in Competitiveness of the tourism sector approved by the Government of Canaries [28] and the Evaluation Report of Law 2/2013 on Tourism Renovation and Modernization in Canaries [27], justifies our analysis of the extrahotel tourism sector (apartments) on this island as a reference, taking into account that its evolution over time, as in the Canary Islands as a whole, has seen a slight decline [29]. However, it has remained stable for the past three years and continues to be preponderant in the entire archipelago.
Focusing on Gran Canaria as a reference, and given the data from the ISTAC [29], we observe that establishments in the category of 4 and 5 keys and/or stars are practically nonexistent. The 3-star/key category represents 6.4% of the total, whereas lodgings with 1 and 2 keys and/or stars make up the majority of the establishments available on Gran Canaria, 93.3% of the total. This situation is what led the public administrations of the Canaries to try to remove from the market lower category establishments that do not meet the minimum standards established in the different regulations. This approach is designed to encourage their rehabilitation and modernization in order to increase their quality, favoring an increase in category. It requires larger investments by the owners, which is difficult for them to take on without public incentives and significantly conditions the intended objectives.
3. Methodology
The methodological model used was the case study approach in order to analyze a current phenomenon, highlighting the experience in a specific area. This area served as a model due to the support provided by the public administrations with specific agreements with the private sector. Rehabilitation and modernization have been carried out, not only in public infrastructures, but also, in a specific and exemplary way, in lodging establishments.
Although the study focused on a certain context, which could limit the generalization of the results, the aspects examined stem from a high level of descriptive knowledge that can obviously be applied in similar contexts, depending on the specific regulations (urban planning, financing, or guarantees) of the different territories. We can make the same arguments about the economic-financial techniques and variables used to study the specific case of the Canary Islands, which are universally known and can be extrapolated to other tourist destinations.
We used a research methodology based on a specific case that combines theoretical knowledge with real experiences [30,31,32], analyzing the strong and weak points in order to draw attention to some tools that can be applied in the future by specific economic agents to support decisions about making a large investment to improve their tourism business.
The research method included the study of the current regulations (Table 1), analysis of data from different public statistical organisms (INE e ISTAC), interviews with economic agents, and questionnaires presented to referential businesses in tourism rehabilitation and modernization in the Canary Islands which are exposed in Figure 1. The companies were selected based on the information obtained mainly from reports elaborated and published by the Autonomous Community (Evaluation Report of Law 2/2013, Regional Incentives Data, and others) and due to their presence in the media. On the other hand, the methodology applied for the rehabilitation and modernization of the Canary Islands tourist destination is set out in the article published in Sustainability entitled “A Decision-Making and Governance Framework for the Renewal of Tourism Destinations: The Case of the Canary Islands” [33], being the methodological basis on which this article has been based to show the practical results obtained.
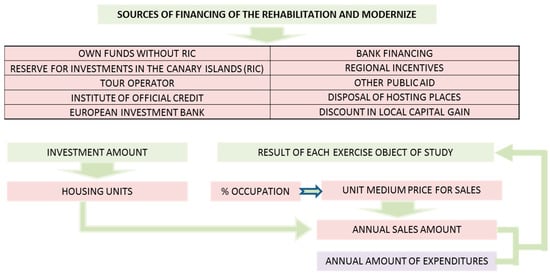
Figure 1.
Rehabilitation incentives and reports used. Source: Elaborated by the authors.
The research referred mainly to the 2013–2016 period, and based on the analysis of the data obtained, medium-term planning was formulated. The period of time that was studied corresponded to the years in which the different incentives analyzed in this work had been implemented together. This is due to the fact that the modernization process has consisted of different stages in which the Canary Islands Government verified the results obtained by the measures [33]. In summary, it was possible to verify that the measures taken have contributed to stimulate the tourism sector in the Canary Islands, becoming a reference model.
In the decision-making process engaged in by the business owners and/or managers, and from a methodological point of view, it was necessary to analyze all the variables in favor of and against making a significant investment. In this regard, it was essential to be familiar with the current incentives and/or sources of funding (Figure 1), the regulatory restrictions in the Canary Islands related to tourism rehabilitation and modernization, as well as data on sales prices from official statistical organisms. We specifically analyzed the sources of income and their evolution over time and used the results as a basis for the projections made.
However, we complemented and updated this information and the treatment of the set of variables to consider in determining the future profitability of tourism companies, using the average values of the five most relevant actions carried out in Gran Canaria. For this purpose, we used the data on occupancy, unit sales price, income, and annual expenditure to make the projections of the results obtained from the renovation and modernization of the accommodations during the period under study (Figure 1).
4. The Case Study
4.1. Incentives and Requirements for Tourism Rehabilitation
Many small and medium-sized companies operating in the extrahotel tourism sector do not have enough financing of their own to take on a minimally ambitious renovation project. We think rehabilitation and modernization has to go beyond a change in furnishings and installations. Specifically, it should be accompanied by a rise in quality and category and contribute to making the tourism destination more attractive.
To this end, business owners have to be advised by specialized technicians in the matter (engineers, architects, interior decorators, etc.) because it is fundamental to know all the territorial planning regulations, as well as those specific to tourism, in order to undertake a project that addresses the increasingly demanding requirements for occupancy, density, buildability, security, quality, etc., that tourist establishments must meet (LRMTC′13 [27] and Decree 142/2010 [34], as Figure 2 shows).
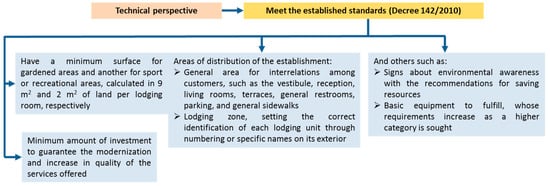
Figure 2.
Technical requirement Decree 142/2010. Source: Elaborated by the authors.
It is not easy to prepare a project. Companies need a minimum of one year to conform to the previously mentioned regulatory requirements. The different owners of an establishment have to agree, and from that point on, time is spent on the elaboration and signing of cooperation agreements to determine the buildability, density, number of rooms, etc., and approve the corresponding licenses for the initiation of the construction work in the time periods established by the public administration. At the same time, it is necessary to negotiate to obtain resources unrelated to financial institutions and design an economic-financial plan that contemplates different alternatives.
The minimum cost of the investment mentioned in Figure 2 was later substantially increased by the LRMTC′13 [27], whose fulfillment, as established in art. 13 (annex), would favor companies by allowing them additional tourist lodging rooms of up to 50% more than what was previously authorized. This quantity could also be increased another 25% for each increase in category level they achieved, starting with a 3-star category and establishing the limit at 100% of the pre-existing rooms. According to the information provided in the annex of this Law, the minimum amount of investment per lodging room (LR) for each category to be reached is established in Table 2.
Table 2.
Minimum amount of the investment by lodging room. Source: Law 2/2013, Annex article 13.
To determine the fulfillment of the previous amounts, it is necessary to divide, as indicated in point 2 of the annex of LRMTC′13 [27], the total amount foreseen for the material execution of the projected work in the building renovation budget, excluding the taxes applied, by the number of lodging rooms authorized in the establishment at the time of the renovation.
We understand that, in this amount, all costs will be included that stem from obligatory additional investments for the adaptation of establishments to tourism standards, fire safety requirements, swimming pools, electric installations, etc. However, there are other costs that are not considered in the Law but are relevant to the business owner. This would be the case of costs resulting from the temporary cessation of the activity, such as the loss of income while the construction lasts and the fixed costs that must be met. In addition, as Simancas [10] indicates, it is also necessary to address costs arising from the increase in the real estate tax rate and the tax on constructions, installations, and works in tourist towns, which has placed greater fiscal pressure on owners of tourism establishments.
It is important to highlight that the owner of a lodging establishment has to determine not only the foreseeable amount of the investment, but also any type of increase in costs that will accompany moving to a higher category, especially from 4 stars on up. Higher quality would involve, for example, rising costs in terms of pay and salaries because it would mean having more personnel to give better service. Specifically, reception service will have to be available 24 h, in addition to other services, such as restaurants, which they might not have had before, but that require more staff. Moreover, the Collective Agreement of the Province of Las Palmas, for example, establishes different pay depending on the category of the lodging establishment, which would mean that the company’s employees would also receive higher pay.
Given the large number of investments beyond those forecasted in the LRMTC′2013 [27], the analysis underlying a business decision involves how to make investments at the lowest cost possible, from an economic and financial point of view, considering the incentives proposed by the public administrations. In this regard, in the 2013–2015 financial years, there were different financing sources that companies could access, including those found in Table 3.
Table 3.
Sources of financing. Source: Elaborated by the authors.
The Canary Investment Reserve (RIC) reduces the corporate tax base up to 90%, as long as the investment is in fixed assets and its provision and materialization leads to the creation of new jobs. This tax incentive can significantly contribute to encouraging private investment in the tourism sector, based on previously accumulated reserves and future provisions after the investment. In any case, we understand that small companies have little margin to obtain large amounts of resources through this mechanism, although it can clearly complement other incentives.
Contributions of tour operators. Given the urgent need to renovate and modernize, and whenever tour operators are interested in improving the quality of the tourist destination, some of them (Tui, Schauinsland, Thomas Cook, and others) have become fully involved with companies that have decided to change. In certain cases, they even contribute to financing the construction work by providing significant funding. In other cases, they simply grant a contract with a minimum guaranteed amount per year, which allows companies to have some security about placing their product on the market and achieving sales income objectives that allow them to obtain profits and pay back loans or credits. We also find a third route of aid that combines the other two, that is, a guarantee is given and a loan is granted, giving the investor greater security. The repayment period for loans and the duration of contracts usually ranges from three to five years when the investment is attractive. Normally, the loans are linked to exclusive contracts for the placement of the lodgings, which represents a security in the payment of the amounts granted, since they are usually deducted from the agreed amounts.
Bank financing, basically coming from the European Investment Bank, has become an important source of financing for renovation and modernization projects of tourism establishments. In December 2013, according to the Evaluation Report of Law 2/2013 [35], the Canary Government signed collaboration agreements with 10 financial entities to facilitate credit for companies. These agreements had among their objectives the achievement of greater competitiveness and improving the tourist destination of the Canary Islands through investment in the modernization and renovation of the hotel and extrahotel offer. The two main islands received 63% of the financial resources, with Gran Canaria benefiting the most, with 34%. These loans are granted for 10 years at interest rates lower than market rates. Guarantees are usually required for their collection, such as the contract signed with the tour operator and, where appropriate, possible subsidies to be obtained. Initially, the investor is forced to resort to this type of loan for more than the required amount, insofar as he has to wait for the payment of all the incentives granted by the administration, at least for a year and a half. However, as these are leading investments with high future returns, there is usually no problem in maintaining the loans granted in their entirety for up to 10 years. It should be noted that in the event of failure of the project, as it is financed by the European Union, it does not have a negative impact on the investor. In the future, it would be liable for the loan pending repayment by the public administration in whole or in part, depending on the conditions negotiated.
Regional Economic Incentives are nonrefundable resources coming from the European Union to foment business activity. They are awarded by the General State Administration (Madrid, Spain) in the form of subsidies and supported by FEDER funds. The Canaries has special treatment due to having these funds to finance construction of the extension and modernization of tourist apartments that reach the 4-star category, with levels of common services, attention, and quality similar to those required by hotel establishments of the same category, and whenever there is no increase in the lodging offer, also taking into account the requirements described in Figure 3.
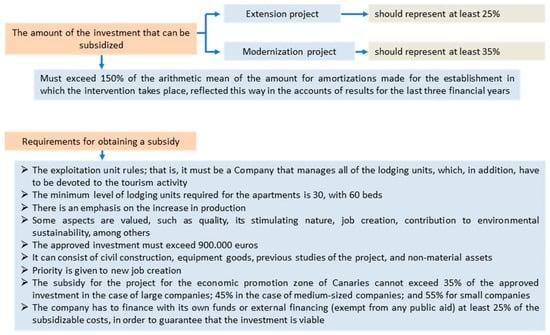
Figure 3.
Amount of the investment and requirements for the subsidy [36,37]. Source: Elaborated by the authors.
According to the Council on Economy, Industry, Commerce and Knowledge (CEICyC) of the Canary Government [38], of the Regional Incentive documents approved for the years 2014 and 2015, related to actions carried out in the tourism sector in the Canary Islands, 13 correspond to apartments that were rehabilitated and acquired the category of 4 stars in 2015, together reaching a subsidy percentage of 28.39%, which in relative terms, exceeds the rest of the actions approved (see Table 4).
Table 4.
Establishments that obtained regional incentives. Source: Elaborated by the authors based on data from the CEICyC.
Other public aid for the public and private sectors that can be applied to carry out renovations. Among them, we can include lines of credit, the Renovation Plan for Tourism Installations (Renove Plan for Tourism), Plan FuturE, or State Financial Funds designated for the Modernization of Tourism Infrastructures (FOMIT).
Transfer of material rights in lodging rooms. In the LRMTC′2013 [27], art. 20 indicates that each Island must create what has been called a bank of beds, through the “tourist registry of lodging rooms”, incorporating the right to grant previous authorizations to new lodging rooms that will have owners and can also be ceded to third parties.
Discounts in capital gains taxes. In the context of the Plan for Modernization, Improvement and Increase in Competitiveness of Maspalomas [25], the Town Hall of San Bartolomé de Tirajana contributes to tourism renovation through an 85% discount in the capital gains generated, corresponding to the mean weighted buildability, which effectively makes the new project possible, depending on the buildability regulation at the time of the intervention, and as long as the project follows the urban plan.
This benefit granted by the Town Hall stems from an urban planning agreement [35] signed by this entity and the owner of the tourist establishment. The objective is the adoption of measures and actions that make it possible to manage, by improving the quality of the lodgings and complementary offer of the tourism core, the appropriate and urgent renovation of the lodging package, making it possible to increase the buildability and percentage of occupancy, the equipment, and the public space. For this purpose, on the one hand, the owner promises to rehabilitate and improve the lodging establishment and adapt it to the standards of quality required by the regulations. On the other hand, the Town Hall is obligated to invest the amount of the capital gains in actions of public use, general systems, and other activities of social interest in the tourism core of San Bartolomé de Tirajana, prioritizing construction to be carried out in the surroundings of the establishment in question, so that the investment made will obtain the desired effects.
One piece of interesting data is that these sources of financing, some of which come from fiscal incentives and subsidies, cannot be accessed by all the owners of tourist apartments. These apartment complexes are largely made up of communities of owners, and many of them do not develop the activity as a business corporation or meet all the requirements contained in the corresponding regulations.
4.2. Determination of the Predicted Income after Tourism Rehabilitation
After examining the sources of financing, it is important to perfectly define the investment project, mainly in two conclusive aspects, in order to program some predicted income in a timeline of between 5 and 10 years. The first aspect is the number of rooms or lodging units to maintain or increase, and the second is the category to reach based on what is stipulated in the current regulations mentioned above.
From the perspective of income, and based on the data published by the ISTAC [27] for San Bartolomé de Tirajana, it can be seen that the step up to a higher category would involve greater occupancy and a higher price per lodging unit and day. Specifically, in the 2013–2016 period (Table 5), we can see that the average daily income obtained per occupied room (ADR), that is, the income perceived only for the lodging service supplied by the tourism apartment establishments, differs considerably depending on whether they have 1 and 2 keys or 3, 4, and 5 stars. In 2013, the divergence in prices is 39.29% between the two groups of categories, declining from that point on to 22.01% in 2015 and 14.60% in 2016.
Table 5.
Mean monthly rate per apartment (ADR). Source: Elaborated by the authors based on data from the ISTAC.
These discrepancies are even more pronounced if we compare the prices weighted by the level of mean occupancy for each year (Table 6), that is, the Revenue Per Available Room (RevPAR: income per available room = % occupancy × ADR), which is the standard measure used in the hotel industry to rate the financial performance of an establishment or chain. Obviously, it is not the same thing to reach high occupancy, which is translated in terms of income into a greater number of rented apartments at previously established fixed rates, as it is to see a lower level of occupancy, with the resulting negative effects on the general income level.
Table 6.
Income per available apartment (RevPAR). Source: Elaborated by the authors based on data from the ISTAC.
The RevPAR is a key magnitude for the analysis of income from the tourism sector. As Table 6 shows, in 2013 and 2014, 3- to 5-star apartments hover around 84%, exceeding the percentage corresponding to 1 and 2 keys, with this difference reaching 38.55% in the last year analyzed. All of this allows us to state that a higher category reveals greater competitiveness because, in spite of charging higher prices per lodging unit, approximately 15% more in 2016, they are clearly in demand, given their higher relative occupancy level. However, annually, higher prices are detected in complexes with 1 and 2 keys, compared to those with 3–5 stars, reducing the differences between the two groups of categories. This may be due to the fact that they have rehabilitated these establishments without significant changes but with improvements that are perceived by clients. In our opinion, a considerable rise in the tourism activity at the end of the economic crisis also contributed to this.
Regarding these indicators, as an example, we considered a 100-unit apartment complex with 1 or 2 keys, and we wanted to find out the increase in its sales, applying the RevPAR, if a process of rehabilitation and modernization of its buildings and installations had been carried out in order to reach the 4-star category without increasing the number of lodging units. Of the calculations made, as Table 7 shows, comparing 2013 and 2016, if we start with a situation where the change occurred in 2014 and/or 2015, the period when the activity stopped for construction work, the increase in sales in 2016, compared to what was obtained in 2013 with a lower category, would be about 87.10% (1.656.735.00/885.490.00) in the hypothetical and complex situation of 100% occupancy. If the rehabilitation and modernization had not been carried out, the increase in sales in 2016, compared to 2013, would reach 35.04%, which shows the greater competitiveness of higher categories compared to lower ones.
Table 7.
Income per available apartment (RevPAR). Source: Elaborated by the authors based on data from the ISTAC.
If, in addition, we decide to increase the number of lodging units in our sample by 20, the increase in sales would be quite significant, as Table 8 shows. The establishment would go from selling 885,490.00 Euros in 2013, with 1 and 2 keys, to selling 1,988,082.00 Euros in 2016, with 4 stars, that is, 124.52% more, which would decidedly contribute to recovering the investment.
Table 8.
Income by available apartments (RevPAR). Source: Elaborated by the authors based on the data from the ISTAC.
However, after analyzing five apartment complexes that have been models for rehabilitation and modernization with a change in category in Gran Canaria (3 of which went from 2 keys to 4 stars, and 2 others that became 4-star hotels from 1 and 3 keys), the information in Table 9 indicates that the developing data (2013–2016), both the RevPAR and the ADR, calculated as the average of the establishments analyzed, exceed those mentioned by the ISTAC [27] in the year 2013. These establishments operate with a significant increase in 2016, which shows that an improvement in complexes makes it possible to increase the income above the mean of the sector.
Table 9.
Income from available lodging units and mean monthly rate. Source: Elaborated by the authors based on data from the companies and the ISTAC.
When comparing the data provided by the companies studied with data from the ISTAC [27] (Table 9), the extrahotel establishments that become hotels increase their prices more than what is officially published by the ISTAC [27] in 2016. The same conclusions can be drawn about apartment complexes that reach the extrahotel category of 4 stars.
Evidence for these conclusions is provided in Figure 4, which shows the evolution of the prices, clearly ascendant in the 2013–2016 period, of the five intervention models with a change in category, the construction work of which was carried out between 2014 and/or 2015, and the data from the ISTAC [27]. In 2014, compared to 2013, we find the same increase in prices as what is yielded by the ISTAC because the renovations of the complexes were carried out in those years. For establishments transformed into hotels, we adopt the criterion that in 2014, they were still apartments. In 2015 and 2016, we consider that the rehabilitation has already taken place. Using the available data, we base our conclusions on the fact that the tour operators maintain the same prices, as long as the cost of living does not increase in these years.
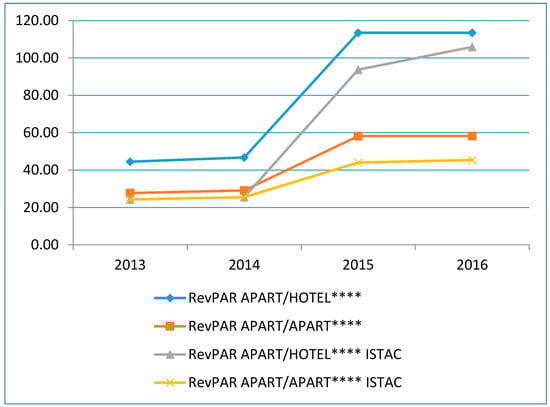
Figure 4.
Income RevPAR hotels and apartments (2013–2016). Source: Elaborated from the data from the 5 companies analyzed and from the ISTAC.
In the case of a hypothetical investment in rehabilitation and modernization, and in order to verify the capacity to generate sufficient resources to carry out the project and satisfy the financial debts derived from it, it is necessary to elaborate a financial plan. To do so, it is important to analyze the evolution of the future income after rehabilitation and modernization based on the monthly income according to the occupancy and the predicted unitary prices for each period or subperiod to be analyzed. Table 10 shows this information for the 2015 financial year (the same estimations were made for 2013), considering that contracts with tour operators normally begin on 1 November and end on 31 October.
Table 10.
Income forecast for 2015. Source: Elaborated by the authors.
4.3. Future Planning of Profitability in the Tourism Rehabilitation Process
Based on the previous conclusions stemming from the ISTAC [29] data related to the ADR and RevPAR, and using the more favorable data for the referential models that have carried out rehabilitation and modernization and maintained their condition as apartments but achieved the category of 4 stars in 2014, we performed a simulation of the predicted income for the 2015 economic financial year, starting with the 2013 data for the same establishments with a 2-key category. In the baseline position in the 2013 financial year, we considered the example of an establishment with 95 apartments that would evolve, after a rehabilitation and modernization process carried out in 2014, into 130 units in 2015 [39].
Table 10 shows a mean annual ADR price of 40.15 Euros and a mean RevPAR of 27.71 Euros. From the perspective of the income, Table 10 shows that, in 2015, the prevalent situation in 2013 would improve considerably. Specifically, the RevPAR would increase by 110.00% to reach 58.19 Euros, whereas the ADR would increase by 65.63%, reaching 66.50 Euros in 2015. In addition, Table 10 also shows the maximum monthly occupancy possible, as well as the forecast, and based on these data, a mean annual occupancy of 69.02% is determined for 2013, compared to an occupancy of 79.90% in 2015.
Analyzing the positive impact of the income, and taking as a reference, as mentioned above, various relevant companies in the sector that have rehabilitated and modernized their apartment complexes, we focus on the study of costs and profitability. In this regard, Table 11 reveals that the impact of the changes made in the buildings and the management, and therefore the cost, is varied, producing a higher increase in apartments that reach the category of hotel and those that increase their number of units and that provide other additional services such as catering, spa, gymnasium, etc., which become a demand to increase the level of occupancy but which we do not consider in our analysis from the financial perspective, as we focus exclusively on the income from accommodation.
Table 11.
% of costs on sales. Source: Elaborated by the authors.
The most relevant costs are those for personnel, whose improvement in training and productivity can contribute to greater profitability [40], as well as the operating costs (in general, those related to the building itself and installations of the lodging units, such as maintenance and conservation costs). We consider some average percentages of these costs, estimated and determined based on the volume of sales in 2013 and 2015, and their relative weight descends from one year to another, as Table 11 shows, when they maintain their extrahotel condition.
Personnel costs, which proportionally have more weight than sales, would vary upward with the same staff, as established in the Collective Labor Agreement [41] regarding category modification. By contrast, with an increase in the number of lodging units and a rise in category, these expenses could increase as a result of the hypothetical hiring of additional personnel, based on the current regulations and the service needs. Our analysis considers an increase of 89.12% in pay and salaries in the sector and in the number of people reasonably integrated in the fixed staff throughout the year and temporary staff in certain periods of greater occupancy. However, the specific weight on the total income of the activity was 29.27% in 2016, compared to 38.19% in 2013.
In another vein, we estimate that the operating costs (Table 12) would rise by 47.74%, whereas the specific weight of the set of these expenses (Table 11) would decline considerably from 2013 (29.25%) to 2015 (17.51%). Supply costs increase by 76.39%, highlighting the specific exiguous weight on the total amount of income (4.78% in 2013 and 3.42% in 2015). In addition, the costs of asset amortization (our forecast is 4.95% annually on the total amount of the project, in our example, 3,990,000 Euros), according to our predictions, is 152.32%. However, the financial costs associated with external financing obtained to carry out the project increase exponentially compared to the prevailing prices, with the financial result maintaining an irrelevant specific weight on the income in 2015.
Table 12.
Account of predicted results for 2013 and 2015. Source: Elaborated by the authors.
We determine the financial result by applying 0.11% to the sales in 2013 and a 2.479% interest rate on the final investment in 2015. The overall increase in costs, excluding financial costs, is 78.86%.
After the rehabilitation and modernization processes of the companies that have an increase in category, the total amount of the costs, specifically in extrahotel establishments, will vary upward to a lesser degree (around 68%), without increasing the number of units. These are mainly fixed costs, which would even lead to a less proportional increase than the increase in sales, as the basic services provided would be practically the same, although with greater quality and more benefits.
Based on this information, Table 12 shows the account of the predicted result for the 2013 and 2015 financial years. We start with the previously mentioned income (generated by 95 and 130 lodging units, respectively), subtracting the amount for the General Indirect Tax of the Canary Islands (IGIC) charged for providing services, as well as other operating income, in reduced amounts, and the costs we calculated, taking into account the estimated percentages on the amount from sales produced by lodging, as shown in Table 11.
As Table 13 shows, the company’s profitability increases considerably when there is a change from 2 keys to 4 stars and/or an increase in the number of lodging units (from 18.24% in 2013 to 41.23% on the income in 2015). From our point of view, this result shows that it is necessary and possible to carry out renovations and contribute to higher quality, leading to the continuity of the sector and making it possible to obtain a profitability that otherwise would not be achieved.
Table 13.
Economic-financial magnitudes.
Regarding the previsions made for 2015, based on the construction work carried out in 2014, we simulated a financial economic plan (Table 13) for a five-year period that includes the forecasts of the company’s results and cash flow. We took into account that among the premises to consider, one of them is that, for the investment made, the company has a five-year contract guaranteed by a tour operator, which contributes definitively to undertaking the project.
The income (RevPAR) was calculated assuming that it will not change during the first two years after the rehabilitation and modernization, based on the data published by the official organizations for the higher category sought, but improved and updated based on the information provided by the companies of reference. From that point on, we understoond that the income increases, for example, by 2% annually, because this is when the new product begins to be consolidated as a 4-star establishment.
Furthermore, it is important to understand the level of occupancy. As Table 10 shows, we estimated that in the first year (2015), it will be 79.90% of the 2015 predicted income, somewhat inferior to future projections. In successive years, due to the consolidation of the new product, we thought the previous figure would increase by 6.5 points the second year and by 5 points the third, with this latter percentage remaining steady. We estimated that the guaranteed amount of sales would respond to approximately 60% occupancy.
Regarding the costs for supplies, personnel, and operating, compared to 2015, we thought they would remain unchanged in 2016, and in successive years, they would increase about 2%, the same percentage we proposed for the income. However, the amortization costs remained the same, and the financial costs fluctuated according to the capital pending, applying the fixed interest rate of 2.479%.
The debt was distributed by percentage, taking into consideration the different financing sources mentioned: 32.5% for funding from the financial system (BEI) and mainly responding to the application of the company’s own funds (companies usually have reserves for investments in the Canary Islands, but they do not have enough cash flow for this application) and 37.5% for the part facilitated by the tour operator. Likewise, there was a 30% subsidy of the total investment, assuming that this would be collected in the second year (2016) after the construction work was done, with a corporate tax rate of 25%.
The simulation portrayed in Table 14 serves as a base, adapting the baseline premises to the specific case for their generalized application by hotel and extrahotel tourist establishments that want to undertake a tourism rehabilitation project in order to increase profitability, and taking into account the possible financing debts to tour operators and/or the financial system and possible public aid. The fundamental variable to consider is the potential future income, which, as our analysis shows, grows exponentially, and the maximum amounts guaranteed by intermediaries in tour operations.
Table 14.
Economic-financial plan 2015–2019. Source: Elaborated by the authors.
In conclusion, all the variables studied in the medium term evolve quite favorably because they make it possible to obtain an outcome of much greater growth than before the rehabilitation work and a cash flow that contributes to easily paying debts. These forecasts may seem a priori overoptimistic. However, it must be borne in mind that an increase in the joint demand for tourists to a tourist destination, or even a decrease, will always be redirected towards accommodation establishments. On the other hand, a nonrenovated accommodation would have greater problems in obtaining an income that would guarantee its profitability. Modernization is also a market requirement that is valued by tour operators and banks, which offer their loans because they consider that they will obtain a return with a reasonable level of risk.
5. Conclusions
In complicated times, at the microeconomic level, business owners and managers have to make decisions about their businesses that can lead to achieving greater competitiveness. However, many decisions have to be made about markets, target customers, prices, strategic future projects, reorganization of the activity, etc., and in the case of small- and medium-sized companies, doubts about these issues are amplified.
They often do not have enough financing (own resources, access to credit, agreements with tour operators, etc.) to address necessary renovations in their tourist establishments. In addition, it is normal for them to lack the appropriate information or advice, from a regulatory point of view, about the context in which to undertake a new and novel project. They even have limited knowledge about possible administrative aids to apply to it.
Among the sources of financing, in addition to the support of tour operators, we can highlight the Canary Islands Government’s support for collaboration agreements with financial institutions to facilitate credit for companies. Moreover, the Canaries receives special treatment in terms of European financing because it can also be applied to tourism modernization and extension work on apartments to reach the category of 4 stars.
In addition, the Town Hall of San Bartolomé de Tirajana contributes to tourism renovation by applying an 85% discount to the capital gains taxes generated, corresponding to the weighted mean buildability. This discount makes the new project possible, based on the current buildability regulation at the time of carrying out the intervention, and as long as it follows the urban planning ordinance.
However, it should be pointed out that not all owners of tourism establishments have access to the financing sources, some of which stem from tax incentives and subsidies. The majority of the owners form parts of communities of owners, and many do not develop the activity under the format of a business corporation or meet all the requirements contained in the corresponding regulations.
From an income perspective, it is evident that the investor’s decision has to be in favor of rehabilitation and modernization due to the positive effects of the increase in category and quality. The analysis of the data from the ISTAC allows us to state that a higher category corresponds to greater competitiveness because, in spite of charging higher prices per lodging unit, approximately 15% more in 2016, they are clearly more in demand. The accommodations have a greater relative occupancy level, especially extrahotel establishments that are transformed into hotels, which increased their prices more than what was officially published by the ISTAC in 2016. The same thing can be said about the apartment complexes that reached the extrahotel category of 4 stars.
Table 13 shows an economic-financial planning model, based on the analysis performed in one of the main tourist destinations in Europe. Its baseline hypotheses, duly selected and tabulated, make it possible to conclude that, depending on the degree of ambitiousness of the project (increase in the number of lodging units and category), the collocation of the new product on the market will be favored by rehabilitation and modernization because higher prices will undoubtedly lead to greater income without producing a proportional increase in costs.
Author Contributions
The authors have contributed equally in the research design and development, the data analysis and the writing of the paper. The authors have read and approved the final manuscript.
Conflicts of Interest
The authors declare no conflict of interest.
References
- Lee, C.-H.; Yu, Y.-H. Characteristics of public–private partnerships for municipal wastewater treatment in Taiwan. J. Chin. Inst. Eng. 2012, 35, 245–258. [Google Scholar] [CrossRef]
- Albu, R.-G. The importance of the public–private partnerships for sustainable local development of tourism. In Proceedings of the 2nd Advances in Hospitality and Tourism Marketing and Management, Corfu, Greece, 31 May–3 June 2012. [Google Scholar]
- Cezar, M. Tourism development based on European and national funding programs in the Bihor County’s disadvantaged mining áreas. In Revista Română de Geografie Politică; Editura Universitatii din Oradea: Oradea, Romania, 2012; pp. 99–108. ISSN 1454-2749. E-ISSN 2065-1619. [Google Scholar]
- Balogh, M.; Coroş, M.M.; Negrea, N.; Coroş, M.E. The impact of European funds upon the tourism development in Macroregion one from Romania. In Transylvanian Review of Administrative Sciences; Babes Bolyai University: Cluj-Napoca, Romania, 2010; pp. 5–27. [Google Scholar]
- Gruescu, R.; Pirvu, G.; Nanu, R. Ways of raising finance for the improvement of tourism potential and tourism services. In Proceedings of the 5th WSEAS International Conference on Economy and Management Transformation (EMT) (Volume I), Timisoara, Romania, 24–26 October 2010. [Google Scholar]
- Hawkins, D.E.; Mann, S. The World Bank’s role in tourism development. Ann. Tour. Res. 2007, 34, 348–363. [Google Scholar] [CrossRef]
- Hayakawa, T.; Rivero, M. Local Economic Development and Tourism; Responsible Tourism Series; World Bank: Washington, DC, USA, 2009; pp. 1–4. [Google Scholar]
- Rosenberg, S.; Larkin, P. Massachusetts’ Regional Tourism Facilities. J. State Gov. 2002, 75, 33–34. [Google Scholar]
- Dorta, R.A. Algunos Apuntes Sobre la Renovación Hotelera Como Estrategia de Reestructuración de Destinos Turísticos Consolidados; Escuela Universitaria de Turismo: Zaragoza, Spain, 2012; Volumes 3–4, pp. 33–37. [Google Scholar]
- Simancas, C.; Moisés, R. La Renovación Edificatoria de la Oferta Turística de Alojamiento en Destinos Consolidados: La Experiencia de Canarias; Cuadernos de Geografía: Valencia, Spain, 2010; pp. 23–44. [Google Scholar]
- Marinoiu, A.-M.; Viciu, C.; Andreea, R. Short review on European Turism in 2010 through the influence of the financial crisis. In Proceedings of the 7th Edition of the International Conference “European Integration—New Challenges”, Oradea, Romania, 27–28 May 2011; pp. 64–71. [Google Scholar]
- Organización Mundial del Turismo. Panorama OMT del Turismo Internacional; Organización Mundial del Turismo: Madrid, Spain, 2016. [Google Scholar]
- Exceltur. Informe de Perspectivas Turísticas-Valoración Turística Empresarial de 2015 y Perspectiva Para 2016; Exceltur: Madrid, Spain, 2016. [Google Scholar]
- Gobierno de Canarias (2015). Estudio del Impacto Económico del Turismo Sobre la Economía y el Empleo de las Islas Canarias. Available online: http://www.gobiernodecanarias.org/cmsgobcan/export/sites/turismo/downloads/estadistica/file/20 14/IMPACTUR-Canarias-2015.pdf (accessed on 20 October 2017).
- Santos Chinea, M.C.; Simancas Cruz, M.R.; Hernández Martín, R. Incentivos económicos a la renovación de alojamientos turísticos: El mercado de derechos materializables en plazas alojativas. In Cuadernos de Estudios Empresariales; Universidad Complutense de Madrid: Madrid, Spain, 2013; Volume 23, pp. 11–26. ISSN 1131-6985. [Google Scholar]
- Cáceres Morales, E.; Palop Casado, J. Estudio de Las Condiciones y Características de la Planta Alojativa Turística de Playa del Inglés; Cabildo de Gran Canaria, Las Palmas de Gran Canaria: Madrid, Spain, 2007. [Google Scholar]
- González Hernández, M.; León González, C.J.; Padrón Fumero, N. Obsolescencia y Políticas de Renovación Medioambiental en el Sector Turístico; Cuadernos Económicos de ICE: Madrid, Spain, 2006; pp. 153–176. [Google Scholar]
- Simancas Cruz, M.R.; de Souza Iglesias, A.M.; Núñez Cano, M. La Renovación de los Espacios Públicos de las Áreas Turísticas Consolidadas; Destinos Turísticos Maduros Ante el Cambio Reflexiones Desde Canarias; Universidad de La Laguna: La Laguna, Spain, 2010. [Google Scholar]
- Canary Government. Acuerdo Por la Competitividad y la Calidad del Turismo en Canarias 2008–2020; Gobierno de Canarias: Canarias, Spain, 2008.
- Canary Government. Law 7/1995, 6 April 1995. De Ordenación del Turismo de Canarias; (B.O.C. 48, de 19.4.1995); Canary Government: Canary Islands, Spain, 1995.
- Canary Government. Law 5/1999, 15 March 1999. De Modificación de la Ley 7/1995, de 6 de Abril, de Ordenación del Turismo de Canarias; Canary Government: Canary Islands, Spain, 1995.
- Canary Government. Law 6/2001, 23 July 2001. De Medidas Urgentes en Materia de Ordenación del Territorio y del Turismo de Canarias; (B.O.C. 92, de 26.7.2001); Canary Government: Canary Islands, Spain, 2001.
- Canary Government. Law 19/2003, 14 April 2003. por la Que se Aprueban las Directrices de Ordenación General y Las Directrices de Ordenación del Turismo de Canarias; (B.O.C. 73, de 15.4.2003; c.e. B.O.C. 91, de 14.5.2003); Canary Government: Canary Islands, Spain, 2003.
- Canary Government. Law 6/2009, 6 May 2009. De Medidas Urgentes en Materia de Ordenación Territorial Para la Dinamización Sectorial y la Ordenación del Turismo; (B.O.C. 89, de 12.5.2009); Canary Government: Canary Islands, Spain, 2009.
- Canary Government. Law 2/2012, 8 May 2012. De Ampliación Temporal de la Ley 6/2009, de 6 de Mayo, de Medidas Urgentes en Materia de Ordenación Territorial Para la Dinamización Sectorial y la Ordenación del Turismo, en Cuanto a los Límites que Establece al Otorgamiento de las Autorizaciones Turísticas; (B.O.C. 93, de 11.5.2012); Canary Government: Canary Islands, Spain, 2012.
- Canary Government. Law 2/2013, 29 May 2013. De Renovación y Modernización Turística de Canarias; (B.O.C. 103, de 31.5.2013); Canary Government: Canary Islands, Spain, 2013.
- Canary Government. Law 9/2015, 27 April 2015. De Modificación de la Ley 2/2013, de 29 de Mayo, de Renovación y Modernización Turística de Canarias, y de Otras Leyes Relativas a la Ordenación del Territorio, Urbanismo, Medio Ambiente, y Asimismo de la Ley 4/2014, de 26 de Junio, por la que se Modifica la Regulación del Arbitrio Sobre Importaciones y Entregas de Mercancías en las Islas Canarias; (B.O.C. 87, de 8.5.2015); Canary Government: Canary Islands, Spain, 2015.
- Instituto Canario de Estadística (Instac). Evolución de los apartamentos turísticos en Canarias 2010–2016. Available online: http://www.gobiernodecanarias.org/istac/jaxi-istac/menu.do?uripub=urn:uuid:40dab52d-bc0e-4986-969c-05d6b9260959 (accessed on 25 October 2017).
- Arbogast, D.; Deng, J.; Maumbe, K. DMOs and Rural Tourism: A Stakeholder Analysis the Case of Tucker County, West Virginia. Sustainability 2017, 9, 1813. [Google Scholar] [CrossRef]
- Zamfir, A.; Corbos, R.-A. Towards Sustainable Tourism Development in Urban Areas: Case Study on Bucharest as Tourist Destination. Sustainability 2015, 7, 12709–12722. [Google Scholar] [CrossRef]
- Cetin, G.; Alrawadieh, Z.; Dincer, M.Z.; Istanbullu Dincer, F.; Ioannides, D. Willingness to Pay for Tourist Tax in Destinations: Empirical Evidence from Istanbul. Economies 2017, 5, 21. [Google Scholar] [CrossRef]
- Rodríguez-Díaz, M.; Rodríguez-Díaz, R. A Decision-Making and Governance Framework for the Renewal of Tourism Destinations: The Case of the Canary Islands. Sustainability 2018, 10, 310. [Google Scholar] [CrossRef]
- Gobierno de Canarias. Planes Para la Modernización, Mejora e Incremento de la Competitividad del Sector Turístico; Gobierno de Canarias: Canarias, Spain, 2013. [Google Scholar]
- Gobierno de Canarias. Decreto 142/2010, de 4 de Octubre. Por el Que se Aprueba el Reglamento de la Actividad Turística de Alojamiento y se Modifica el Decreto 10/2001, por el que se Regulan los Estándares Turísticos; Gobierno de Canarias: Canary Islands, Spain, 2010. [Google Scholar]
- Gobierno de Canarias. Memoria de Evaluación de la Ley 2/2013 de Renovación y Modernización Turística de Canarias (MELRMTC); Gobierno de Canarias: Canarias, Spain, 2014. [Google Scholar]
- Consejo Rector de Incentivos Regionales. Criterios de Selección de Proyectos de Establecimientos Turísticos no Hoteleros en la Comunidad Autónoma de Canarias; Consejo Rector de Incentivos Regionales: Canary Islands, Spain, 2010. [Google Scholar]
- Consejo Rector de Incentivos Regionales. Ordenación y Funcionamiento del Sistema de Incentivos Regionales Para el Período 2014–2020; Consejo Rector de Incentivos Regionales: Canary Islands, Spain, 2015. [Google Scholar]
- Ayuntamiento de San Bartolomé De Tirajana. Convenio Urbanístico Iltmo. Ayuntamiento de la Villa de San Bartolomé de Tirajana a Firmar con las Empresas con el fin de Incentivar y Posibilitar Jurídicamente el Proyecto de Rehabilitación del Establecimiento de Alojamiento Turístico; Ayuntamiento de San Bartolomé De Tirajana: San Bartolomé De Tirajana, Spain, 2012. [Google Scholar]
- Consejería de Economía, Industria, Comercio Y Conocimiento—GOBCAN. Web Consejería-Promoción Económica-Subvenciones-Incentivos Regionales; Consejería de Economía, Industria, Comercio Y Conocimiento—GOBCAN: Canary Islands, Spain, 2016. [Google Scholar]
- Sancho Pérez, A.; Simarro Parreño, R. Análisis Comparativo de la Rentabilidad y Productividad de Las Empresas Hoteleras en el Mercado Europeo. Rev. Anál. Turíst. 2008, 5, 4–15. [Google Scholar]
- Dirección General de Trabajo. Convenio Colectivo del Sector de la Hostelería de la Provincia de las Palmas 2012–2013–2014–2015; Boletín Oficial de la Provincia de Las Palmas: Las Palmas, Spain, 2013. [Google Scholar]
© 2018 by the authors. Licensee MDPI, Basel, Switzerland. This article is an open access article distributed under the terms and conditions of the Creative Commons Attribution (CC BY) license (http://creativecommons.org/licenses/by/4.0/).