Article

Cost Implication of Implementing External Facade Systems for Commercial Buildings

1
Engineering and Mathematics, School of Computing, Western Sydney University, Penrith NSW 2751, Australia
2
College of Civil Engineering, Shenzhen University, Shenzhen 518060, China
*
Author to whom correspondence should be addressed.
Sustainability 2018, 10(6), 1917; https://doi.org/10.3390/su10061917
Submission received: 9 May 2018 / Revised: 31 May 2018 / Accepted: 7 June 2018 / Published: 7 June 2018

Abstract

:
The significance of cost effectiveness in sustainable design has heightened over the past ten years due to the need for reducing building operational expenses and improving environmental quality. This paper determines life-cycle cost over a 20-year period for eleven external facade systems from seven Australian capital cities. Factors affecting life-cycle expenditure in implementing external facade systems of commercial buildings are considered, including construction cost, space heating and cooling cost, maintenance cost and rental loss due to the thickness of external facade systems. The most cost-effective external facade system is identified for each city. Double-glazing facade is found to be the most cost-effective system in Sydney; however, masonry-veneer facade performs the best overall. This paper can provide insight for commercial design teams in designing buildings with cost-effectiveness and sustainable throughout its life-cycle and highlight the importance of a holistic cost review at design stage in ensuring client satisfaction.

1. Introduction

It has been found that, over the past 100 years, global average surface temperature has increased about 0.7 °C [1]. The average temperature of Australia has risen by about 1 °C since 1910. Although the increases sound minimal, they have significantly impacted the world’s climate. The importance of cost effective and sustainable building design has thus been heightened due crippling effects of the global financial crisis and a growing awareness of the damaging effects greenhouse gases inflict on the environment. Currently, some initiatives and standards have been implemented by governments and private bodies to promote green buildings, for example, Green Star environmental assessment system in Australia [2], Building Research Establishment Environmental Assessment Method in United Kingdom [3], the Hong Kong Building Environmental Assessment Method from Hong Kong [4] and the Leadership in Energy and Environmental Design from United Status [5].
Concern pertaining to global warming encourages designers to investigate sustainable building practices [6]. Sustainable construction is developed as a method to promote resource efficiency with the minimization of environmental disturbance. Buildings have significant impacts on the environment, consuming about 32% of the world’s resources, including about 12% of the world’s fresh water and up to 40% of its energy [7]. Buildings also produce about 40% of construction and demolition waste sent to landfill and about 40% of air emissions [7]. Commercial buildings produce about 8.8% of the national greenhouse gas emissions and play a major role in meeting Australian and international greenhouse gas targets.
Sustainable building should consider a life-cycle approach to the entire process, from design and construction to building operation and maintenance [8,9]. It should also promote using sustainable materials in an efficient manner and designs that minimize the use of energy, water and other resources over the entire building’s life. It is easy to say that goals need to be established, but many designers and owners struggle with what green design is and what green/sustainable goals should be established [10]. Establishing goals early in the project planning stage is the key for developing a cost-effectiveness green design [11,12].
Buildings constructed in a sustainable manner are commonly perceived to incur higher cost than conventional buildings and often are deemed not worth the additional cost [13,14]. It was found that average premium for sustainable buildings is about 2% (or $10–16/m2) higher than traditional buildings. The majority of the cost is due to the increased architectural and engineering design time, modeling cost and time necessary to integrate sustainable building practices into projects. In general, the earlier green building features are incorporated into design process, the lower the cost is [14,15]. Financial benefits achieved by the efficient use of resources enable benefits which could not be achieved by conventional buildings, including saving water and energy, reducing waste generation, improving indoor environmental quality and occupants’ comfort/productivity, reducing occupants’ medical cost and lower building operation and maintenance cost [14,16].
Energy efficient features affecting air conditioning and lighting can easily be incorporated and implemented in design stage. A key method to minimize energy use in a building is to optimize the use of energy, which can be achieved by implementing passive design techniques such as using material with high thermal mass and use of natural lighting [17,18]. Design must consider the use of appropriate sizes of lighting, heating and cooling systems and also determine appropriate zoning and sensors [19,20]. The use of building management systems is an effective means for reducing buildings’ energy consumption. The selection of material with low embodied energy can reduce environmental impacts of building and also has the potential to deliver savings on energy bills and building maintenance cost [6,21,22]. The use of renewable energy in the operation of building increases long-term building sustainability and reduces the amount of energy provided by non-renewable sources [23,24].
A study compiled by the Australian Bureau of Statistics found that electricity is the largest source of energy in the commercial buildings sector at about 65% followed by gas at about 25%, petroleum products about 7% and coal at about 3% [25]. Electricity accounts for about 89% of total greenhouse gas emissions, while gas accounts for only 7% of total emissions. It was also found that electricity prices have increased about 61.3%, 56.8%, 50.7%, 35.9%, 35.8% and 16% for Sydney, Melbourne, Brisbane, Darwin, Perth and Adelaide, respectively, over the last five years [25].
Previous studies have identified that wall insulation plays an important role in reducing energy used by the buildings [26,27,28]. Building insulation can reduce running cost of space heating and cooling at the expense of an increase in the initial investment by the addition of insulation material [29,30,31]. Limited studies have considered the thickness of facade system increasing the loss of rentable building space. An ideal medium needs to be identified where the insulation rating reduces space heating and cooling cost, however does not significantly encroach on the rentable space of buildings.
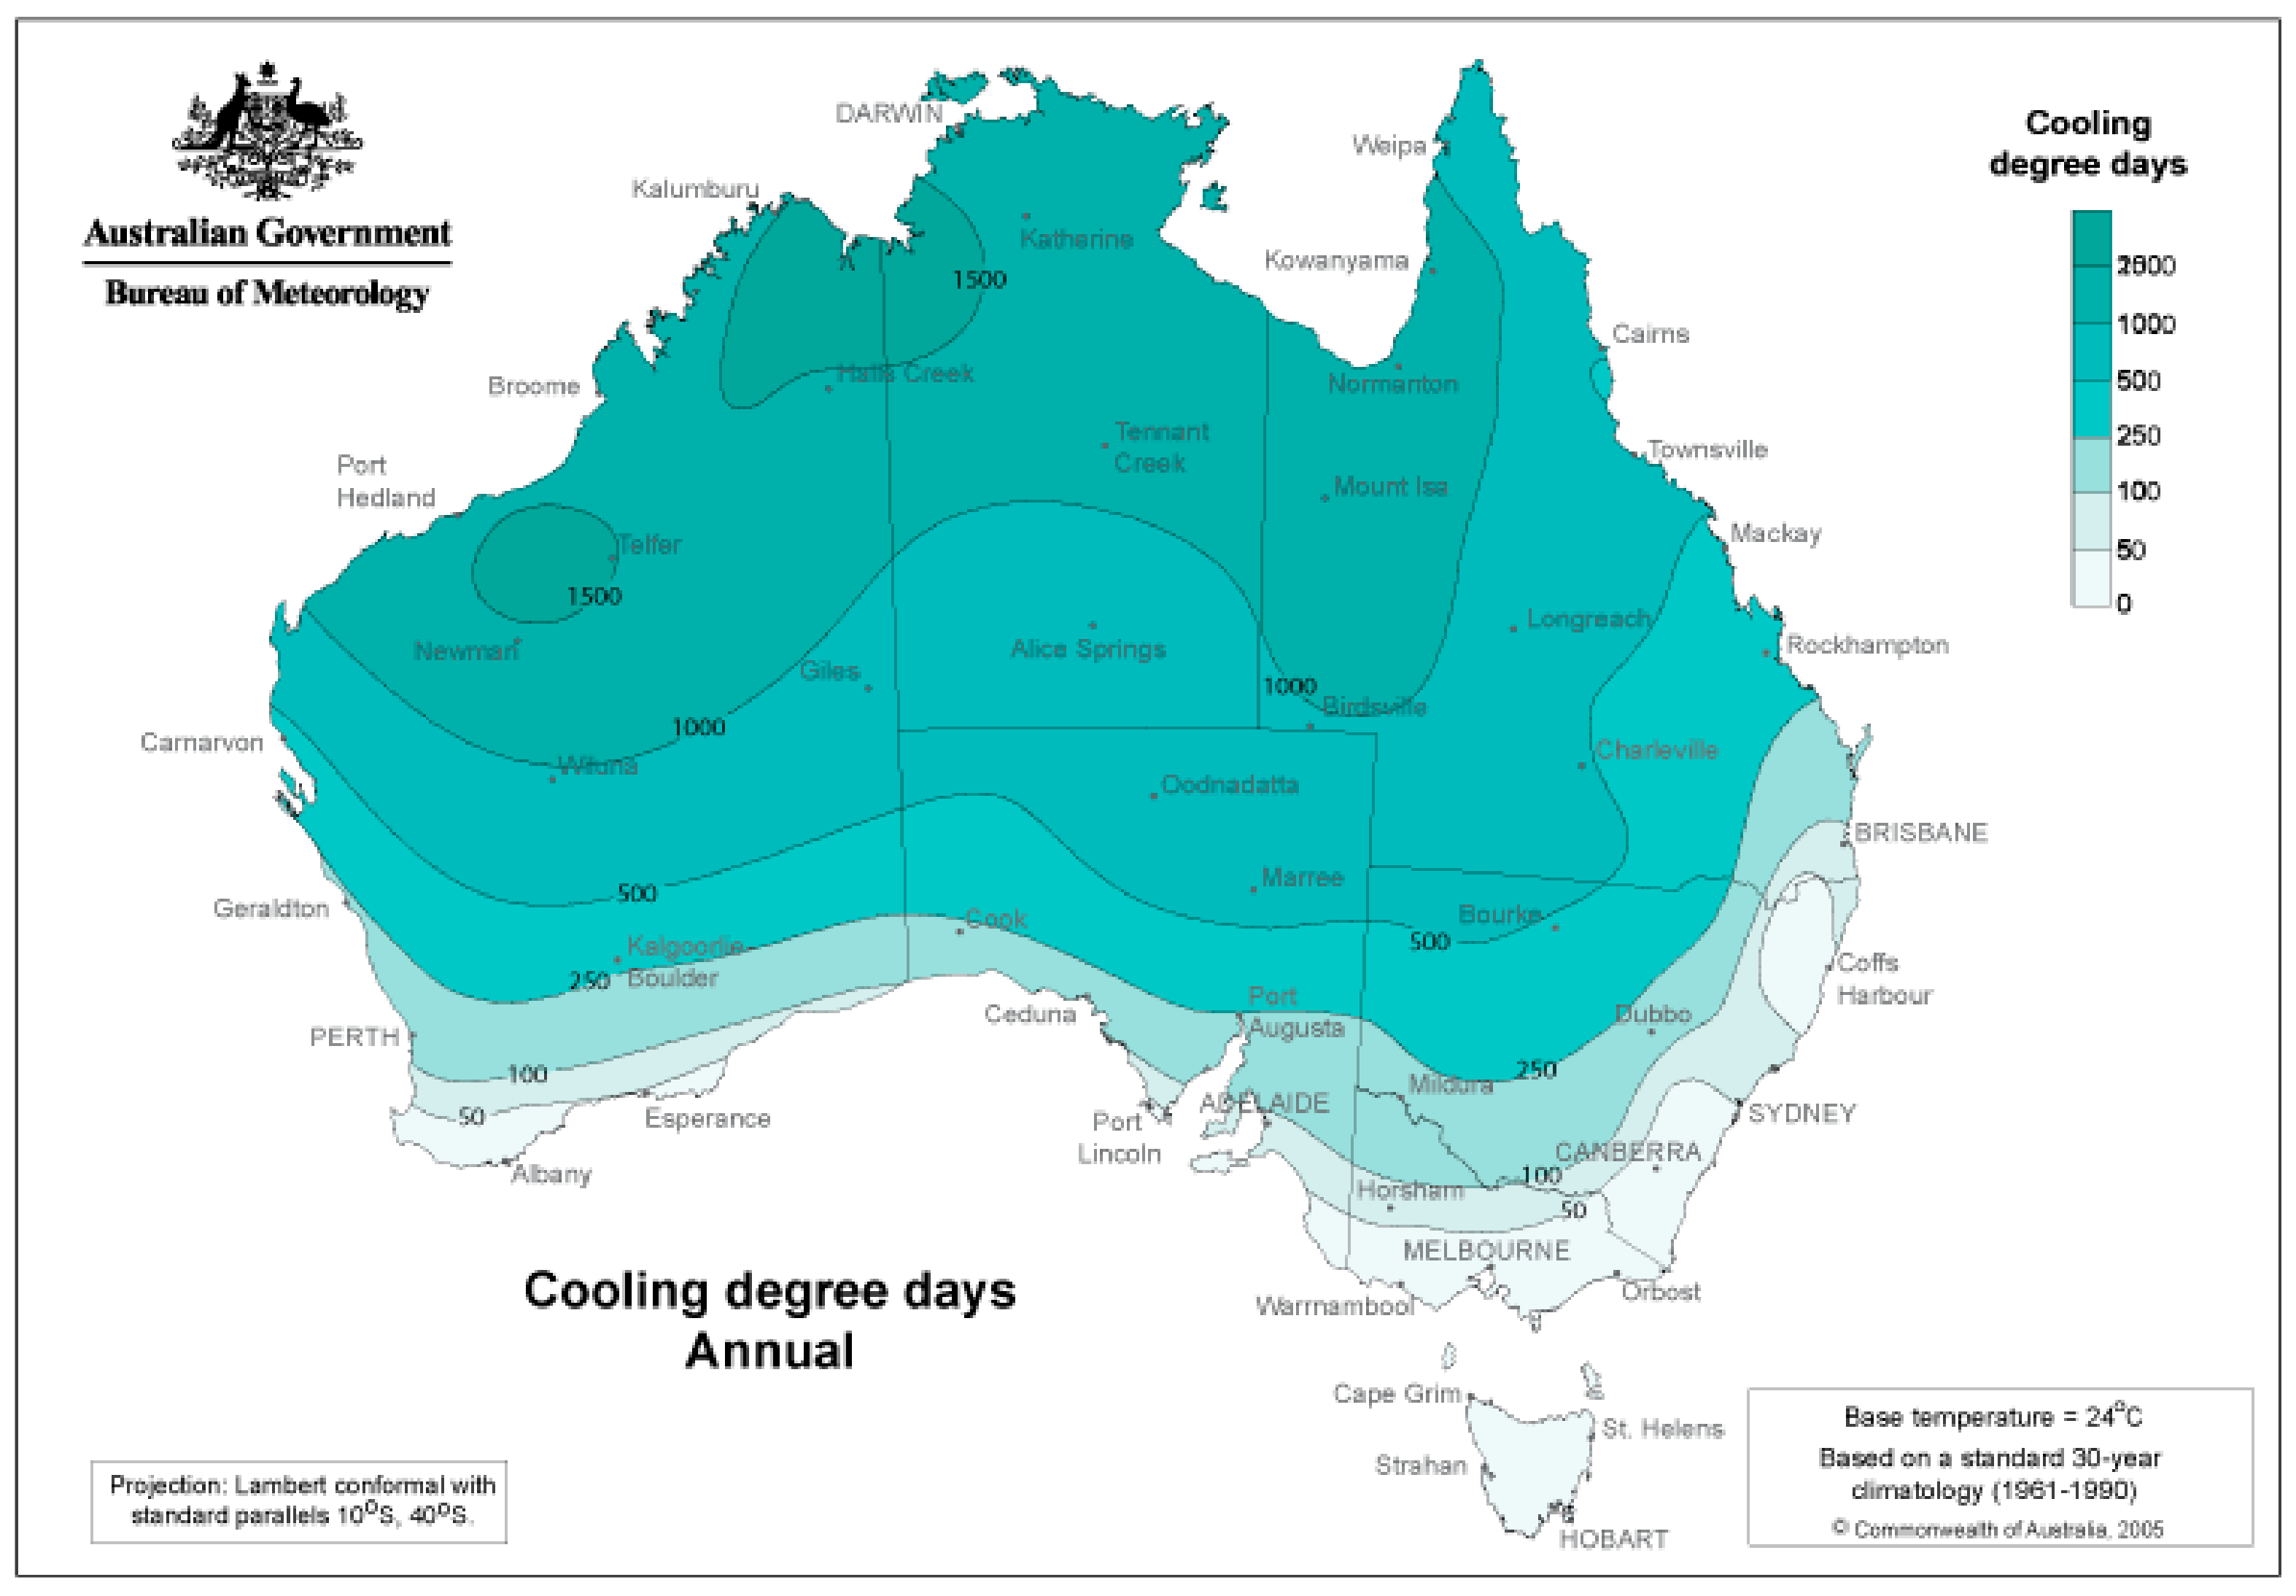
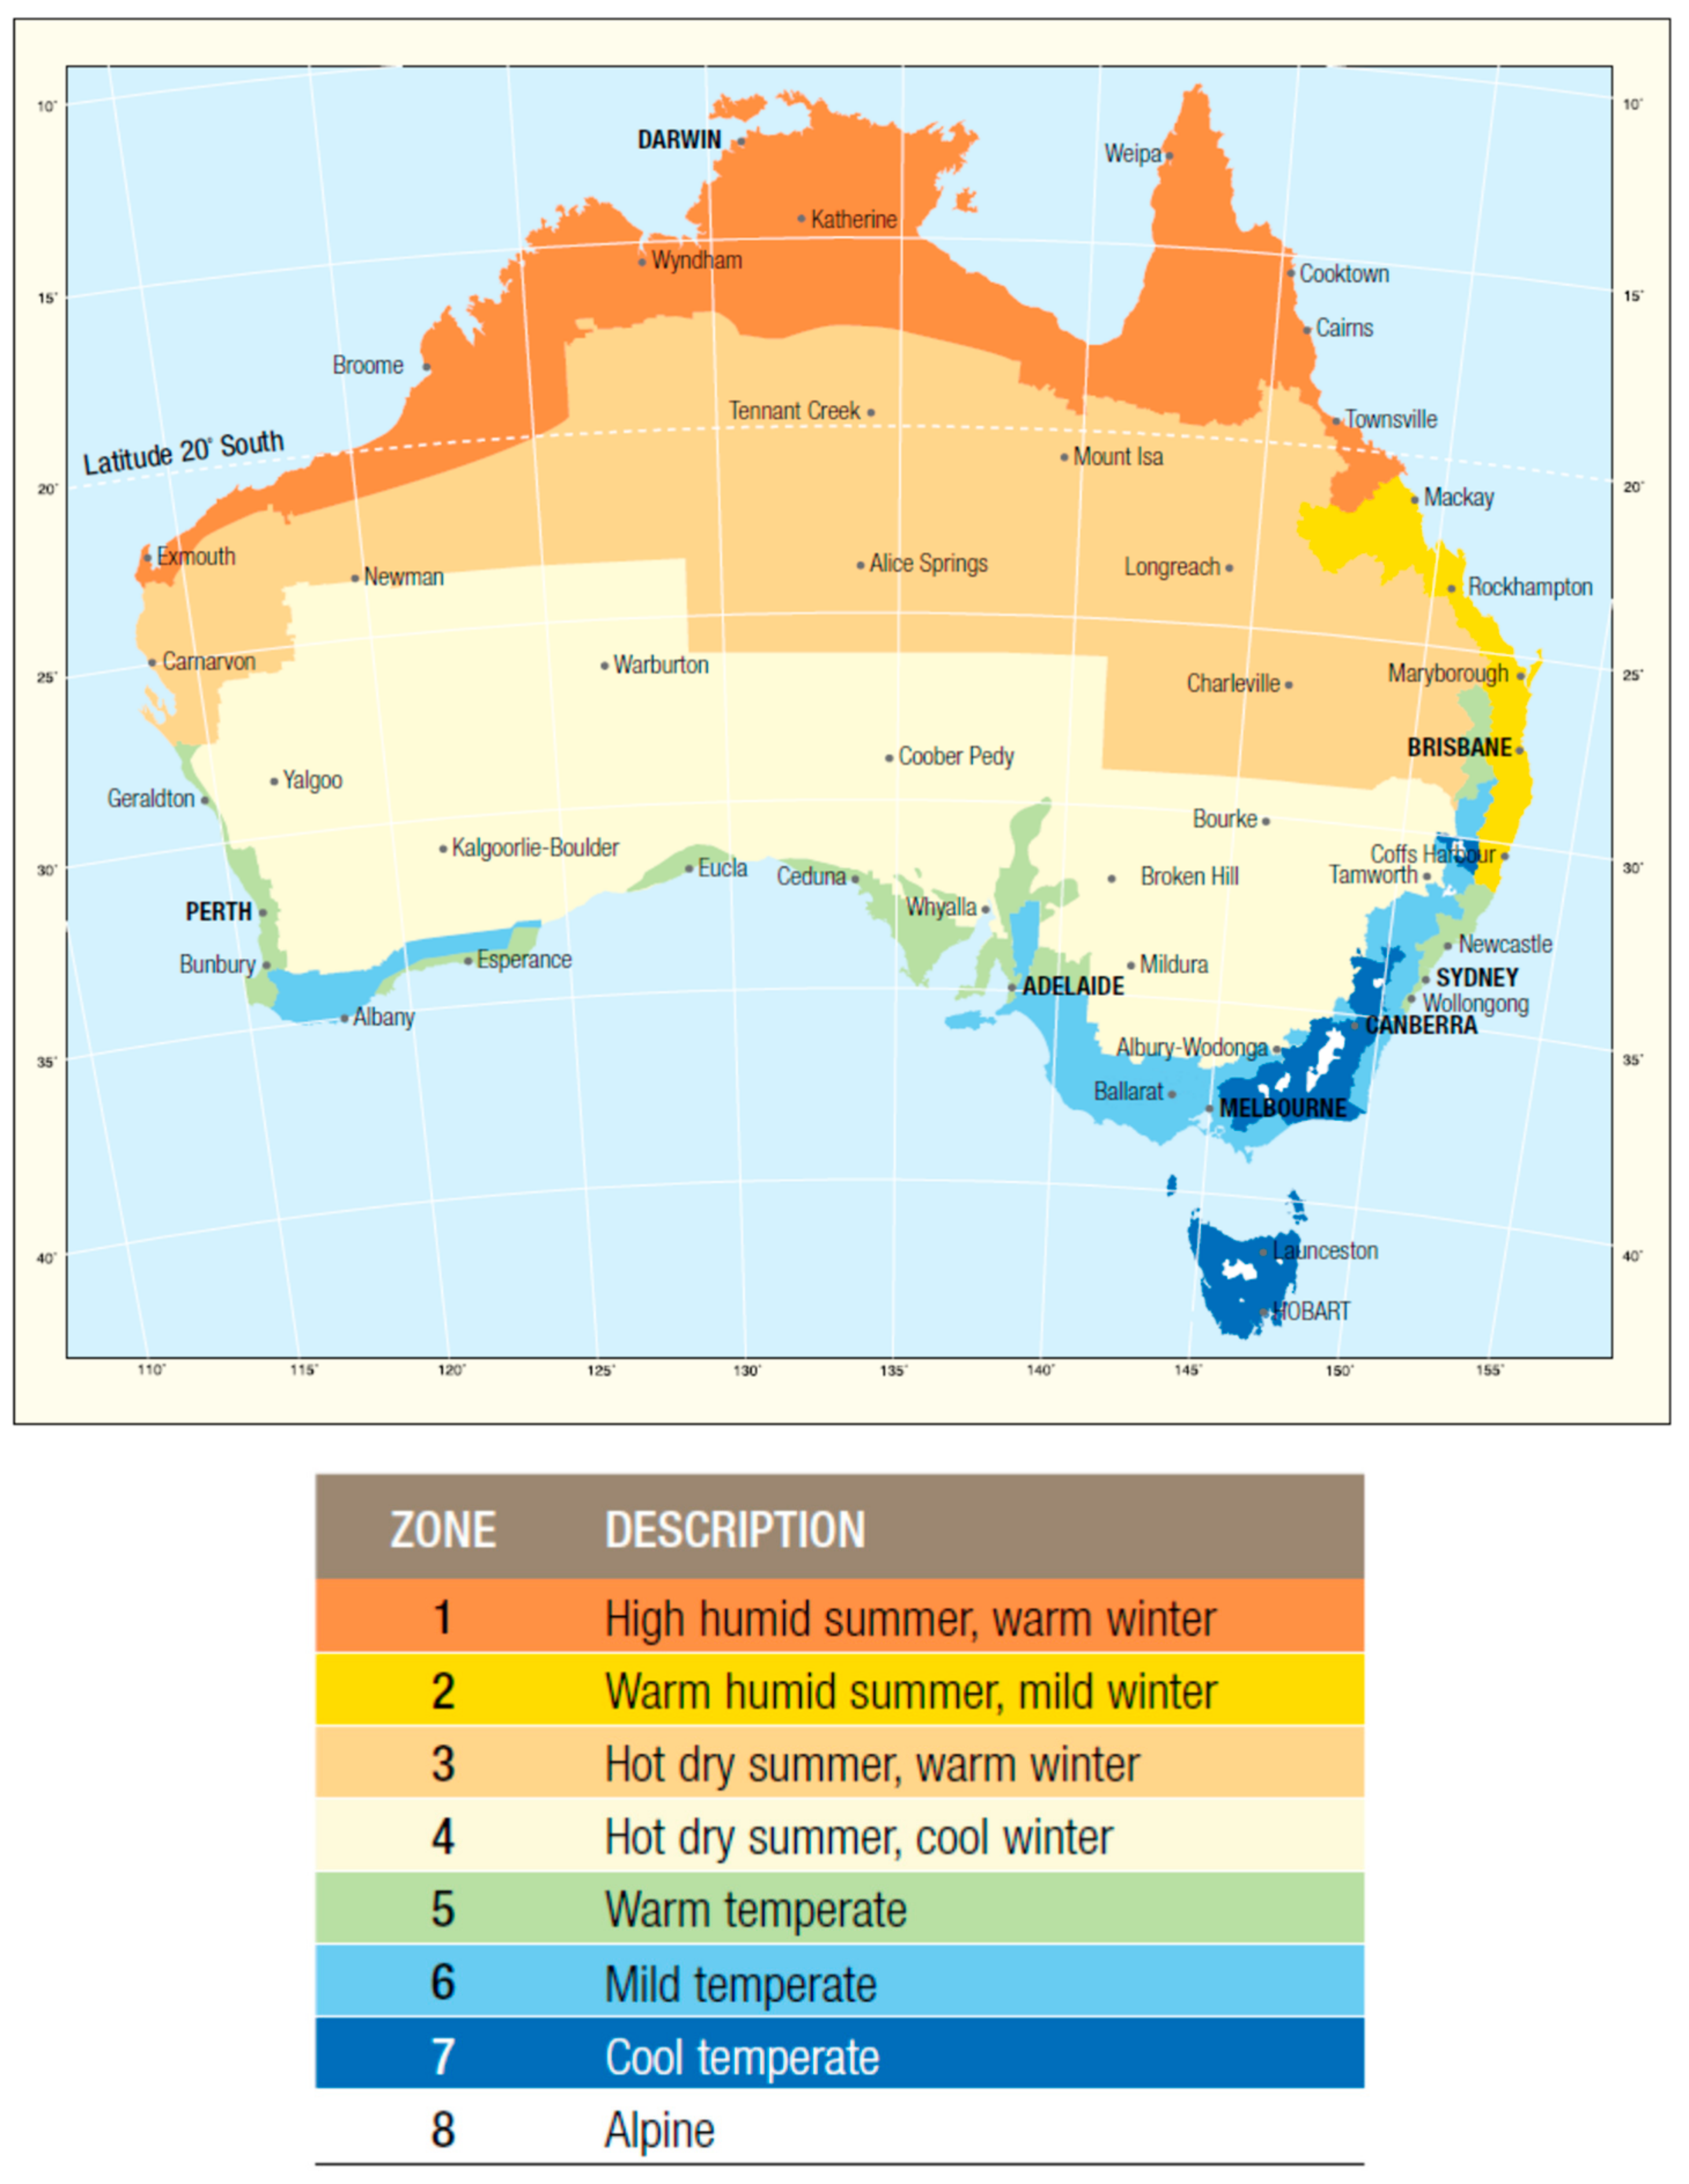
Australia has a broad range of climate conditions due to its size. The weather can range from below zero temperatures in the snowy mountains to intolerable heat in the northwest. The large variances in temperatures require modifications in building techniques and material for ensuring the building is suitable for its locations. Australia has been split into eight climate zones: (i) Zone 1, high humid summer warm winter; (ii) Zone 2, warm humid summer, mild winter; (iii) Zone 3, hot dry summer, warm winter; (iv) Zone 4, hot dry summer, cool winter; (v) Zone 5, warm temperate; (vi) Zone 6, mild temperate; (vii) Zone 7, cool temperate; and (viii) Zone 8, Alpine [32]. Figure 1 illustrates different climate zones in Australia and Table 1 identifies design techniques which can be incorporated into the construction of buildings for each climate zone, which also highlight the importance of insulating the external elements of buildings in ensuring the buildings with sustainable and energy efficient.
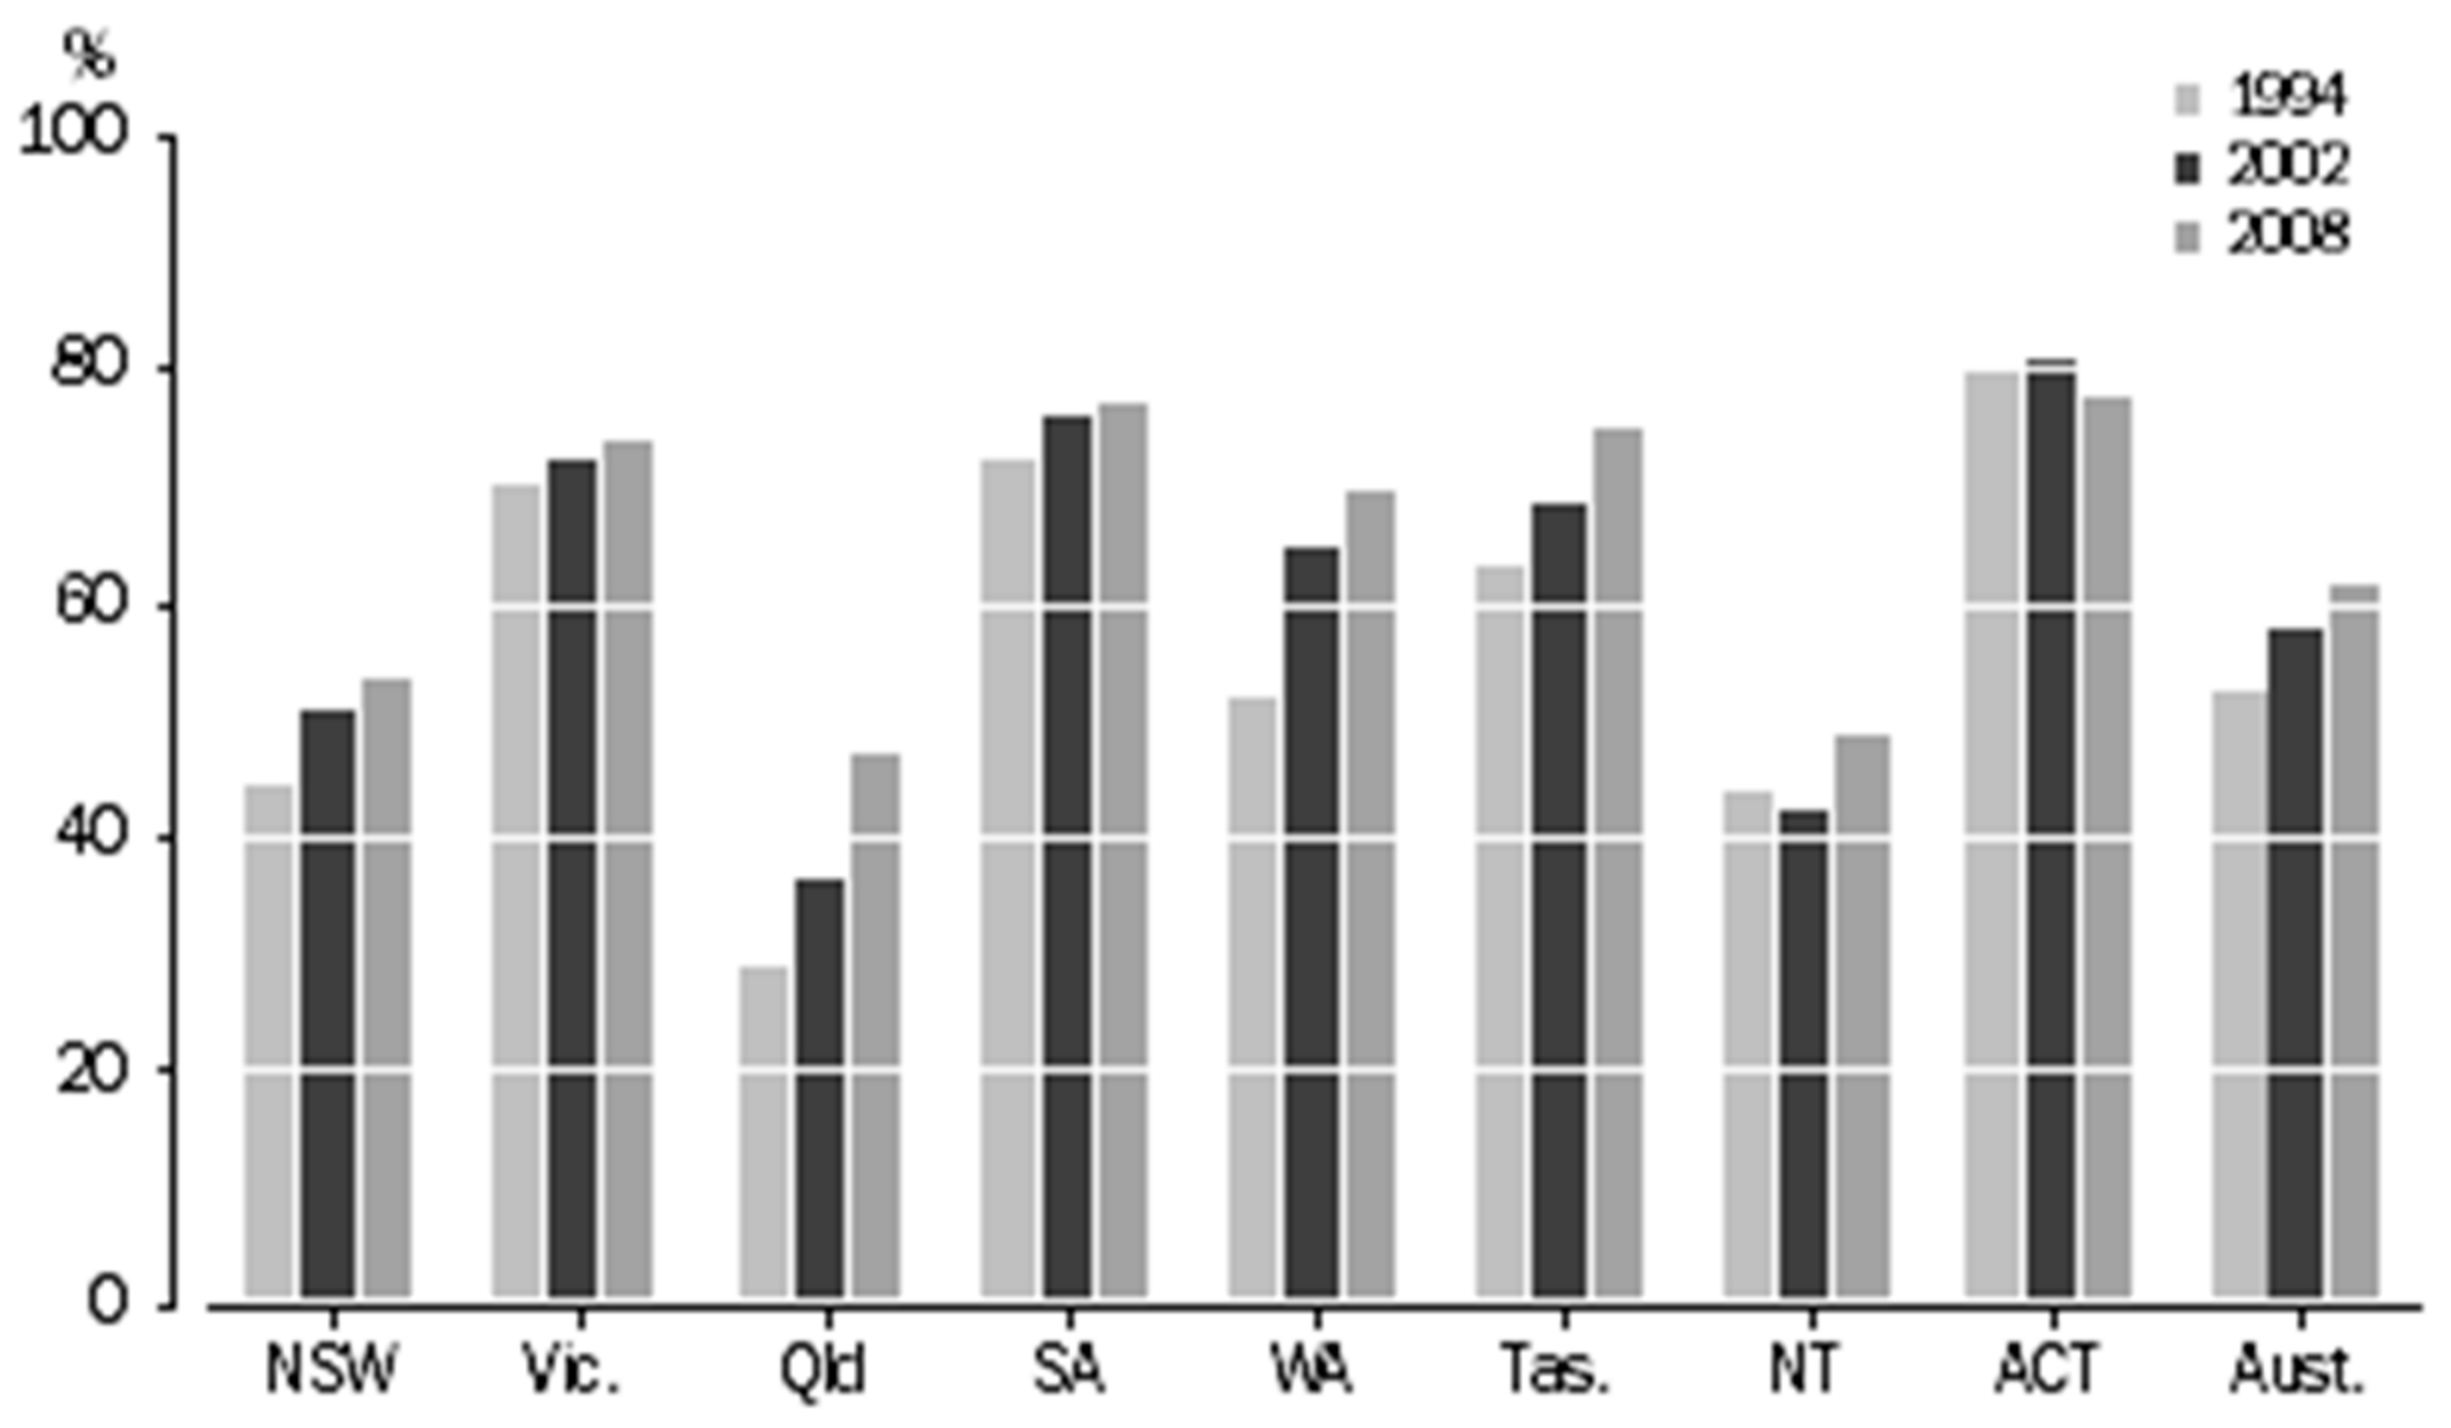
The use of insulation in Australian dwellings has increased over the years of 1994–2008, as shown in Figure 2. It is found that dwellings located in a hot-temperate climate such as Northern Territory and Queensland, have a lower percentage of insulated dwellings compared to the climates that are less extreme. This is highlighted by the lack of education provided from developers and home owners.
The recent statistics from Australian Bureau of Statistics [33] found that Australian population incorporates insulation into the construction or refurbishment of their dwellings mainly for achieving comfort (about 83%). Savings on energy bills and reductions in energy use were relatively minor factors (about 11% and 4%, respectively). Of those households with no insulation, “not home owner/not responsible” was reported as the main reason for not having insulation (about 34%), followed by “cost” (about 17%) and “have not considered it” (about 12%). Heat penetration into a building can be significantly reduced with the inclusion of insulation within the facade systems, thus assisting the building for achieving thermal comfort for its occupants [34]. Increasing the insulating property of facade systems can improve thermal energy performance of the building and of course provide cost-effectiveness [35,36]. The above results recorded in previous studies have raised concerns over the education by the state and territory governments on the importance of incorporating insulation into building design.
Cost implications of facade systems are becoming critical to buildings’ life-cycle cost and the environment [37,38,39]. Due to the escalating electricity prices and growing awareness of the damaging effects from greenhouse gases to the environment, construction design teams are concentrating on delivering cost effective yet environmentally sustainable designs. For a designer to achieve the above criteria, they must understand all factors that will affect building performance [40].
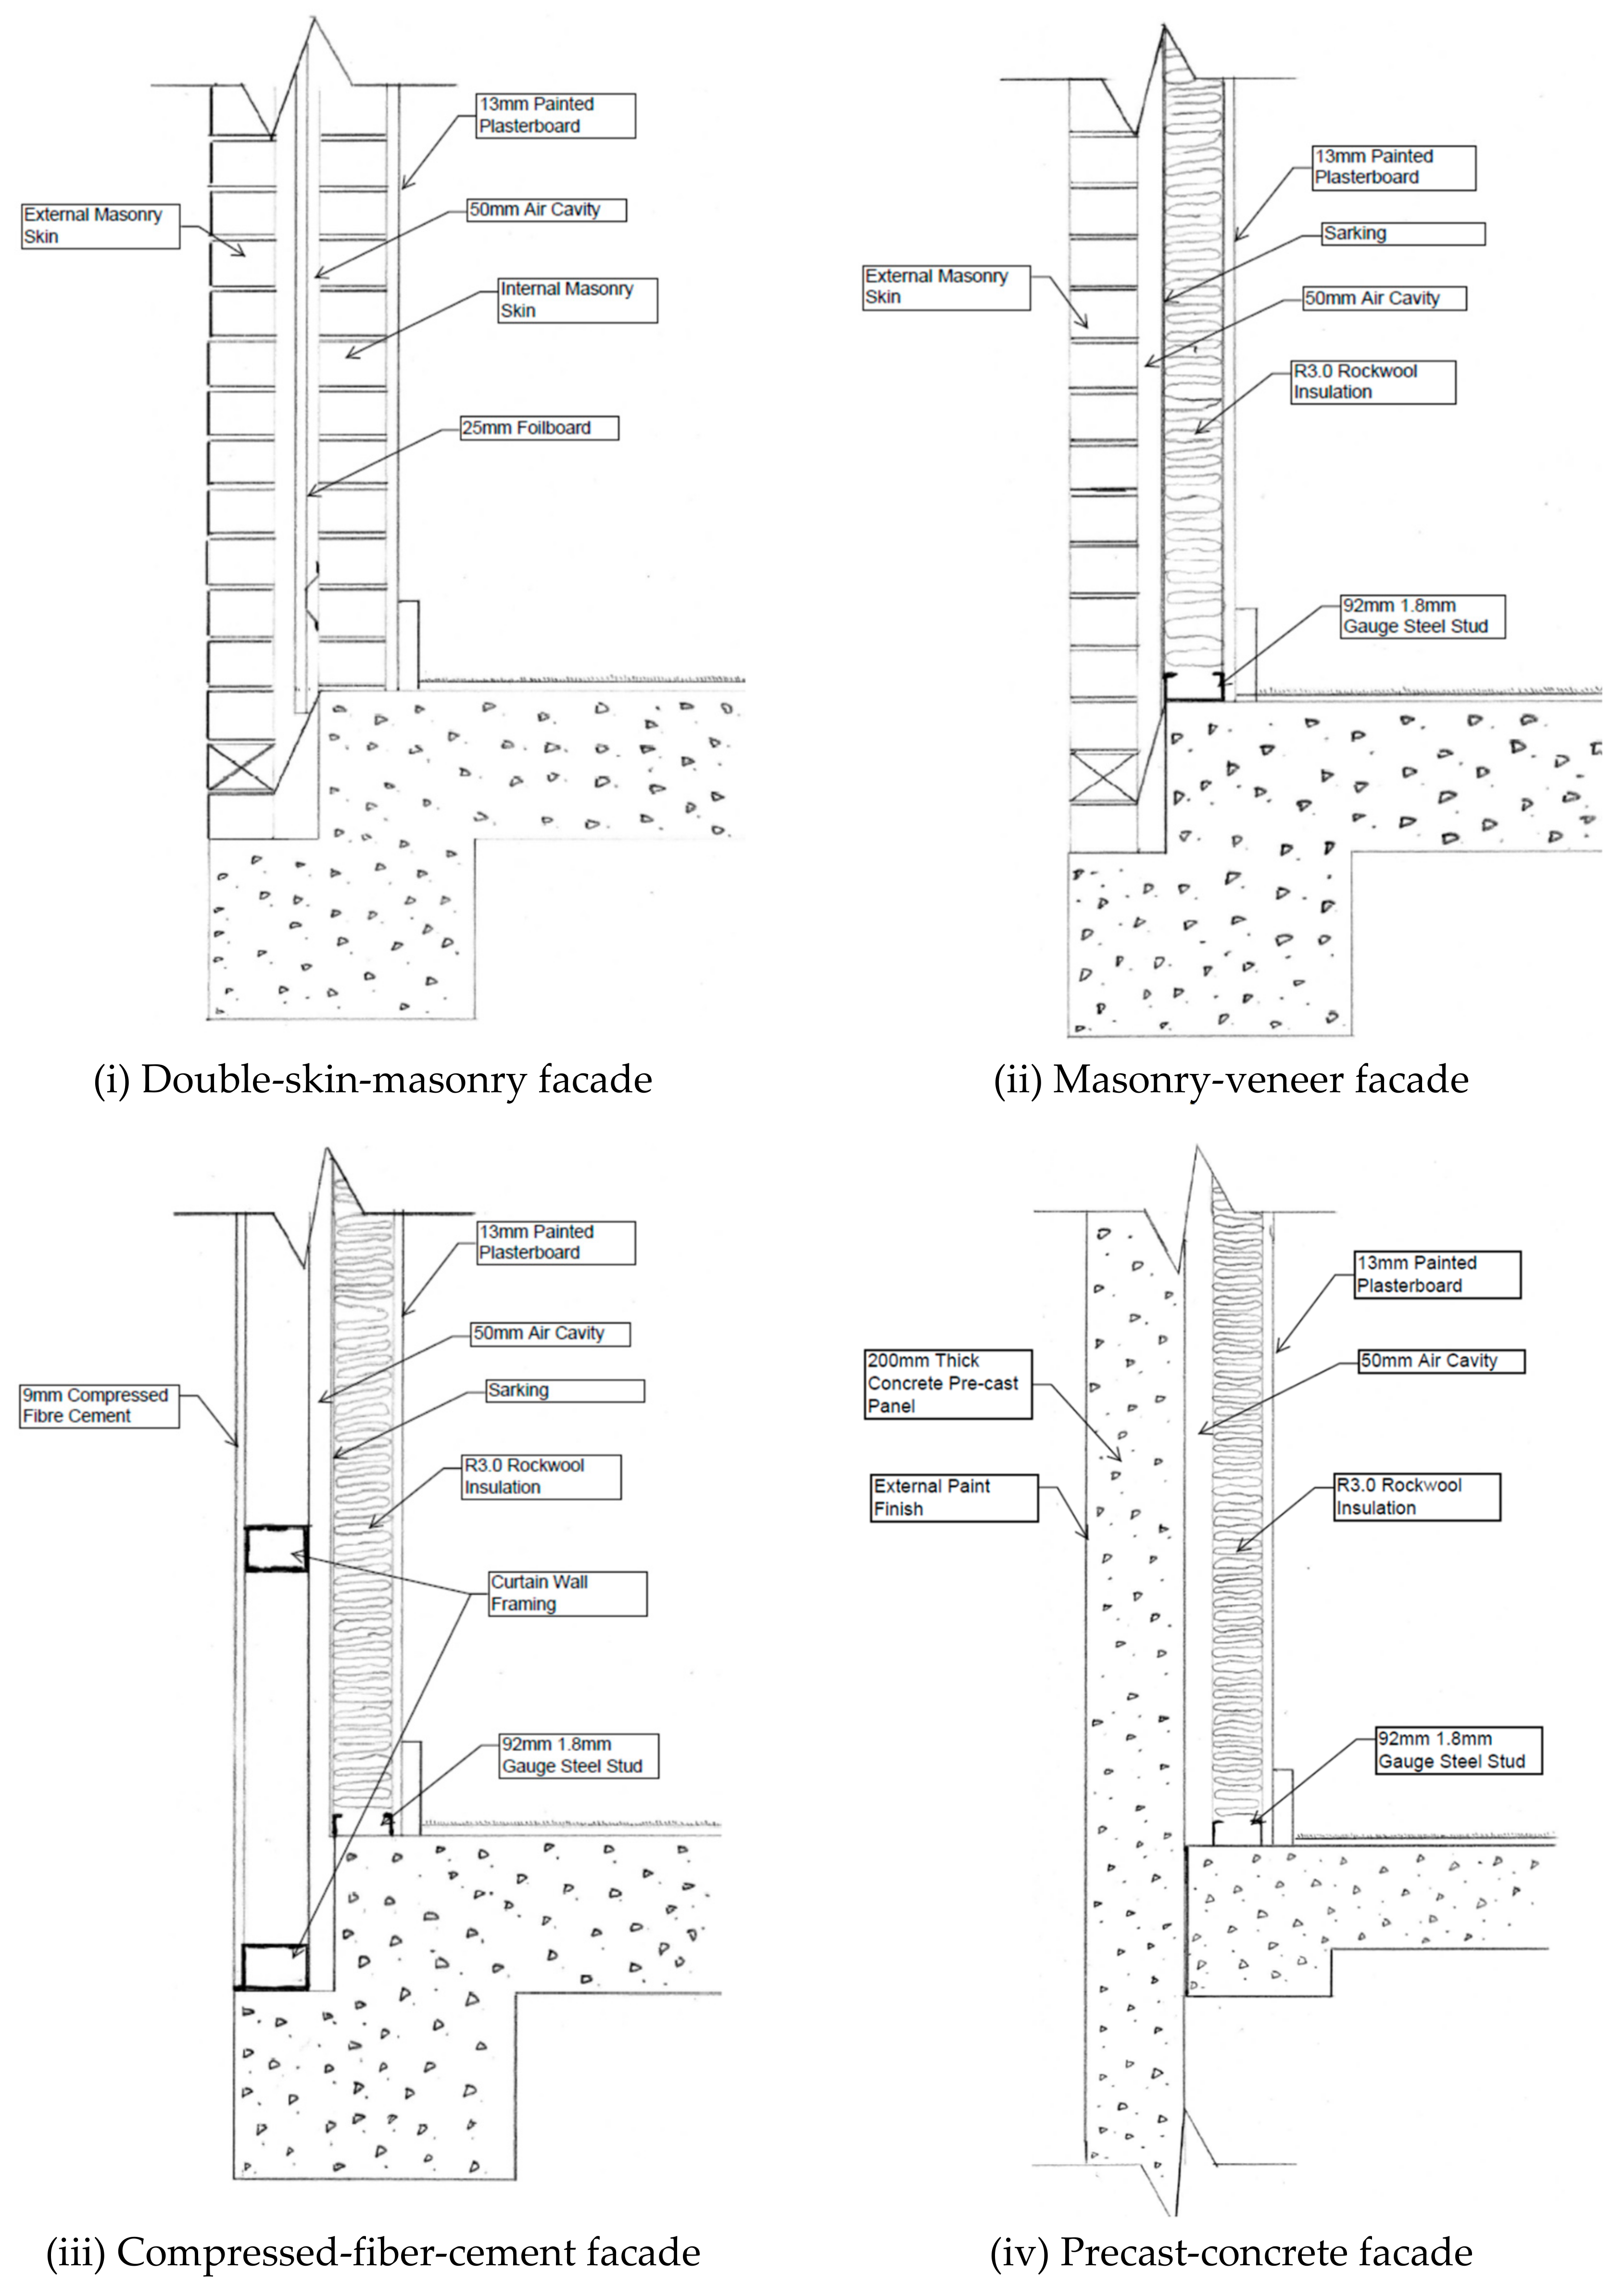
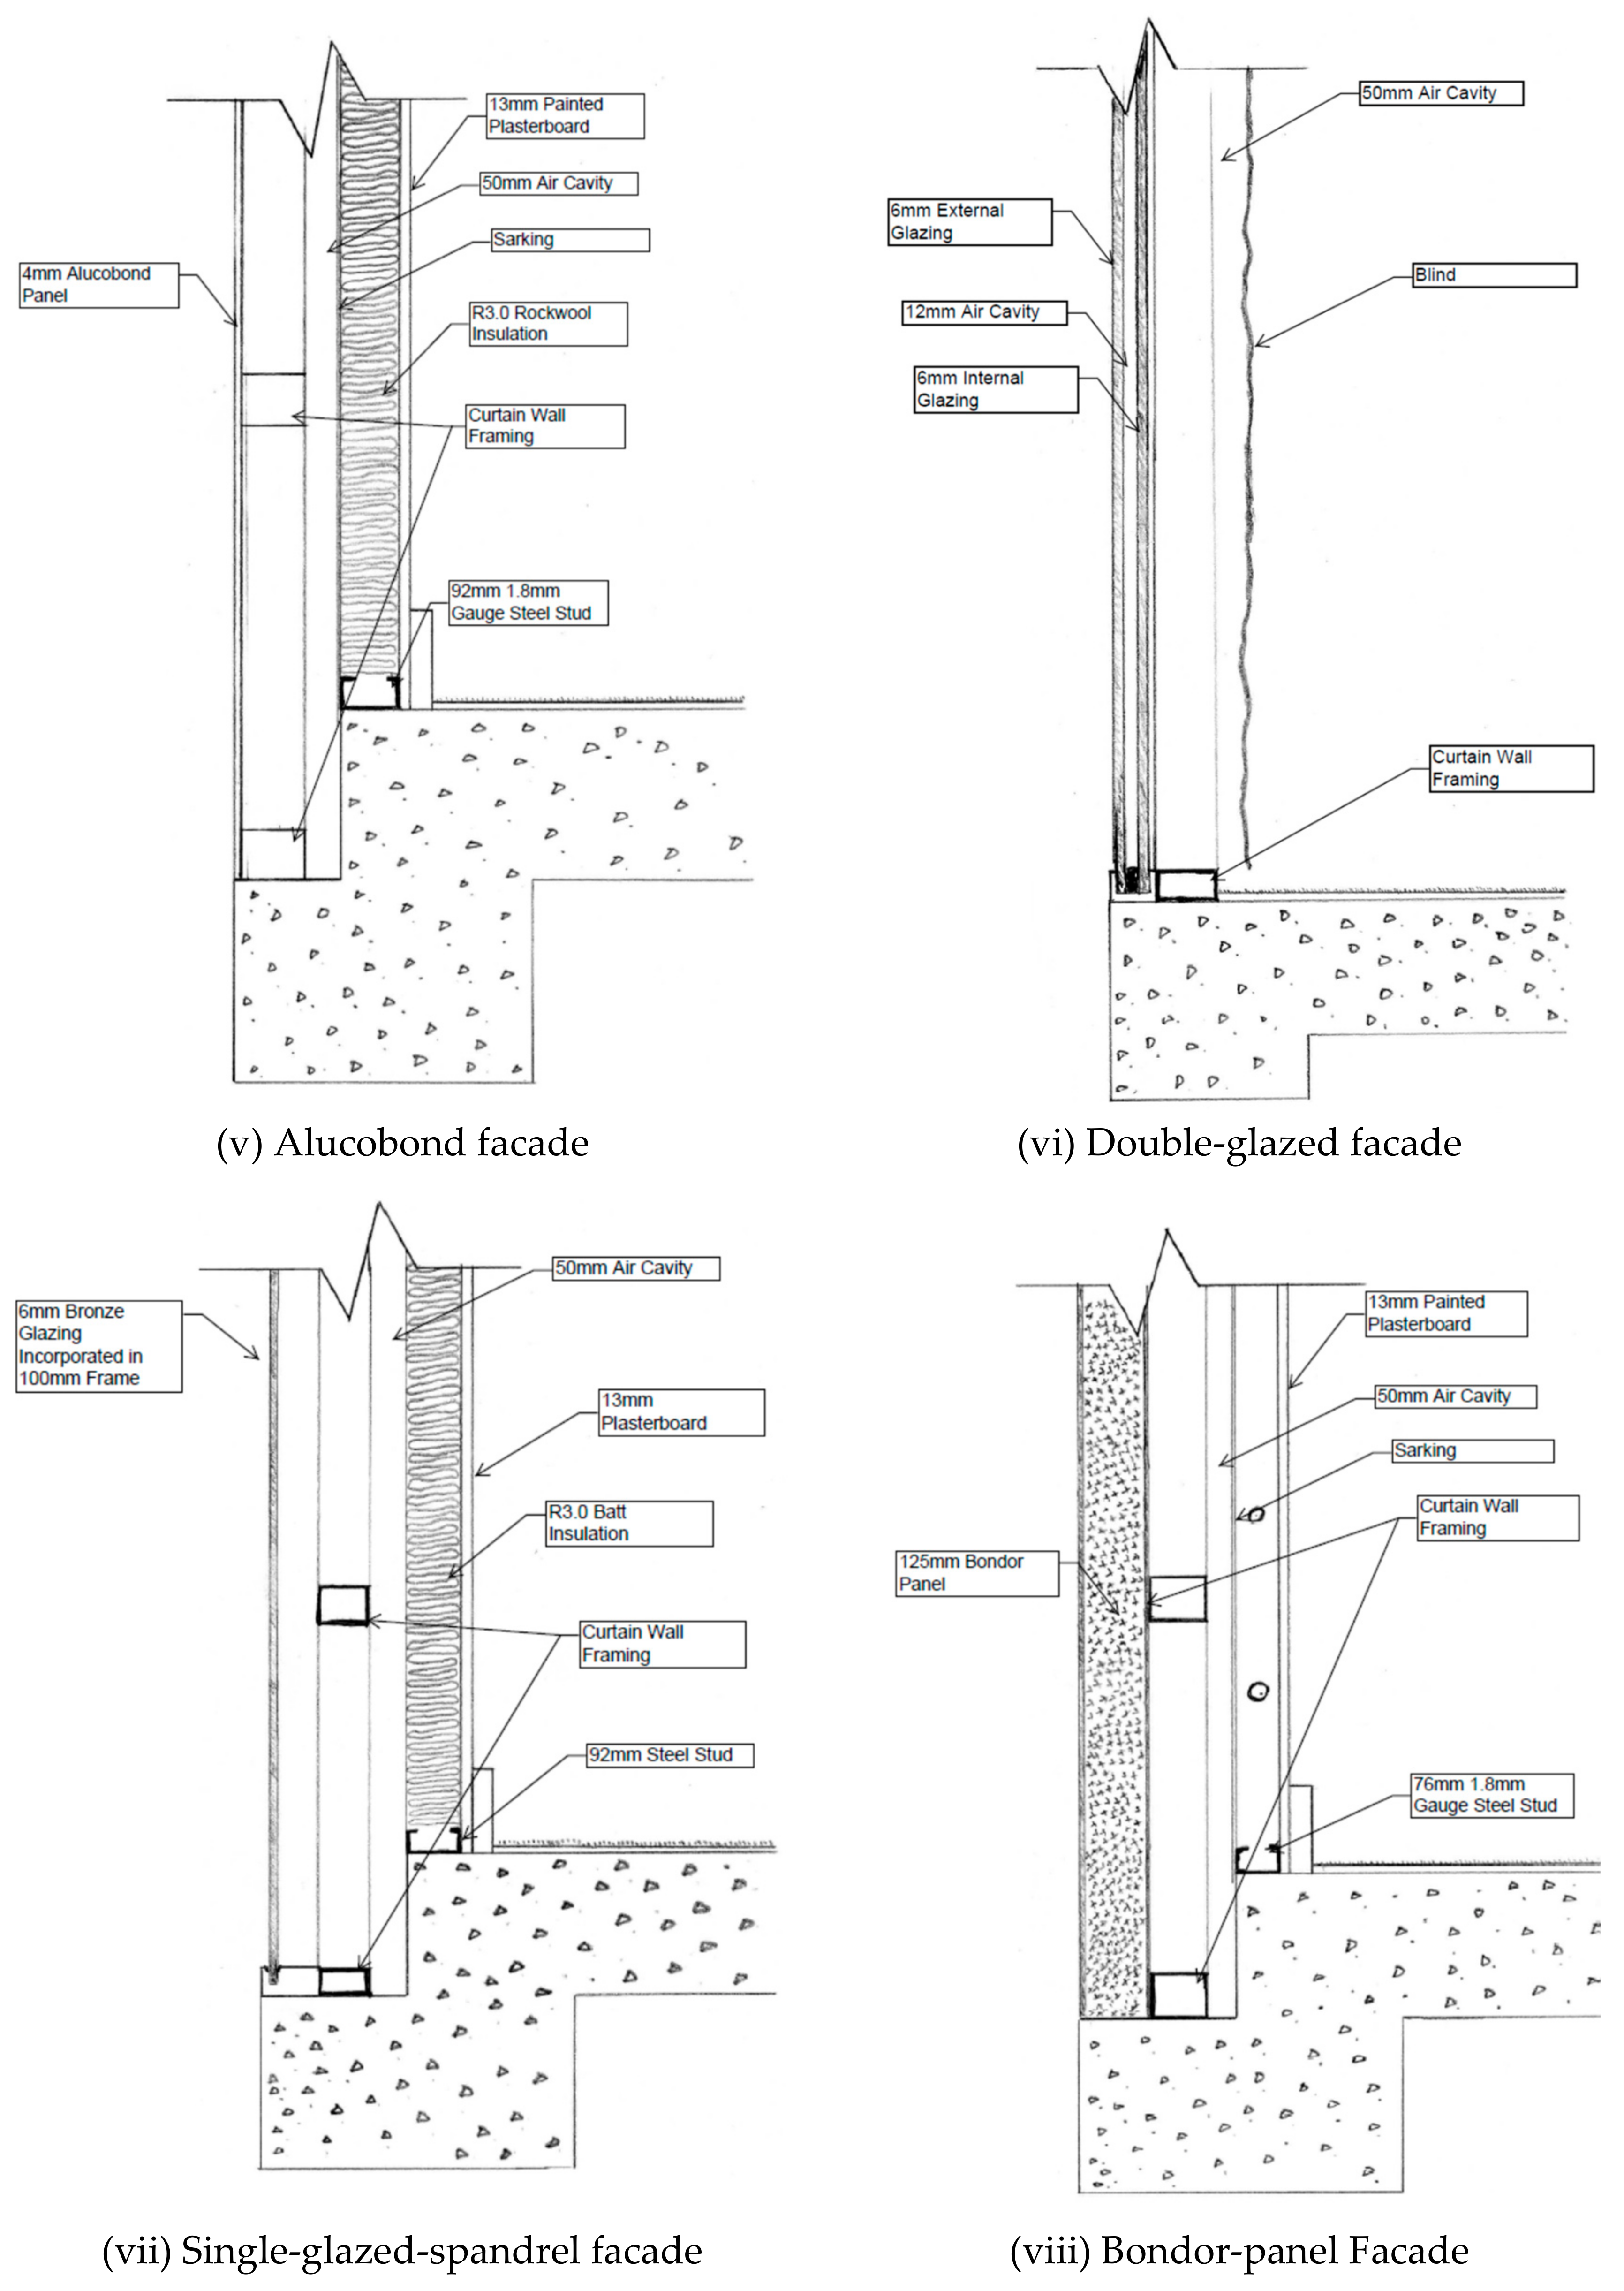
Therefore, this paper evaluates cost effectiveness of eleven types of external facade systems for commercial buildings by determining their life-cycle cost for seven Australian capital cities, namely Sydney, Melbourne, Darwin, Brisbane, Perth, Adelaide and Hobart. The eleven external facade systems examined in this paper are: (i) double-skin-masonry; (ii) masonry-veneer; (iii) compressed-fiber-cement; (iv) precast-concrete; (v) Alucobond; (vi) double-glazed; (vii) single-glazed-spandrel; (viii) Bondor-panel; (ix) Greenboard; (x) Kingspan; and (xi) Eco-block. The most cost effective external facade systems can be identified for each major city. All monitory values stated in the paper are in Australian dollars and are goods and services tax (GST) exclusive.

2. Research Methodologies

To determine cost effectiveness of using external facade systems, life-cycle cost for using different types of external facade systems in seven major Australian cities was explored and compared. The seven major Australian cities investigated are Sydney, Melbourne, Brisbane, Adelaide, Perth, Darwin and Hobart. The following eight procedures were used to achieve the objectives: (i) examining required R-value of external facade systems for major Australian cities; (ii) examining required minimum thickness for external facade systems; (iii) identifying its construction cost; (iv) identifying its space heating and cooling cost; (v) identifying loss of rent due to thickness of the external facade systems; (vi) identifying its maintenance cost; (vii) identifying inflation rate; and (viii) exploring life-cycle cost for using external facade systems.

2.1. Required R-Value of External Facade Systems for Major Australian Cities

Traditional building material may not achieve the required R-value to meet the current standards. Information from the Building Code of Australia, Section J: assessment and verification of an alternative solution, was used to find the required R-value of external facade systems for major Australian cities [41].

2.2. Required Minimum Thickness for External Facade Systems

The eleven external facade systems investigated are: (i) double-skin-masonry; (ii) masonry-veneer; (iii) compressed-fiber-cement; (iv) precast-concrete; (v) Alucobond; (vi) double-glazed; (vii) single-glazed-spandrel; (viii) Bondor-panel; (ix) Greenboard; (x) Kingspan; and (xi) Eco-block. The selection consisted of a mixture of traditional systems that have been used for hundreds of years and new innovative systems that have only been recently introduced into the market. Under the guideline from the Building Code of Australia, detail analysis of the components and thickness required for each external facade system wasconducted [41].

2.3. Construction Cost

Construction cost was determined using Rawlinsons Australian Construction Handbook [42]. Rawlingsons Australian Construction Handbook is the leading reference book within the Australian construction industry, is mainly directed for medium/large-sized projects and contains a wide range of construction cost information for all Australian capital cities.

2.4. Space Heating and Cooling Cost

Space heating and cooling cost is measured based on Equation (1) [30].
HC = 86,400 × U × DD/η/3,600,000 × ER
where HC is the space heating and cooling cost (in $/m2/year); U is the thermal performance of external facade systems; DD is the degree day; η is the mechanical efficiency of space heating systems; and ER is the electricity rate. This paper used $0.20 for all capital cities for the calculation. It is assumed that the calculations of space heating and cooling are similar in this paper.
The thermal performance (U) of external facade systems is calculated by adding individual R-Value within the system and taking the reciprocal of the total value.
The degree day method is the simplest and most intuitive way of estimating energy consumption of a building. This method is useful in diagnosing potential impacts of regional climate modifications on energy demand for space heating and cooling [31]. Heating and cooling degree days are based on the average daily temperature. The average daily temperature is calculated by dividing the addition of the maximum and minimum daily temperature by two [33]. If the average daily temperature falls below comfort levels, heating is required; and if it is above comfort levels, cooling is required. The heating degree days or cooling degree days are determined by the difference between the average daily temperature and the comfort level temperature. The comfort level values used were 18 degrees Celsius for heating and 24 degrees Celsius for cooling. Table 2 identifies the annual heating and cooling degree days using the contours maps shown in Figure 3 and Figure 4.
The mechanical efficiency of space heating system, η, used in the equation, is 73% according to the information from leading Australian mechanical equipment suppliers [43,44]. Figure 5 identifies elements that reduce the efficiency of a standard mechanical system.

2.5. Loss of Rent Due to Thickness of the Facade Systems

There is no doubt that the thicker the material on external facade systems, the better insulation performance it will achieve. However, if the material is too thick, the available office space may be significantly reduced. This can thus affect income from office renting.
Equation (2) is used to determine the total rental loss per annum incurred by the thickness of the external facade systems.
RL = FT × RRR
where RL is the rental loss per annum (in $); FT is the facade thickness (in m); and RRR is the rental return rate for external facade system (in $/m).
The rental return rate for each capital city was established using Rawlinsons Australian Construction Handbook [42].

2.6. Maintenance Cost

Building maintenance is an ongoing operational cost that a building incurs over its lifetime. Maintenance cost for each external facade system is determined as a percentage of the total cost to construct the system. The maintenance percentage used in this paper was 4.5% as recommended in the Rawlinson Australian Construction Handbook [42]. Equation (3) shows the formula for calculating maintenance cost of external facade systems.
M = C × MP
where M is the maintenance cost of the external facade systems (in $/m2); C is the construction cost of the external facade systems (in $/m2); and MP is the maintenance percentage of the systems.

2.7. Inflation Rate

Standards Australia defines inflation rate as a rate of increase applied to cost incurred at a future date to reflect the relative purchasing power of money in terms of chosen point in time, usually the present. Inflation rates are computed in retrospect, generally using a reference set of items or estimated in advance [45]. Information from the Reserve Bank of Australia was used for the calculation in this paper [46].

2.8. Life-Cycle Cost for Using External Facade Systems

To determine the cost effectiveness and compare among different external facade systems, a life-cycle of 20 years was conducted for each external facade system in each Australian capital city as most facade systems have reduced improvement after 20 years. Equation (4) was used for the life-cycle cost calculation.
F = C + ∑[(HC + M + RL) × (1 + i)n]
where F is the life-cycle cost for the external facade systems; i is the inflation rate; and n is the number of years.

3. Results and Discussions

3.1. Required R-Value of External Facade Systems for Major Australian Cities

Cities located in more extreme climates require a greater insulation rating compared to cities located in a normal climate. According to Australian Building Codes Board [41], Table 3 summarizes the required R-value of external facade systems for major Australian cities. To enable external facade systems to achieve the required R-value, different insulating techniques need to be incorporated into the systems.
Darwin requires the highest R-value for external facade systems as it is located in a hot climate zone while Hobart requires the lowest R-value for the systems as it is located in a cold climate zone. The R-values required for external facade systems are between 3.3 (Brisbane and Darwin) and 2.5 (Hobart).

3.2. Required Minimum Thickness for External Facade Systems

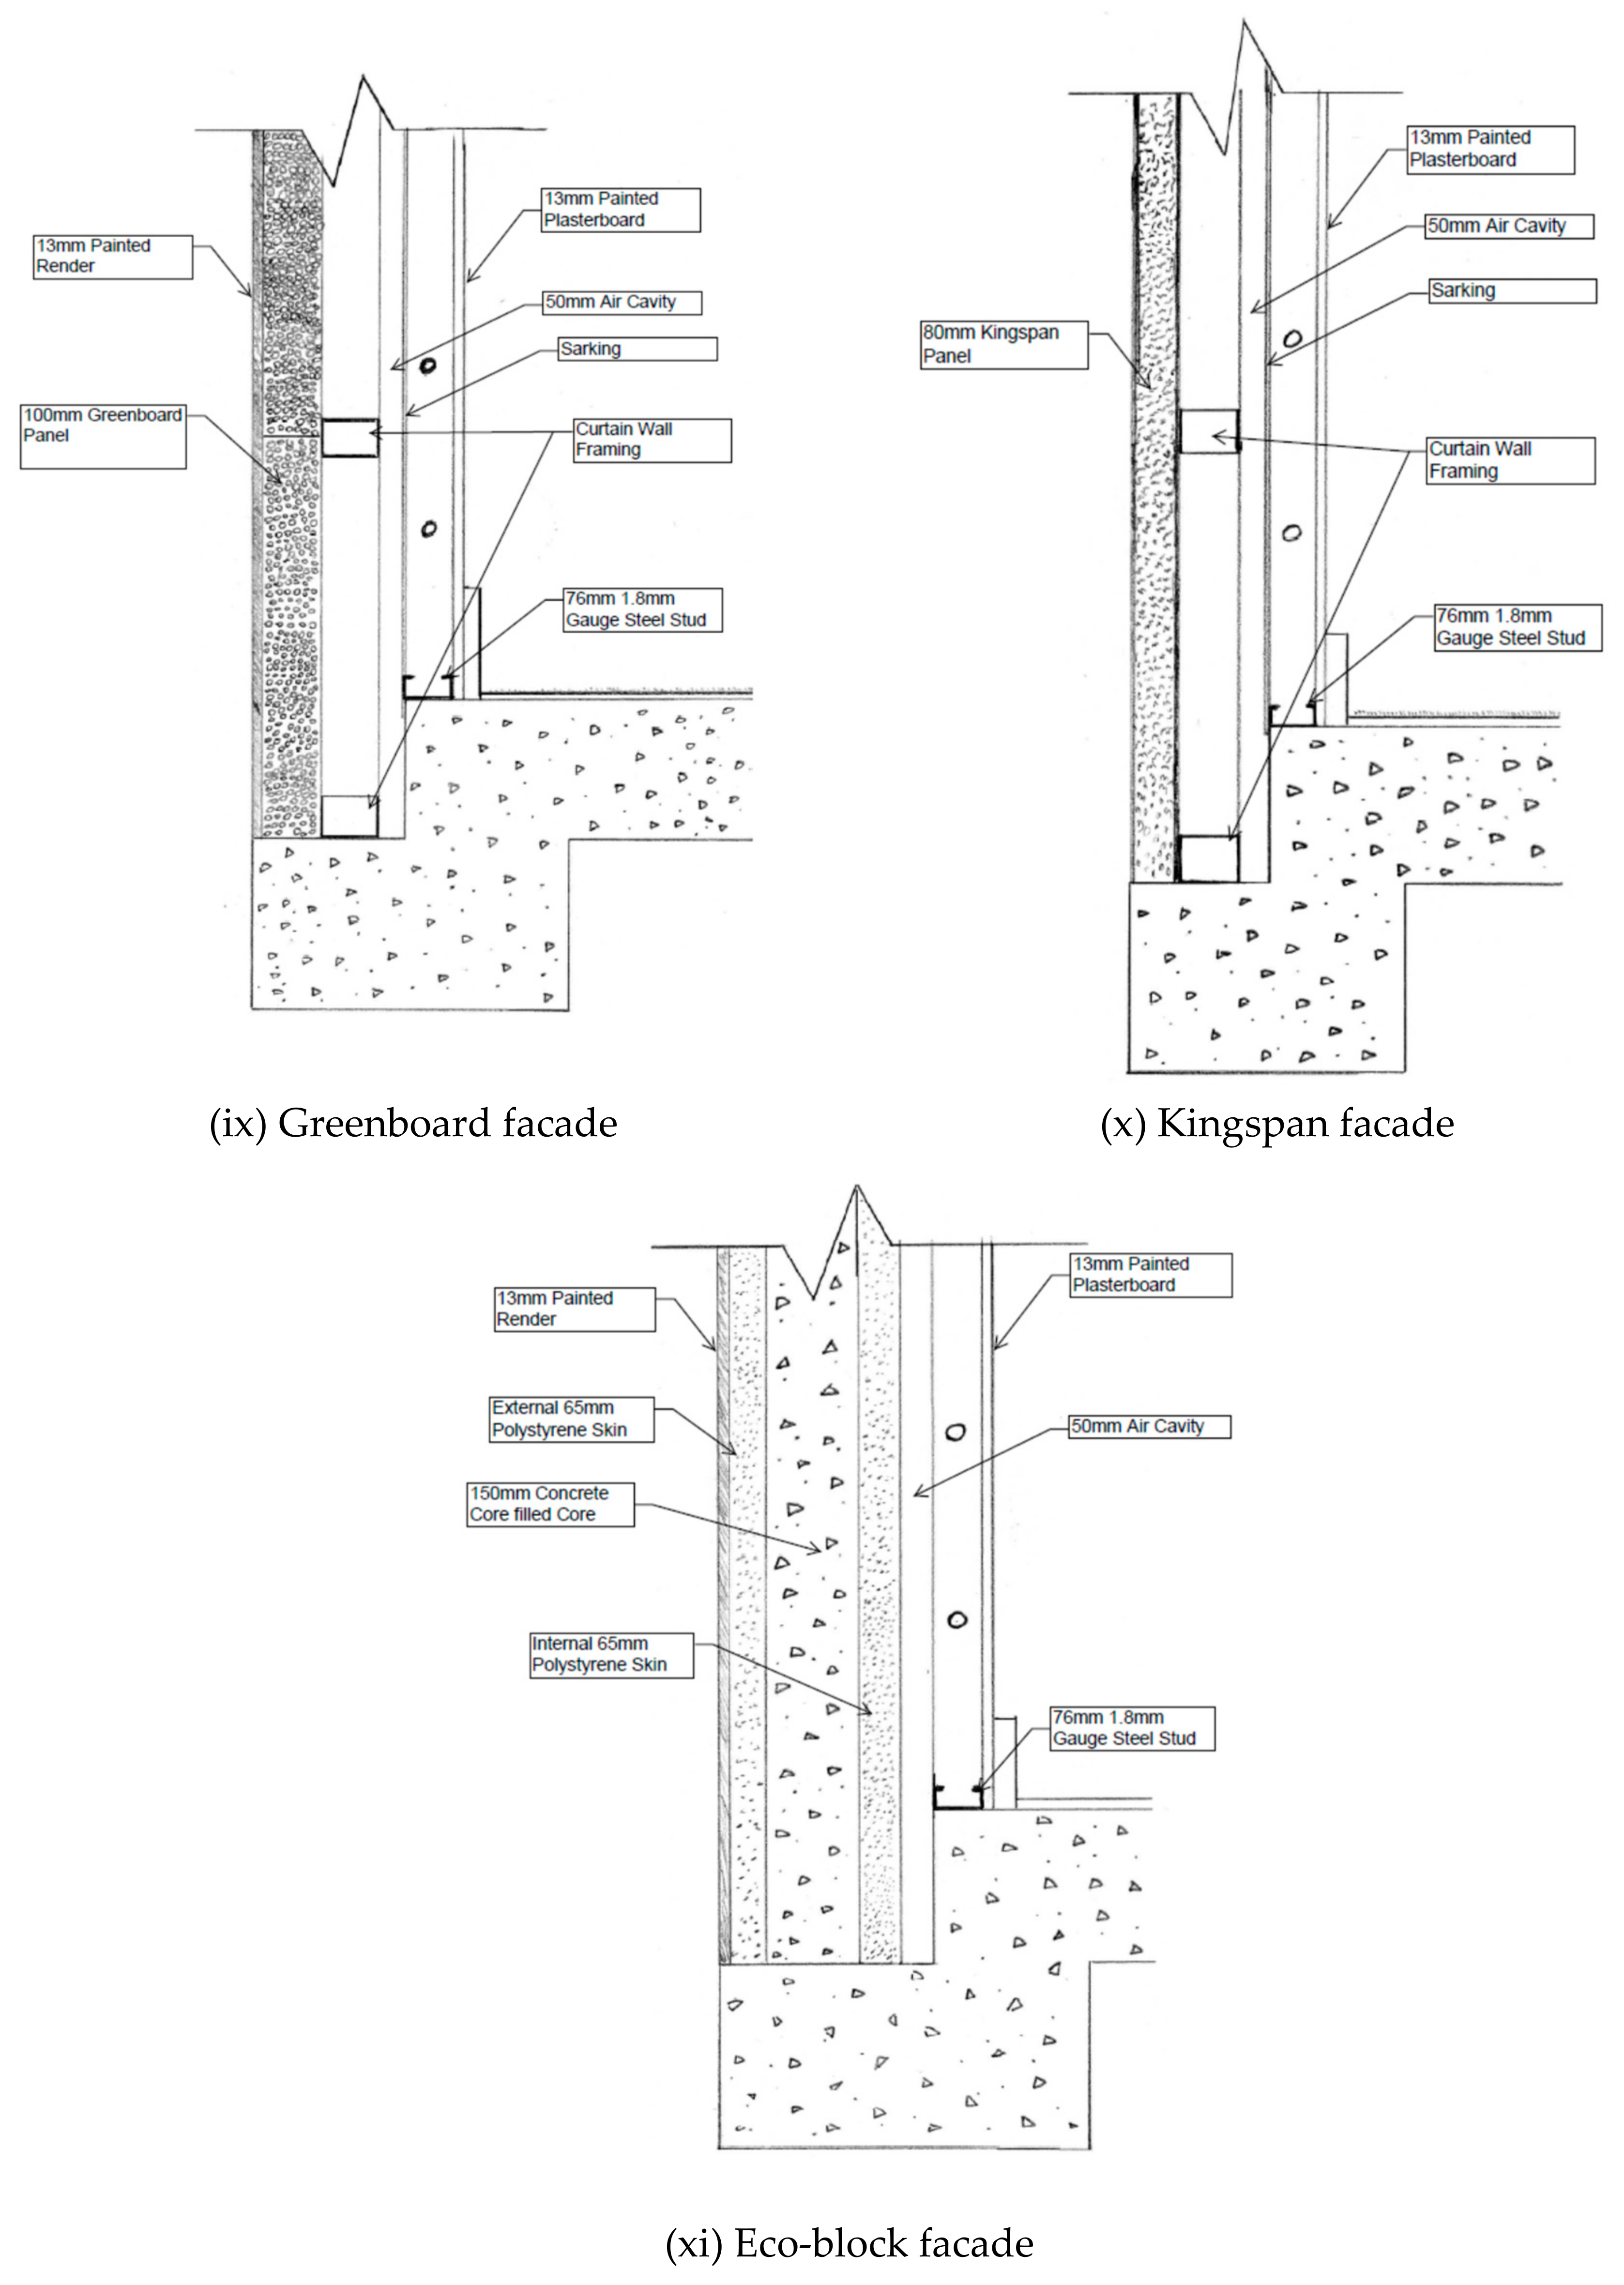
Eleven external facade systems are selected under investigation in this paper: (i) double-skin-masonry; (ii) masonry-veneer; (iii) compressed-fiber-cement; (iv) precast-concrete; (v) Alucobond; (vi) double-glazed; (vii) single-glazed-spandrel; (viii) Bondor-panel; (ix) Greenboard; (x) Kingspan; and (xi) Eco-block. Figure 6 illustrates the cross sections for each external facade system and Table 4 examines the components with its R-value and thickness for each system.
The thicknesses of external facade systems range between 0.174 m (for double-glazed facades) and 0.432 m (for Eco-block facades) and R-values are between 1.160 (for double-glazed facades) and 4.848 (for Kingspan facades). It is found that double-glazed external facade system is significantly thinner than other systems. It is the thinnest system with the lowest R-value. Alternatively, Eco-block is the thickest external facade system of about 0.432 m with the R-value of about 3.700 and Kingspan is the highest R-value external facade system of about 4.848 and the thickness is about 0.319 m.

3.3. Construction Cost

Constructions cost of an external facade system is determined by adding the cost per meter square (m2) for supply and installation of each of the composite materials (see Table 4) within the system. The national costing can be referred from Rawlinsons Australian construction handbook [42]. Table 5 summarizes the construction cost for each external facade system in major Australian capital cities.
It is found that external facade systems are priced between $177.00/m2 (for masonry-veneer facades from Brisbane) and $1085.50/m2 (for double-glazed facades from Brisbane). The prices for external facade systems per meter square (m2) are: (i) $226.80–434.82 for double-skin-masonry facades; (ii) $177.00–315.79 for masonry-veneer facades; (iii) $620.95–746.40 for compressed-fiber-cement facades; (iv) $377.70–740.95 for precast-concrete facades; (v) $745.00–903.32 for Alucobond facades; (vi) $798.50–1085.50 for double-glazed facades; (vii) $662.65–804.13 for single-glazed-spandrel facades; (viii) $569.75–695.40 for Bondor-panel facades; (ix) $505.94–632.55 for Greenboard facades; (x) $583.90–688.12 for Kingspan facades; and (xi) $283.55–352.19 for Eco-block facades. In general, systems from Darwin are the most expensive and from Brisbane are the cheapest.

3.4. Space Heating and Cooling Cost

Insulation of external facade systems can have a significant effect on space heating and cooling cost incurred by the building for achieving occupants’ thermal comfort. A well-insulated facade system can reduce heat penetration into the building from a hot climate and prevent heat generated in the building from escaping externally in a cold climate.
The thermal performance (U) of external facade systems is the reciprocal of the R-value of external facade systems, as discussed in Section 2. Table 6 summaries the R-values and U-values of the eleven external facade systems.
External facade system with the highest R-value and the lowest U-value is the most efficient system in preventing heat transfer into a building. The R-values recorded for the facade system are very similar with the exception of the double-glazed facade system, which recorded the lowest R-value of about 1.160 or the highest U-value of about 0.862, and Kingspan facade system, which has the highest R-value of about 4.848 and U-value of about 0.206. The findings are important for design teams, as they provide assurance that the design selected meets the minimum requirements specified in the Australian Building Codes Board. Generally, an external facade system with a lower U-value requires less energy to heat and cool the building and thus reduces space heating and cooling cost.
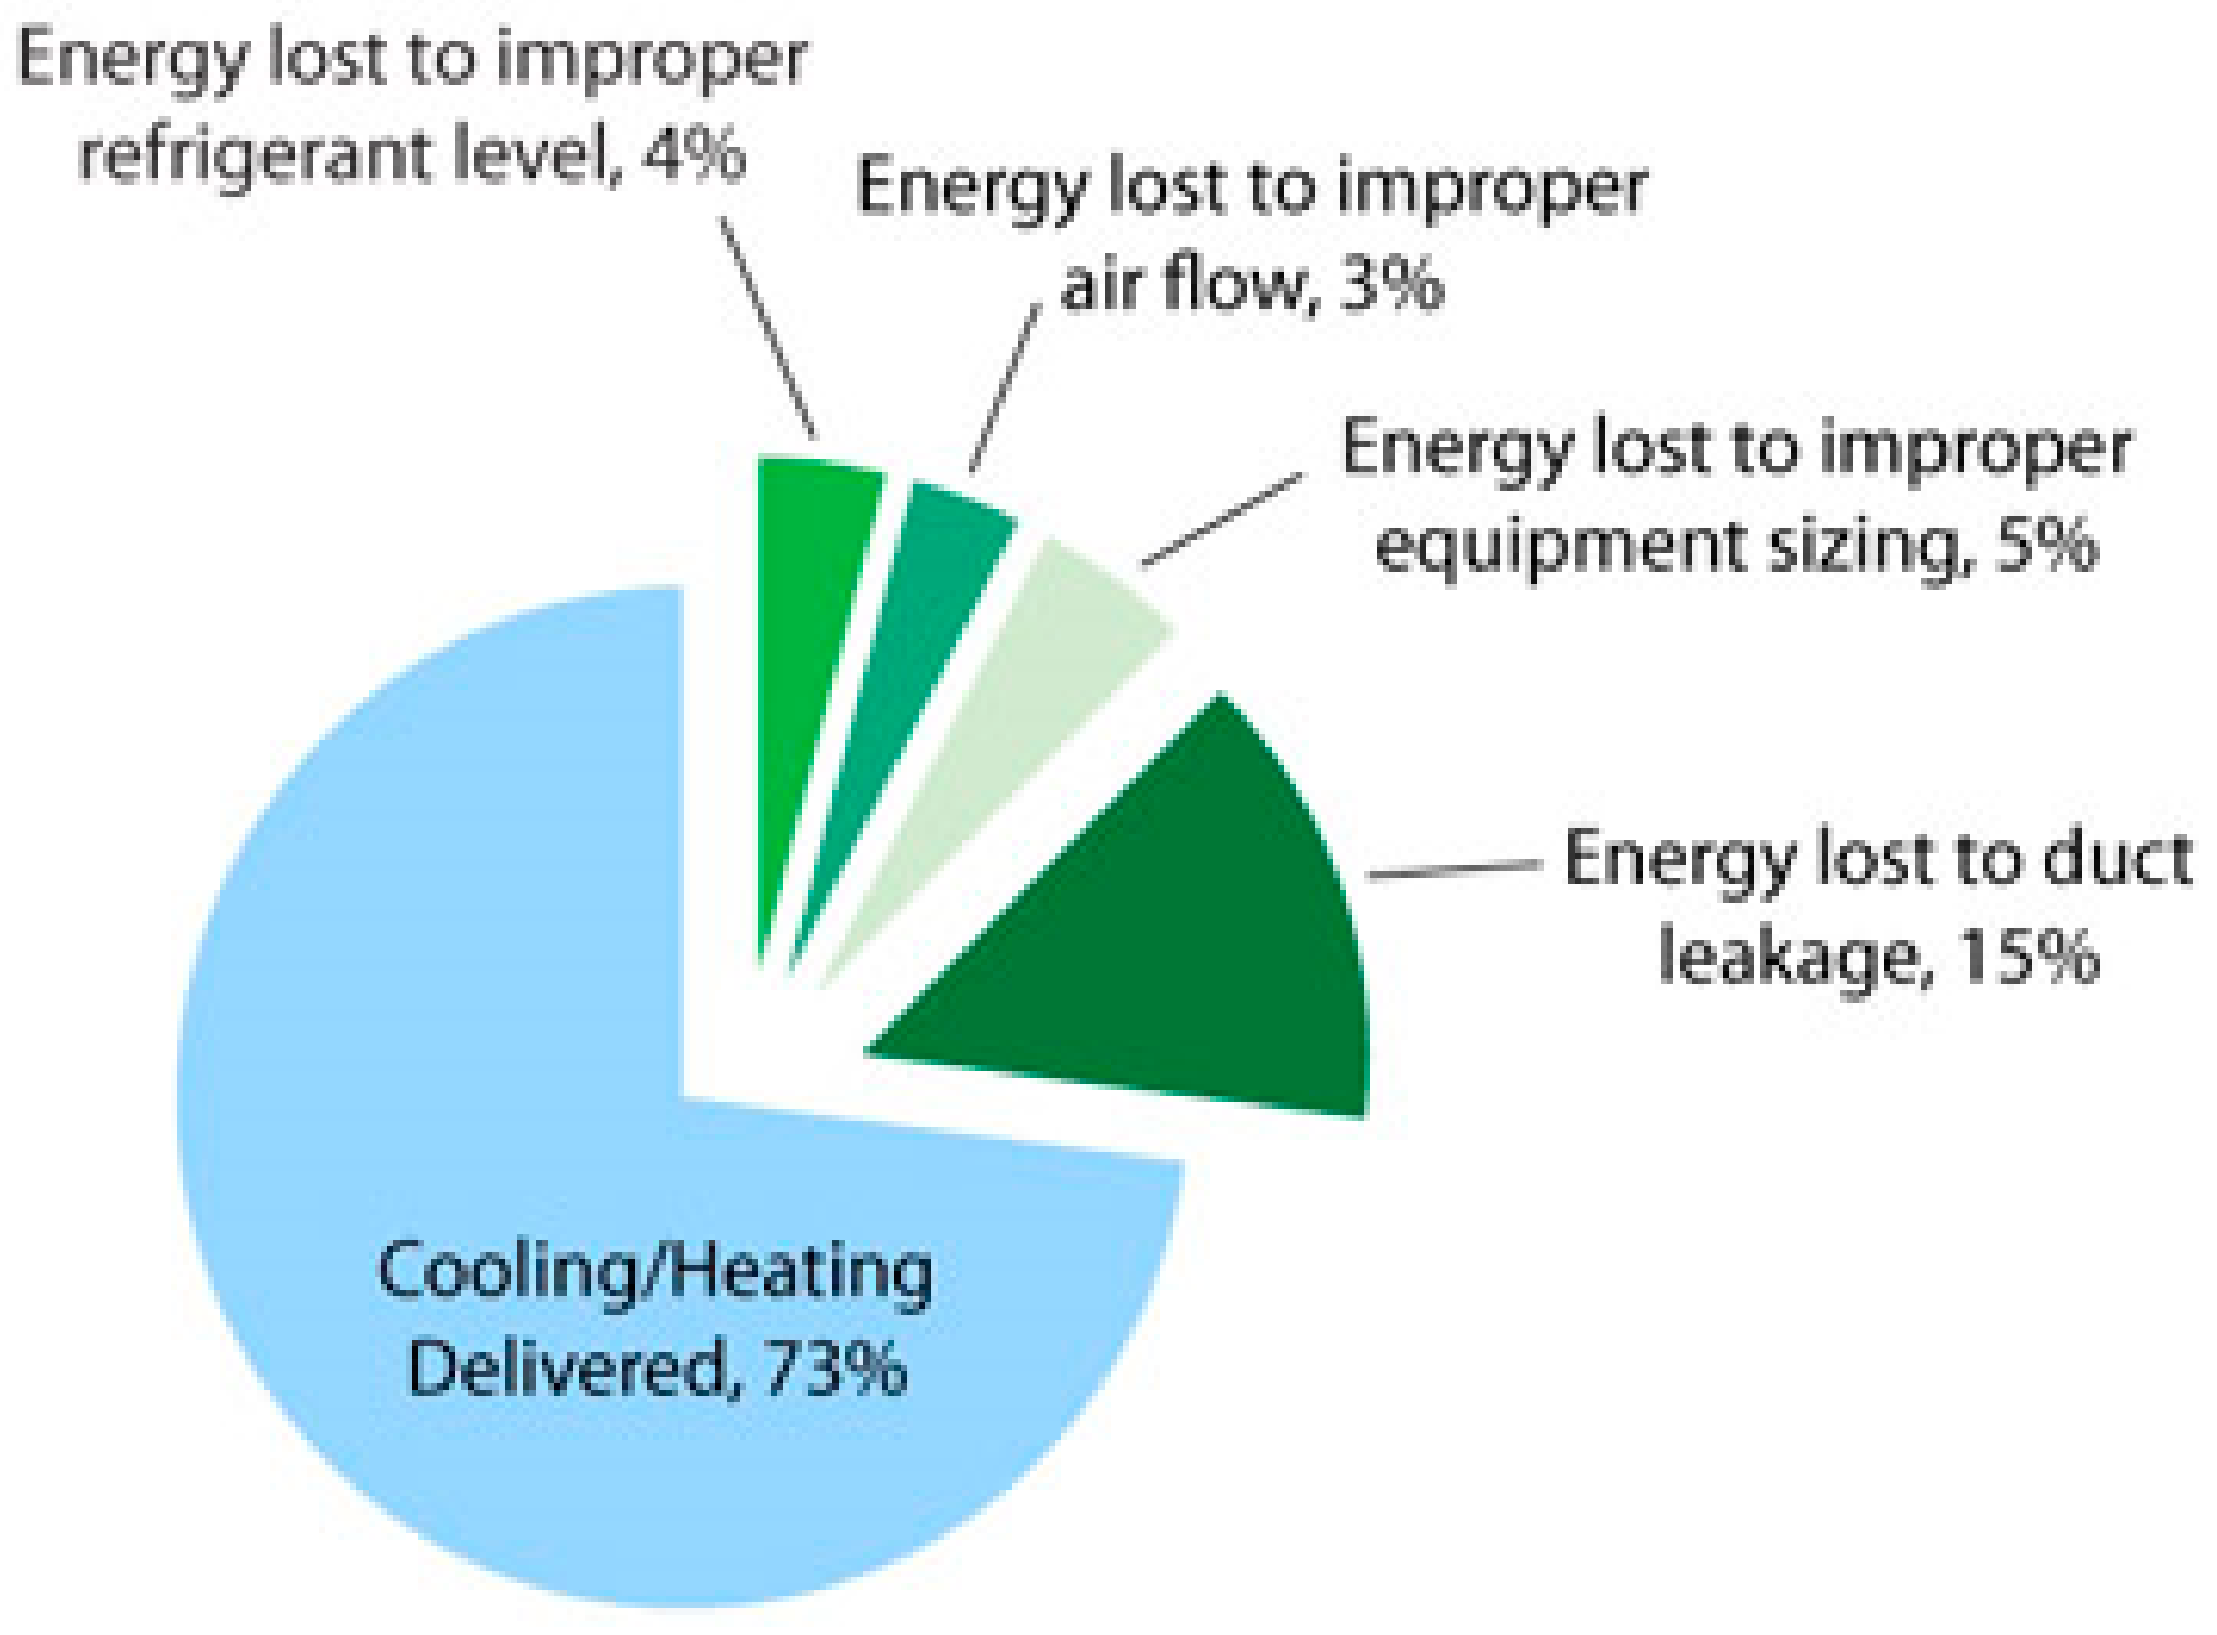
Based on Equation (1) with the information on U-value (from Table 6), number of degree day (DD) (from Table 2), mechanical efficiency (η) of 0.73 and electricity rate (ER) of 0.2, space heating and cooling cost for major Australian capital cities can be calculated, as summarized in Table 7.
It is found that the annual space heating and cooling cost is between $0.78/m2 (for Kingspan facades from Brisbane) and $10.97/m2 (for double-glazed facades from Melbourne). Double-glazed facades are found to be the most expensive system. It must be noted that the above investigation does not t consider the savings that may be achieved in lighting due to the transparency of the double-glazed facade systems. A double-glazed facade system can reduce the amount of energy required to provide artificial lighting.

3.5. Loss of Rent Due to Thickness of the Facade Systems

Using Equation (2), Table 8 summaries the rental loss, RL, for each external facade system with the information on the average office rental return rates, RRR (see Table 9), and facade thicknesses, FT (from Table 4).
It is found that the annual rental losses are between $21.75 (for double-glazed facades from Darwin) and $453.60/m2 (for Eco-block facades from Sydney). In general, Darwin has the lower rental losses while Sydney has the highest rental losses from the systems, as reflected from their average office rental return rates (Table 9).

3.6. Maintenance Cost

Based on Equation (3), Table 10 summarizes the maintenance cost of external facade systems. It is found that the maintenance cost is between $7.97/m2 (for masonry-veneer facades from Brisbane) and $48.85/m2 (for double-glazed facades from Brisbane). Masonry-veneer facades are found to have the lowest maintenance cost while double-glazed facades have the highest maintenance cost among the systems. The calculated maintenance cost does not consider the building’s location. For example, a building located in a marine environment will incur significantly more maintenance cost than a building located away from the water.
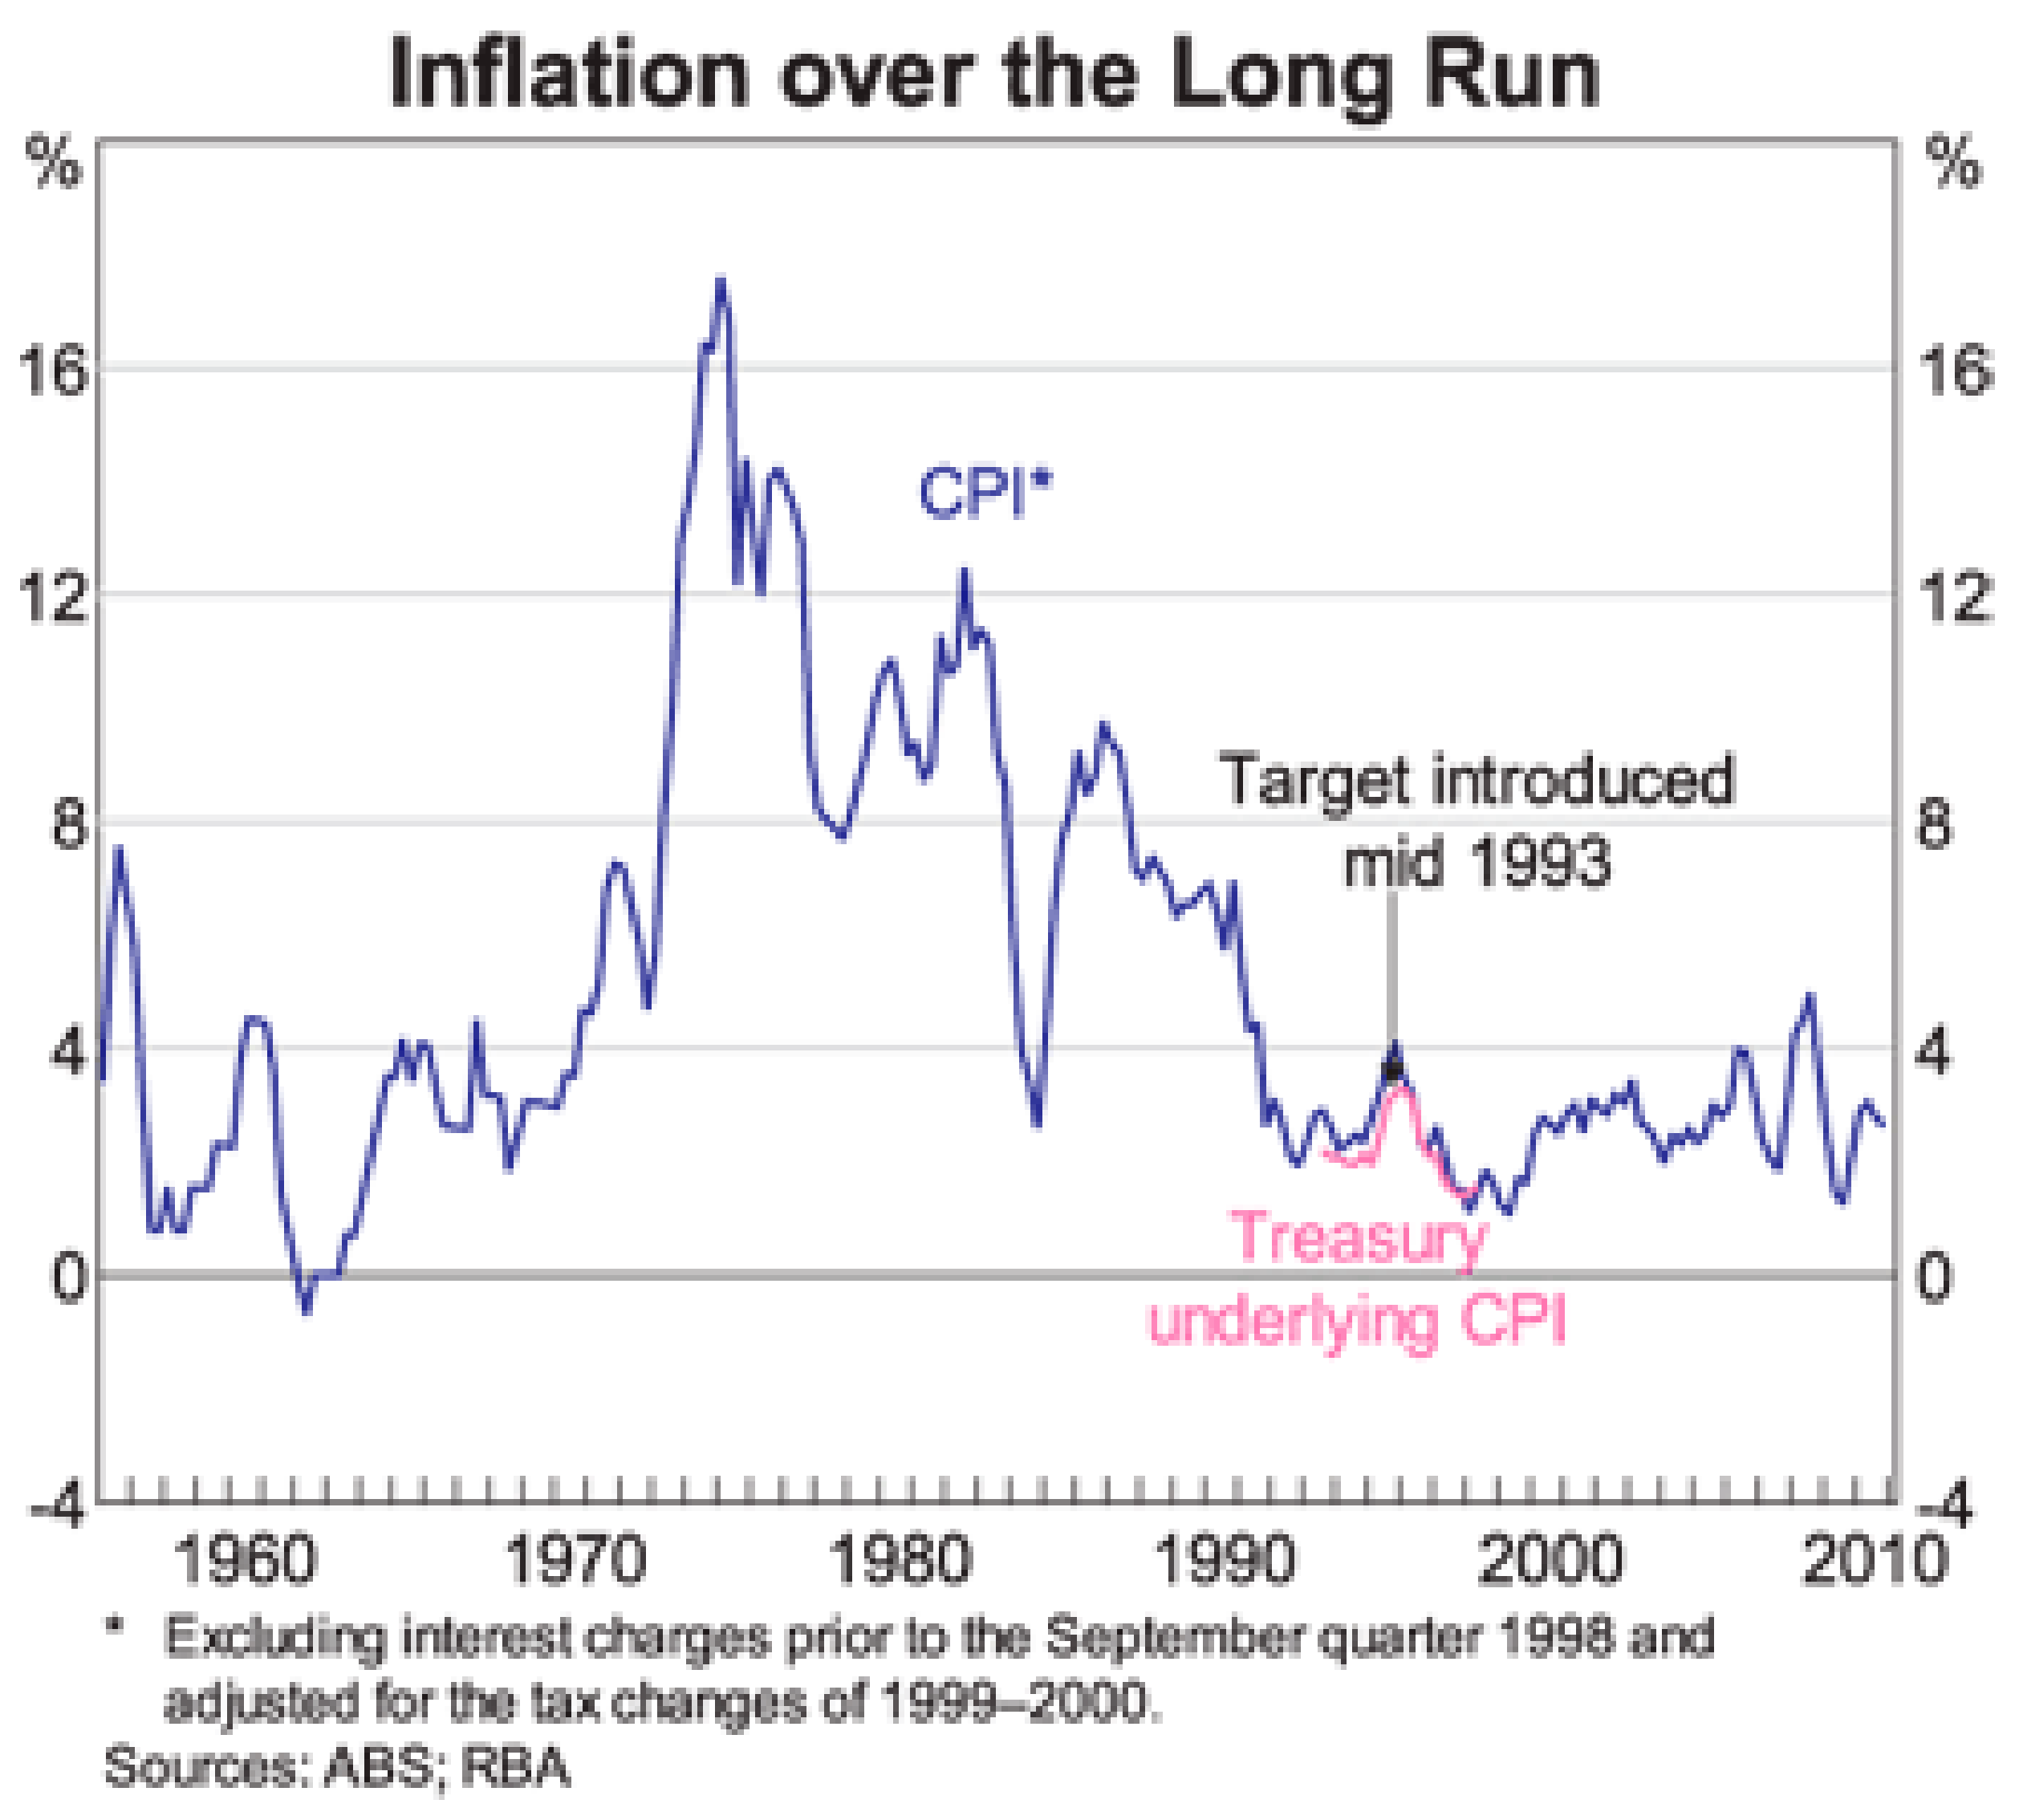
3.7. Inflation Rate

The Governor and the Treasurer have agreed that the appropriate target for monetary policy in Australia is to achieve an inflation rate of 2–3%, on average, over the cycle. The Reserve Bank of Australia has set the current inflation rate as 2.7% [46]. Figure 7 is a graphical representation of the inflation rate over the past 60 years.

3.8. Life-Cycle Cost for Using External Facade Systems

Based on Equation (4), Table 11 shows an example of the life-cycle cost calculations for double-skin-masonry facade system in Sydney based on the construction cost (Table 5), space heating and cooling cost (Table 7), rental loss (Table 8) and maintenance cost (Table 10).
Table 12 summarizes the life-cycle cost of different types of external facades systems for major Australian capital cities. It is found that the life-cycle cost is between $1681.10 (for masonry-veneer facades from Darwin) and $12,829.75 (for Eco-block facades from Sydney). Masonry-veneer facades are found to be the most cost-effective systems for most cities, except Sydney, with the life-cycle cost ranging from $1681.10 (from Darwin) to $5384.21 (from Brisbane) due to its low construction cost and relatively good thermal rating. Double-glazed facade is the most cost-effective system in Sydney with the life-cycle cost of about $6714.16. This can be explained by the high rental loss in Sydney compared to other cities. Thus, Sydney requires a cost-effective system with minimal facade thickness.
However, Eco-block facades are the least cost-effective systems for most of the cities, except Darwin and Hobart with the life-cycle cost ranging from $5921.11 (from Melbourne) to $12,829.75 (from Sydney). Single-glazed spandrel facades are the least cost-effective systems for Darwin and Hobart with the life-cycle costs of about $3076.08 and $4908.90, respectively.
The cities’ rankings varied for each of the life-cycle cost factors. The most expensive city to construct the facade systems is Darwin while the cheapest city varied depending on the system. As the maintenance cost is calculated as a percentage of the construction cost, the findings are similar. The city which is affected most by space heating and cooling cost is Darwin, while Brisbane is affected the least. The city which is affected most by the rental loss due to the thickness of the facade is Sydney, while Darwin is affected the least.
The above findings highlight the importance for design teams for considering all cost factors in determining the most cost-effective facade design. While a design may be cost effective to construct, its operational expenses may outweigh the initial savings. If a building is constructed incorrectly due to the design teams not considering the operational expenses, the building may never achieve its full potential in term of cost-effectiveness. This will also be difficult to redeem after construction period.

4. Conclusions

This study investigated cost effectiveness of eleven external facade systems by determining their life-cycle cost in a 20-year period from seven major Australian capital cities. Construction cost, space heating and cooling cost, rental loss due to the thickness of the system, maintenance cost, and inflation rate were considered in the life-cycle cost calculations. It was found that masonry-veneer facades are the most cost-effective systems for most cities, except Sydney due to its low construction cost and relatively good thermal rating. Double-glazed facade is the most cost-effective system in Sydney due to its minimal facade thickness and high local rental loss. However, Eco-block facades are found to be the least cost-effective system for Sydney, Melbourne, Brisbane, Adelaide and Perth, and single-glazed-spandrel facades are found to be the least cost-effective for Darwin and Hobart. This paper can help designers in determining the most cost-effective and sustainable external facade systems at an early planning stage.

Author Contributions

V.W.Y.T. and K.N.L. conceived and designed the experiments; K.N.L. performed the experiments; J.Y.W. analyzed the data.

Acknowledgments

The author would like to thank James Andrew for his help on this project and acknowledge the financial support from the Australian Research Council (ARC), Australian Government (No: DP150101015).

Conflicts of Interest

The authors declare no conflict of interest.

References

  1. Department of Climate Change. Impacts of Climate Change; Department of Climate Change, Australian Government: Canberra, Australia, 2010.
  2. Green Building Council of Australia. Green Star Environmental Assessment System; Green Building Council of Australia: Sydney, Australia, 2012; Volume 2012. [Google Scholar]
  3. BRE. Building Research Establishment Environmental Assessment Method. 2006. Available online: http://www.bre.co.uk (accessed on 7 September 2006).
  4. HK-BEAM Society. HK-BEAM. 2007. Available online: http://www.hk-beam.org.hk/general/home.php (accessed on 7 June 2007).
  5. USGBC. Leadership in Energy and Environmental Design. 2006. Available online: http://www.usgbc.org/ (accessed on 18 December 2006).
  6. Department of the Environment and Water Resources. ESD Design Guide, Office and Public Buildings; Department of the Environment and Water Resources, Australian Government: Canberra, Australia, 2007.
  7. Department of the Environment and Heritage. Australia State of the Environment Report; Department of the Environment and Heritage, Australian Government: Sydney, Australia, 2001.
  8. Lam, P.T.; Chan, E.H.; Chau, C.K.; Poon, C.S.; Chun, K.P. Environmental management system vs green specification: How do they complement each other in the construction industry? J. Environ. Manag. 2011, 92, 788–795. [Google Scholar] [CrossRef] [PubMed]
  9. FWR Group Property Limited. Sustainable Construction Techniques; FWR Group Property Limited: Rochedale, Australia, 2013. [Google Scholar]
  10. American Society of Heating, Refrigerating and Air-Conditioning Engineers Inc. Heating, Ventilating and Air-Conditioning Applications; American Society of Heating, Refrigerating and Air-Conditioning Engineers Inc.: Atlanta, GA, USA, 2007. [Google Scholar]
  11. Tsai, C.Y.; Chang, A.S. Framework for developing construction sustainability items: The example of highway design. J. Clean. Prod. 2012, 20, 127–136. [Google Scholar] [CrossRef]
  12. Shi, Q.; Zuo, J.; Huang, R.; Huang, J.; Pullen, S. Identifying the critical factors for green construction—An empirical study in China. Habitat Int. 2013, 40, 1–8. [Google Scholar] [CrossRef]
  13. Zhang, X.; Wu, Y.; Shen, L.Y. Application of low waste technologies for design and construction: A case study in Hong Kong. Renew. Sustain. Energy 2012, 16, 2973–2979. [Google Scholar] [CrossRef]
  14. Kats, G. Green Building Costs and Financial Benefits; Massachusetts Technology Collaborative: Westborough, MA, USA, 2003. [Google Scholar]
  15. Tatari, O.; Kucukvar, M. Cost premium prediction of certified green buildings: A neural network approach. Build. Environ. 2011, 46, 1081–1086. [Google Scholar] [CrossRef]
  16. Zhang, X.; Platten, A.; Shen, L.Y. Green property development practice in China: Costs and barriers. Build. Environ. 2011, 46, 2153–2160. [Google Scholar] [CrossRef]
  17. Sadineni, S.B.; Madala, S.; Boehm, R.F. Passive building energy savings: A review of building envelop components. Renew. Sustain. Energy Rev. 2011, 15, 3617–3631. [Google Scholar] [CrossRef]
  18. Shane, J. Positioning your library for solar (and financial) gain, improving energy efficiency, lighting, and ventilation with primarily passive techniques. J. Acad. Librariansh. 2012, 38, 115–122. [Google Scholar] [CrossRef]
  19. Soares, N.; Costa, J.J.; Gaspar, A.R.; Santos, P. Review of passive PCM latent heat thermal energy storage systems towards buildings’ energy efficiency. Energy Build. 2013, 59, 82–103. [Google Scholar] [CrossRef]
  20. Zinzi, M.; Agnoli, S. Cool and green roofs: An energy and comfort comparison between passive cooling and mitigation urban heat island techniques for residential buildings in the Mediterranean region. Energy Build. 2012, 55, 66–76. [Google Scholar] [CrossRef]
  21. Dixit, M.K.; Culp, C.H.; Fernandez-Solis, J.L. System boundary for embodied energy in buildings: A conceptual model for definition. Renew. Sustain. Energy Rev. 2013, 21, 153–164. [Google Scholar] [CrossRef]
  22. Cabeza, L.F.; Barreneche, C.; Miro, L.; Morera, J.M.; Bartoli, E.; Fernandex, A.I. Low carbon and low embodied energy materials in buildings: A review. Renew. Sustain. Energy Rev. 2013, 23, 536–542. [Google Scholar] [CrossRef]
  23. Dixit, M.K.; Fernandez-Solis, J.L.; Lavy, S.; Culp, C.H. Need for an embodied energy measurement protocol for buildings: A review paper. Renew. Sustain. Energy Rev. 2012, 16, 3730–3743. [Google Scholar] [CrossRef]
  24. Dixit, M.K.; Fernandez-Solis, J.L.; Lavy, S.; Culp, C.H. Identification of parameters for embodied energy measurement: A literature review. Energy Build. 2010, 42, 1238–1247. [Google Scholar] [CrossRef]
  25. Australian Bureau of Statistics. Consumer Price Index; Australian Bureau of Statistics, Australian Government: Canberra, Australia, 2010.
  26. Guo, W.; Qiao, X.; Huang, Y.; Fang, M.; Han, X. Study on energy saving effect of heat-reflective insulation coating on envelops in the hot summer and cold winter zone. Energy Build. 2012, 50, 196–203. [Google Scholar] [CrossRef]
  27. Stazi, F.; Veglio, A.; Perna, C.D.; Munafo, P. Experimental comparison between 3 different traditional wall constructions and dynamic simulations to identify optimal thermal insulation strategies. Energy Build. 2013, 60, 429–441. [Google Scholar] [CrossRef]
  28. Friess, W.A.; Rakhshan, K.; Hendawi, T.A.; Tajerzadeh, S. Wall insulation measures for residential villas in Dubai: A case study in energy efficiency. Energy Build. 2012, 44, 26–32. [Google Scholar] [CrossRef]
  29. Ucar, A.; Balo, F. Determination of the energy savings and the optimum insulation thickness in the four different insulated exterior walls. Renew. Energy 2010, 35, 88–94. [Google Scholar] [CrossRef]
  30. Hasan, A. Optimizing insulation thickness for buildings using life cycle cost. Appl. Energy 1999, 63, 115–124. [Google Scholar] [CrossRef]
  31. Bolatturk, A. Optimum insulation thicknesses for building walls with respect to cooling and heating degree-hours in the warmest zone of Turkey. Build. Environ. 2008, 43, 1055–1064. [Google Scholar] [CrossRef]
  32. Reardon, C. Technical Manual, Design for Lifestyle and the Future; Department of Climate Change and Energy Efficiency, Australian Government: Canberra, Australia, 2008.
  33. Australian Bureau of Statistics. Environmental Issues—Energy Use and Conservation; Australian Bureau of Statistics, Australian Government: Canberra, Australia, 2008.
  34. Bambrook, S.M.; Sproul, A.B.; Jacob, D. Design optimisation for a low energy home in Sydney. Energy Build. 2011, 43, 1702–1711. [Google Scholar] [CrossRef]
  35. Urmee, T.; Thoo, S.; Killick, W. Energy efficiency status of the community housing in Australia. Renew. Sustain. Energy Rev. 2012, 16, 1916–1925. [Google Scholar] [CrossRef]
  36. Shameri, M.A.; Alghoul, M.A.; Sopian, K.; Zain, M.F.M.; Elayeb, O. Perspectives of double skin facade system in building and energy saving. Renew. Sustain. Energy Rev. 2011, 15, 1468–1475. [Google Scholar] [CrossRef]
  37. Morrissey, J.; Horne, R.E. Life cycle cost implications of energy efficiency measures in new residential buildings. Energy Build. 2011, 43, 915–924. [Google Scholar] [CrossRef]
  38. Gustavsson, L.; Joelsson, A. Life cycle primary energy analysis of residential buildings. Energy Build. 2010, 42, 210–220. [Google Scholar] [CrossRef]
  39. Morrissey, J.; Meyrick, B.; Sivaraman, D.; Horne, R.E.; Berry, M. Cost-benefit assessment of energy effiency investments: Accounting for future resources, savings and risks in the Australian residential sector. Energy Policy 2013, 54, 148–159. [Google Scholar] [CrossRef]
  40. Suh, D.; Chang, S. A Heuristic rule-based passive design decision model for reducing heating energy consumption of Korean apartment buildings. Energies 2014, 7, 6897–6929. [Google Scholar] [CrossRef]
  41. Australian Building Codes Board. BCA Section J—Assessment and Verification of an Alternative Solution; Australian Building Codes Board: Canberra, Australia, 2010.
  42. Rawlinsons Group. Rawlinsons Australian Construction Handbook; Rawlinsons Publishing: Rivervale, Australia, 2013. [Google Scholar]
  43. Daikan Australian and New Zealand. Darkin Australian and New Zealand Product Brochures; Daikan Australian and New Zealand: Chipping Norton, Australia, 2011. [Google Scholar]
  44. United States Department of Energy. Energy Star Qualty Installation; Department of Energy, United States: Washington, DC, USA, 2011.
  45. Standards Australia. Standards Australia Annual Report 2012; Standards Australia: Canberra, Australia, 2013. [Google Scholar]
  46. Reserve Bank of Australia. Australian Inflation Rate; Reserve Bank of Australia: Sydney, Australia, 2012.
Figure 1. Australian climate zones [32].
Sustainability 10 01917 g001
Figure 2. Percentage of dwellings with insulation incorporated in the external facade [33].
Sustainability 10 01917 g002
Figure 3. Annual cooling degree days contour map [25].
Sustainability 10 01917 g003
Figure 4. Annual heating degree days contour map [25].
Sustainability 10 01917 g004
Figure 5. Losses in mechanical system efficiency [44].
Sustainability 10 01917 g005
Figure 6. Cross sections of external facade systems [41].
Sustainability 10 01917 g006aSustainability 10 01917 g006bSustainability 10 01917 g006c
Figure 7. Inflation rate since 1950 [46].
Sustainability 10 01917 g007
Table 1. Effective construction techniques for improving energy efficiency and building sustainability [32].
Construction TechniqueZone
OneTwoThreeFourFiveSixSevenEight
Employ lightweight construction
Maximum external areas to encourage movement of breezes through the building
Use of ceiling fans to increase ventilation
Enhance the building exposure to breezes and shading through construction techniques
Shade whole buildings in summer and winter
Use of reflective insulation and vapor barriers
Use of bulk insulation in buildings
Choose light colored roof and wall materials
Elevate building to promote airflow beneath floors
Evaporative cooling
Use passive solar design with insulated thermal mass
Convective (stack) ventilation, which vents rising hot air while drawing in cooler air
Maximize cross ventilation
Adjustable shading to control solar access
Auxiliary heating may be required
Double glazing
Draught seal thoroughly
Use airlocks to entries
Maximize solar access in winter
Minimize all east and west glazing
Minimize east and west wall areas
Maximize north facing walls and glazing
Use convective ventilation and heat circulation
Orientate buildings for solar access, exposure to cooling breezes and protection from cold winds
Minimize east, west and south facing glazing
Table 2. Annual degree days for major Australian capital cities [25].
LocationCooling Degree Day
(Based Temperature at 24 °C)
Heating Degree Day
(Based Temperature at 18 °C)
DD
Sydney5010001050
Melbourne3519001935
Brisbane123450573
Adelaide10012501350
Perth150750900
Darwin260002600
Hobart2525002525
Table 3. Required R-value of external facades systems [41].
CityClimate ZoneRequired R-Value of External Facades System
Sydney52.8
Melbourne62.8
Brisbane23.3
Adelaide52.8
Perth52.8
Darwin13.3
Hobart72.5
Table 4. Components of external facade systems [41].
External Facade SystemsR-Value (in M2/k/W)Thickness (in m)
Double-skin-masonry
 External air film0.0300.000
 External masonry skin (face brick)0.1800.110
 Air cavity (50 mm)0.1600.050
 Insulation (25 mm foil board)2.5000.025
 Internal masonry skin (common brick)0.1800.110
 13 mm plasterboard0.0650.013
 Internal paint finish0.0000.000
 Internal air film0.1200.000
Total3.2350.308
Masonry-veneer
 External air film0.0300.000
 External masonry skin0.1800.110
 Air cavity (50 mm)0.1600.050
 Sarking 0.0030.000
 Internal steel stud work 1.8 gauge (92 mm thick steel stud)0.0000.092
 Insulation (50 mm rockwool)3.0000.050
 13 mm plasterboard0.0650.013
 Internal paint finish0.0000.000
 Internal air film0.1200.000
Total3.5580.315
Compressed-fiber-cement
 External air film0.0300.000
 9 mm compressed fiber cement sheet0.0480.009
 External paint finish0.0000.000
 Curtain wall framing (100 mm air cavity)0.3200.100
 Sarking0.0030.000
 Air cavity (50 mm)0.1600.050
 Internal steel stud work 1.8 gauge (92 mm thick steel stud)0.0000.092
 Insultation (50 mm rockwool)3.0000.050
 13 mm plasterboard0.0650.013
 Internal paint finish0.0000.000
 Internal air film0.1200.000
Total3.7460.314
Precast-concrete
 External air film0.0300.000
 200 mm precast concrete0.1400.200
 External paint finish0.0000.000
 Air cavity (50 mm)0.1600.050
 Sarking 0.0030.000
 Insultation (92 mm rockwool)3.0000.092
 Internal steel stud work 1.8 (92 mm thick steel stud)0.0000.000
 13 mm plasterboard0.0650.013
 Internal paint finish0.0000.000
 Internal air film0.1200.000
Total3.5180.355
Alucobond
 External air film0.0300.000
 4 mm thick Alucobond panel0.0050.004
 Curtain wall framing (100 mm air cavity)0.3200.100
 Sarking 0.0030.000
 Air cavity (50 mm)0.1600.050
 Steel stud work 1.8 gauge (92 mm thick steel stud)0.0000.092
 Insulation (50 mm rockwool)3.0000.050
 13 mm plasterboard0.0650.013
 Internal paint finish0.0000.000
 Internal air film0.1200.000
Total3.7030.259
Double-glazed
 External air film0.0300.000
 External 6 mm bonze toughened glass0.2500.006
 Air cavity (12 mm)0.1400.012
 Internal 6 mm float glass0.1400.006
 Curtain wall framing (100 mm air cavity)0.3200.100
 Air cavity (50 mm)0.1600.050
 Blind 0.0000.000
 Internal air film0.1200.000
Total1.1600.174
Single-glazed-spandrel
 External air film0.0300.000
 6 mm bronze and grey glass incorporated into 100 mm aluminum frame0.2700.100
 Curtain wall framing (100 mm air cavity)0.3200.100
 Air cavity (50 mm)0.1600.050
 Internal steel stud work 1.8 (92 mm thick steel stud)0.0000.092
 Insulation (50 mm rockwool)3.0000.050
 13 mm plasterboard0.0650.013
 Internal paint finish0.0000.000
 Internal air film0.1200.000
Total3.9650.415
Bondor-panel
 External air film0.0300.000
 125 mm Bondor panel3.2900.125
 Curtain wall framing (100 mm air cavity)0.3200.100
 Sarking0.0030.050
 Air cavity (50 mm)0.1600.000
 Internal steel stud work 1.8 (76 mm thick steel stud)0.0000.076
 13 mm plasterboard0.0650.013
 Internal paint finish0.0000.000
 Internal air film0.1200.000
Total3.9880.364
Greenboard
 External air film0.0300.000
 100 mm Greenboard3.4800.100
 13 mm render0.0100.013
 External paint finish0.0000.000
 Curtain wall framing (100 mm air cavity)0.3200.100
 Sarking 0.0030.050
 Air cavity (50 mm)0.1600.000
 Internal steel stud work 1.8 gauge (76 mm thick steel stud)0.0000.076
 13 mm plasterboard0.0650.013
 Internal paint finish0.0000.000
 Internal air film0.1200.000
Total4.1880.352
Kingspan
 External air film0.0300.000
 80 mm Kingspan panel4.1500.080
 Curtain wall framing (100 mm air cavity)0.3200.100
 Sarking0.0030.000
 Air cavity (50 mm)0.1600.050
 Internal steel stud work 1.8 gauge (76 mm thick steel stud)0.0000.076
 13 mm plasterboard0.0650.013
 Internal paint finish0.0000.000
 Internal air film0.1200.000
Total4.8480.319
Eco-block
 External air film0.0300.000
 280 mm corefilled Eco-block3.3100.280
 13 mm render0.0100.013
 External paint finish0.0000.000
 Air cavity (50 mm)0.1600.050
 Sarking0.0000.000
 Internal steel stud work 1.8 gauge (76 mm thick steel stud)0.0000.076
 13 mm plasterboard0.0700.013
 Internal paint finish0.0000.000
 Internal air film0.1200.000
Total3.7000.432
Table 5. Construction cost of external facade systems ($/m2).
External Facade SystemsSydneyMelbourneBrisbaneAdelaidePerthDarwinHobart
Double-skin-masonry
 External masonry skin (face brick)94.60108.0097.00171.5090.80197.23108.00
 Insulation (25 mm foil board)16.9014.9517.5014.2516.6016.3914.95
 Internal masonry skin (common brick)78.5096.2077.00146.0085.80167.9096.20
 13 mm plasterboard27.5030.0026.0034.0032.5039.1030.00
 Internal paint finish11.8010.309.7512.3510.9514.2010.30
 Total229.30259.45226.80378.10236.65434.82259.45
Masonry-veneer
 External masonry skin94.60108.0097.00171.5090.80197.23108.00
 Sarking 6.505.856.355.256.156.045.85
 Internal steel stud work 1.8 gauge (92 mm thick steel stud)34.0029.9020.6037.0030.2042.5529.90
 Insulation (50 mm rockwool)15.0015.6517.3014.5016.8516.6815.65
 13 mm plasterboard27.5030.0026.0034.0032.5039.1030.00
 Internal paint finish11.8010.309.7512.3510.9514.2010.30
 Total189.40199.70177.00274.60187.45315.79199.70
Compressed-fiber-cement
 9 mm compressed fiber cement sheet200.00200.00200.00190.00195.00218.50200.00
 External paint finish13.0011.0010.9513.5511.4515.5811.00
 Curtain wall framing 330.00320.00330.00315.00320.00393.75320.00
 Sarking6.505.856.355.256.156.045.85
 Internal steel stud work 1.8 gauge (92 mm thick steel stud)34.0029.9020.6037.0030.2042.5529.90
 Insulation (50 mm rockwool)15.0015.6517.3014.5016.8516.6815.65
 13 mm plasterboard27.5030.0026.0034.0032.5039.1030.00
 Internal paint finish11.8010.309.7512.3510.9514.2010.30
 Total637.80622.70620.95621.65623.10746.40622.70
Precast-concrete
 200 mm precast concrete290.00275.00650.00340.00319.00391.00275.00
 External paint finish13.0011.0010.9613.5511.4515.5811.00
 Sarking 6.505.856.355.256.156.045.85
 Insulation (50 mm rockwool)15.0015.6517.3014.5016.8516.6815.65
 Internal steel stud work 1.8 (92 mm thick steel stud)24.0029.9020.6037.0030.2042.5529.90
 13 mm plasterboard27.5030.0026.0034.0032.5039.1030.00
 Internal paint finish11.8010.309.7512.3510.9514.2010.30
 Total387.80377.70740.95456.65427.10525.15377.70
Alucobond
 4 mm thick Alucobond panel350.00340.00335.00340.00340.00391.00340.00
 Curtain wall framing330.00320.00330.00315.00320.00393.75320.00
 Sarking6.505.856.355.256.156.045.85
 Steel stud work 1.8 gauge (92 mm thick steel stud)34.0029.9020.6037.0030.2042.5529.90
 Insulation (50 mm rockwool)15.0015.6517.3014.5016.8516.6815.65
 13 mm plasterboard27.5030.0026.0034.0032.5039.1030.00
 Internal paint finish11.8010.309.7512.3510.9514.2010.30
 Total774.80751.70745.00758.10756.65903.32751.70
Double-glazed
 Double-glazed window318.00325.00380.00325.00376.00373.75325.00
 Curtain wall framing451.00428.00660.00440.00493.00506.00428.00
 Blind45.5045.5045.5045.5045.5045.5045.50
 Total814.50798.501085.50810.50914.50925.25798.50
Single-glazed-spandrel
 6 mm bronze and grey glass incorporated into 100 mm aluminum frame253.00259.00259.00259.00260.00297.85259.00
 Curtain wall framing 330.00320.00330.00315.00320.00393.75320.00
 Internal steel stud work 1.8 (92 mm thick steel stud)34.0029.9020.6037.0030.2042.5529.90
 Insulation (50 mm rockwool)15.0015.6517.3014.5016.8516.6815.65
 13 mm plasterboard27.5030.0026.0034.0032.5039.1030.00
 Internal paint finish11.8010.309.7512.3510.9514.2010.30
 Total671.30664.85662.65671.85670.50804.13664.85
Bondor-panel
 125 mm Bondor panel173.70173.70178.00173.70178.00199.76173.70
 Curtain wall framing330.00320.00330.00315.00320.00393.75320.00
 Sarking6.505.856.355.256.156.045.85
 Internal steel stud work 1.8 (76 mm thick steel stud)34.0029.9020.6037.0030.2042.5529.90
 13 mm plasterboard27.5030.0026.0034.0032.5039.1030.00
 Internal paint finish11.8010.309.7512.3510.9514.2010.30
 Total583.50569.75570.70577.30577.80695.40569.75
Greenboard
 100 mm Greenboard71.4070.6978.5471.4079.2582.1170.69
 13 mm render26.3028.2039.1034.1029.2039.2228.20
 External paint finish13.0011.0010.9513.5511.4515.5811.00
 Curtain wall framing330.00320.00330.00315.00320.00393.75320.00
 Sarking6.505.856.355.256.156.045.85
 Internal steel stud work 1.8 gauge (76 mm thick steel stud)34.0029.9020.6037.0030.2042.5529.90
 13 mm plasterboard27.5030.0026.0034.0032.5039.1030.00
 Internal paint finish11.8010.309.7512.3510.9514.2010.30
 Total520.50505.94521.29522.65519.70632.55505.94
Kingspan
 80 mm Kingspan panel190.00190.00190.00190.00190.00190.00190.00
 Curtain wall framing330.00320.00330.00315.00320.00393.75320.00
 Sarking6.505.856.355.256.156.045.85
 50 mm furning channel35.9831.6421.8039.1531.9645.0331.64
 13 mm plasterboard27.5030.0026.0034.0032.5039.1030.00
 Internal paint finish11.8010.309.7512.3510.9514.2010.30
 Total601.78587.79583.90595.75591.56688.12587.79
Eco-block
 280 mm corefilled Eco-block170.00168.30187.00170.00188.70195.50168.30
 13 mm render26.3028.2039.1034.1029.2039.2228.20
 External paint finish13.0011.0010.9513.5511.4515.5811.00
 Sarking 6.505.856.355.256.156.045.85
 Internal steel stud work 1.8 gauge (76 mm thick steel stud)34.0029.9020.6037.0030.2042.5529.90
 13 mm plasterboard27.5030.0026.0034.0032.5039.1030.00
 Internal paint finish11.8010.309.7512.3510.9514.2010.30
 Total289.10283.55299.75306.25309.15352.19283.55
Table 6. R-value and U-value of external facade systems.
External Facade SystemsR-ValueU-Value
Double-skin-masonry3.2350.309
Masonry-veneer3.5580.281
Compressed-fiber-cement3.7460.267
Precast-concrete3.5180.284
Alucobond3.7030.270
Double-glazed1.1600.862
Single-glazed-spandrel3.9650.252
Bondor-panel3.9880.251
Greenboard4.1880.239
Kingspan4.8480.206
Eco-block3.7000.270
Table 7. Annual space heating and cooling cost (in $/m2).
External Facade SystemSydneyMelbourneBrisbaneAdelaidePerthDarwinHobart
Double-skin-masonry2.193.931.162.741.835.285.13
Masonry-veneer1.943.581.062.491.664.804.67
Compressed-fiber-cement1.843.401.012.371.584.564.43
Precast-concrete1.963.621.072.521.684.864.72
Alucobond1.863.441.022.401.604.624.48
Double-glazed5.9510.973.257.655.1014.7414.31
Single-glazed-spandrel1.743.210.952.241.494.314.19
Bondor-panel1.733.190.942.231.484.294.16
Greenboard1.653.040.902.121.414.083.96
Kingspan1.422.620.781.831.223.533.42
Eco-block1.873.441.022.401.604.624.49
Table 8. Annual rental loss for external facade systems (in $).
External Facade SystemSydneyMelbourneBrisbaneAdelaidePerthDarwinHobart
Double-skin-masonry323.13138.60215.60154.00215.6038.50110.88
Masonry-veneer278.25119.25185.50132.50185.5033.1395.40
Compressed-fiber-cement277.20118.80184.80132.00184.8033.0095.04
Precast-concrete372.75159.75248.50177.50248.5044.38127.80
Alucobond271.95116.55181.30129.50181.3032.3893.24
Double-glazed182.7078.30121.8087.00121.8021.7562.64
Single-glazed-spandrel372.50159.75248.50177.50248.5044.38127.80
Bondor-panel382.20163.80254.80182.00254.8045.50131.04
Greenboard369.60158.40246.40176.00246.4044.00126.72
Kingspan334.95143.55223.30159.50223.3039.88114.84
Eco-block453.60194.40302.40216.00302.4054.00155.52
Table 9. Average office rental return rates in major Australian capital cities [42].
LocationAverage Office Rental Return Rate (in $/m)
Sydney1050
Melbourne450
Brisbane700
Adelaide500
Perth700
Darwin125
Hobart360
Table 10. Maintenance cost of external facade systems (in $/m2).
External Facade SystemSydneyMelbourneBrisbaneAdelaidePerthDarwinHobart
Double-skin-masonry10.6011.6810.2117.0110.6519.5711.68
Masonry-veneer8.528.997.9712.368.4414.218.99
Compressed-fiber-cement28.7028.0227.9427.9728.0433.5928.02
Precast-concrete17.4517.0033.3420.5519.2223.6317.00
Alucobond34.8733.8333.5334.1134.0540.6533.83
Double-glazed36.6535.9348.8536.4741.1541.6435.93
Single-glazed-spandrel30.2129.9229.8230.2330.1736.1929.92
Bondor-panel26.2625.6425.6825.9826.0031.2925.64
Greenboard23.4222.7723.4623.5223.3928.4622.77
Kingspan25.6725.0525.1025.3925.4230.6225.05
Eco-block13.0112.7613.4913.7813.9115.8512.76
Table 11. Life-cycle cost for double-skin-masonry facade system in Sydney ($/m2).
YearConstruction Cost, CSpace Heating and Cooling Cost, HCRental Loss, RLMaintenance Cost, MTotal CostLife-Cycle Cost, F
0229.300.000.000.00229.30229.30
10.002.19332.1310.60344.92574.22
20.002.25341.1010.88354.23928.45
30.002.31350.3111.18363.791292.25
40.002.37359.7711.48373.621665.87
50.002.43369.4811.79383.712049.58
60.002.50379.4612.11394.072443.65
70.002.57389.7012.44404.702848.36
80.002.64400.2212.77415.633263.99
90.002.71411.0313.12426.853690.85
100.002.78422.1313.47438.384129.23
110.002.86433.5313.83450.224579.45
120.002.93445.2314.21462.375041.83
130.003.01457.2514.59474.865516.69
140.003.09469.6014.99487.686004.37
150.003.18482.2815.39500.846505.21
160.003.26495.3015.81514.377019.58
170.003.35508.6716.23528.257547.84
180.003.44522.4116.67542.528090.36
190.003.53536.5117.12557.168647.53
200.003.63551.0017.58572.219219.75
Table 12. Life-cycle cost of external facade systems.
External Facade SystemsSydneyMelbourneBrisbaneAdelaidePerthDarwinHobart
Double-skin-masonry9219.754387.456302.585029.446342.092130.673677.52
Masonry-veneer7917.973728.195384.214219.065309.251681.103118.94
Compressed-fiber-cement8875.804643.896342.794967.446362.892651.064035.58
Precast-concrete10,885.635100.568149.125708.707638.722475.704380.09
Alucobond9037.874869.116396.905202.076564.122981.704273.17
Double-glazed6714.164076.925740.514320.585413.143016.553820.33
Single-glazed-spandrel11,504.715827.988138.426292.598170.243076.084998.90
Bondor-panel11,563.855726.248104.206204.268134.292865.824875.33
Greenboard11,085.455436.937769.215920.327779.452681.634613.68
Kingspan10,262.135140.367227.835562.737255.362661.924393.24
Eco-block12,829.755921.118783.056521.528819.342345.714908.42

