Abstract
This paper, firstly, empirically examines the relationship between Chinese companies’ cross-border mergers and acquisitions and the acquirers’ innovation performance. Secondly, it investigates the moderate effects of industrial policy and intellectual property protection on the relationship between cross-border M&A and the acquirers’ innovation performance. At the same time, based on the perspective of corporate heterogeneity, the effect of state-owned equity on the above-mentioned moderate relationship was analyzed. The conclusions are as follows: First, Chinese companies’ cross-border acquisitions have significantly improved the acquirers’ innovation performance. Second, industrial policies negatively affect the relationship between cross-border mergers and acquisitions and the acquirers’ innovation performance. Third, the moderating role of intellectual property protection is not stable. Fourth, state-owned equity negatively affects the relationship between cross-border M&A and the acquirers’ innovation performance; the third-order interaction of state-owned equity on intellectual property protection, cross-border mergers and acquisitions, and the acquirers’ innovation performance shows that the special relationship between state-owned enterprises and the government not only failed to help them make better use of intellectual property protection for technological innovation, it also adversely hindered the realization of its innovative performance.
1. Introduction
With the continued growth of the Chinese economy has resulted in rising labor costs, a lack of resources, and serious environmental pollution. The traditional mode of economic development has encountered bottlenecks, such as a decline in investment, problems with the trade balance, and reduced domestic demand. Therefore, accelerating the cultivation of new competitive advantages has become an important aspect of China’s economically sustainable development. To achieve this goal, firstly, the Chinese government has issued relevant plans at the institutional level to promote the sustainable development of the Chinese economy. For example, in 2015, the Chinese government introduced the “Made in China 2025”. It proposes that China will adopt the “three-step” to achieve its goal of becoming a powerful nation in the future: as a first step, to reach the primary level of manufacturing power by 2025; and in the second step, China’s manufacturing industry as a whole will reach the middle level of the world’s manufacturing power by 2035. The third step, when the People’s Republic of China, was founded a hundred years ago; it entered the advanced level of manufacturing power in the world.
Second, Chinese companies have accelerated technological innovation in order to increase their competitive advantage in the international market. For example, in 2015, Chinese companies submitted 2,798,500 patent applications, an increase of 18.52% compared to 2014. Besides, during the past seven years, the number of patent applications filed by Chinese companies has increased at an average rate of 26.65% (2016 China Science and Technology Statistical Yearbook). As shown in Figure 1.
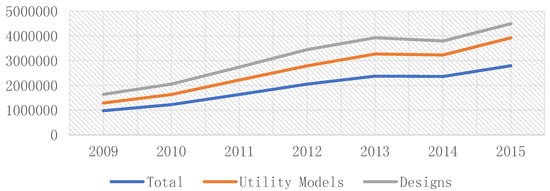
Figure 1.
The number of Patent Applications.
Third, Chinese companies have acquired advanced technology resources in developed countries through “go global” (cross-border mergers and acquisitions), accelerating their integration into global value chains and thereby achieving a higher value. For example, in 2016, China’s outward direct investment flows reached $196.1 billion, an increase of 34.7% year-on-year. At the same time, Chinese companies launched a total of 765 cross-border M&A involving as many as 74 countries. These countries include both the developed market, the new industrialization market, and the emerging market. Among them, the developed market includes the United States, Britain, Germany, France, Canada, Australia, New Zealand, Finland, Japan, Israel, and so on. The new industrialization markets include Taiwan Province of China, Hong Kong, Singapore, South Korea, and so on. The emerging market includes India, Malaysia, Cambodia, Czech Republic Indonesia, Russian Federation, Vietnam, Thailand, Mongolia, Brazil, and so on. Furthermore, it is worth noting that the amounts of cross-border mergers and acquisitions by Chinese companies in 2016 amounted to $135.3 billion, an increase of 148.6% year-on-year. Among all acquisitions, technology-seeking has performed particularly well. Among them, technology-intensive industries such as manufacturing, information software, and information services are the most significant, with a total amount of $56.5 billion (2016 China Foreign Investment Statistics Bulletin).
The main reason for this situation is the comparative advantages established by the Chinese manufacturing and communications industries in the international community in recent years. Firstly, China has strengthened the construction of a new generation of information infrastructure. China hopes to take this opportunity to achieve leap-forward development, thus increasing its investment in this area. Secondly, the development of global industries needs to complement the characteristics of China’s industries. Other developing countries lack funds to promote the construction of their own information and communication infrastructure. China’s information and communication industry chain is relatively complete. Its overall strength is outstanding. It has the support of strong financial institutions and is highly complementary, which is conducive to the comparative advantage of competition. Thirdly, after years of development and cooperation with foreign countries, China has formed a number of globally renowned information and communications companies, such as Huawei, which manufactures equipment, and its overseas revenue accounts for over 50% of the total; in terms of science and technology R&D, China’s new generation of information and communication technologies have mastered the core technology and are close to the level of developed countries (2017 China Foreign Investment Cooperation Development Report).
In addition, for cross-border mergers and acquisitions in the emerging markets, the existing studies mostly explain the successes of cross-border mergers and acquisitions, from the perspective of the host country institutional [1], the acquirers’ performance [2], and the acquirers’ innovation performance [3]. However, the research on the relationship between mergers and acquisitions and innovation performance has been hugely controversial. For example, some scholars believe that mergers and acquisitions improve corporate innovation performance. M&A can not only effectively shorten the time required for technological innovation and promote economies of scale in research and development, it can also increase the scope of R&D resources within the company and enhance the ability of the company to absorb technology, which will help improve corporate innovation performance [4,5,6]. However, other scholars believe that mergers and acquisitions reduce the company’s innovation performance. It may lead to changes in internal organizational structures and operational processes. This will not only affect the competition of market, but also increase the cost of external R&D, which in turn reduces corporate innovation performance [7]. Faced with the above arguments, what is the relationship between cross-border M&A and corporate innovation performance? The results of empirical studies are truly confusing.
Finally, in the past thirty years, neo-institutionalism [8,9,10,11] and institutional theory developed rapidly [12,13,14,15]. Strategic management scholars have proposed the industry-based view [16], the resource-based view [17], and so on. However, Peng believes that strategic management research should consider the importance of institutional factors [18,19,20]. In addition to the industry-based and resource-based views, existing theories should also introduce the institutional-based view. With the evolution of global economic integration, more and more strategic management scholars have begun to recognize the importance of institutions in emerging markets [21,22,23]. Unlike the developed countries, the technological innovation of Chinese companies is largely influenced by the government. First, the government’s industrial policies will have an impact on the technological innovation of Chinese companies. The Chinese government usually introduces new industrial policies every five years. For example, “The 13th Five-Year Plan for the National Economic and Social Development of the People’s Republic of China”, “The National Strategic Emerging Industries Development Plan of the 13th Five-Year Plan”, and “The National Science and Technology Innovation Plan of the 13th Five-Year Plan”. However, whether industrial policies can promote the innovation of Chinese companies is still a matter of controversy. Second, as an important institutional arrangement to encourage the production of new knowledge, the influence of intellectual property protection on technological innovation and economic growth in a country or region, has received increasing attention. However, different from the high degree of consensus reached by the strengthening of intellectual property protection in favor of technological innovation in developed countries, it is still a controversial issue whether it can promote the innovation capability of the company in the developing countries. The controversy is so great that it plagues the decision-making of the Chinese government.
Therefore, the purpose of this paper is as follows. The first is to explore the relationship between cross-border mergers and acquisitions by Chinese companies and the acquirers’ innovation performance. The second is to explore the industrial policy and intellectual property protection in moderating the relationship between the two. The third is to explore the third-order interaction between state-owned equity and industrial policy, intellectual property protection, Chinese companies’ cross-border mergers and acquisitions, and the acquirers’ innovation performance. The following content of this paper is organized as follows: The second part analyzes the theoretical mechanism and hypotheses; the third part introduces the variables, data, and model; the fourth part contains the results and analysis; the fifth part contains the robustness test; and the last contains the conclusion and future research directions.
2. Theoretical and Hypothesis
2.1. Cross-Border M&A and the Acquirers’ Innovation Performance
Schumpeter believes that innovation is a creative destruction process and is the driving force of economic development [24]. In his view, there are five forms of innovation, namely, the introduction of a new product, the introduction of a new production method, the opening of a new market, the acquisition of a new source of raw materials and semi-finished suppliers, and the introduction of a new type of organization. Based on the definition of innovation by Schumpeter, Crossan and Apaydin defined innovation more comprehensively. Innovation is production or adoption, assimilation, and exploitation of a value-added novelty in economic and social spheres; renewal and enlargement of products, services, and markets; development of new methods of production; and establishment of new management systems. It is both a process and an outcome [25]. According to this definition, corporate innovation performance can be divided into two parts: innovation process performance and innovation output performance. Innovation process performance reflects the management level of corporate technological innovation activities, and innovation output performance is mainly reflected from R&D performance. The acquirers’ innovation performance refers to innovation output performance in this paper. The existing research on the measurement of innovation output performance can be mainly divided into two types. One is measurement based on patent activity, including the number of patent applications, the number of patent authorizations, or the number of patent citations. The second measure is based on the market value of new products. In this paper, we refer to the research of Li, M, and Yu, T.J [3], Yuan, J.G et al. [26], adopting the total number of patent applications to measure the acquirers’ innovation performance and the total number of invention patent applications to replace patent applications for robustness tests simultaneously.
Barney believes that the key to a company’s sustainable competitive advantage is that it has resources that cannot be duplicated, irreplaceable, valuable, and scarce [17]. From the perspective of knowledge-based view, knowledge is the main source of corporate value. For example, the products and services that companies provide to customers can be regarded as the application of knowledge. As a result, companies are considered to be an organization that produce, store, and integrate knowledge [27,28]. The link between the knowledge-based view and the resource-based view lies in the continuation of the logic of the resource, which highlights the position of knowledge as a strategic resource for enterprises [27]. The knowledge-based view provides an important theoretical perspective for cross-border mergers and acquisitions [29,30]. It regards the corporate as a collection of knowledge. The premise is that an enterprise can only achieve efficiency in the market if it has better operational and learning capabilities than its competitors [31].
Therefore, in the process of cross-border mergers and acquisitions, it is crucial to integrate the knowledge of target [29,30,32]. However, the integration of knowledge is more difficult [26], because of the characteristics of knowledge [33]. Generally speaking, knowledge is divided into two categories: tacit and explicit. Tacit knowledge is not easily coded; it can only be obtained through the hands-on practice of a company or individual. Besides, the transfer of tacit knowledge is costly and transferability is limited by its embeddedness in individuals, teams, and organizations. Therefore, if technology is viewed as embedding knowledge of individuals and organizations; its speed and direction are also driven by the individual’s cognitive processes [34]. Conversely, explicit knowledge is easy to code and standardize, and can be transferred through verbal and written communication [28]. However, explicit knowledge also has many problems: the first is that any individual who seeks his or her own interests can profit from the resale [35]; the second is that the profit-making behavior enables it to be acquired and used by potential buyers and is not proprietary [36].
When considering cross-border mergers and acquisitions to obtain the targets’ resources, the most important resources to obtain are the knowledge-based resources [29,30,32,37]. M&A are easier to transfer, and can be easily used to integrate the targets’ knowledge base and apply it to the acquirers’ production and operation activities. This is a more effective way to achieve tacit knowledge. First, the non-replicable and invisible knowledge possessed by the target provides the possibility to realize the transfer of tacit knowledge through cross-border M&A. For example, after the completion of mergers and acquisitions, by integrating the knowledge of both parties, it is possible to create synergies in the R&D field, which in turn will reduce the cost of R&D. [5]. Second, acquiring foreign companies’ heterogeneous knowledge resources and expanding the knowledge base will help improve the acquirers’ innovation performance. There may be complementary effects between the knowledge gained through the merger and acquisition and the knowledge owned by the original company. On the one hand, the acquirer can use this newly acquired knowledge to carry out secondary innovations; on the other hand, the technology produced by secondary innovations has further enriched and improved the original knowledge. Rich knowledge resources enhance the flexibility of the company’s strategy, and the company’s sustainable competitive advantage and innovation performance [38]. Ahuja, Katila, and Puranam et al. considered mergers and acquisitions as an important means with which to acquire and absorb the knowledge owned by the target company [39,40]. In addition, M&A activity represented by technology-intensive industries such as medicine, electronics, communications, and biology has been active in recent years, which also shows that M&A is a means with which to acquire the targets’ heterogeneous knowledge resources and reconstruct the company’s competitive advantage [41].
The theoretical mechanism is as follows: According to KBV, the companies’ knowledge base defines the range and capabilities for understanding and applying new knowledge to produce radical innovations [42]. Therefore, the breadth and depth of the knowledge possessed by the acquirers’ have an impact on innovation performance. The breadth of knowledge refers to the extent to which the enterprise knowledge base contains unique and multiple domains; the depth of knowledge refers to the level of knowledge and complexity in key areas [43]. On the one hand, the breadth of the acquirers’ knowledge has an impact on innovation performance. The more extensive the knowledge possessed by the acquirers’, the more likely it is to accumulate more knowledge from various disciplines and differentiated markets [44]. The breadth of the acquirer’s knowledge has laid the foundation for further knowledge sharing. On the other hand, the depth of the acquirers’ knowledge also has an impact on innovation performance. The company with in-depth knowledge often has accumulated a great deal of specialized knowledge about technology and markets that it is more likely to promote radical innovation. Furthermore, the breadth and depth of knowledge alone is not enough to generate radical innovation. The remaining four aspects are also crucial. The first is the search for new knowledge. Searching for new knowledge from the market through mergers and acquisitions expands the scope of the original knowledge. This new information may generate radical innovations [45]. Searching for new knowledge helps to break organizational inertia and change the company’s original thinking, thus promoting radical innovation. The second is the importance of the knowledge sharing mechanism. Knowledge sharing refers to the creation of new knowledge through the reorganization of knowledge by ‘kaleidoscopic thinking’ [46]. The process of knowledge sharing can integrate a lot of tacit knowledge, which can stimulate the fundamental innovation of the company [47]. Thirdly, the knowledge integration mechanism is very important. Knowledge sharing alone does not guarantee the development of successful new products. Verona believes that companies must use the integration mechanism of knowledge, on the one hand to obtain the key knowledge needed for innovation from the outside, and on the other hand to promote the generation of new knowledge from the flow and transfer process of internal organization personnel [48]. The broad knowledge base of the acquirers’ provides different platforms for communication and exchange among functional departments. Through continuous interactions and exchanges between various functional departments, individuals gradually realize the influence of others’ knowledge on their own work, and how to better integrate other people’s knowledge and ultimately achieve radical innovation [49]. As a result, the cross-departmental exchanges between M&A parties promoted technological innovation. Based on this, the following hypothesis was put forward:
Hypothesis 1a.
Cross-border mergers and acquisitions by Chinese corporates are conducive to improving the acquirers’ innovation performance.
2.2. Home-Country Institution Environment, Cross-Border M&A and the Acquirers’ Innovation Performance
The institution is an artificially designed constraint that shapes the interaction between people [8]. Institution is often divided into formal (political, legal, and contractual), and informal (social culture, behavioral norms and routines). Scott believes that the institution includes adjustment mechanism, normative mechanism, and cognitive mechanism [14]. It not only ensures social stability, but also clarifies the significance of social activities. In reality, the formal institution will affect corporate behavior, mainly reflected by the influence of government policies, laws, and regulations on corporate behavior. Government policies often produce both incentives and constraints. The incentive is that the government supports corporate development through various forms such as financial subsidies, tax deductions, and providing low-interest loans, while constraint involves the government restricting certain types of companies from entering certain industries. For example, industrial policy, as one of the “three major policies” (industrial policy, monetary policy, and fiscal policy) of China’s government’s macro-control, has a profound influence on business operations. Industrial policy usually restricts the development of certain enterprises and at the same time encourages the development of other companies, which indirectly influences the relationship between cross-border M&A and the acquirers’ innovation performance. The intellectual property protection as a legal rule represents the country’s emphasis on intellectual property. It has an important influence on Chinese companies’ cross-border acquisitions and innovation performance. Therefore, this article selects industrial policy and intellectual property protection as a moderate variable based on institutional perspectives to explore the impact of national institutions on the relationship between cross-border M&A and the acquirers’ innovation performance.
2.2.1. Industrial Policy, Cross-Border M&A, and the Acquirers’ Innovation Performance
Is the rapid growth of the Chinese economy due to the establishment of a market mechanism, the reduction of government control, or the guiding role of the country’s macro-level industrial policies? This debate has never stopped. One side holds a positive view of industrial policy and believes that the government still occupies a dominant position in economy. Its macroeconomic adjustment still relies mainly on three major policies (fiscal policy, monetary policy, and industrial policy). The industrial policy is that the government allocates resources rationally. The best medicine is to optimize the industrial structure, promote the upgrading of industrial technology, and increase industrial productivity [50]. Zhou Z.H found that industrial policy as an institutional arrangement promoted the development of related industries in China [51]. Some scholars stress that the use of industrial policies to increase industrial productivity and labor employment is a common practice worldwide [52]. On the other hand, the other side holds a negative view of industrial policy and believes that it will not improve the company’s production efficiency. Instead, it will strengthen government control, lead to “rent-seeking” behavior, and increase the cost of market transactions [53]. Zhang W.Y thinks that the economic achievements made in China during the 30 years of reform and opening up have benefited mainly from the transition from a planned economy to a market economy, thanks to the relaxation of government regulations. In addition to the discussion in the macro field, another set of literature extends the impact of industrial policy. For example, industrial policy has an effect on corporate investments [54], corporate financing [55], corporate export performance [56], and corporate technological innovation [57,58].
In current research, most scholars hold positive opinions on industrial policies. That is, industrial policies not only promote the development of related industries, but also promote enterprises’ technological innovation. Technological innovation is a high-risk and high-input investment, and industrial policies will affect finances [50,54], taxation [50,54], equity financing [55], bank credit [54,55,58], and market competition [57,58]. It will ultimately promote the enterprises’ technological innovation by reducing the capital constraints.
The mechanism is as follows: First, industrial policy encourages enterprises to increase R&D investment through financial subsidies, tax deductions, and credit enhancements, thereby improving the acquirers’ innovation performance. For example, the government’s financial subsidies and tax deductions for key industries and enterprises’ R&D activities not only reduce the marginal cost of technological innovation, but also enable it to obtain more resources, which in turn increases R&D investment and accelerates technology catch-up pace [50,58]. Second, industrial policy enhances the acquirers’ innovation performance by improving the equity financing capabilities of listed companies and acquiring bank credit capabilities. For example, Chen D.H shows that industrial policies have a significant impact on corporate IPO financing behavior and long-term borrowing behavior, and industries encouraged by industrial policies have more financing opportunities [55]. Third, industrial policies will enhance the acquirers’ innovation performance by promoting market competition. Usually, to promote the development of related industries, the government will loosen the conditions for market access, project approval, etc., and thus can attract more companies to invest in the industry. This indirectly increases market competition and promotes the investment of companies in R&D. It will help improve the enterprises’ innovation performance. For example, to promote the innovative development of the industry, the government encourages the development of higher education institutions, research institutions, and intermediary service agencies according to the characteristics of the industry, and introduces “fiscal subsidies”, “tax protection”, and “production-study-research cooperation.” Relevant policies encourage companies to increase their investment in R&D, promote technological competition among enterprises, and then increase the acquirers’ innovation performance. Aghion et al. found that government subsidies and tax incentives can effectively increase the intensity of market competition and promote the improvement of Total Factor Productivity [59]. In the process of cross-border mergers and acquisitions, industrial policies actively encourage Chinese companies to acquire target with advanced technology and R&D capabilities in developed countries to enhance the acquirers’ technological innovation. Based on this, the following hypothesis is put forward:
Hypothesis 2a.
When other conditions remain unchanged, industrial policy has a positive effect on the relationship between cross-border M&A and the acquirers’ innovation performance.
As one coin has two sides, industrial policies have a negative impact on corporate technological innovation. The negative impact of industrial policy on corporate technological innovation is mainly reflected in four aspects: the first is that industrial policies may trigger political rent-seeking [60]. Although industrial policies can promote some areas and industries to obtain government subsidy resources and upgrade the resource endowments, according to the logic of resource curse, the relevant formal systems in developing countries are not perfect, and they may also trigger political rent-seeking behavior. The political rent-seeking not only increases the transaction cost of the enterprise’s technological innovation and causes the waste of resources, it also destroys the fair market competition relationship, reduces the driving force for the enterprises to carry out technological innovation, and is not conducive to the realization of technological innovation. Second, industrial policies may trigger speculative behavior in technological innovation [57]. For example, according to the information asymmetry theory, due to the information asymmetry between the government and enterprises, the government’s various subsidies for corporate innovation behavior may stimulate the enterprises to carry out strategic technological innovations in order to defraud subsidies. Third, industrial policies may cause excess capacity [61]. Industrial policy incentives for a certain industry or sector are likely to stimulate a large number of companies to enter a certain industry at the same time, eventually leading to excess capacity, resulting in a large number of redundant constructions, resulting in the phenomenon of oversupply, and ultimately leading to bankruptcy. For example, the government strongly supports the development of the photovoltaic industry, resulting in excess capacity in the industry. Eventually, Wuxi Suntech, a listed company in China’s photovoltaic manufacturing industry, has filed for bankruptcy protection. Fourth, industrial policies may lead to a decline in the competitiveness of enterprises [58] and so on, thereby curbing corporate technological innovation. For example, industrial policies selectively support the development of certain enterprises through various preferential policies, which may lead to companies that should have been eliminated by the market and rely on various government subsidies surviving. This not only reduces the incentive for subsidized enterprises to carry out technological innovations, it also negatively affects the technological innovation of other companies. Based on this, the following hypothesis is put forward:
Hypothesis 2b.
When other conditions remain unchanged, industrial policy has a negative effect on the relationship between cross-border M&A and the acquirers’ innovation performance.
2.2.2. Intellectual Property Protection, Cross-Border M&A, and the Acquirers’ Innovation Performance
The term intellectual property rights refers to a cluster of legal sub-terms such as patents, copyright, trademark, and inter alia that differ in their scope, structure, and application. With regard to the impact of intellectual property protection of enterprises’ technological innovations, there are major controversies in existing research. The traditional view is that intellectual property protection has a positive effect on technological innovation. Strengthening intellectual property is conducive to encouraging technological innovation, because the protection of patents and copyrights provides more opportunities for individuals and organizations to innovate, which motivates innovators [62,63]. Besides, strengthening intellectual property protection is conducive to encouraging enterprises to increase more R&D investment and encourage technological change, thereby increasing corporate innovation [64,65,66,67]. However, other scholars believe that the impact of intellectual property protection on corporate technological innovation is related to the stage of development of a country. In developed countries, strengthening intellectual property protection is beneficial to technological innovation; in developing countries, strengthening intellectual property protection is not conducive to technological innovation [68]. The main reason is that compared to developed countries, it is difficult for developing countries to obtain knowledge sources from developed countries, because these advanced technological knowledges are strictly protected by the internal legal systems of developed countries. The technological innovation in developing countries mainly depends on “reverse engineering”. Strengthening intellectual property protection is not conducive to the realization of such reverse engineering. Therefore, strengthening intellectual property protection has increased the transaction costs in the process of the enterprises’ technological innovation, and increased the monopoly and control of downstream businesses. The monopoly of upstream companies has further distorted the allocation of resources and thus increased the prices of commodities [69,70], which is not conducive to healthy competition in the market. Therefore, strengthening intellectual property protection has reduced the driving force for technological innovation. Research by Williams [71] and Wang [72] also shows that strengthening intellectual property protection has not provided a strong incentive for R&D investment. Based on this, the following hypothesis is put forward:
Hypothesis 3a.
When other conditions remain unchanged, intellectual property protection has a positive effect on the relationship between cross-border M&A and the acquirers’ innovation performance.
Hypothesis 3b.
When other conditions remain unchanged, intellectual property protection has a negative effect on the relationship between cross-border M&A and the acquirers’ innovation performance.
2.2.3. The Moderate Effect of State-Owned Equity
Due to different institutional context, there is a huge difference between emerging markets and developed countries. At the same time, due to the fact that state-owned enterprises account for a large proportion of cross-border mergers and acquisitions in China, state-owned equity is a noteworthy factor. Existing research suggests that the relationship between state-owned equity and cross-border mergers and acquisitions and innovation performance is dual. On the one hand, state-owned equity has a positive influence on the relationship between cross-border mergers and acquisitions and the acquirers’ innovation performance. The reasons are as follows: First, the state-owned enterprises have a closer relationship with the government, but at the same time they are also facing greater government pressure. Therefore, their desire to achieve technological catch-up through cross-border mergers and acquisitions is stronger. For example, in the face of the implicit provisions, the incentive for state-owned enterprises to become stronger and bigger through mergers and acquisitions is stronger [73]. Second, based on the logic of resources, state-owned enterprises have inherent legitimacy by virtue of their special relationship with the government, and are more likely to receive preferential treatment in terms of financial support, tax deductions, and bank loans, and thus have certain comparative advantages. For example, state-owned enterprises have implicit credit guarantees from the government, and they are more likely to obtain commercial bank credit resources and public recognition. Their risk-taking ability is stronger, so it is easier to invest more money and energy in cross-border mergers and acquisitions and technological innovation. Third, based on the perspective of industry competition, state-owned enterprises, by virtue of their special relationship with the government, are more likely to obtain qualifications such as market access, and thus can enter the monopoly industries to obtain excess profits. Fourth, based on the transaction cost perspective, state-owned enterprises rely on their special relationship with the government to communicate with the law enforcement agencies more easily during the transaction process, thereby reducing the transaction costs to carry out technological innovations. Therefore, the cross-border mergers and acquisitions of state-owned enterprises can more easily enhance the acquirers’ innovation performance. Based on this, the following hypothesis is put forward:
Hypothesis 4a.
When other conditions remain unchanged, state-owned equity has a positive effect on the relationship between cross-border M&A and the acquirers’ innovation performance. At the same time, it also has a positive impact on the relationship between industrial policy, cross-border mergers and acquisitions and the acquirers’ innovative performance.
On the other hand, the close relationship between state-owned enterprises and the government makes it easier to obtain government support, but it also faces the pressure of isomorphism of the home-country institutional environment and the higher bureaucratic obstacles and political interference in the internationalization process. First, state-owned enterprises are faced with the pressure of institutional isomorphism in the home country environment. Compared with private enterprises, state-owned enterprises place greater emphasis on the legitimacy of the business process. Therefore, their business processes pay more attention to compliance and pay more attention to compliance with laws and regulations. Inefficiency inevitably exists, which is in line with the risk-taking required by technological innovation. Second, state-owned enterprises are more likely to be interfered with by the political factors of the home country in terms of the selection of multinational operating locations and selection of partners. Luo and Tung believe that state-owned multinational corporations fulfill the task of national distribution in specific fields. State-owned enterprises are likely to completely pursue political goals, that is, they do not optimize returns in the competition [74]. Third, the identity features of state-owned enterprises are more susceptible to host country boycotts, and therefore will face greater liabilities [1]. For example, in the process of internationalization, emerging-market SOEs are often subjected to more stringent political scrutiny by the host government. These obstacles make it difficult to achieve the goal of improving the innovation performance. At the same time, state-owned enterprises are more vulnerable to the negative impact of intellectual property protection because of their unique position. On the one hand, state-owned enterprises’ technological imitation behaviors are difficult to implement due to the pressure of intellectual property protection; on the other hand, state-owned enterprises often perform poorly due to lack of incentive mechanisms. This will further negatively affect the relationship between cross-border M&A and the acquirers’ innovation performance. Based on this, the following hypothesis is put forward:
Hypothesis 4b.
When other conditions remain unchanged, state-owned equity has a negative effect on the relationship between cross-border M&A and the acquirers’ innovation performance. At the same time, it also has a negative impact on the relationship between intellectual property protection, cross-border mergers and acquisitions and the acquirers’ innovative performance.
The theoretical model based on the above hypothesis is shown in Figure 2.
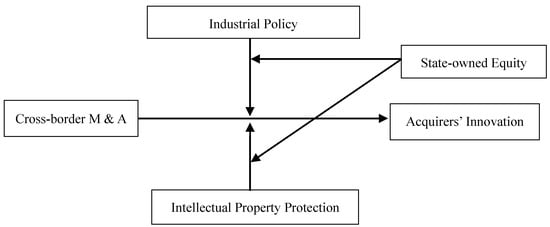
Figure 2.
Theoretical Model.
3. Methodology
3.1. Sample and Data
Cross-border acquisition data comes from the BvD (Zephyr) database. The BvD (Zephyr) database is a well-known database in the field of international M&A. Currently, it has collected more than 1 million M&A transaction records from various industries around the world, adding an average of approximately 100,000 M&A transactions each year. The data can be traced back to 1997 and covers transaction records in Asia Pacific and China. This database is a widely recognized and used by scholars in the fields of M&A research. We have screened the data according to the following principles: First, this paper screened the transaction data of Cross-border M&A events of China’s listed companies (excluding those outside mainland of China) from 2001 to 2011. Multiple mergers and acquisitions that occur in the same year and in the same company are calculated based on the maximum transaction amount. Second, it uses the obtained data of the acquirer to compare with the basic information of the listed companies in the CSMAR database to determine the corporates’ code, as well as its industry and region. Third, it excludes the sample of the acquiring party as an individual, and excludes ST and PT companies, and eventually obtained a total of 191 M&A transactions. The CSMAR database is a professional standard of Guotai An Information Technology Co., Ltd. (Shenzhen, China) that draws on the internationally renowned databases of CRSP, Compustat, TAQ, I/B/E/S, Thomson, etc., and combines economic and financial development with China’s actual national conditions. It has covered 18 series including factor research, character characteristics, green economy, stocks, and companies, including 130 databases, more than 4000 tables, and more than 40,000 fields. The further description of the sample is shown in Table 1, Figure 3.

Table 1.
The description of sample.
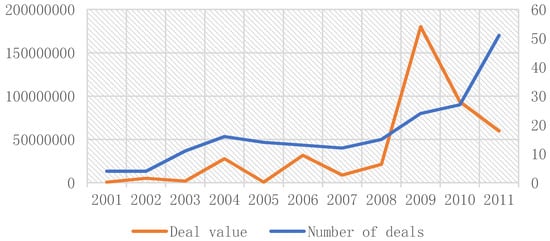
Figure 3.
The Diagram of Deal Trend.
3.2. Measures
- (1)
- Dependent variable: the acquirers’ innovation performance. The existing research methods for measuring innovation performance can be mainly divided into two types. One is measurement based on patent activity, including the number of patent applications, patent authorizations, or patent citations. The second measure is based on the market value of new products. In reference to the research of Li, M and Yu, T.J [3]; Yuan, J.G et al. [26], we adopt the applications of patent (patents) to measure the acquirers’ innovation performance, and the applications of invention patent (patents) for robustness tests. The patent data comes from the office website of State Intellectual Property Office of the People’s Republic of China.
- (2)
- Independent variable: the natural logarithm of cross-border M&A transactions (lnma_scale). Since the unit of M&A transactions announced by the Zephyr is Euro, we convert it into RMB based on the central bank’s listed exchange rate price on the day of the transaction.
- (3)
- Moderate variable: Industrial policy (IP): reference to Chen, D.H., et al. [55]; Song, L.Y and Wang, X.B [50]; Yu, M.G., et al. [58], we select industries and companies, which form the Outline of the Tenth Five-Year Plan for National Economic and Social Development of the People's Republic of China, and the Outline of the Eleventh Five-Year Plan for the National Economic and Social Development of the People's Republic of China, which published on the official website of the National People's Congress, which are inspired by industrial policies. When the vocabulary such as “encourage”, “support”, “key development”, or “developing vigorously” is mentioned in the document, it is considered that the industry is encouraged. The value is 1, and the others are 0. Such as, we assume that a company’s industry Category is “Manufacture of Electrical Machinery and Equipment”. Firstly, we select keywords from the Outline of the Tenth Five-Year Plan for National Economic and Social Development of the People’s Republic of China, such as “encourage”, “support”, “key development”, or “developing vigorously” is mentioned in the document. When the keyword mentions that support for the development of “Manufacture of Electrical Machinery and Equipment”, a companies’ value is 1; if not mentioned, the value for A is 0; secondly, the Outline of the Tenth Five-Year Plan for National Economic and Social Development of the People’s Republic of China covers the time range from 2001 to 2006, and the Outline of the Eleventh Five-Year Plan for the People’s Republic of China on National Economic and Social Development covers the time range from 2007 to 2011. The intellectual property protection (IPP) data comes from the index of marketization levels of various regions in China compiled by Fan, G., et al. [75]. State-owned equity (SOE): Based on the nature of the listed company’s property rights and the status of the actual controller declared in the CSMAR database, this article judges whether it is regulated by the State-owned Assets Management Committee, the Ministry of Finance, the Local Finance Department, the Finance Bureau, etc., and determines the ownership nature of the listed company.
- (4)
- Control variable: References to Song, L.Y and Wang, X.B [50]; Li, W.J and Li, Y.T [54]; Li, W.J and Zheng, M.N [57]; Yu, M.G., et al. [58]. The control variables are regional per capita GDP growth rate (gdpr); firm age (age), expressed as the difference between the deadline for the study and the establishment date of the company (in which the establishment of the company is less than one year, calculated in one year); firm scale (scale), expressed in terms of the natural logarithm of the total number of employees; asset-liability ratio (lev); and sales profit rate (profit), expressed as a ratio of operating profit to operating income; corporate cash flow (cf), using monetary cash and total assets. The ratio of the ratio is expressed; per capita GDP data comes from the “China Statistical Yearbook”; other financial data comes from the CSMAR database.
3.3. Model
Since the dependent variables are all count variables (the total number of patent applications and invention patent applications). Therefore, we consider the use of Poisson regression firstly, but Poisson regression needs to meet the expectation and variance equal. If the variance of the independent variable is significantly greater than expected, there is an over-dispersion, and negative binomial regression is suitable. At the same time, considering that there are many zero values in the independent variables, we also need to determine whether zero-inflated and negative binomial regression is more appropriate. In the step, we find that the difference between the expectation and the variance of the explanatory variable is relatively large, and it is more appropriate to judge the use of negative binomial regression. To ensure robustness, the results of the standard negative binomial regression and zero-inflated negative binomial regression are compared: the 95% confidence interval of 1alpha is (4.68, 9.08) and therefore rejects “alpha = 0” at the 5% level of significance. The original assumptions (corresponding to zero-inflated and negative binomial regression) suggest that “standard negative binomial regression” should be adopted. The 2Vuong statistic is −0.32, which is much bigger than −1.96. It is considered that the “standard negative binomial regression” should be adopted. Finally, because the dependent variable is the technology innovation performance and the independent variable is the scale of cross-border mergers and acquisitions, there may be a two-way causal relationship between cross-border mergers and acquisitions and technology innovation performance. To reduce endogeneity, all independent variables are lagging by one period. Therefore, the model is set to
In the formula, the subscripts i, t represent different companies and time; patents represent the total number of patent applications; lnma_scale represents the natural logarithm of cross-border mergers and acquisitions; IP represents industrial policy; IPP represents intellectual property protection; SOE represents state-owned equity; CONTOR indicates all the control variables, including regional per capita GDP growth rate (gdpr), firm age (age), firm scale (scale), sales profit margin (profit), asset-liability ratio (lev), and corporate cash Traffic (cf). β is a parameter to be estimated, and represents a random error term.
4. Results and Analysis
4.1. Descriptive Statistics
Table 2 shows the mean, standard deviation, and correlation coefficient for each variable. As can be seen from Table 2, the average number of patent applications filed by the company is 24.75, and the standard deviation is 80.03; the average number of invention patent applications is 13.85, and the standard deviation is 62.04. The maximum correlation coefficient between all variables is 0.576. Table 3 shows the variance inflation factor (VIF), and the maximum value of the variance inflation coefficient of all variables is 1.66. Therefore, there is no multicollinearity problem among the variables.
Table 2.
Descriptive statistics and correlation coefficients of variables.
Table 3.
The variance inflation factor of all variables.
4.2. Endogenous Analysis
We use two methods to deal with endogenous problems. First, we lag all independent variables by one period. Secondly, the instrumental variable method is used to eliminate the endogenous problems. First of all, we lag two periods and three periods of cross-border mergers and acquisitions as a tool variable. Second, we use the 2SLS method to test the effectiveness of instrumental variables, that is, whether it satisfies the null hypothesis that “all instrumental variables are exogenous.” The over-identification test showed p = 0.4539, accepting the null hypothesis that “all instrumental variables are exogenous.” Finally, the Hausman test was performed. The test results showed that Prob > chi2 = 0.5282, accepting the original hypothesis that all independent variables are exogenous, that is, there is no endogenous variable. However, the Hausmann test may fail in the presence of heteroskedasticity. Therefore, a robust DWH test with heteroskedasticity was also performed. The test result showed that p = 0.2329 and the cross-border merger acquisition scale as an exogenous variable.
4.3. Results
In Table 4, Model 1 verifies whether cross-border mergers and acquisitions have significant effects on the acquirers’ innovation performance (patents). Model 2 verifies whether the industrial policy has a direct impact on the acquirers’ innovation performance. Model 3 verifies whether the industrial policy has a moderate effect on the relationship between cross-border mergers and acquisitions and the acquirers’ innovation performance. Model 4 verifies whether the intellectual property protection has a direct impact on the acquirers’ innovation performance. Model 5 verifies whether there is a regulatory effect of intellectual property protection on the relationship between cross-border mergers and acquisitions and the acquirers’ innovation performance. Model 6, on the one hand, verifies the regulatory effect of state-owned equity on cross-border mergers and acquisitions and the acquirers’ innovation performance; on the other hand, it verifies whether state-owned enterprises can more easily use the favorable aspects of industrial policies for technological innovation. Model 7, verifies that state-owned enterprises are more vulnerable to the adverse aspects of the intellectual property protection. Since the interaction term of the independent variable and the manipulated variable is calculated by the product of the two, we centralize the variables in the interaction term to control the multicollinearity problem.
Table 4.
Test results.
As can be seen from Table 4, cross-border mergers and acquisitions in Model 1 have a significant positive effect on the acquirers’ innovation performance (β = 0.115, p < 0.01). Hypothesis 1 is verified. This shows that cross-border mergers and acquisitions by Chinese companies have significantly improved the acquirers’ innovation performance. In Model 2, cross-border mergers and acquisitions have a significant positive effect on the innovation performance (β = 0.110, p < 0.05), but the direct impact of industrial policies on the acquirers’ innovation performance is not significant. Model 3, cross-border mergers and acquisitions have a significant positive effect on the acquirers’ innovation performance (β = 0.114, p < 0.01). At the same time, industrial policies have a significant negative regulatory effect on the relationship between cross-border M&A and the acquirers’ innovation performance (β = −0.197, p < 0.05). Hypothesis 2b is verified (Hypothesis 2a is not verified). This shows that the industrial policy has a more pronounced inhibitory effect on the relationship between cross-border M&A and the acquirers’ innovation performance. In Model 4, cross-border M&A has a significant positive effect on the acquirers’ innovation performance (β = 0.131, p < 0.01). At the same time, IPP has a significant direct effect on the acquirers’ innovation performance (β = 0.122, p < 0.1). Model 5, cross-border mergers and acquisitions have a significant positive effect on the acquirers’ innovation performance (β = 0.141, p < 0.01), but the effect of IPP on the relationship between cross-border M&A and the acquirers’ innovation performance is not significant (β = −0.0124, p > 0.10). Hypothesis 3a and 3b have not been verified. This shows that although intellectual property protection has a positive direct impact on the acquirers’ innovation performance, it does not have a significant regulatory effect on the relationship between cross-border M&A firms and the acquirers’ innovation performance. The explanation is that companies engaged in cross-border M&A activities mostly have technology seeking motives, and their technological innovation mainly relies on the introduction and absorption process. The acquirers’ technology innovation generally has the feature of “imitation-type”. Although the strengthening of the intellectual property protection is conducive to independent innovation of latecomers, the improvement of intellectual property protection in cross-border mergers and acquisitions has not yet produced a significant regulatory effect on the acquirers’ innovation performance. In Model 6, cross-border mergers and acquisitions have a significant positive effect on the acquirers’ innovation performance (β = 0.129, p < 0.01). State-owned equity has no significant direct impact on the acquirers’ innovation performance. This shows that the cross-border mergers and acquisitions of state-owned enterprises have not directly improved the acquirers’ innovation performance. Model 7, state-owned equity has a significant negative regulatory effect on the relationship between cross-border mergers and acquisitions and the acquirers’ innovation performance (β = −0.153, p < 0.1). In Model 8, the third-order interaction of state-owned equity on industrial policy, cross-border mergers and acquisitions, and the acquirers’ innovation performance was not significant (β = 0.202, p > 0.1), indicating that state-owned enterprises’ cross-border mergers and acquisitions have not received the results as previously envisioned. Therefore, Hypothesis 4a has not been verified. In Model 9, the third-order interaction of state-owned equity on intellectual property protection, cross-border mergers and acquisitions and the acquirers’ innovation performance has a significant negative relationship (β = −0.0462, p < 0.1). This shows that state-owned enterprises are more affected by the same structure of their home countries and are more vulnerable to the adverse aspects of the home country’s intellectual property protection. Therefore, Hypothesis 4b has been verified. We graphically depict the regulatory effects of industrial policy and state-owned equity, as shown in Figure 4, Figure 5 and Figure 6.
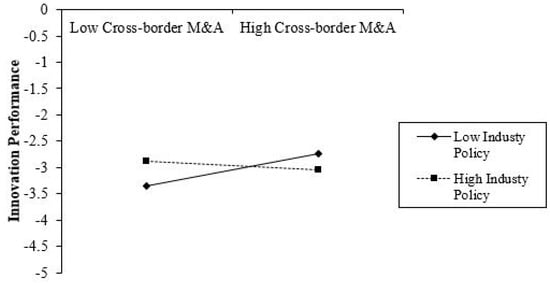
Figure 4.
The second-order interaction effect of industrial policy.
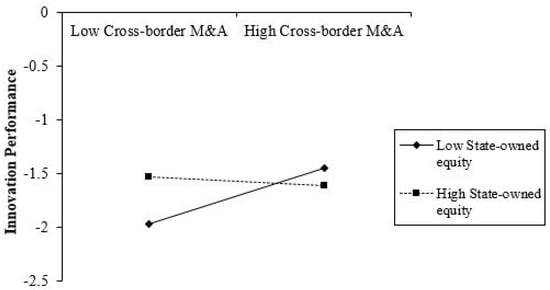
Figure 5.
Second-order interaction effects of state-owned equity.
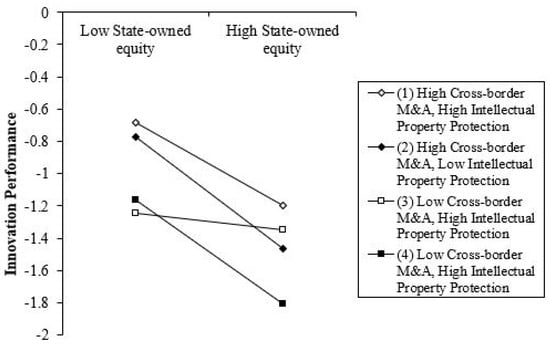
Figure 6.
Third-order interaction effects of state-owned equity.
4.4. Robustness Test
There are several methods for verifying the robustness of the results. Commonly used are transformation key variables, transformation regression models, robust standard error regression, and so on. In this paper, the robustness of the results is verified by the use of robust standard error regression and transformed dependent variables. This article draws lessons from studies of Li, M and Yu, T.J; Yuan, J.G [3,26] and adopts the amount of invention patent applications as a substitute for the total number of patent applications of enterprises as a dependent variable. Table 5 shows that cross-border mergers and acquisitions have a significant positive effect on the acquirers’ innovation performance (β = 0.150, p < 0.05); Hypothesis 1 passes the robustness test. Industrial policy has a significant negative regulatory effect on the relationship between cross-border M&A and the acquirers’ innovation performance (β = −0.193, p < 0.1); Hypothesis 2b passes the robustness test. Intellectual property protection still has a significant direct impact on the acquirers’ innovation performance. However, in terms of moderate effects, the regression results of invention patent applications show that intellectual property protection has a significant negative regulatory effect on the relationship between cross-border M&A and the acquirers’ innovation performance. This shows that the Hypothesis 3b regression results are not stable, but it is assumed that Hypotheses 2a and 3a have still not received empirical support. State-owned equity has a significant negative regulatory effect on the relationship between cross-border M&A and the acquirers’ innovation performance (β = −0.431, p < 0.01), and the third-order interaction of state-owned equity on industrial policy, cross-border M&A, and the acquirers’ innovation performance is negative. However, the results are still insignificant (β = −0.0701, p > 0.1). Therefore, the special relationship between state-owned enterprises and the government has not helped them to make more effective use of the favorable aspects of industrial policies for technological innovation. Hypothesis 4a has not yet been verified. At the same time, the third-order interaction between state-owned equity and intellectual property protection, cross-border mergers and acquisitions, and the acquirers’ innovation performance was significantly negative (β = −0.179, p < 0.01), indicating that state-owned enterprises are more susceptible to pressure from the home country institution. Therefore, it is more vulnerable than the private enterprises to the constraints of the intellectual property protection. Hypothesis 4b passed the robustness test.
Table 5.
Robustness test.
5. Conclusions
Do the booming of Chinese cross-border mergers and acquisitions enhance corporate innovation performance? What kind of moderate effect does the domestic institutional environment have on this process? This article selects 191 Cross-border M&A events of China’s listed companies from 2001 to 2011 and conducts empirical tests on these issues. First, we validate the relationship between cross-border M&A and the acquirers’ innovation performance, and the existence of knowledge logic. At the same time, we analyze the regulating effects of industrial policy and intellectual property protection on the relationship between cross-border M&A and the acquirers' innovation performance. Finally, we have verified that the differences between the state-owned and the private acquirers’ innovation performance which were affected by the industrial policy and intellectual property protection. We found that, First, cross-border acquisitions by Chinese companies have significantly improved the acquirers’ innovation performance. Second, industrial policy has a negative impact on the relationship between cross-border M&A and the acquirers’ innovation performance. That is, when cross-border M&A positively affect the acquirers’ innovation performance, and industrial policies weaken the impact of cross-border M&A on the acquirers’ innovation performance. Third, the role of intellectual property protection in regulating the relationship between cross-border M&A and the acquirers’ innovation performance is not stable. The effect of intellectual property protection on the relationship between cross-border acquisitions and patent applications is not significant, but it negatively affects the relationship between cross-border mergers and acquisitions and the amount of invention patent applications. Fourth, the third-order interaction of state-owned equity on intellectual property protection, cross-border mergers and acquisitions and the acquirers’ innovation performance, shows that state-owned enterprises are more vulnerable to the adverse aspects of the intellectual property protection, and in turn generate negative regulation of the acquirers’ innovation performance.
Based on the above findings, we get the following implications: First, cross-border mergers and acquisitions by Chinese companies are conducive to improving the acquirers’ innovation performance. Cross-border mergers and acquisitions bring valuable, scarce, non-replicable, and irreplaceable knowledge resources. The complementarity of M&A parties’ knowledge resources promotes the acquirers’ innovation performance. Therefore, while this research contributes new knowledge to the existing cross-border mergers and acquisitions and the acquirers’ innovation performance, it also provides new evidence for latecomers to use Cross-border M&A leverage to achieve technological catch-up. Second, industrial policy has a significant negative moderate effect on the relationship between Cross-border M&A and the acquirers’ innovation performance. This shows that macro-level industrial policies do not always have positive effects on micro-enterprises. While promoting industrial development, industrial policies have also brought about certain negative effects. For example, excessive industrial policy incentives, excessive government preferences for certain industries such as finance, taxation, and loan interest rates will lead to an increase in government “rent-seeking” behavior. This not only increases the transaction costs of enterprises, but also leads companies to use strategic innovations. Cheat on government subsidies. In addition, excessive industrial policy will also lead to overcapacity in some industries, leading to bankruptcies. Third, the impact of intellectual property protection on the relationship between cross-border M&A and the acquirers’ innovation performance is not stable. This shows that the view that strengthening intellectual property protection supported by most documents in emerging markets can promote the innovation performance is not absolutely correct. First of all, most emerging market companies are latecomers and do not have the ownership advantages of companies in developed countries. Therefore, the ownership advantages in international business theory do not directly guide the latecomers’ international business strategies. On the contrary, the achievement of technology catch-up by latecomers still depends on the process of “introduction-digestion-absorption-secondary innovation”. At this stage, the technological innovation of latecomers is still dominated by “imitation-type”. Blindly strengthening intellectual property protection will, on the contrary, curb technological innovation in emerging market. Fourth, the special relationship between state-owned enterprises and the government makes them more vulnerable to institutional pressures, and is therefore more vulnerable to the adverse aspects of the intellectual property protection, which in turn impedes the realization of the acquirers’ innovation performance.
6. Contribution and Direction
The theoretical contributions of this research mainly include three aspects: First, there is still no consensus on whether cross-border M&A of emerging market companies can enhance the acquirers’ innovation performance. This article verifies that Chinese cross-border M&A are conducive to improving the acquirers’ innovation performance. Second, regarding the validity of industrial policies, there is a fierce dispute regarding the theory. This article regards it as an important dimension of the domestic institutional environment and verifies the negative moderate effect of industrial policies on the relationship between cross-border M&A and the acquirers’ innovation performance. Third, given that China’s state-owned enterprises have a high proportion in cross-border M&A, this paper verifies the negative moderating effect of state-owned equity on the relationship between cross-border M&A and the acquirers’ innovation performance. At the same time, it verifies the third-order negative interaction between state-owned equity and intellectual property protection on cross-border M&A and the acquirers’ innovation performance. This study also has important practical significance: First, cross-border mergers and acquisitions is an important means with which to enhance the ability of latecomers to innovate. China has now become a global manufacturing powerhouse, but its weak ability to innovate has made China’s manufacturing industry weak. To this end, to achieve the strategic goal of “Made in China 2025”, Chinese companies must find effective ways to break through innovation capabilities. The key to promoting the innovation capability is to promote Chinese enterprises to take the initiative from the “going out” to the final “go up”, making Chinese enterprises occupy an advantageous position in the global value chain. In order to achieve the above objectives, cross-border mergers and acquisitions should be taken as a strategic measure with which to enhance the Chinese enterprises’ technological innovation capability. Cross-border mergers and acquisitions are an effective means with which to acquire strategic resources at this stage. They should be placed in an important position in the development of China’s manufacturing industry, and efforts should be made to advance and achieve results. Second, we should pay attention to the adverse effects of industrial policies in home-country institutional environment on the relationship between cross-border M&A and the acquirers’ innovation performance. Obtaining the technological resources of developed countries through cross-border mergers and acquisitions is very difficult, but the biggest challenge lies in how to achieve secondary innovation through the knowledge integration in the later stages of mergers and acquisitions. This is the key to achieving technology catch-up. Among them, the home country institutional environment has a great influence on this. Policy makers should rationally look at the effectiveness of industrial policies. They must not only see their good side, but also have a clearer understanding of their unfavorable side. Third, emerging market countries should pay attention to the dual impact of the intellectual property protection. For late-stage companies in emerging markets, policy makers should pay attention to the dual impact of the intellectual property protection in emerging markets, because they do not have the ownership advantages of the developed market leaders. Fourth, policy makers should take a rational look at the dual nature of state-owned equity. We must not only look at its favorable side, but also pay attention to its harmful side.
Of course, there are some limitations in this study, which reveal the direction for future research. First: Is there an intermediary variable between cross-border M&A and the acquirers’ innovation performance? What is the connection mechanism? These important questions have not been studied in this paper. Future research can further explore the mediating effects between cross-border M&A and the acquirers’ innovation performance. Second, due to the limited availability of data, the data of this paper as of 2011, resulting in this article, did not include the latest information. Future research should adopt, as much as possible, a wide range of data collection methods to obtain the latest information in order to fully and accurately reveal the relationship between Chinese companies’ cross-border acquisitions and the acquirers’ innovation performance. Third, since the time range for the sample selection in this paper is 2001–2011, subject to the availability of data, this may lead to Hypotheses 3a and 3b being inconsistent or inconspicuous. Therefore, future research can be further verified by expanding the time range of sample selection. Fourth, because the research in this paper only includes the data of listed companies in the mainland of China, in fact, in addition to listed companies, there are still many non-listed companies that have conducted cross-border M&A activities. The absence of this part of the data is likely to lead to the insignificance of Hypothesis 4a, so future research can be further verified by increasing the types of samples.
Author Contributions
Y.Z. and X.W. conceived and designed the experiments; Y.Z. performed the experiments; Y.Z. and H.Z. analyzed the data; C.L. contributed reagents/materials/analysis tools; Y.Z. wrote the paper.
Acknowledgments
We would like to thank the National Social Science Fund Project of China (Grant Number: 12AZD034) and acknowledge the editors and reviewers for their language assistance and valuable comments.
Conflicts of Interest
The authors declare no conflict of interest.
References
- Zhang, J.H.; Zhou, C.H. A Study on institutional barriers of Chinese companies going global. Econ. Res. J. 2010, 6, 80–91. [Google Scholar]
- Tian, H.F.; Huang, W.; Sun, G.S. An analysis on institutional factors influencing cross-border M&A performance: Based on the data of Chinese Listed Companies from 2000 to 2012. World Econ. Stud. 2015, 6, 111–118. [Google Scholar]
- Li, M.; Yu, T.J. Whether R&D internationalization has promoted the innovation of enterprises—Based on the empirical research of Chinese information technology companies. Manag. World 2016, 11, 125–140. [Google Scholar]
- Desyllas, P.; Hughes, A. Do high technology acquirers become more innovative? Res. Policy 2010, 39, 1105–1121. [Google Scholar] [CrossRef]
- Cassiman, B.; Colombo, M.G.; Garrone, P.; Veugelers, R. The impact of M&A on the R&D process: An empirical analysis of the role of technological and market-relatedness. Res. Policy 2003, 34, 195–220. [Google Scholar]
- Vermeulen, F.; Barkema, H. Learning through Acquisitions. Acad. Manag. J. 2001, 44, 457–476. [Google Scholar]
- Seru, A. Firm boundaries matter: Evidence from conglomerates and R&D activity. J. Financ. Econ. 2014, 111, 381–405. [Google Scholar]
- North, D.C. Institutions, Institutional Change, and Economic Performance; Cambridge University Press: Cambridge, MA, USA, 1990. [Google Scholar]
- North, D.C. Understanding the Process of Economic Change; Princeton University Press: Princeton, NJ, USA, 2005. [Google Scholar]
- Williamson, O.E. Markets and Hierarchies: Analysis and Antitrust Implications; Free Press: New York, NY, USA, 1975. [Google Scholar]
- Williamson, O.E. The Economic Institutions of Capitalism; Free Press: New York, NY, USA, 1985. [Google Scholar]
- DiMaggio, P.J.; Powell, W.W. The iron cage revisited: Institutional isomorphism and collective rationality in organizational fields. Am. Sociol. Rev. 1983, 48, 147–160. [Google Scholar] [CrossRef]
- Scott, W.R. The adolescence of institutional theory. Adm. Sci. Q. 1987, 32, 493–511. [Google Scholar] [CrossRef]
- Scott, W.R. Institutions and Organizations; Sage: Thousand Oaks, CA, USA, 1995. [Google Scholar]
- Meyer, J.W.; Rowan, B. Institutionalized organizations: Formal structure as myth and ceremony. Am. J. Sociol. 1977, 83, 340–363. [Google Scholar] [CrossRef]
- Porter, M.E. Competitive Strategy; Free Press: New York, NY, USA, 1980. [Google Scholar]
- Barney, J.B. Firm resources and sustainable competitive advantage. J. Manag. 1991, 17, 99–120. [Google Scholar]
- Peng, M.W. Towards an institution-based view of business strategy. Asia Pac. J. Manag. 2002, 19, 251–267. [Google Scholar] [CrossRef]
- Peng, M.W. Institutional transitions and strategic choices. Acad. Manag. Rev. 2003, 28, 275–296. [Google Scholar] [CrossRef]
- Peng, M.W.; Wang, D.; Jiang, Y. An institution-based view of international business strategy: A focus on emerging economies. J. Int. Bus. Stud. 2008, 39, 920–936. [Google Scholar] [CrossRef]
- Hitt, M.A.; Ahlstrom, D.; Dacin, M.T.; Levitas, E.; Svobodina, L. The institutional effects on strategic alliance partner selection in transition economies: China vs. Russia. Organ. Sci. 2004, 15, 173–185. [Google Scholar] [CrossRef]
- Tong, T.; Reuer, J.; Peng, M.W. International joint ventures and the value of growth options. Acad. Manag. J. 2008, 51, 1014–1029. [Google Scholar] [CrossRef]
- Meyer, K.E.; Estrin, S.; Bhaumik, S.; Peng, M.W. Institutions, resources, and entry strategies in emerging economies. Strateg. Manag. J. 2009, 30, 61–80. [Google Scholar] [CrossRef]
- Schumpeter, J. Invention and Economic Growth; Harvard University Press: Cambridge, MA, USA, 1966. [Google Scholar]
- Crossan, M.M.; Apaydin, M. A multi-dimensional framework of organizational innovation: A systematic review of the literature. J. Manag. Stud. 2010, 47, 1154–1191. [Google Scholar] [CrossRef]
- Yuan, J.G.; Hou, Q.S.; Cheng, C. The curse effect of corporate political resources: A survey based on political relevance and corporate technology innovation. Manag. World 2015, 1, 139–155. [Google Scholar]
- Grant, R.M. Prospering in dynamically-competitive environments: Organizational capability as knowledge integration. Organ. Sci. 1996, 7, 375–387. [Google Scholar] [CrossRef]
- Kogut, B.; Zander, U. Knowledge of the firm, combinative capabilities and the replication of technology. Organ. Sci. 1992, 3, 383–397. [Google Scholar] [CrossRef]
- Ranft, A.L.; Lord, M.D. Acquiring new knowledge: The role of retaining human capital in acquisitions of high-tech firms. J. High Technol. Manag. Res. 2000, 11, 295–319. [Google Scholar] [CrossRef]
- Ranft, A.L.; Lord, M.D. Acquiring new technologies and capabilities: A grounded model of acquisition implementation. Organ. Sci. 2002, 13, 420–441. [Google Scholar] [CrossRef]
- Kogut, B.; Zander, U. What firms do? Coordination, identity, and learning. Organ. Sci. 1996, 7, 502–518. [Google Scholar] [CrossRef]
- Graebner, M.E. Momentum and serendipity: How acquired leaders create value in the integration of technology firms. Strateg. Manag. J. 2004, 25, 751–777. [Google Scholar] [CrossRef]
- Szulanski, G. Exploring internal stickiness: Impediments to the transfer of best practice within the firm. Strateg. Manag. J. 1996, 17, 27–43. [Google Scholar] [CrossRef]
- Guerzoni, M.; Aldridge, T.T.; Audretsch, D.B.; Desai, S. A new industry creation and originality: Insight from the funding sources of university patents. Res. Policy 2014, 43, 1697–1706. [Google Scholar] [CrossRef]
- Arrow, K.J. Information and economic behavior. In Collected Papers of Kenneth J. Arrow; Belknap Press: Cambridge, MA, USA, 1984; Volume 4. [Google Scholar]
- Arrow, K. Essays in the Theory of Risk Bearing; Markham: Chicago, IL, USA, 1971. [Google Scholar]
- Ernst, H.; Vitt, J. The influence of corporate acquisitions on the behavior of key inventors. R&D Manag. 2000, 30, 105–119. [Google Scholar]
- Bierly, P.E.I.; Chakrabarti, A.K. Technological learning, strategic flexibility, and new product development in the pharmaceutical industry. IEEE Trans. Eng. Manag. 1996, 43, 368–380. [Google Scholar] [CrossRef]
- Ahuja, G.; Katila, R. Technological acquisitions and the innovation performance of acquiring firms: A longitudinal study. Strateg. Manag. J. 2001, 22, 197–220. [Google Scholar] [CrossRef]
- Puranam, P.; Singh, H.; Zollo, M. Organizing for innovation: Managing the coordination-autonomy dilemma in technology acquisitions. Acad. Manag. J. 2006, 49, 263–280. [Google Scholar] [CrossRef]
- Karim, S.; Mitchell, W. Path-dependent and path-breaking change: Reconfiguring business resources following acquisitions in the US medical sector, 1978–1995. Strateg. Manag. J. 2000, 21, 1061–1081. [Google Scholar] [CrossRef]
- Hill, C.W.; Rothaermel, F.T. The performance of incumbent firms in the face of radical technological innovation. Acad. Manag. Rev. 2003, 28, 257–274. [Google Scholar] [CrossRef]
- Bierly, P.; Chakrabarti, A. Determinants of technology cycle time in the U.S. pharmaceutical industry. R&D Manag. 1996, 26, 115–126. [Google Scholar]
- Prabhu, J.C.; Chandy, R.K.; Ellis, M.E. The impact of acquisitions on innovation: Poison pill, placebo, or tonic? J. Mark. 2005, 69, 114–130. [Google Scholar] [CrossRef]
- Laursen, K.; Salter, A. Open for Innovation: The Role of Openness in Explaining Innovation Performance among U.K. Manufacturing Firms. Strateg. Manag. J. 2006, 27, 131–150. [Google Scholar] [CrossRef]
- Kanter, R.M. When a thousand flowers bloom: Structural, collective and social conditions for innovation in organizations. In Research in Organizational Behavior; Staw, B.M., Cummings, L.L., Eds.; JAI Press: Greenwich, CT, USA, 1988; Volume 10, pp. 162–211. [Google Scholar]
- Zahra, S.; George, G. Absorptive capacity: A review, reconceptualization, and extension. Acad. Manag. Rev. 2002, 27, 185–203. [Google Scholar] [CrossRef]
- Verona, G. A Resource-Based View of Product Development. Acad. Manag. Rev. 1999, 24, 132–142. [Google Scholar] [CrossRef]
- Schulz, M. The uncertain relevance of newness: Organizational learning and knowledge flows. Acad. Manag. J. 2001, 44, 661–681. [Google Scholar]
- Song, L.Y.; Wang, X.B. Key industrial policies, resource replacement and industrial productivity. Manag. World 2013, 12, 63–77. [Google Scholar]
- Zhou, Z.H. The basic framework of industrial policy analysis. Modern Econ. Sci. 1990, 6, 26–32. [Google Scholar]
- Criscuolo, C.; Martin, R.H.G.; Overman, J.; Van, R. The Causal Effect of an Industrial Policy; Social Science Electronic Publishing: Rochester, NY, USA, 2012. [Google Scholar]
- Zhang, W.Y. Why is industry policy doomed to fail? China Chain Store 2016, 11, 84–86. [Google Scholar]
- Li, W.J.; Li, Y.T. Does industrial policy promote corporate investment? China Ind. Econ. 2014, 5, 122–134. [Google Scholar]
- Chen, D.H.; Li, Z.; Xin, F. Industrial policy and corporate finance: Empirical evidence from China. In Proceedings of the China Accounting and Finance Research Symposium, Shanghai, China, 4–5 December 2010. [Google Scholar]
- Li, Q. Industrial policy, Technological innovation and Firm’s export performances: Based on analysis of the degree of industrial agglomeration. World Econ. Stud. 2016, 5, 77–86. [Google Scholar]
- Li, W.J.; Zheng, M.N. Is it substantive innovation or strategic innovation?—Impact of macroeconomic policies on micro-enterprises’ innovation. Econ. Res. J. 2016, 4, 60–73. [Google Scholar]
- Yu, M.G.; Fan, R.; Zhong, H.J. Chinese industrial policy and corporate technological innovation. China Ind. Econ. 2016, 12, 5–22. [Google Scholar]
- Aghion, P.; Dewatripont, M.; Du, L.S.; Harrison, A.; Legros, P. Industrial Policy and Competition; NBER Working Paper No. 18048; NBER: Cambridge, MA, USA, 2012. [Google Scholar]
- Chen, C.J.; Li, Z.; Su, X.; Sun, Z. Rent-seeking incentives, corporate political connections and the control structure of private firms: Chinese evidence. J. Corp. Financ. 2011, 17, 229–243. [Google Scholar] [CrossRef]
- Wang, W.B.; Ming, J.; Yue, C.Y. Corporate size, local government intervention and overcapacity. Manag. World 2014, 10, 17–36. [Google Scholar]
- Chen, Y.; Puttitanun, T. Intellectual property rights and innovation in developing countries. J. Dev. Econ. 2005, 78, 474–493. [Google Scholar] [CrossRef]
- Kanwar, S.; Evenson, R. Does intellectual property protection spur technological change? Oxf. Econ. Pap. 2003, 55, 235–264. [Google Scholar] [CrossRef]
- Hall, B.H. Exploring the patent explosion. J. Technol. Transf. 2004, 30, 35–48. [Google Scholar] [CrossRef]
- Haeussler, C.; Harhoff, D.; Mueller, E. To Be Financed or not-the Role of Patents for Venture Capital Financing; ZEW Discussion Paper No.09-003; SSRN: Rochester, NY, USA, 2009. [Google Scholar]
- Ye, J.G.; Li, C.H.; Lei, Z.; Cao, H.P. Patent application advance disclosure institution, patent quality and technical knowledge dissemination. J. World Econ. 2012, 8, 115–133. [Google Scholar]
- Kelemperer, P. How broad should the scope of patent protection be. RAND J. Econ. 1990, 21, 113–130. [Google Scholar] [CrossRef]
- Kim, Y.K.; Lee, K.; Park, W.G.; Choo, K. Appropriate intellectual property protection and economic growth in countries at different levels of development. Res. Policy 2012, 41, 358–375. [Google Scholar] [CrossRef]
- Brüggemann, J.; Crosetto, P.; Meub, L.; Bizer, K. Intellectual property rights hinder sequential innovation. experimental evidence. Res. Policy 2016, 45, 2054–2068. [Google Scholar] [CrossRef]
- Boldrin, M.; Levine, D.K. The case against patents. J. Econ. Perspect. 2013, 27, 3–22. [Google Scholar] [CrossRef]
- Williams, H.L. Intellectual property rights and innovation: Evidence from the human genome. J. Political Econ. 2013, 121, 1–27. [Google Scholar] [CrossRef]
- Wang, E.C. Determinants of R&D investment: The extreme-bounds-analysis approach applied to 26 OECD countries. Res. Policy 2010, 39, 103–116. [Google Scholar]
- Fang, J.X. Government intervention, nature of ownership and corporate mergers and acquisitions. Manag. World 2008, 9, 118–123. [Google Scholar]
- Luo, Y.; Tung, R.L. International expansion of emerging market enterprises: A springboard perspective. J. Int. Bus. Stud. 2007, 38, 481–498. [Google Scholar] [CrossRef]
- Fan, G.; Wang, X.L.; Zhu, H.P. China’s Marketization Index—A Comparative Report on the Process of Marketization in Various Regions in 2011; Economic Science Press: Beijing, China, 2011. [Google Scholar]


© 2018 by the authors. Licensee MDPI, Basel, Switzerland. This article is an open access article distributed under the terms and conditions of the Creative Commons Attribution (CC BY) license (http://creativecommons.org/licenses/by/4.0/).