Article

Ship Acquisition of Shipping Companies by Sale & Purchase Activities for Sustainable Growth: Exploratory Fuzzy-AHP Application

1
Department of International Logistics, Chung-Ang University, 84 Heukseok-ro, Dongjak-gu, Seoul 06974, Korea
2
School of Economics & Trade, Kyungpook National University, 80 Daehakro, Bukgu, Daegu 41566, Korea
3
Institute of Economics & Business Administration, Kyungpook National University, 80 Daehakro, Bukgu, Daegu 41566, Korea
4
Graduate School of Logistics, Incheon National University, 119 Academy-ro, Yeonsu-gu, Incheon 22012, Korea
*
Author to whom correspondence should be addressed.
Sustainability 2018, 10(6), 1763; https://doi.org/10.3390/su10061763
Submission received: 21 March 2018 / Revised: 11 May 2018 / Accepted: 24 May 2018 / Published: 28 May 2018
(This article belongs to the Section Economic and Business Aspects of Sustainability)

Abstract

:
Strengthening sale and purchase (S&P) capacity has become a fundamental requirement for sustainable growth and corporate competitiveness in the modern shipping market. However, there is a lack of research related to S&P and its priority when shipping companies attempt to implement ship acquisition through S&P activities. To fill this gap, this paper conducts an empirical analysis to analyze priority factors during the acquisition of second-hand ships from the perspective of shipping companies. Business criteria are considered to be the most important factors in the analysis of the priority of ship acquisition and investment in shipping companies. To the best of our knowledge, this research is the first exploration covering Korean shipping companies’ ship acquisition through S&P activities. This study is expected to contribute to the better understanding of the role of S&P in ensuring the sustainability of shipping companies and to provide stakeholders with valuable insights.

1. Introduction

In the 2000s, mid-sized shipping companies operated tramp during the super cycle and large shipping companies invested indiscriminately in shipping assets. Before the Global Financial Crisis of 2008, the shipping cycle was booming. At that time, most shipping companies lacked foresight and secured bigger fleets, rather than preparing for the recession. As a result, many shipping companies faced bankruptcy and court receivership during the maritime slump after 2008. Thus, large companies are not free from investment mistakes [1,2].
For some ship owners, sale and purchase (S&P) of ships is a more important source of revenue than shipping operations. Notably, Stopford [3] pointed out that “Shipowners have two jobs. One is to operate ships, a worthy task but not one that brings riches. The other is to be in the right place at the right time, to rake in the money at the peak of a cycle.” Nevertheless, most shipping companies are concentrating on profit growth through cargo transportation contracts and their sustainable growth plans have met limited success. As shipbuilding takes time, the order to delivery cycle can be long. Second-hand ships can be picked up directly from the second-hand ship market. Using S&P, shipowners attempt to make more money. Therefore, it is worthwhile to achieve sustainable growth in the shipping market, which is marked by high volatility, by participating in high value-added S&P activities. Because S&P of ships is a professional service industry that arranges transactions based on expertise of shipping, shipbuilding, finance, and legal fields, it might be seen as a knowledge industry with value add that can produce advanced information by predicting the entire shipping market based on basic transaction information. Therefore, the potential impact of S&P business development on the shipping industry is significant. S&P business can form a large market by itself and can contribute to the development of ship investment finance, ship management, ship insurance, maritime law, shipping, and shipbuilding [4]. Major shipping companies in Europe and Japan have increased the value add in shipping by not only conducting freight transportation, but also performing maritime knowledge services, such as finance, ship valuation, S&P of ships, chartering, maritime arbitration, insurance, and consulting. In the global shipping industry, the freight transportation market has been growing continuously, but since the 2000s, large-scale capital has been injected into the shipping market, and the second-hand ship market has expanded. Historically, the shipowners and shipping companies in the United Kingdom, Greece, and Japan have been the leading players in the S&P market. Recently, the S&P business, in particular, has emerged as a key source of competitive power in the maritime market, where freight transportation is changing rapidly. Furthermore, it is becoming more difficult to predict the shipping cycle. Therefore, S&P business has also been developed in advanced shipping countries, such as in Greece, the United Kingdom, and Singapore. As a representative example, the Singapore government has been expending much effort on increasing the breadth and depth of other maritime auxiliary services such as value-added services by capitalizing or leveraging its leading status in S&P activities [5]. In Greece, which owns the largest portion of fleets, S&P has been the flagship business of the shipping industry for a long time [6].
As mentioned above, strengthening S&P capacity has become a fundamental requirement for ensuring sustainable growth and corporate competitiveness in the modern shipping market. However, there is lack of research related to S&P and its priority when shipping companies attempt to implement ship acquisition through S&P activities. To fill this gap, this paper aims to examine shipping companies’ priorities when they undertake S&P activities. An empirical analysis is conducted on the priority factors considered during the decision making on acquiring second-hand ships. By doing so, this study seeks to help shipowners by analyzing the factors and its implications that are important for the acquisition of ships and asset investment in the Korean shipping industry. The priority of introducing second-hand ships was analyzed by using the fuzzy analytic hierarchy process (AHP) method after conducting interviews with shipping experts and administering questionnaires to shipping company employees. After the selection of preemptive evaluation factors by asking an expert group to answer a questionnaire, it presents directions for securing second-hand ships by analyzing the importance of, and preference for, the various factors selected. This paper is structured as follows. The next section reviews the relevant studies and the third section explains the methodology. The empirical analysis is shown in the fourth section. Finally, the fifth section provides a discussion of the results and presents the concluding remarks.

2. Literature Review

Various scholars have divided the shipping markets into freight, second-hand ships, newbuilding, and demolition markets [3,7,8,9]. The second-hand ship market is distinct from the newbuilding and the demolition markets as an auxiliary market, in the sense that it does not change the number of vessels or the transport capacity offered by the market [3,10]. Although the second-hand ship market is closely related to the newbuilding market, its features are quite different in terms of the availability of ships from the contract date and the method of transferring a ship’s ownership [3]. The notable characteristics of this market is that ships worth billions of dollars are traded like generic commodities. In this market, both the buyers and sellers are shipowners. Generally, the administrative procedures are analogous to those involved in real property, in the use of a standard contract, such as the Norwegian Sales Form [3]. The value of second-hand ships depends on the freight rates, age, inflation, and expectations. Hence, accurately determining the optimal time for trading can be of critical importance [11].
As mentioned earlier, the second-hand ship market is different from the other markets, which provide flexibility in the expansion or reduction of transport capacity as their main function. The purpose of the second-hand ship market is to effectively reallocate ships among operators. Besides, the second-hand ship market may increase the efficiency of the markets for transport services. Therefore, the second-hand ship market fosters efficient use of capital equipment in the shipping industry and contributes to moderating the transport costs in world trade. According to Strandenes [8], the second-hand ship market facilitates entry into shipping since potential operators may easily be able to buy an existing ship and promptly enter the transport market. On the other hand, shipowners can reallocate their fleet in line with changes in fluctuating demand or have the flexibility to shift to new markets. Further, not only shipowners operate ships, but also speculators who do not have expertise in shipping and who want to participate in S&P for the purpose of asset management, can enter the market. Their activities contribute to the functioning of the second-hand ship market by increasing its liquidity.
The characteristics of the second-hand ship market depend on the types of ships traded [12]. In general, the S&P of bulk carriers, especially dry bulk ships, is the leading activity of this industry. In 2017, a record 93.1 million deadweight tonnage (DWT) was sold on the second-hand ship market. Bulk carriers accounted for 50% of this volume, with strong investor interest, led by Greeks, whilst bulker and values increased [11]. The bulk carrier market varies from the small-sized Handysize and Supramax to the large-sized Capesize. There is a large variety of market participants because there are almost no barriers to entry into the market; thus, it has a wide distribution of small- and large-scale shipowners. There are various known shippers in this market (e.g., Vale, Rio Tinto, and other large-scale mining companies handling iron ore and coal, as well as small- and mid-sized grain handling companies). Market entry and exit is very liberal, and transactions are focused on profit margins. In addition, there are relatively few political risks, compared to those associated with oil tankers [4]. Through these activities in the market, the shipowners seek to construct a rational fleet portfolio in order to appropriately hedge financial and operating risks arising from the ship’s ownership and operations.
The ship acquisitions of shipping companies by S&P activities are connected to the price of the second-hand ship. Therefore, a significant body of literature has explored the determinants of the value of second-hand ships. Most researchers adopt a business perspective focusing on the ship size (e.g., Handysize, Aframax, and Suezmax) or a market environment perspective focused on the change in the number of orders and delivery of ships, fleets, and throughput of major freight categories [13,14]. Merikas et al. [15] introduced the variable of the price ratio of second-hand ship and new shipbuilding as a decision-making tool and main determinant, in accordance with the theory of finance. Amir and Nomikos [16] argued that freight should be recognized as a priority factor because the prices of second-hand ships and newbuilding change according to freight volatility in the shipping industry. In addition, there are studies on the acquisition of ships from various other perspectives [17,18]. Among them, research that provides rational criteria for decision making has been carried out regularly. In addition, it has also examined the effects of the volatility in the shipping industry and the limitations of information power in the decision-making, based on market sentiment. Besides, a considerable body of literature exists in regard to shipping companies’ S&P strategy, such as S&P timing and ship price prediction. Alizadeh and Nomikos [16] established the existence of a long-term cointegrating relationship between ship price and earnings and used this relationship as a barometer of S&P timing decisions in the dry bulk shipping sector. In their results, S&P strategies based on earnings–price ratios were significant, especially in the market for larger ships, due to higher volatility in the second-hand ship market. Tsolakis et al. [13] provided an econometric analysis of second-hand ship prices for reducing the risk of S&P activity. They argued that analysis at a separated level is needed because the factors affecting second-hand ship prices have different impacts on different ship types. Therefore, this paper has analyzed S&P activities of dry bulk ship that lead the second-hand ship market and have been studied through previous research.
However, there is a lack of research that incorporate the various factors to be considered when shipping companies carry out S&P activities for ship acquisition. Some extant studies have explored the second-hand ship markets [14,19,20,21], the economic life cycles of ships [6], the econometric perspective of the shipping market, the demolition market of second-hand ships [7], and the price of second-hand ships [11,18,22]. In the aforementioned studies on the timing and decision of S&P activities [10,23,24,25], the focus is on the three main perspectives—business, market environment, and policy.

3. Methodology

This study is quantitative practical research that was designed and implemented in four steps by using the fuzzy AHP methodology. It was carried out as per the following steps:
  • Structure a problem with a model that shows the problem’s key elements and their relationship by undertaking interviews and a literature review.
  • Select the experts and participants and edit the questionnaire for grammar.
  • Compare elements in pairs by eliciting judgments that reflect knowledge, feelings, or emotions through judgments with meaningful numbers.
  • Determine the relative weights of each criterion and choose S&P factors by using the fuzzy AHP.

3.1. Fuzzy AHP

Decision makers often provide vague answers rather than explicit values. Further, the transformation of qualitative selections to point estimates may not be reasonable [26]. Because the fuzzy AHP approach can take the attitude of decision makers into account, linguistic values, whose fuzzy membership functions are usually characterized by triangular fuzzy numbers, are recommended to assess priority ratings instead of the customary numerical equivalence method [27]. Therefore, when an uncertain pairwise comparison environment exists, fuzzy AHP should be more suitable and adequate than conventional AHP in practice [28].
This research aims to select the factors related to ship acquisition that are considered by shipping companies during S&P activities of second-hand ships by using the integrated AHP techniques in a fuzzy environment. Fuzzy AHP is used to determine the preference weights of evaluation by using triangular fuzzy numbers (TFNs) that are based on the various characteristics of the S&P activities of shipping companies [29,30].
For computing the priorities of elements, a pairwise comparison matrix is constructed, as shown below [31,32].
A ˜ = [ 1 1 / a ˜ 12 a ˜ 1 n 1 / a ˜ 21 1 a ˜ 2 n 1 / a ˜ n 1 1 / a ˜ n 2 1 ] ,
where, a ˜ i j = { 9 ˜ 1 ,   8 ˜ 1 ,   7 ˜ 1 ,   6 ˜ 1 ,   5 ˜ 1 ,   4 ˜ 1 ,   3 ˜ 1 ,   2 ˜ 1 ,   1 ˜ 1 ,   1 ˜ ,   2 ˜ , 3 ˜ ,   4 ˜ , 5 ˜ ,   6 ˜ , 7 ˜ ,   8 ˜ , 9 ˜   1 , i j   1   i = j .
In the fuzzy AHP model, the numbers 1–9 represent TFNs, which are used to secure the subjectivity or uncertainties of the pairwise priority by forming the pairwise comparison matrix. In this study, to remove uncertainties in decision making, the TFNs presented in Table 1 and Figure 1 were used during each step of the pairwise comparisons.
A TFN is composed of three elements, say (l, m, u); its membership function μ M ( x ) is summarized as follows [33]:
μ M ( x ) = { x l m l ,   l x m u x u m ,   m x u   0 ,   x > u ; x < 1 ,
If A ˜ 1 = ( l 1 ,   m 1 , u 1 ) and A ˜ 2 = ( l 2 ,   m 2 , u 2 ) represent two TFNs, then the algebraic operations can be expressed as follows [34]:
A ˜ 1 + A ˜ 2 = ( l 1 ,   m 1 , u 1 ) + ( l 2 ,   m 2 , u 2 ) = ( l 1 + l 2 ,   m 1 + m 2 , u 1 + u 2 ) ,
A ˜ 1 A ˜ 2 = ( l 1 ,   m 1 , u 1 ) ( l 2 ,   m 2 , u 2 ) = ( l 1 u 2 ,   m 1 m 2 , u 1 l 2 ) ,
A ˜ 1 × A ˜ 2 = ( l 1 ,   m 1 , u 1 ) × ( l 2 ,   m 2 , u 2 ) = ( l 1 l 2 ,   m 1 m 2 , u 1 u 2 ) ,
A ˜ 1 ÷ A ˜ 2 = ( l 1 ,   m 1 , u 1 ) ÷ ( l 2 ,   m 2 , u 2 ) = ( l 1 / u 2 ,   m 1 / m 2 , u 1 / l 2 ) ,
α × A ˜ 1 = ( α l 1 ,   α m 1 , α u 1 )   where   α > 0 ,
A ˜ 1 1 = ( l 1 ,   m 1 , u 1 ) 1 = ( 1 l 1 ,   1 m 1 ,   1 u 1 ) ,
We use the geometric mean technique proposed by Lee and Chou [35] to define the fuzzy geometric mean and fuzzy weights of each criterion as follows:
r i = ( a i j 1 × a i j 2 × × a i j 10 ) 1 / n   n = 1 ,   2 ,   ,   n ,
w i = r i × ( r 1 + r 2 + r 3 + + r n ) 1 ,
where aij is the fuzzy comparison value obtained by comparing criterion i with criterion j, therefore; ri is a geometric mean of a fuzzy comparison value of criterion i with each criterion; and wi is the fuzzy weight of the ith criterion and can be indicated by a TFN ,   w ˜ i = ( l w i ,   m w i , u w i ) . Here lwi, mwi, and uwi denote the lower, middle, and upper values of the fuzzy weight of the ith criterion.
Next, the inconsistency ratio (CR) of the matrix is calculated. This is because the comparisons in AHP lead to some inconsistencies. If the CR is unacceptable, the pairwise comparison should be reconsidered. The consistency index (CI) for calculating CR represents the deviation from the consistency and is calculated as follows [36]:
CI = λ m a x n n 1 ,
CR = CI RI ,
where n is the size of the pairwise comparison matrix; λmax is the maximum value of the comparison matrix; and RI is the random consistency index, which is shown in Table 2 [37].
Here, the consistency of the matrix is considered as acceptable only if the CR 0.10; otherwise, the decision maker is required to revise the original values in the pairwise comparison matrix as per the rule proposed by Saaty [38]. Finally, the weight of each criterion is calculated by the best non-fuzzy performance (BNP) value.
BNP   value = [ ( u l ) + ( m l ) ] 3 + l ,
The criteria are ranked on the basis of the BNP values. The criteria having a larger BNP value are considered to have a greater effect than the other criteria.

3.2. Data Collection

Because there was no single directory to enable us to identify shipping companies, we cross-checked multiple directories, such as the Korea Shipowners’ Association, Korea International Freight Forwarders Association, Maritime and Logistics Information Directory in the Korean shipping gazette, and Korean Port Logistics Association. Twelve detailed sub-criteria under the three main criteria (business, market environment, and policy) were identified in this study by undertaking interviews and a literature review. The overall objective of the decision process for the S&P activity of second-hand ships is at the first level of the hierarchy. For the main criteria on the second level, and the sub-criteria at the third level of the hierarchy, see Table 3.
The questionnaire for analysis was distributed to each shipping company that has S&P experience. From 13 November to 31 December 2017, 300 questionnaires were distributed, of which 81 were returned. The response rate was approximately 27% and 68 valid questionnaires were finally used for analysis. The respondents were chosen from shipping companies and ranged from CEOs to managers in sales and operations; thus, a comprehensive and balanced view was ensured. Fifty-seven respondents (number of employees are under 200) were from shipping companies that handle only dry bulk ships. In addition, 13 respondents from relatively large-scale companies (number of employees are over 200) were from the dry bulk department of shipping companies, although these companies handle all kinds of cargo (e.g., wet bulk, container, etc.). Data are shown in Table 4.

4. Findings

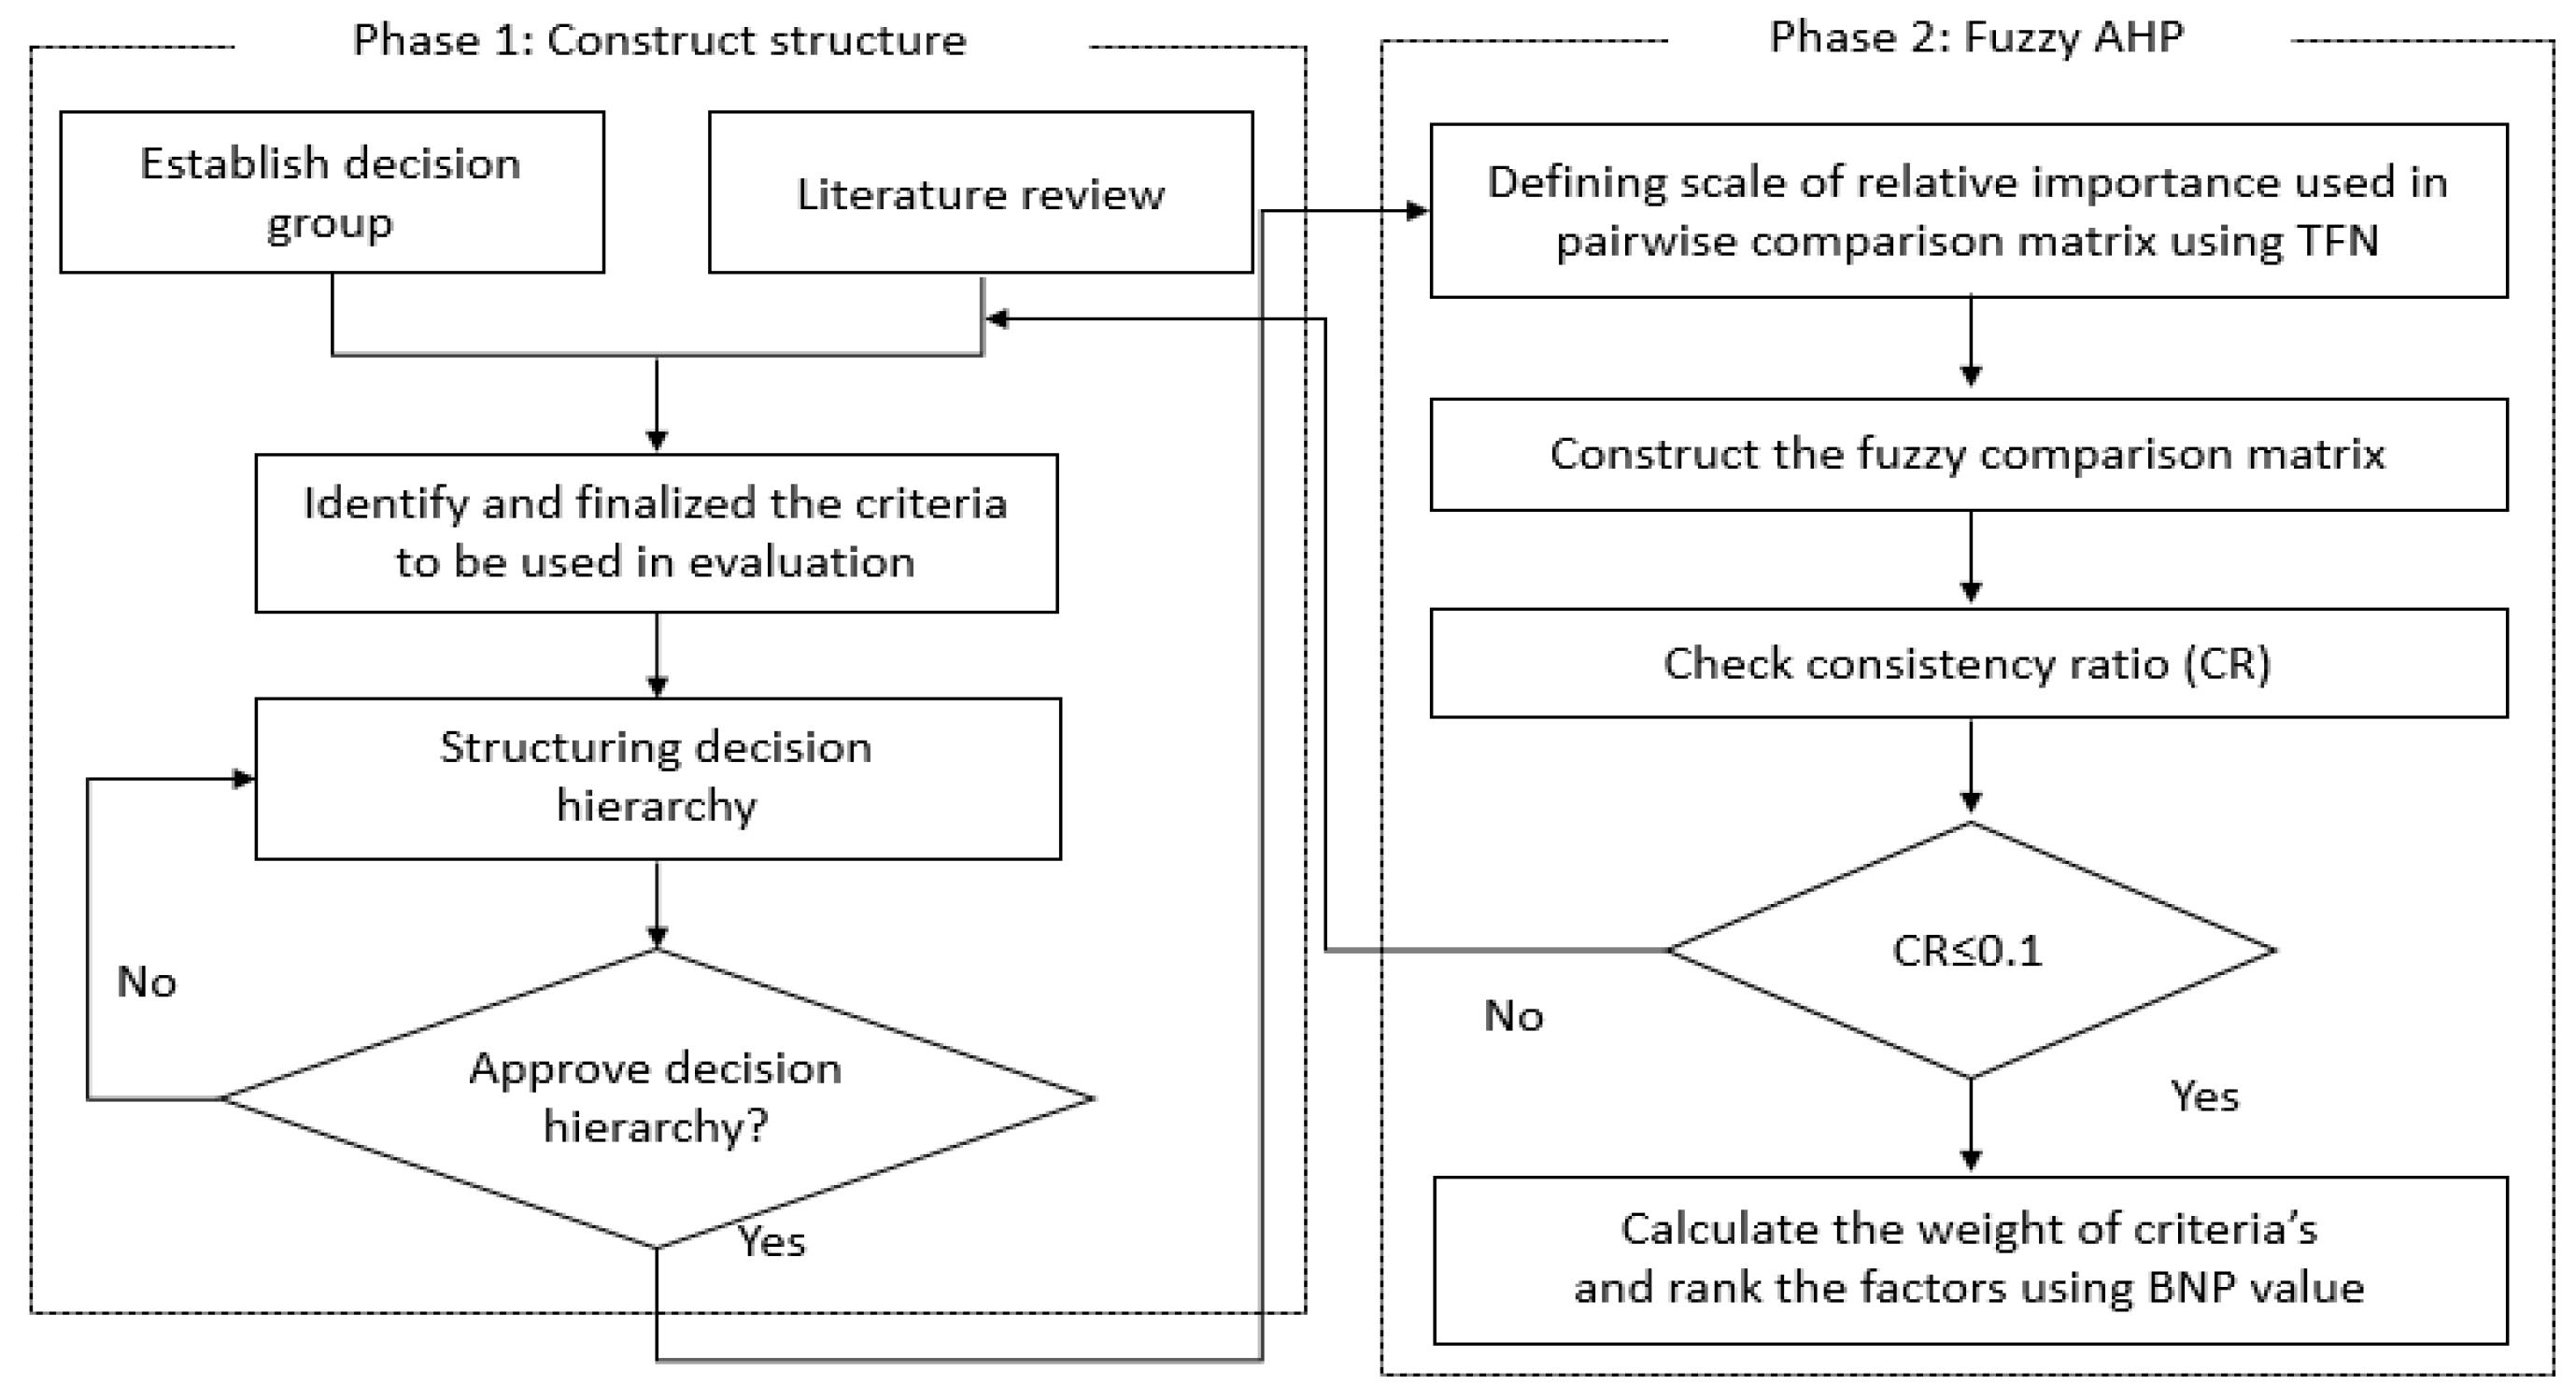
A good decision-making model needs to allow uncertainty because fuzziness is a common characteristic of many decision-making problems [42]. Shipping companies’ S&P activities are typical multi-criteria decision-making problems owing to the uncertainty prevailing in the shipping market [43]. Therefore, in this section, the fuzzy AHP approach is utilized to identify the priority factors when shipping companies acquire ships for sustainable growth by S&P activities. The structure of the analysis is shown in Figure 2.
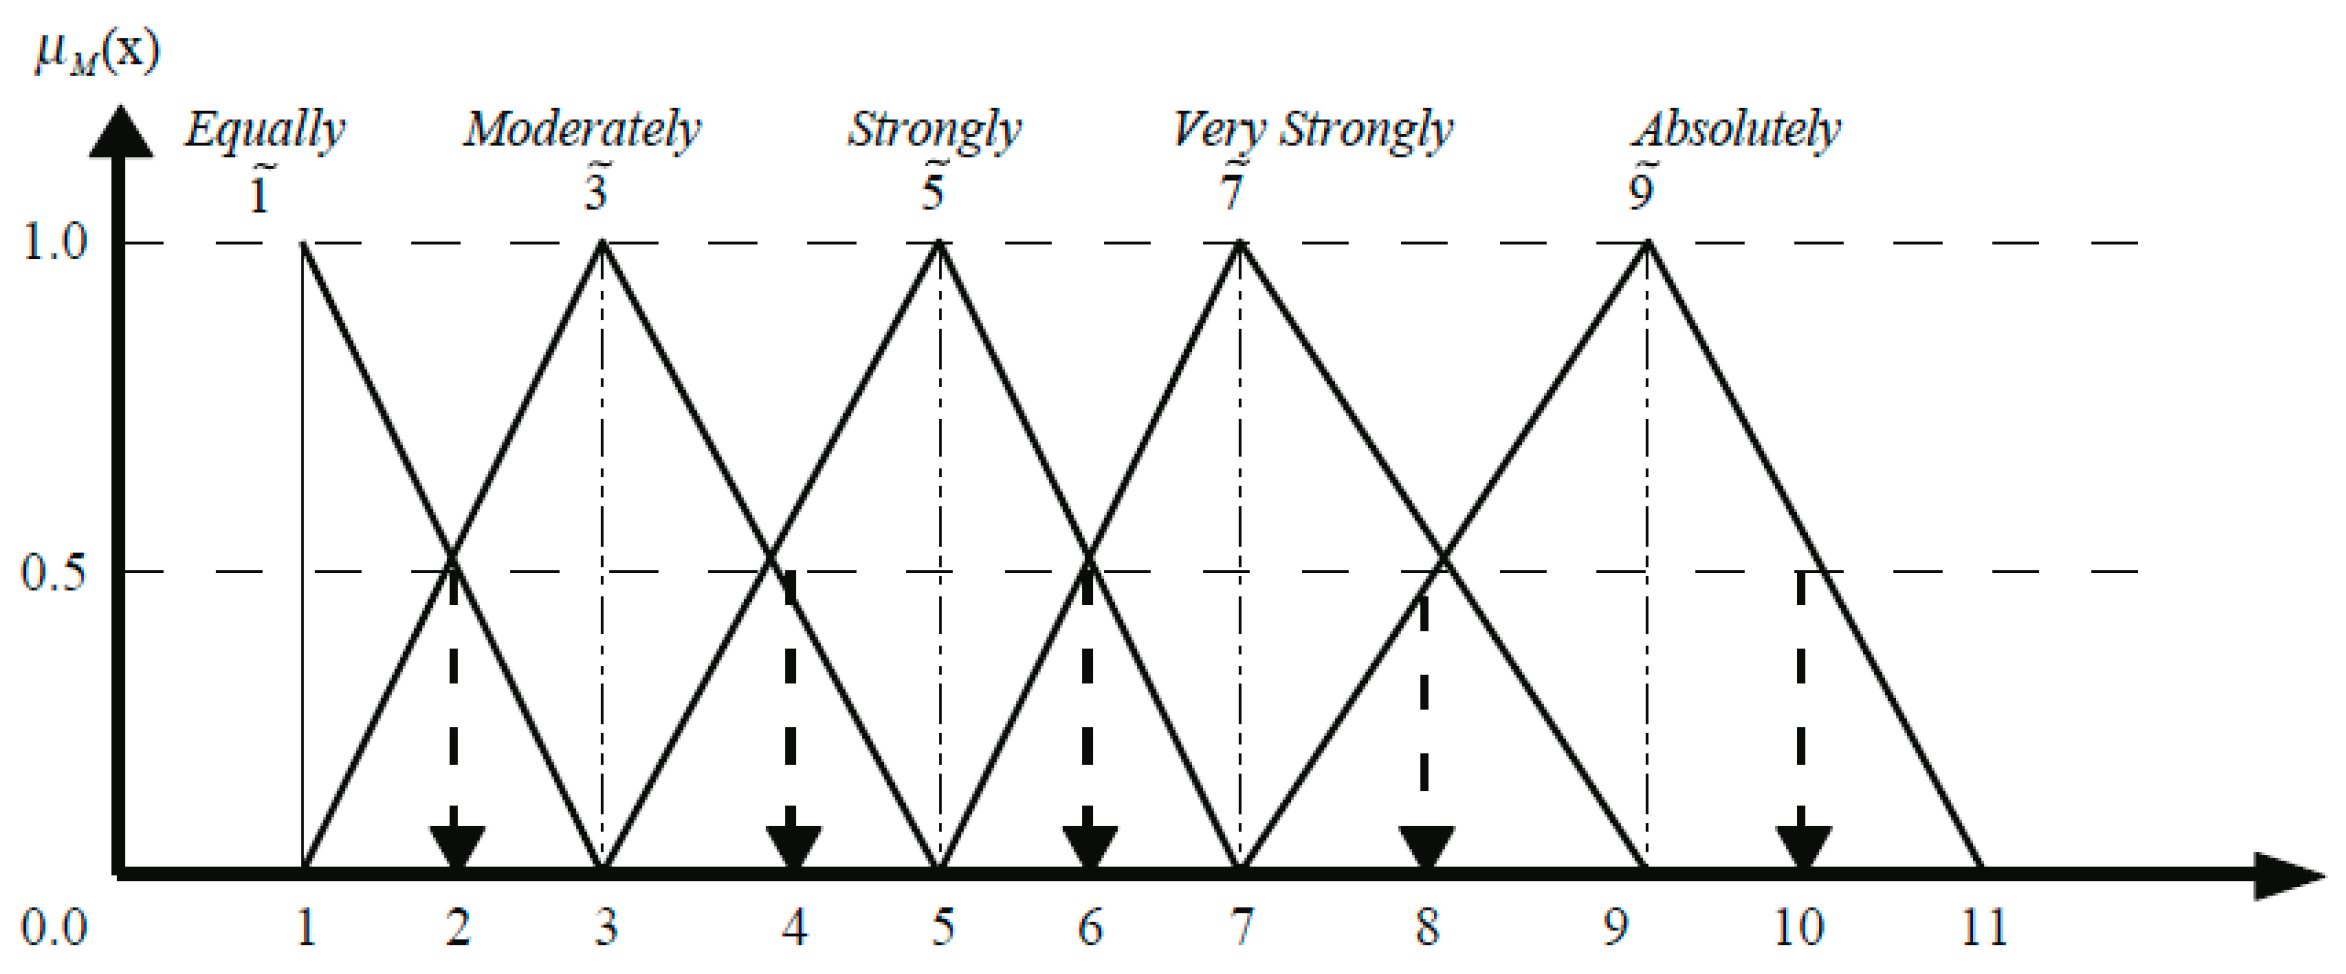
Respondents were asked to construct pairwise comparisons of the three major criteria and twelve sub-criteria by using linguistic variables. The CR of all matrices is less than 0.1, indicating that these matrices are sufficiently consistent. Then, the linguistic expressions were transformed into TFNs and a fuzzy evaluation matrix was established (see Table 1). Using the geometric mean, the pairwise comparison matrices of the criteria and sub-criteria are established. The results from the computations using the pairwise comparison matrices are shown in Table 5, Table 6, Table 7 and Table 8.
The next step is to obtain a fuzzy weighted evaluation matrix. By the calculated criteria weight, the weighted evaluation matrix is established using Equations (9) and (10). The results are shown in Table 9 and Table 10. This study explored the priorities during S&P activities in shipping companies. The second level of hierarchy (main criteria) included business, market environment and policy criteria. The results of the business criterion (M1) suggest that financial status and funding (B1) is the most important factor, followed by ship types and size (B3), strengthening market influence (B2), and old ship replacement fleet management (B4). In other words, it is shown that the decision making for ship acquisition is based on internal factors when making investment decisions, as well as on the ship type and size and the possibility of future participation in the market. The results of the market environment criterion (M2) suggest that fleet and throughput fluctuations (E2) are the most important factors, followed by oil price and freight rate change (E4), second-hand ship market fluctuation (E3), and international situation change (E1), in that order. This means that factors, such as the direct demand of the shipping market and the fleet/freight are taken into consideration when shipping companies determine ship acquisition. The results of the policy criterion (M3) suggest that investment support of policy finance institutions (P2) is the most important factor, followed by shipping tax benefits (P1), changes in domestic and overseas ship regulations (P3), and ship registry (P4). It can be seen from the long recession that shipping companies are very sensitive to government investment support or tax benefits. Finally, the results of the priority importance of the sub-criteria (Table 10) are as follows. The results in Table 10 suggest that investment support of policy financial institutions (P2) is the most important factor, followed by fleet and throughput fluctuations (E2), financial status and funding (B1), and oil price and freight rate change (E4).

5. Concluding Remarks

Although there is a considerable body of literature on the shipping industry using AHP [44,45], few studies applied AHP in S&P activities. Therefore, the academic contribution made by uncovering the importance of S&P for shipping companies’ sustainable growth using fuzzy AHP is broadly recognized. Although the previous literature has mainly analyzed determinants of the value of second-hand ships, research on the priority factors during acquisition by directly linking the shipping companies’ S&P activities is still limited. This study contributes to filling this gap by investigating the priority factors that shipping companies consider when they participate in S&P activities for sustainable growth through ship acquisition via fuzzy AHP. To the best of our knowledge, this research is the first exploration covering Korean shipping companies’ ship acquisition by S&P activities. This study may be able to contribute to a better understanding of the role of S&P in shipping companies and provide stakeholders with valuable insights. It also seems to complement previous academic research that focused on a business perspective criterion (M1), such as the ship size [13,15] and market environment perspective criteria (M2), such as the change in the number of orders and ships delivered [22], and fleets and throughput [40].
This research analyzed the factors that are important for the acquisition of a ship and sustainable growth in the Korean shipping industry and has the following notable implications. Derived from the results of fuzzy AHP, a business criterion, such as financial status and funding (B1), is the most important; it has a relative importance value of 0.343. It is followed by the market environment criteria (0.299), such as fleet and throughput fluctuations (E2) and oil price and freight rate change (E4). The five top-ranked factors in the fuzzy AHP results include two factors under business criteria (B1 and B3), two factors under market environment criteria (E2 and E4), and one factor under policy criterion (P2). These results might help to decide the direction of decision making for ship investment. First, as the criteria in business (M1) are considered to be the most important factors in the analysis for S&P, the more complex and difficult the problem, the more the number of analytical and rational factors that need to be decided. In other words, it would be valuable to consider the most reasonable ship investment factors, such as profitability review, financial status of the company, funding ability, and future market forecast (B1). For the business perspective criteria (M1), ship companies have a method to perform professional internal analysis in detail. If necessary, the shipping company may collaborate with external agencies and use a professional analysis tool, such as simulation, to predict the future before making an investment. In order to succeed in the shipping business, the managers in shipping companies might need to invest assets in forecasts so that they can accurately recognize market changes.
The findings indicate that ship types and sizes (B3) are important. It is empirically recognized that different ship types and sizes in the second-hand market lead to S&P activities and higher ship prices [6,13,16,20,22,44]. Further, this paper may supplement the existing study of Fan and Luo [46]. They argued that both fleets and throughput changes can increase the probability of ship investment to improve shipping companies’ profitability. This paper’s analysis found that the fleet/throughput fluctuations (E2) were an important factor in shipping companies’ S&P activity. In general, a shipping company reallocates its fleet and throughput to (1) reduce financial risks; (2) respond to changes in market share; and (3) maintain market profitability capacity. This study found that oil price and freight rate change (E4) in S&P activities was another important factor. According to Beenstock and Vergottis [40], an anticipated increase in fuel prices leads to expected shortages in the freight market, and this causes an increase in freight rates. The trade-off between oil prices and freight rates affects the profitability of shipowners. In other words, when shipping companies decide on S&P activities, the fleet/throughput fluctuations (E2) reflecting the direct demand of the shipping market and oil price/freight rates (E4) affecting the profitability of the ship should be considered. Because the most important part is investment support of policy financial institutions (P2), the government and financial policy institutions should provide investment support measures for these S&P activities. Especially, the S&P business of Korean shipping companies is at its infancy. Since most of the international S&P activities are dominated by foreign shipping companies, the S&P scale and demand of the Korean shipping industry is not accurately understood. For this reason, there are still a large number of shipping companies that mainly focus on ship operating income. Therefore, brokerage firms specializing in S&P business are still operating on a small scale, and considerable time is needed to secure international competitiveness [4]. Therefore, it would be valuable to refer to the work of Haralambides and Yang [47]. They suggest that the government should foster a more proactive shipping policy, marked by financial support for shipping companies, and maintenance of related laws and systems. Although, existing research was not focused on financial status and funding (B1) for S&P, surprisingly, this paper has found that these factors have a high priority when shipping companies conduct S&P activities for the acquisition of second-hand ships. Because Korean brokerage companies, specializing in S&P business, are still operating on a small scale, and considerable time is needed to secure international competitiveness as mentioned above, the Korean government and related ministries should seek laws, systems, and financial support for shipping companies. To benchmark research, and in order to activate Korean S&P business, the development of related laws and systems is indispensable. Further, the policy support system should be able to install the financial status and funding (B1) of Korean shipping companies. In addition, to achieve sustainable growth, a basic plan of public-private partnership should be laid out and the development plan should be systematically promoted.
Despite the superiority of this study over previous ones, it contains some limitations. It has been difficult for decision makers involved in the acquisition of ships to obtain reliable and consistent data on their decision making and judgment. Especially, in terms of tramp companies, the information is very limited because there are many small and non-listed companies. Therefore, it will be necessary to obtain more accurate results by securing a variety of objective data through more in-depth interviews and surveys. Decisions about S&P investments are made on the basis of management policies. However, most of the surveys were performed at the staff level. In the future, it will be meaningful to explore how executives make different judgments by interviewing a wider range of personnel. This research has shown that decision making to secure ships by shipping companies is influenced not only by business criteria but also by market environment criteria. However, the analysis of this research did not yield results that demonstrated reasonable performance on the basis of the crucial factors involved in the decision. Therefore, it is not enough to present objective problems of shipping companies and to suggest reasonable alternatives. In order to compensate for this, it will be necessary to study additional internal and external factors of the shipping market through statistical analysis, in conjunction with the analysis of this study.

Author Contributions

K.-S.P. proposed a main idea and wrote the research approach. A.-R.K. conducted the main analysis and wrote methodology and result parts. Y.-J.S. reshaped the research idea, collected the main data and conducted the analysis. M.-H.H. provided research ideas and methodological knowledge, and collected data.

Funding

This research received no external funding.

Conflicts of Interest

The authors declare no conflict of interest.

References

  1. Ahn, K.-H.; Kim, P.J. The Application of Shipbuilding Contract and Refund Guarantee: Cases Studies among Korean Shipbuilder, Foreign Buyer, Guarantor and Export Credit Agency. J. Korea Trade 2017, 21, 292–308. [Google Scholar] [CrossRef]
  2. Kim, C.Y.; Park, K.S. An Analysis on the Causal Relationship Between Freight Rate and Newbuilding Orders: Implications for Korean trade and Shipbuilding Companies. J. Korea Trade 2017, 21, 22–37. [Google Scholar] [CrossRef]
  3. Stopford, M. Maritime Economics, 3rd ed.; Routledge: London, UK, 2009; ISBN 0-203-89174-0. [Google Scholar]
  4. Hwang, J.H.; Lee, E.K.; Choe, Y.S. Strategies to Invigorate the Ship Sale & Purchase Business; Korea Maritime Institute: Busan, Korea, 2011; Available online: http://www.ndsl.kr/ndsl/search/detail/report/reportSearchResultDetail.do?cn=TRKO201300020953 (accessed on 29 December 2017).
  5. Cullinane, K.; Yap, W.Y.; Lam, J.S.L. The Port of Singapore and its Governance Structure. Res. Transp. Econ. 2006, 17, 285–310. [Google Scholar] [CrossRef]
  6. Thanopoulou, H.A. Chapter 2 Fleet for the 21st Century: Modern Greek Shipping. Res. Transp. Econ. 2007, 21, 23–61. [Google Scholar] [CrossRef]
  7. Bijwaard, G.E.; Knapp, S. Analysis of Ship Life Cycles-The impact of Economic Cycles and Ship Inspections. Mar. Policy 2009, 33, 350–369. [Google Scholar] [CrossRef]
  8. Knapp, S.; Kumar, S.N.; Remijn, A.B. Econometric Analysis of the Ship Demolition market. Mar. Policy 2008, 32, 1023–1036. [Google Scholar] [CrossRef]
  9. Strandenes, S.P. Chapter 8: Economics of the Markets for Ships. In The Handbook of Maritime Economics and Business, 2nd ed.; Grammenos, C.T., Ed.; Lloyd’s List: London, UK, 2010; pp. 186–202. ISBN 978-1-84311-880-0. [Google Scholar]
  10. Goldrein, I.; Hannaford, M.; Turner, P. Ship Sale and Purchase, 6th ed.; Informa Law from Routledge: London, UK, 2013; ISBN 978-1-84214-587-6. [Google Scholar]
  11. Hellenic Shipping News. Shipping Market Overview: Spring 2018. Available online: https://www.hellenicshippingnews.com/shipping-market-overview-spring-2018 (accessed on 8 May 2018).
  12. Chou, H.-C.; Chen, D.-H. The Use of Technical Analysis in Sale-and-Purchase Transactions of Secondhand Ships. Marit. Econ. Logist. 2018, unpublished. [Google Scholar] [CrossRef]
  13. Tsolakis, S.D.; Cridland, C.; Haralambides, H.E. Econometric Modelling of Second-hand Ship Prices. Marit. Econ. Logist. 2003, 5, 347–377. [Google Scholar] [CrossRef]
  14. Scarsi, R. The Bulk Shipping Business: Market Cycles and Shipowners’ Biases. Marit. Policy Manag. 2007, 34, 577–590. [Google Scholar] [CrossRef]
  15. Merikas, A.G.; Merika, A.A.; Koutroubousis, G. Modelling the Investment Decision of the Entrepreneur in the Tanker Sector: Choosing Between a Second-hand Vessel and a Newly Built One. Marit. Policy Manag. 2008, 35, 433–447. [Google Scholar] [CrossRef]
  16. Alizadeh, A.H.; Nomikos, N.K. Investment Timing and Trading Strategies in the Sale and Purchase Market for Ships. Transp. Res. Part B 2007, 41, 126–143. [Google Scholar] [CrossRef]
  17. Wright, G. Market Fundamentals, Market Sentiment and Second-hand Ship Prices. Int. J. Transp. Econ. 2005, 32, 93–101. [Google Scholar]
  18. Pirrong, S.C. Contracting Practices in Bulk Shipping Markets: A Transactions Cost Explanation. J. Law Econ. 1993, 36, 937–976. [Google Scholar] [CrossRef]
  19. Adland, A.O.; Koekebakker, S. Market Efficiency in the Second-hand Market for Bulk Ships. Marit. Econ. Logist. 2004, 6, 1–15. [Google Scholar] [CrossRef]
  20. Hale, C.; Vanags, A. The Market for Second-hand Ships: Some Results on Efficiency Using Cointegration. Marit. Policy Manag. 1992, 19, 31–39. [Google Scholar] [CrossRef]
  21. Syriopoulos, T.; Roumpis, E. Asset Allocation and Value at Risk in Shipping Equity Portfolios. Marit. Policy Manag. 2009, 36, 57–78. [Google Scholar] [CrossRef]
  22. Alizadeh, A.H.; Nomikos, N.K. The Price-Volume Relationship in the Sale and Purchase Market for Dry Bulk Vessels. Marit. Policy Manag. 2003, 30, 321–337. [Google Scholar] [CrossRef]
  23. Merikas, A.; Gounopoulos, D.; Nounis, C. Global Shipping IPOs Performance. Marit. Policy Manag. 2009, 36, 481–505. [Google Scholar] [CrossRef] [Green Version]
  24. Ahn, D.-H.; Conrad, J.; Dittmar, R.F. Risk Adjustment and Trading Strategies. Rev. Financ. Stud. 2003, 16, 459–485. [Google Scholar] [CrossRef]
  25. Gumus, A.T. Evaluation of Hazardous Waste Transportation Firms by using a Two-step Fuzzy AHP and TOPSIS Methodology. Expert Syst. Appl. 2009, 36, 4067–4074. [Google Scholar] [CrossRef]
  26. Xu, J.; Jiang, X.; Wu, Z. A Sustainable Performance Assessment Framework for Plastic Film Supply Chain Management from a Chinese Perspective. Sustainability 2016, 8, 1042. [Google Scholar] [CrossRef]
  27. Udo, G.G. Using Analytic Hierarchy Process to Analyze the Information Technology Outsourcing Decision. Ind. Manag. Data Syst. 2000, 100, 421–429. [Google Scholar] [CrossRef]
  28. Chang, D.Y. Applications of the Extent Analysis Method on Fuzzy AHP. Eur. J. Oper. Res. 1996, 95, 649–655. [Google Scholar] [CrossRef]
  29. Mikhailov, L. A Fuzzy Approach to Deriving Priorities from Interval Pairwise Comparison Judgments. Eur. J. Oper. Res. 2004, 159, 687–704. [Google Scholar] [CrossRef]
  30. Shen, L.; Govindan, K.; Shankar, M. Evaluation of Barriers of Corporate Social Responsibility Using an Analytical Hierarchy Process under a Fuzzy Environment—A Textile Case. Sustainability 2015, 7, 3493–3514. [Google Scholar] [CrossRef]
  31. Ha, M.-H.; Yang, Z. Comparative analysis of port performance indicators: Independency and interdependency. Transp. Res. Part A 2017, 103, 264–278. [Google Scholar] [CrossRef]
  32. Song, B.; Sun, Q.; Li, Y.; Que, C. Evaluating the Sustainability of Community-Based Long-Term Care Programmes: A Hybrid Multi-Criteria Decision-Making Approach. Sustainability 2016, 8, 657. [Google Scholar] [CrossRef]
  33. Patil, S.K.; Kant, R. A Fuzzy AHP-TOPSIS Framework for Ranking the Solutions of Knowledge Management Adoption in Supply Chain to Overcome its Barriers. Expert Syst. Appl. 2014, 41, 679–693. [Google Scholar] [CrossRef]
  34. Lee, Y.-C.; Chou, C.J. Technology Evaluation and Selection of 3DIC Integration Using a Three-Stage Fuzzy MCDM. Sustainability 2016, 8, 114. [Google Scholar] [CrossRef]
  35. Jung, H. Evaluation of Third Party Logistics Providers Considering Social Sustainability. Sustainability 2017, 9, 777. [Google Scholar] [CrossRef]
  36. Hsieh, T.-Y.; Lu, S.-T.; Tzeng, G.-H. Fuzzy MCDM Approach for Planning and Design Tenders Selection in Public Office Buildings. Int. J. Proj. Manag. 2004, 22, 573–584. [Google Scholar] [CrossRef]
  37. Saaty, T.L. A Scaling Method for Priorities in Hierarchical Structures. J. Math. Psychol. 1977, 15, 234–281. [Google Scholar] [CrossRef]
  38. Beenstock, M. A Theory of Ship Prices. Marit. Policy Manag. 1985, 12, 215–225. [Google Scholar] [CrossRef]
  39. Beenstock, M.; Vergottis, A. An Econometric Model of the World Market for Dry Cargo Freight and Shipping. Appl. Econ. 1989, 21, 339–359. [Google Scholar] [CrossRef]
  40. Adland, R.O. Technical Trading Rule Performance in the Second-hand Asset Markets in Bulk Shipping. In Foundation for Research in Economics and Business Administration 2000, Bergen (No. 04); Working Paper; MIT: Barum, Norway, 2000. [Google Scholar]
  41. Yu, C.S. A GP-AHP Method for Solving Group Decision-making Fuzzy AHP problems. Comp. Oper. Res. 2002, 29, 1969–2001. [Google Scholar] [CrossRef]
  42. Bendall, H.; Stent, A.F. Investment Strategies in Market Uncertainty. Marit. Policy Manag. 2010, 30, 293–303. [Google Scholar] [CrossRef]
  43. Adland, R.O.; Jia, H.; Koekebakker, S. The Pricing of Forward Ship Value Agreements and the Unbiasedness of Implied Forward Prices in the Second-Hand Market for Ships. Marit. Econ. Logist. 2004, 6, 109–121. [Google Scholar] [CrossRef]
  44. Chang, Y.-T.; Lee, S.-Y.; Tongzon, J.L. Port selection factors by shipping lines: Different perspectives between trunk liners and feeder service providers. Mar. Policy 2008, 32, 877–885. [Google Scholar] [CrossRef]
  45. Chou, T.-Y.; Liang, G.-S. Application of a fuzzy multi-criteria decision-making model for shipping company performance evaluation. Marit. Policy Manag. 2001, 28, 375–392. [Google Scholar] [CrossRef]
  46. Fan, L.; Luo, M. Analyzing Ship Investment Behaviour in Liner Shipping. Marit. Policy Manag. 2013, 40, 511–533. [Google Scholar] [CrossRef]
  47. Haralambides, H.E.; Yang, J. A Fuzzy Set Theory Approach to Flagging Out: Towards a New Chinese Shipping Policy. Mar. Policy 2003, 27, 13–22. [Google Scholar] [CrossRef]
Figure 1. Fuzzy membership function for the linguistic expressions for main criteria and sub-criteria.
Sustainability 10 01763 g001
Figure 2. The methodology of two main stages.
Sustainability 10 01763 g002
Table 1. The membership function of the linguistic value scale.
Fuzzy NumberLinguistic TermScale of Fuzzy Number
1 ˜ Equally important(1, 1, 3)
3 ˜ Moderately important(1, 3, 5)
5 ˜ Strongly important(3, 5, 7)
7 ˜ Very strongly important(5, 7, 9)
9 ˜ Absolutely important(7, 9, 11)
Table 2. The random consistency index.
Size (n)12345678
RI000.520.891.111.251.351.40
Table 3. The criteria and their description.
Main CriteriaSub-CriteriaDescriptionReferenceInterview
Business (M1)Financial status and funding (B1)Investment in expanding market share, entering new markets, and securing future business potential[13,14,15]O
Strengthening market influence (B2)Corporate creditworthiness including shipping company’s cash flow and debt ratio[14,39]O
Ship types and size (B3)Ship types such as tanker, dry bulk, and ship size such as Handysize, Capesize, Suezmax[7,8,9,13,14,15,22,39,40,41]O
Old-age ship replacement fleet management (B4)Fixed costs, such as repair costs and insurance, depending on the number of years of use of the vessel[13,14,22,39,40]O
Market Environment (M2)International situation changes (E1)Changes in domestic and international political conditions, such as the US presidential election, deregulation in Iran, and expansion of the Panama Canal[13,14,39]O
Fleet and throughput fluctuations (E2)Changes in the number of orders and deliveries of ships, and fleets, throughput of major freights [14,15,22,39,40,41]O
Market fluctuation (E3)Fluctuation in prices of second-hand ships, such as 5- and 10-year old ships[13,14,22,39,40,41]O
Oil price and freight rate change (E4)Changes in crude oil price and freight rate for each route[14,15,39,40]O
Policy (M3)Shipping tax benefit (P1)Tax benefit factors such as tonnage[41]O
Investment support of policy financial institutions (P2)Investment in support of policy financial institutions, such as shipping guarantee fund and shipbuilding export credit and ship financing loans[39,40]O
Changes in domestic and overseas ship regulations (P3)Regulation of environmental pollution, including carbon dioxide emission regulation, hull structure improvement regulation[8,9,40]O
Ship registry (P4)Ship registration benefit factors[8,9,40]O
Table 4. Respondents profile.
Demographic CharacteristicsNumberDemographic CharacteristicsNumber
Position Number of employees
Assistant manager22Below 10026
Manager17101–20029
Deputy general manager12201–3009
Department manager9Over 3004
Managing director6
CEO2
Table 5. Fuzzy comparison matrix of the major criteria.
M1M2M3
M1(1, 1, 1)(1.076, 1.505, 2.066)(1.076, 1.505, 2.066)
M2(0.484, 0.664, 0.930)(1, 1, 1)(1.559, 2.320, 3.005)
M3(0.484, 0.664, 0.930)(0.333, 0.431, 0.641)(1, 1, 1)
Table 6. Fuzzy comparison matrix of the business criteria.
B1B2B3B4
B1(1, 1, 1)(1.379, 1.934, 2.544)0.8411, 1.253, 1.709)(2.479, 3.501, 4.499)
B2(0.393, 0.517, 0.725)(1, 1, 1)(0.857, 1.184, 1.512)(1.695, 2.720, 3.699)
B3(0.585, 0.798, 1.189)(0.662, 0.845, 1.166)(1, 1, 1)(1.802, 2.746, 3.651)
B4(0.222, 0.286, 0.403)(0.270, 0.368, 0.590)(0.274, 0.364, 0.555)(1, 1, 1)
Table 7. Fuzzy comparison matrix of the market environment criteria.
E1E2E3E4
E1(1, 1, 1)(0.200, 0.250, 0.348)(0.238, 0.308, 0.447)(0.232, 0.296, 0.418)
E2(2.871, 3.957, 5.003)(1, 1, 1)(1.560, 2.150, 2.752) (1.242, 1.749, 2.296)
E3(2.239, 3.250, 4.208)(0.363, 0.465, 0.641)(1, 1, 1)(0.424, 0.542, 0.745)
E4(2.390, 3.373, 4.319)(0.436, 0.572, 0.805)(1.342, 1.844, 2.358)(1, 1, 1)
Table 8. Fuzzy comparison matrix of the policy criteria.
P1P2P3P4
P1(1, 1, 1)(0.317, 0.405, 0.540)(1.023, 1.470, 1.961)(1.595, 2.295, 2.965)
P2(1.845, 2.469, 3.158)(1, 1, 1)(1.793, 2.430, 3.111)(2.402 3.441, 4.445)
P3(0.510, 0.680, 0.977)(0.321, 0.412, 0.558)(1, 1, 1)(1.308, 2.051, 2.711)
P4(0.337, 0.436, 0.627)(0.225, 0.291, 0.416)(0.369, 0.488, 0.765)(1, 1, 1)
Table 9. Ranking of main criteria for shipping companies’ ship acquisition by S&P activity.
Major CriterionConsistencyMajor Criterion WeightMajor Criterion BNPRanking
Business0.010(0.271, 0.339, 0.419)0.3431
Environment(0.235, 0.298, 0.364)0.2992
Policy(0.140, 0.170, 0.217)0.1763
Table 10. Ranking of sub-criteria for shipping companies’ ship acquisition by S&P activity.
Sub-CriterionConsistencySub-Criterion WeightBNPRankingTotal Ranking
B10.010(0.231, 0.303, 0.374)0.30313
B2(0.155, 0.202, 0.252)0.20336
B3(0.162, 0.207, 0.267)0.21225
B4(0.064, 0.079, 0.107)0.083411
E10.020(0.056, 0.068, 0.088)0.071412
E2(0.267, 0.341, 0.412)0.34012
E3(0.133, 0.165, 0.207)0.16838
E4(0.189, 0.238, 0.294)0.24024
P10.010(0.149, 0.191, 0.235)0.19227
P2(0.296, 0.376, 0.453)0.37511
P3(0.120, 0.153, 0.194)0.15639
P4(0.072, 0.088, 0.118)0.093410

