1. Introduction
The exploitation of natural resources has been a cause of great concern, mainly because it often leads to the reduction, or even scarcity, of these resources. Life Cycle Impact Assessment (LCIA) methods quantify, among other environmental impacts, indicators related to resource depletion impact [
1], though a consensus on the modeling techniques has yet to be reached [
2]. In fact, in the framework recently proposed by the UNEP/SETAC life cycle initiative, a consensus was reached on the fact that resource depletion should be modeled by the loss of instrumental value of resources [
3]. However, the main approaches to assessing the impact of resource utilization do not focus on the loss of functionality related to the utilization of the resource [
4]. Only some of the most recent approaches developed for water use and mineral and metal resource use started to account for the functionality of resources into impact assessment models [
5,
6].
The cause-effect chain shown in
Figure 1—Proposed by the ILCD [
7]—Describes the environmental mechanisms from the extraction of a natural resource to its depletion. In this framework, the substitution of a scarce resource is an alternative to supply the society’s demand in the future, in the case of an eventual reduction in its availability.
The resource’s scarcity does not have any consequences if the depleted resource is economically and technically easy to replace. If the substitution is more difficult, however, the effects will be more serious [
8]. Resource substitution is therefore a factor that can minimize the risk of a scarcity of supply [
9].
The assessment of the substitutability, therefore, is important to determine the consequences of resource depletion: the greater the possibility of substitution, the lower the chances of a shortage in the future.
A substitution approach was proposed to assess resource depletion in LCIA by De Bruille et al. [
6]. It was also highlighted by Sonnemann et al. [
10] that it is important to account for the fact that a function provided by a resource can also be provided by another resource if the substitution is economically and technically viable [
10].
Substitutability is also considered important for resource depletion impact assessment outside the field of LCIA in the resource criticality approach. In order to assess the substitutability of a resource, Graedel et al. [
11] highlight that it is necessary to identify its main functions, to determine the distribution of current users among those functions, to identify the most viable substitute material for each final use and to assess its properties [
11].
According to the method adopted by Graedel et al. [
11], the substitution of a resource can be evaluated through four indicators: performance, availability, the substitute’s environmental impact and the price compared to the original resource. This method was applied to metals, and as stated by Graedel et al. [
11], no metal is completely irreplaceable. The feasibility of metal substitution depends on its properties, with some metals having more than one possible substitute for their different functions.
Biotic-resource depletion is currently poorly covered in LCIA. Hence, it is important to develop an impact assessment model to assess the environmental consequences of wood use in a manner consistent with what is done for the other types of resources currently covered.
Therefore, it is crucial to assess the impact from wood resource use, accounting for wood substitutability by other resources. This study aims to develop a wood substitutability index through a functional approach.
2. Methods
The methodological steps are described below. Firstly, the functionality of wood was determined; the next step was to identify the potential substitute for wood for each function; subsequently, different methods that use substitution as an indicator for resource scarcity were compared; then the substitution index (SI) was obtained; and, finally, the method was evaluated.
2.1. Wood Functionality Determination
In order to identify a substitute, it was necessary to know which functions the resource would perform. To that effect, we classified the main functions and uses of wood according to the definitions available in the FAO Yearbook of Forest Products [
12]. Both the FAO yearbook and the FaoStat database [
13] have product categories that distinguish between wood from coniferous and non-coniferous trees. Not all the categories distinguish between these components, however, presenting aggregated data, especially for the more specific functions. For this reason, coniferous and non-coniferous species were grouped in each function, with no distinction between them.
The products were analyzed according to their representativeness in the FaoStat database [
13]. The wood intended for fuel utilization corresponded to more than 51% of all roundwood production in the world in 2010. Therefore, wood fuel is the most representative product, and thus the most important one in the production chain, followed by sawnwood and wood-based panels (27%) and wood pulp, particles, and fibers (17%). Other industrial wood products have very low representativeness, not reaching 5% of the global volume of roundwood. Based on this data, we selected functions related to three categories: wood fuel; sawlogs and veneer; and wood pulp, particles, and fibers.
2.2. Identification of Possible Substitutes
We based the identification of possible substitutes for the selected functions on resources that perform the same functions. We then determined if the substitute’s performance was similar to wood in the specific function in analysis. The selection rested on the specialized literature and had a generic and qualitative character. Next, we identified the main applications of the substitute by verifying its similarity to wood in the function in analysis. In this case, the potential substitute must have already been used in the same function; we did not investigate substitutes that were considered but not actually used for the function in question because this would demand specific quantitative research.
In sequence, we analyzed the most relevant characteristics and properties required for the efficient performance of the function. In order to simplify the analysis, we considered only the main characteristic of each function.
After that, we checked if the substitute had already been used, if it was being currently used and if there was a probability of it being used in the future for the same function.
Each one of the selected functions has different characteristics according to its expected performance. Based on this performance, we compared the identified substitutes and chose for each function an adequate one that had the available data necessary for our method.
In order to simplify SI calculation, we selected only one substitute for each function. We suggest that other substitutes be included in future studies.
2.3. Substitutability Index Choice
The following existing methodologies for the determination of a substitutability index were analyzed and compared in order to select the most relevant and easiest to adapt to wood resource substitutability:
Elasticity of substitution [
14]—A methodology in the field of economic studies that is already in use and has been applied to determine the substitution index of several resources. “This methodology assesses the ease of substitution between two inputs of production, which is defined as the percentage change in the input ratio caused by a percent change in relative input prices”;
Material competition scarcity index [
6]—The only approach in LCIA that uses the concept of resource substitution to assess resource depletion impact. “This methodology assesses mineral and metallic resource depletion taking into account the resources’ availability and their uses in different functionalities”;
Report on critical raw materials for the EU [
15]—A report on criticality that presents a substitution index for various materials. “This methodology assesses criticality with a combination of two assessment components: economic importance and supply risk by poor governance”;
Methodology of metal criticality determination [
11]—A study of criticality of metals that specifies a method for the assessment and identification of the substitutability of metals, with a potential for application in LCIA. “This methodology quantifies the degree of criticality of metals through three dimensions: supply risk, environmental implications and vulnerability to supply constraints”.
We evaluated these works on a qualitative basis according to these criteria:
The scope criterion identifies at which level the methodology presents its results (global, regional, national, corporate);
The resources considered criterion verifies which resources are assessed and if it is easily applicable to wood;
The main result criterion identifies what the main objective of the study is and the results obtained;
The clarity and complexity criteria examines if the study is easy to comprehend and assesses its level of complexity for potential future applications, respectively (high, medium or low), checking if the calculations do not present specificities that are too great and if the variety of data is easily accessible;
The ease of replication criterion assesses if other researchers in the field are able to replicate the method (high, medium, or low).
2.4. Data Quality Assessment
The data applied to the equations are for the year 2010, the last year with commercial stock data growth available from FAO [
12]. As this data is of great importance for calculating wood availability, the data for the substitutes are also for the year 2010. In the cases where necessary data was not available for this year, we used data for the year closest to this reference. In acquiring data, we gave priority to databases with free access and which contained information for the largest number of countries, even considering the possibility of working with estimated data.
After selecting the databases, we assessed the quality of the data, having as reference the pedigree matrix, developed by Weidema and Wesnaes [
16] and adapted by Ciroth [
17], including monetary issue. The pedigree matrix has five quality indicators, each of them evaluated on a scale of 1 to 5. The result 1 represents the best quality, and the result 5 represents the worst quality. We then applied the pedigree matrix considering only the following indicators, with their initial quality requirements:
Source reliability—Data based on measurements;
Completeness—Representative data for a sufficient sample of sites for an appropriate period (193 countries);
Temporal correlation—Less than three years of difference for the year of study; and
Geographic correlation—Data of the studied area.
We did not use the correlation of technological advances indicator because it refers directly to the materials and processes, which does not correspond to the scope of this study.
We evaluated the data quality first in general, and then for each wood function because the indicator of completeness has a differentiated score.
2.5. Method Assessment
When determining that one resource can be substituted for another, the inverse relationship must also be true; that is, if firewood can be replaced with briquettes, it is assumed that briquettes can also be replaced by firewood. When this substitution is quantitative, as is the case in our method, the larger the value on a scale of 0 to 1, the greater the possibility of substitution. The values are expected to be inverse when switching the resource with the substitute.
Thus, we verified whether by replacing a function of the wood with another resource, its inverse relationship also became true (for instance, if the substitution of coal for charcoal is bad, then the substitution of charcoal for coal should be good). In order to verify this, we have recalculated all the calculations of the five functions analyzed by inverting the variables in the equations for the availability ratio (Equation (4)) and for the import price ratio (Equation (7)).
In order to assess the quality of the method, we used criteria to verify attributes and limitations according to Lacerda et al. [
18]. We evaluated the method based on the following criteria:
Functionality—Ability to perform the intended task, or usability of the method;
Efficiency—Ability to present clear results;
Effectiveness—Ability to deliver results quickly;
Generality—Generic application capacity;
Ease of Use—Ease of application by researchers in the area;
Reproducibility—Ease of reproduction;
Comparison—Advantages and disadvantages when comparing with other similar methods;
Representation of reality—Ability to present results that correctly reflect the reality; for this, we consulted with an expert in forest engineering [
19];
Utility—Usefulness for a specific community of users.
3. Results and Discussion
3.1. Wood Functionality
The FAO yearbook [
12] classifies wood utilization at the global level into two main categories: wood for fuel and wood for industrial purposes. These categories have other subdivisions that are closer to the commercial finished products, as shown in
Figure 2.
We selected the functions highlighted in
Figure 2 by cross-referencing the productive chain with the FAO definitions to identify data availability [
12,
20,
21]. We then excluded some functions (for example, paper and paperboard, furniture) that are supplied by the production of other functions, as they could be double-counted, and because they are finished products, containing raw materials other than wood in its composition.
Although the database used in our study presents data referring only to charcoal, pellets and other agglomerates, besides charcoal, we also put firewood in the wood for fuel category. In this case, we considered roundwood as the remaining wood for fuel, removing coal, pellets and other particle boards.
Within the category of sawlogs and veneer logs, which also include wood for railway sleepers and for the production of veneers, sawnwood has been the most prominent in the last decade. Thus, because of the high representativeness of sawnwood, we selected it as a function for the application of our method.
The wood used to produce panels is in the industrial roundwood category and amounted to 27% of it at the global level in the year 2010. Although different types of panels use wood with different properties, we discarded these subdivisions in determining the functions. Firstly, it is better to keep all the selected functions at the same hierarchical level, and secondly, the selection of a different substitute for each of them with the available data proved impractical.
The wood used for the production of paper and cellulose is in the wood pulp, particles, and fibers category, and the final destination is the production of paper and paperboard. Chemical wood pulp is the most representative in the category. For this reason, we did not subdivide this function; only the main wood pulp function remained for the application of the method.
After analyzing the functions along with the importance and representativeness that they have in wood utilization, it was possible to select the functions for applying our proposed method. The functions are: charcoal; firewood; sawnwood; wood-based panels and wood pulp. The choice of these specific functions does not prevent the selection of other alternatives in future studies. This will depend on the focus of the research and especially on the scope to which apply the method and the data availability.
3.2. Wood Substitutes
Having selected the functions, we then identified their substitutes. For each one of the functions, we analyzed two or three possible substitutes. Here we present the substitutes that were selected by analyzing their functional use, main characteristics and temporal use, as shown in
Table 1.
3.2.1. Wood Charcoal
Wood charcoal is a secondary product of the wood used for fuel, and thus a renewable resource. The three factors that determine the yield of charcoal are: wood density, wood moisture, and charcoal production means [
31,
32]. The characteristic considered for analysis is the calorific value measured in kcal/kg, which according to ANEEL [
33] is the heat production capacity, which determines the quality of the charcoal. The amount of carbon enhances the calorific value, while the amount of impurities diminishes it. Charcoal presents a high amount of impurities, but in coal, the amount of impurities is variable, and it is classified into two categories (high-quality coal-bituminous and anthracite and low-quality coal-lignite and sub-bituminous) [
33]. A potential substitute for charcoal is coal which, despite being a non-renewable fossil resource, is responsible for supplying a third of all the energy used in the world, accounting for 40% of electricity generation; it also has great importance in the steel industry [
32]. Mineral coal is a non-renewable primary product and has an energy value of at least 24 MJ/kg (5732.30 kcal/kg), with no ash content on wet base [
32].
3.2.2. Firewood
Firewood is one of the main primary products of wood and accounts for more than 50% of wood utilization in power generation [
13,
34]. The properties of firewood, as well as of charcoal, rely on the species and the moisture content, and for this reason, we will use average data for comparisons. Pellets and briquettes can be considered as reasonable substitutes, but their production is still recent and very small. The FaoStat database contains production and market results only from 2012 [
13]. The wood pellet is a relatively new energy resource in the world, but in the last 10 years its production increased substantially [
24]. Pellets are usually produced from wood shavings, sawdust, wood chips that may be residues from industrial processes, and other ground woody materials [
24,
35]. They should have moisture, energy density, abrasion resistance, particle size and shape, according the international standards [
24].
3.2.3. Sawnwood
Sawnwood is classified according to its dimensions and its applications, being used to produce planks, boards, slats and other products. A property of great importance in the processing of wood is moisture; the wood needs to go through a natural or greenhouse drying process to guarantee quality and prevent undesirable defects [
36]. Density is one of the main properties of wood to determine its quality, and it can be correlated with other properties depending on the use [
37]. Wood-based panels were developed with the aim of improving some problems presented by solid wood due to their heterogeneity, and because they can be applied in a similar way, reducing resource waste. Wood-based panels have uniform properties, maintaining a controlled density (low, medium or high) [
36,
38].
3.2.4. Wood-Based Panels
Wood-based panels are common substitutes for sawnwood, so it is difficult to identify a substitute in this case. It is possible to do so, nevertheless, even if tentatively, since the residues can be used in the production of fiber and particle panels [
34]. The quality of the particles obtained from residues is inferior, however, but if a larger amount of adhesive is used and the density is increased, panels of an acceptable quality can be obtained (in the case of using shaving residues) [
39].
3.2.5. Wood Pulp
The use of wood for paper production began around 1840, and before then, other types of vegetable fibers were already in use for this purpose [
40]. Cellulose is obtained from any fibrous material, although economic aspects must be taken into account [
41]. The most important physical property relevant to paper production is basic density [
41]. Also important are details about fiber dimensions: fiber length, fiber width, lumen diameter and cell wall thickness. The length of the fiber directly influences the strength of the paper. The longer it is, the more resistant it will be. Fiber length also influences the absorption capacity, a characteristic that can be obtained by the use of short fiber [
30]. Considering that in pulp production it is necessary to use fibrous materials, we selected raw materials currently in use for pulp and paper production, like other types of vegetable fibers.
3.3. Data Analysis
After identifying the wood substitute for each of the functions, we analyzed the data for calculating the SI. We checked the availability of recent data (stock, reserves, production, volume and cost of importing and recycling) for as many countries as possible to achieve the best results with our method.
Since the purpose of this study is to calculate a SI for specific wood functions for as many countries as possible, we sought to use international databases that have information for different regions of the world. The databases used are listed in
Table 2. There is not, however, data available for all countries, which significantly reduces the results.
The number of countries included in the study depends on the number of countries with commercial growing stock data available because this data is fundamental for applying the method. Even so, it was not possible to achieve results for all countries, since the data for the other variables were not 100% available.
We then applied the method for calculating SI to 112 countries and 7 regions (58% of the total number of countries according to the United Nations), which corresponds 71% of the global GDP. The available data was used directly, noting that no calculations or adaptations were made to complement the missing data. The only exception was that to account for the missing data for the regions, we used the average among the countries of the region, in monetary values, and the sum of the data for the countries of the region, in the case of quantitative data for variables such as production, stock, reserves, and import volume.
Data quality assessment is shown in
Table 3.
After checking the results, we can affirm that the data used for the application of the method is not high quality, mainly because it does not cover all the countries as expected. The item completeness was the only one that varied between the functions, because the volume of available data, especially for the substitutes, varies between them. Results for firewood and wood pulp were restricted to a much smaller number of countries compared to the other functions. As for temporal correlation, the evaluation was average in all cases, since all the data was less than 10 years old.
The base year used for data collection was 2010. It was not possible to use the latest data because this is the last year that has available data for commercial Growing tock, that is, the amount of forest that can be exploited for commercial purposes. Considering that the commercial growing Stock data is crucial for calculating the availability of the wood functions, all other data was obtained with the year 2010 as a reference. Despite this, in general, the data is of reasonable quality because it is from reliable and suitable sources for each country.
3.4. Methodologies Evaluation
The methodologies evaluation shows their potential for adaptation in the case of wood resources.
Scope criterion. The methodology of Graedel et al. [
11] differs in its application at the three levels assessed (global, national, and corporate). The studies carried out by the EC [
15] and De Bruille et al. [
6] are assessments at the global level. As for the methodology of elasticity of substitution [
14], it does not have a definite scope, since it applies to various situations.
Resources considered criterion. The methodology of Graedel et al. [
11] focuses on metals. The EC report [
15] is an assessment of various biotic and abiotic resources. De Bruille et al. [
6] present a study focused on metals and minerals. Further, the methodology of elasticity of substitution [
14] is more general in its application. At first, all methodologies have the potential for application to wood.
Main result criterion. Graedel et al. [
11] carry out an assessment of criticality, which presents an indicator of substitutability. The EC report [
15] is also an assessment of criticality, which presents substitution indexes. De Bruille et al. [
6] present a quantitative study, which identifies a competition index based on substitutability. As for the elasticity of substitution methodology [
14], it was developed to determine substitution indexes.
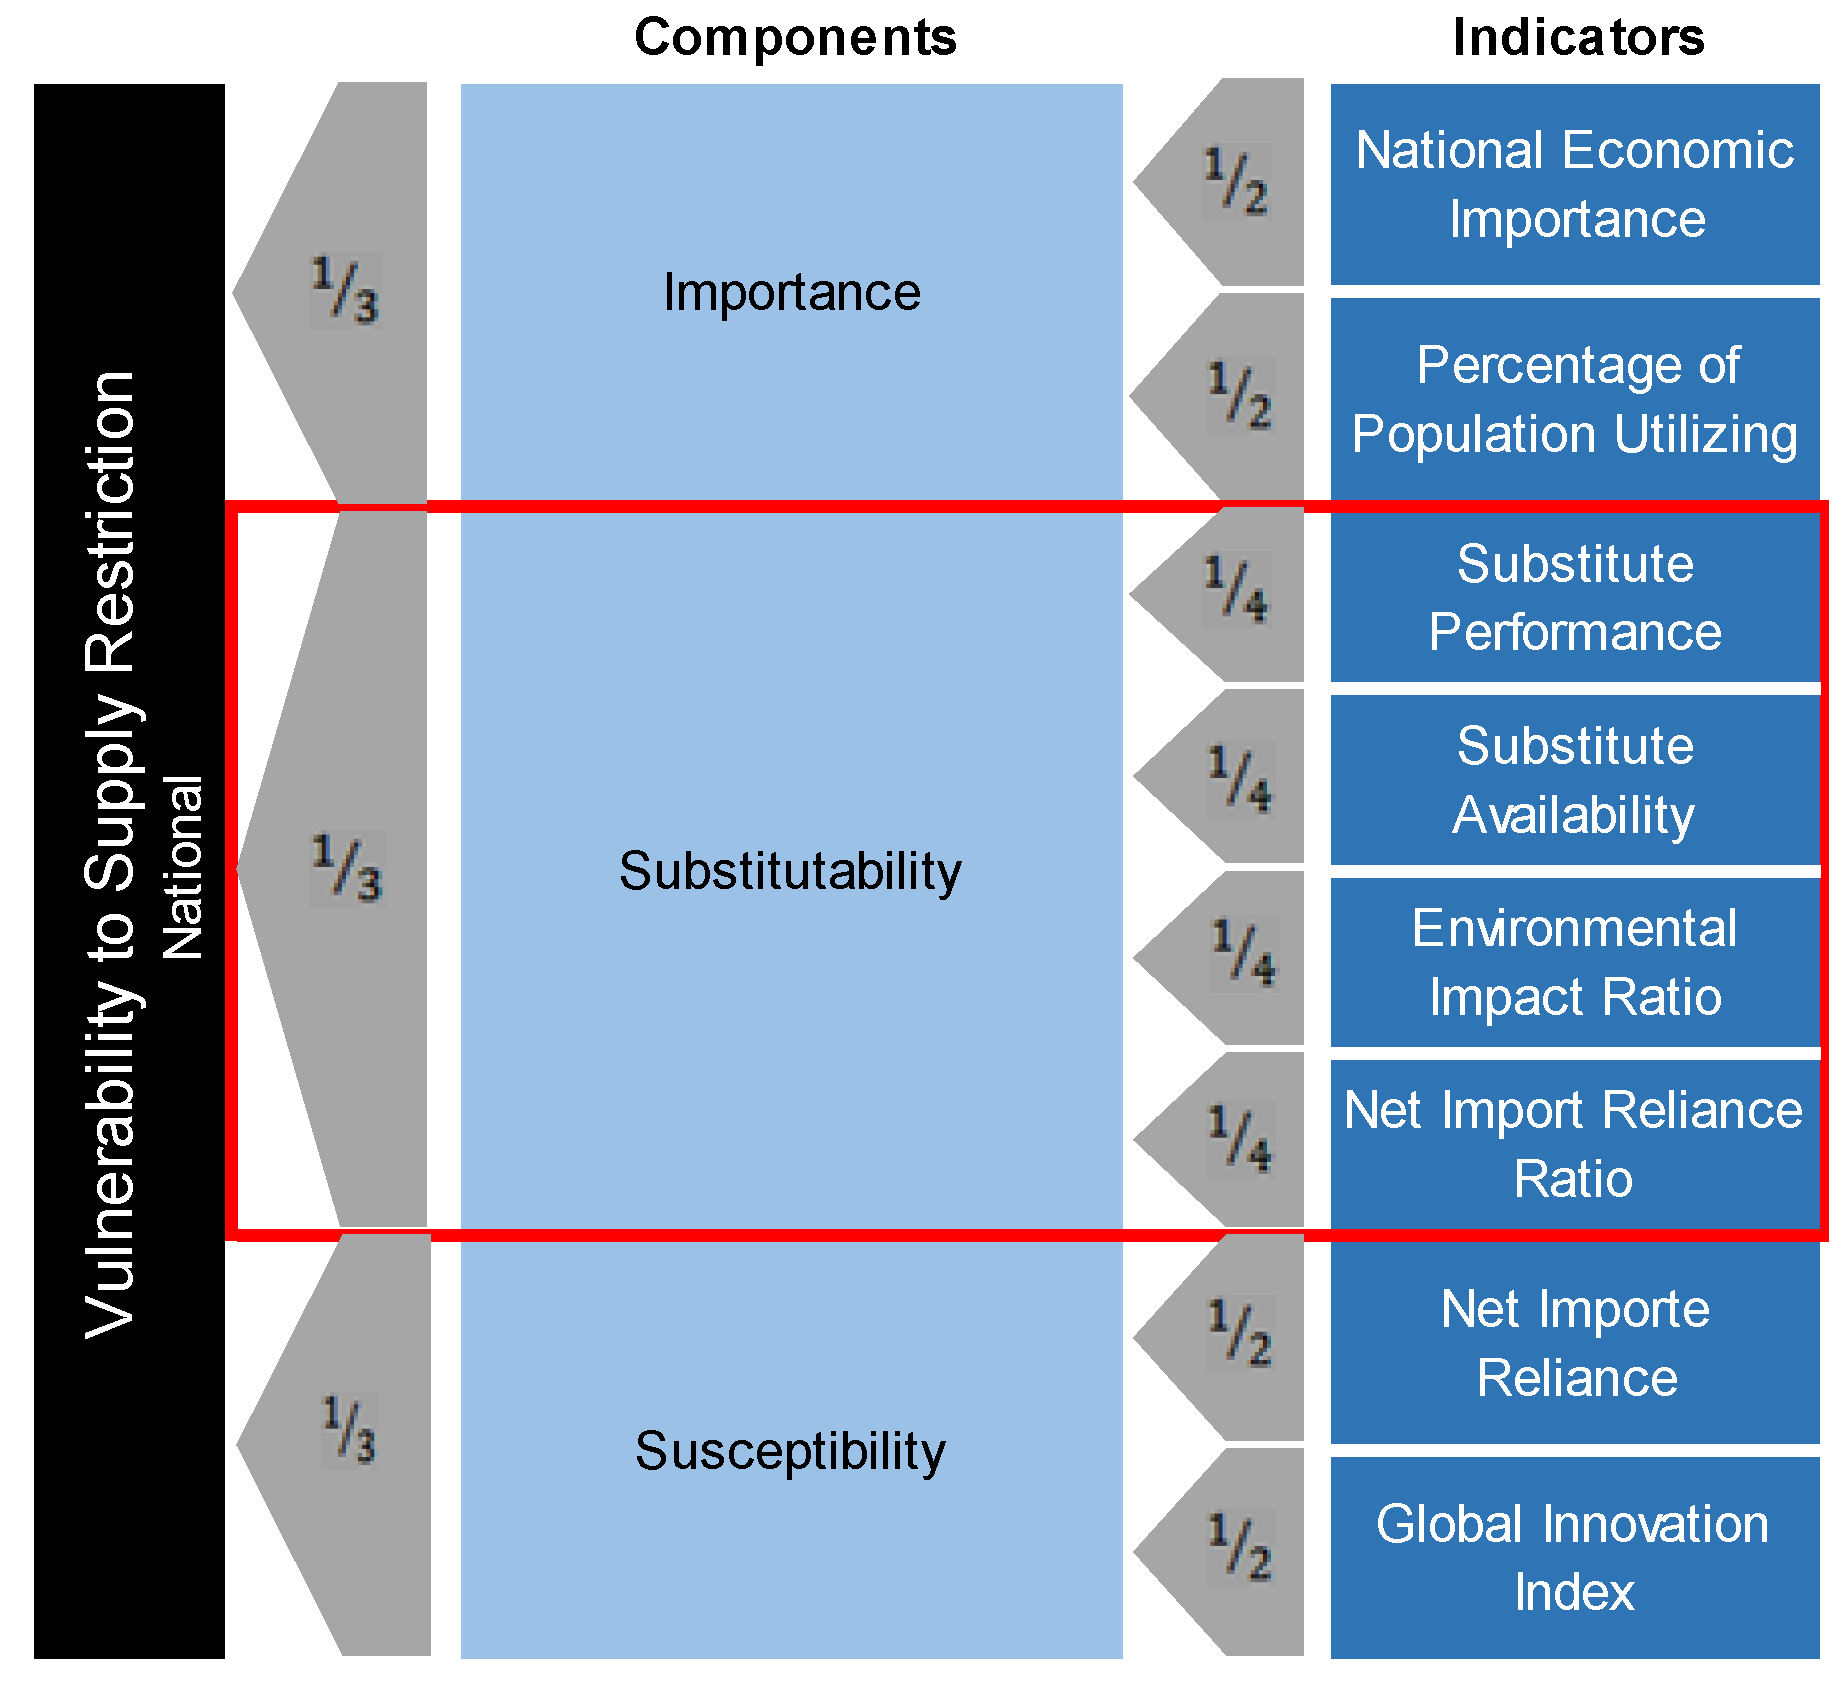
Clarity and complexity criteria. The methodology of Graedel et al. [
11] is semi-quantitative and of medium complexity, using various components and indicators, as shown in
Figure 3, among which the substitutability indicator is easy to understand because it is explained in detail. The EC report [
15] is semi-quantitative and uses several indicators (economic relevance, supply risk, substitutability, recycling rate, etc.); it is of medium complexity and easy to understand, but the substitutability indicator is determined by experts and looks rather subjective. De Bruille et al. [
6] present a quantitative study that uses indexes that were already determined by the EC report [
15]. Specialists have determined its substitution indexes, and the study has reasonable complexity and clarity, but does not specify how the time of adaptation variable was determined. The methodology of elasticity of substitution [
14] is well formulated and clear; it is, however, of high complexity because it demands a high volume of data to work.
Ease of replication criterion. The methodology of Graedel et al. [
11] is explained in detail and thus is easily replicated. The EC report [
15] presents a substitutability indicator determined by experts, making it difficult to replicate. Similarly, De Bruille et al. [
6] use indexes obtained in the EC report [
15] and, for that, this study is also difficult to replicate. Finally, the methodology of elasticity of substitution [
14] is easy to replicate, if the data necessary is available.
Table 4 presents the results of this evaluation.
In the case of the development of the wood substitution index, the methodology with the greatest potential for adaptation was found in Graedel et al. [
11], which uses the criteria of performance analysis, availability, and the cost of a substitute.
3.5. Adaptation of the Criticality Substitution Index to the Case of Wood Resources in an LCIA Context
The methodology of Graedel et al. [
11] classifies the degree of criticality in three levels.
Figure 3 presents a graph of this assessment at the national level. In this study, we have only used the component of substitutability for adaptation purposes, as pointed out.
The indicators that determine the substitution possibility of the material are: performance of the substitute; availability of the substitute; environmental impact rate; and net import dependency ratio–all of them at the national level. At the global level, the indicator related to net import is not used, and at the corporate level, this same indicator is replaced by the price ratio [
11].
We adapted the substitutability using three of the four indicators presented in
Figure 3.
The environmental impact ratio indicator was not considered, since this SI is developed with the purpose of being used within a life cycle assessment framework which already quantifies all the other environmental impacts related to the resource extraction: it would lead to double counting of those environmental impacts.
We used the import price ratio indicator instead of the net import reliance ratio. We considered that the substitution of a resource is only viable if the cost of the substitute does not preclude its utilization, considering a constant cost for a given year.
The indicator for substitute availability was added with the resource availability indicator to generate a ratio because if the substitute is less available than the original resource, its potential for substitution is diminished.
We utilized the substitute performance indicator only when selecting the substitute, as explained in
Section 2.2; it was not used to determine the SI.
Therefore, in order to determine the SI for wood, two indicators were combined: (i) availability ratio; and (ii) import price ratio.
3.5.1. Availability Ratio
Graedel et al. [
11] calculate the availability of the resource for two-time scales, short and long-term. They assess the corporate level in the short-term and national and global levels in the long term. This study uses the methodology for the long term because it does not intend to assess the specifics of corporate and business levels. For the long-term scale, Graedel et al. [
11] utilize a geological, technological and economic component composed of two indicators: depletion time and companion metal fraction.
The calculation of the companion metal fraction depends on the mineral in question containing other metals besides the main one. In the case of wood, this indicator is not consistent, because there are no other materials contained in wood resources, thus it will not be part of the calculations in this study.
In order to calculate depletion time, Graedel et al. [
11] considered variables such as: ore production; estimated future demand; loss of tailings, slag, and other processes; aggregates of secondary resources (scrap); end-of-life recycling rate; and dissipation for some metals.
In this sense, De Bruille et al. [
6] have, in their study, calculated the availability time of mineral and metallic resources. For this purpose, they present the determination of a static depletion index (sDI) that establishes the number of years in which the resource is available before its total depletion. In order to predict the availability of a resource, calculating the reserves to production ratio (R/P) is a valid approach [
45] because the period of time that a reserve can last is analogous to the ratio of the remaining reserves at the end of a year to the global production in that same year (if production remains stable) [
46].
Considering both studies in tandem, it seems reasonable to determine the availability through the R/P ratio. In the case of substitutes that can be recycled, it is important to add this variable, according to De Bruille et al. [
6], decreasing recycling in production.
In view of these definitions, we can observe that the R/P ratio for fossil resources uses potentially economic reserves. In the same way, we have used as wood data the wood that can be legally extracted, that is, the commercial growing stock.
As for the functions of wood and wood-derived substitutes, it is necessary to calculate the fraction of roundwood utilization that is needed for the production of this function (for instance, how much roundwood is necessary to produce 1 m³ of sawnwood). We have used, when necessary, conversion factors to determine the value of equivalent roundwood. These conversion factors are available in
Appendix A.
It should be noted that determining the availability of a resource depends on a dynamic assessment that considers all the possibilities of obtaining the resource, as Graedel et al. [
11] have attempted to estimate. In this study, we have no intention to quantify the total amount of time that the resource is available until its depletion but aim to determine how the availability of the resource compares to the availability of the potential substitute in a given year.
This study considers the availability statically, that is, considers the variables utilized to be constant through the years. Therefore, calculating for a given year does not imply establishing a trend for subsequent years.
The availability of wood and the availability of the substitute, if the latter is of forestal origin, are calculated according to Equation (1)
where:
A = availability;
wf = wood function; CGS = commercial growing stock;
uf = use fraction;
PO = production; and
RC = recycling.
If the substitute is a fossil resource, the availability is determined by Equation (2)
where:
A = availability;
s = substitute;
RS = reserve;
PO = production; and
RC = recycling.
In the case of substitutes that are by products and/or that not have a natural stock, availability is given by Equation (3)
where:
A = availability;
s = substitute;
PO = production;
IMQ = import quantity; and
RC = recycling.
Thus, we have utilized one of these three equations according to the substitute’s origin.
The data for both the availability of the wood utilized for a specific function and the availability of the substitute is for years in which the resource was available, considering a constant rate of production and no increase in reserves or stock. Equation (4) gives the availability ratio
where: ϕ
A = availability ratio;
A = availability;
s = substitute;
wf = wood function.
3.5.2. Import Price Ratio
Graedel et al. [
11] modify the import indicators as follows: at the national level, they use the net import reliance ratio (NIR), which is determined by import (IM), export (EX), apparent consumption (AC), and industrial and government adjustments related to stock changes (ASC); at the corporate level, they use the price ratio (PR) to measure the economic impact from the substitution, assessing the proportion of the substitute’s price (Ps) to the metal price (Pm) that will be replaced.
As we explained before in the case of the wood, we replaced the indicator for the national level (NIR) with the indicator for the corporate level (PR), since the variables corresponding to import, export and consumption are considered in the assessment of the availability of the resources. We highlight the importance of using an indicator that estimates the import price in order to maintain the economic impact of the substitution. This adaptation is related to the import price because if a resource or its substitute are lacking in one country it must be bought from other countries.
Equations (5) and (6) give the import price, and Equation (7) gives the import price ratio
where: ϕ
IMP = import price ratio;
IMP = import price;
IMV = import value;
IMQ = import quantity;
s = substitute;
wf = wood function.
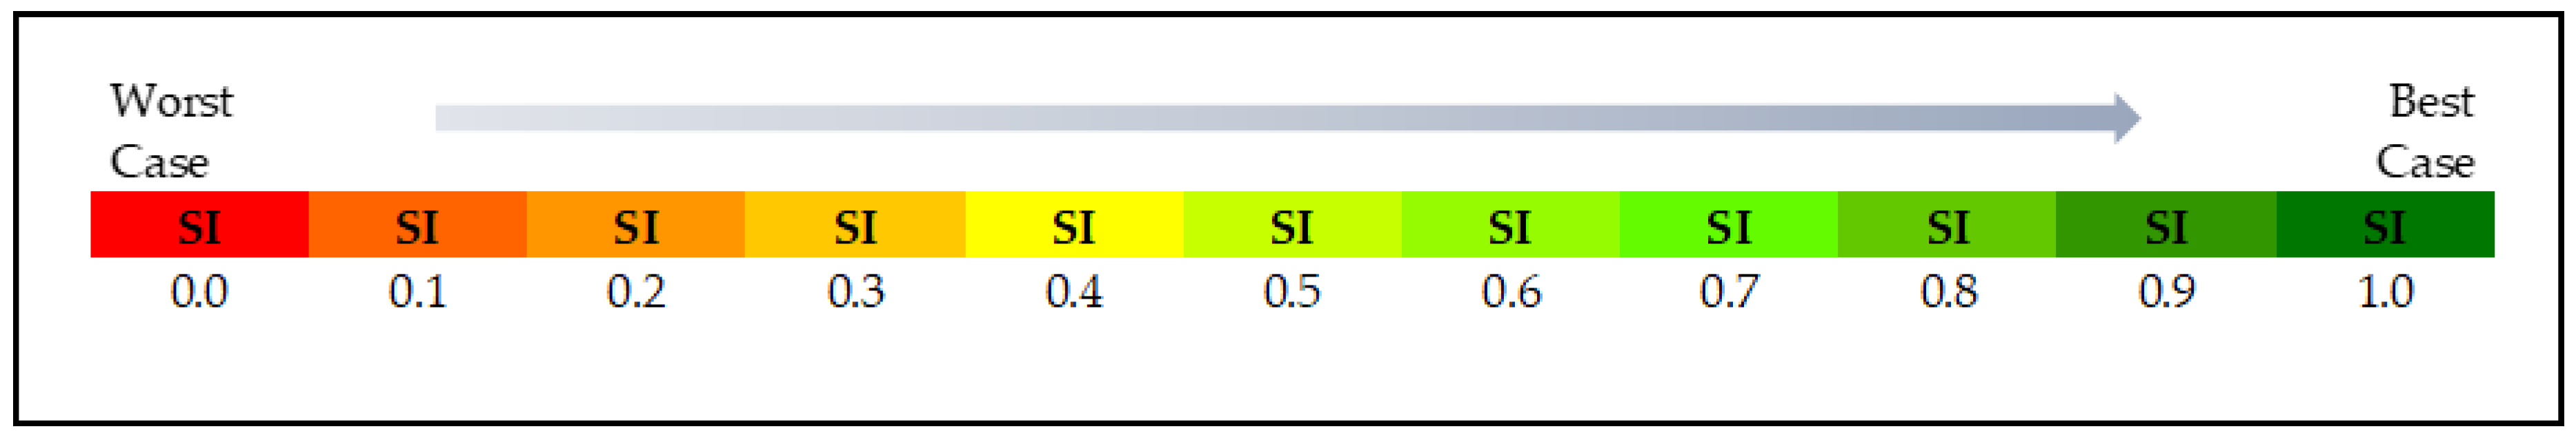
3.5.3. Substitution Index
The SI, obtained from Equation (8), is an index that measures the ease of substitution of a resource for another. In this case, the values are calculated on a scale of 0 to 1: 0 indicating that there is no possible substitution and 1 indicating that the resource can be perfectly substituted. Considering the indicators of availability and price, the higher the availability and the lower the price of the substitute compared to the original resource’s price, the higher the SI will be. The higher the SI, the higher is the possibility of substituting wood for another resource, as shown in
Figure 4.
Since the indicators (ϕA—availability ratio and ϕIMP—import price ratio) used to calculate wood SI have distinct metrics, it was necessary to adjust the scales for the interval (0 to1) by means of a linear normalization. This normalization is given by Equation (8)
where:
f(
x) = normalized data;
x = value of the original data; and the indexes
min. and
max. are the minimum and maximum values, respectively, of the data for each indicator.
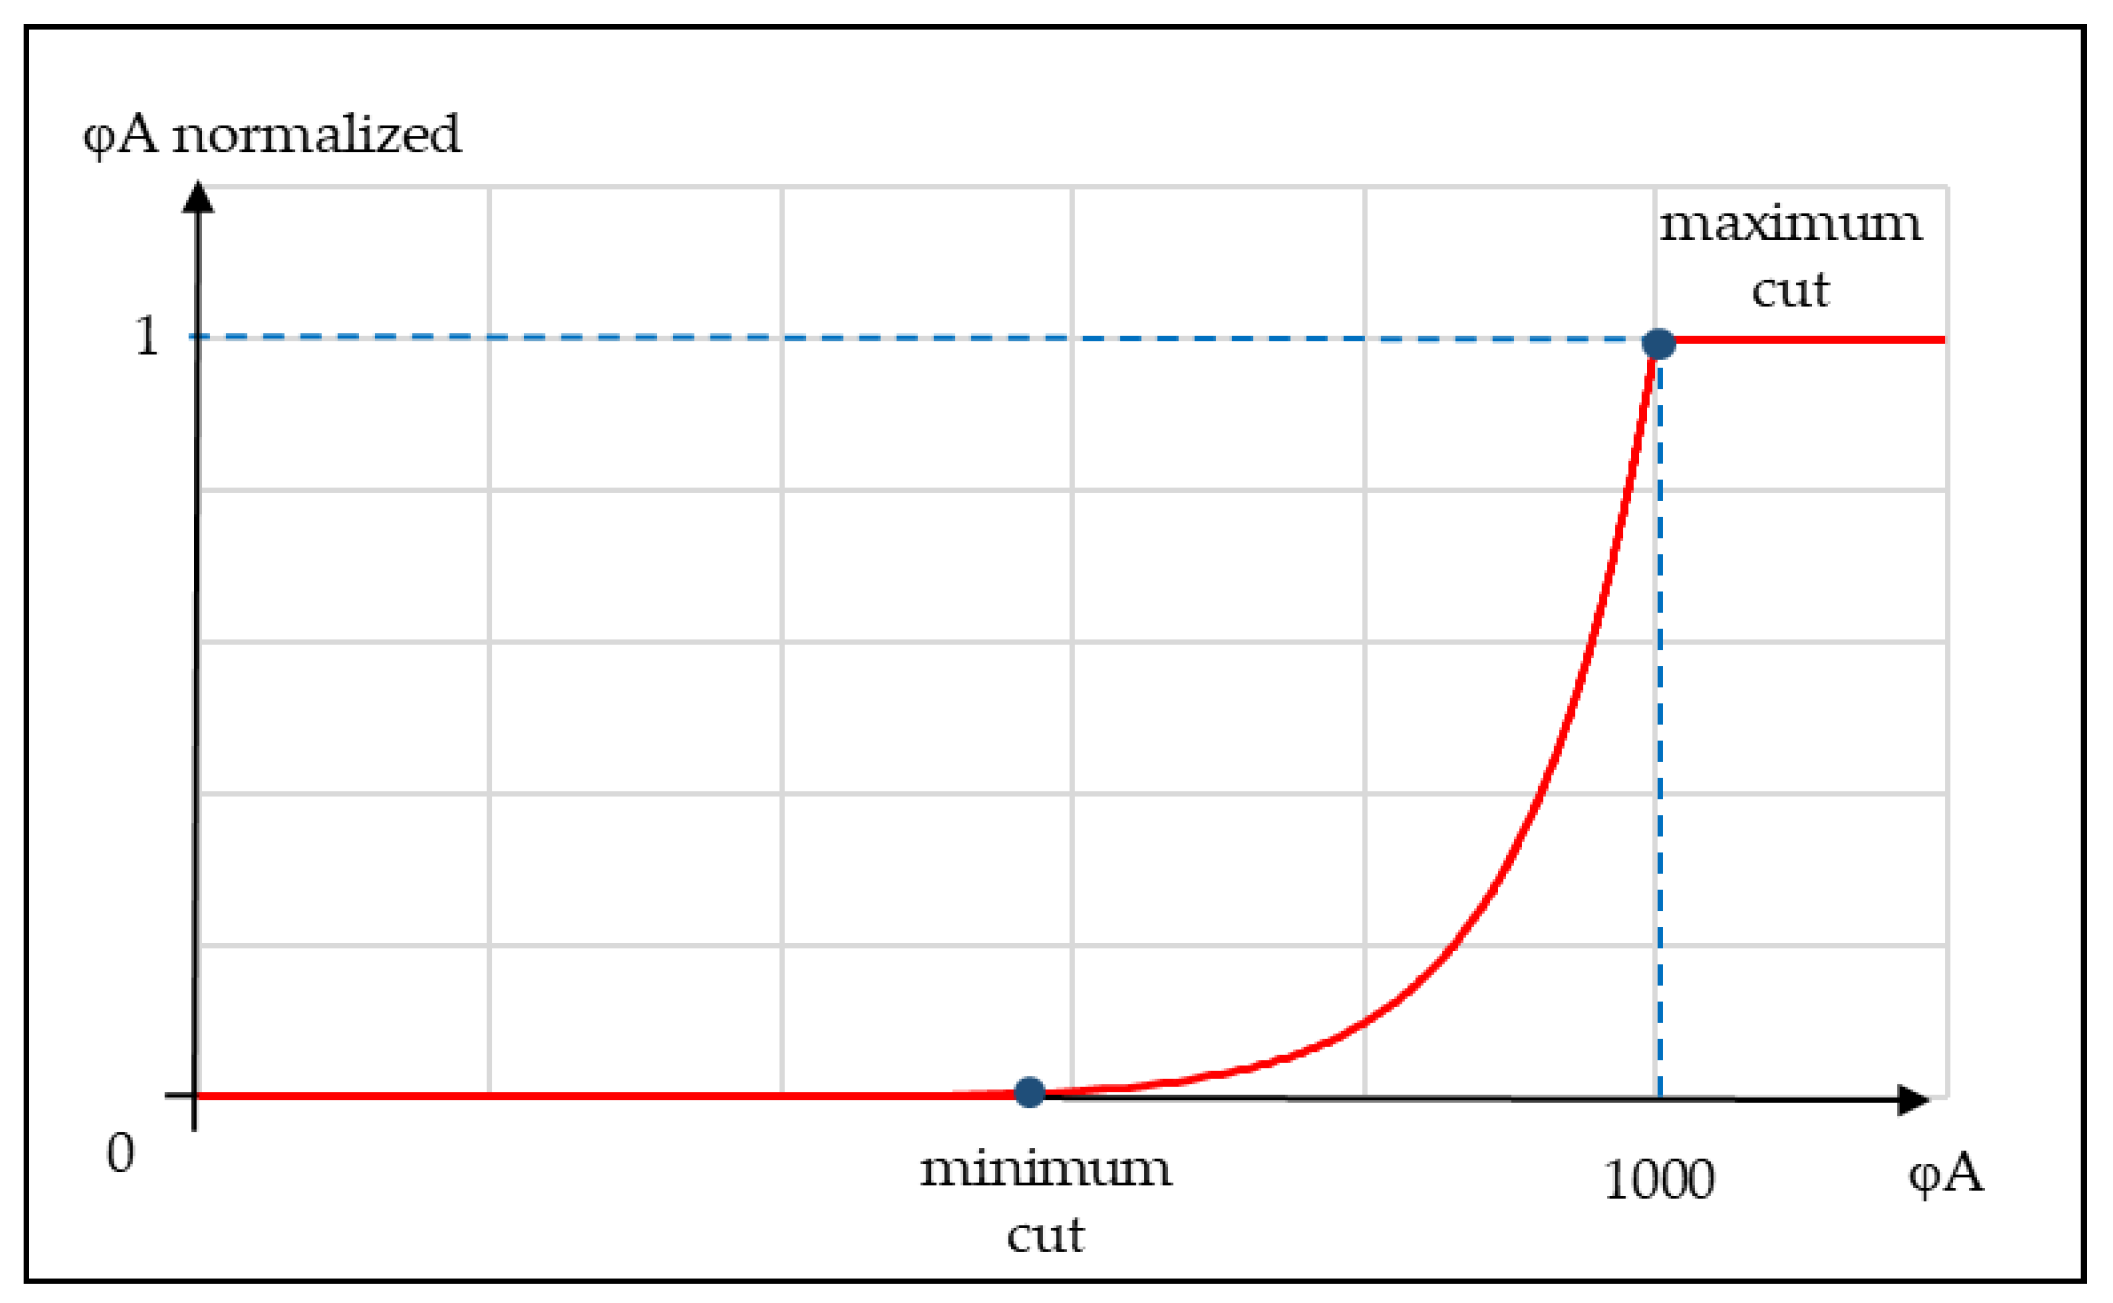
Some values, however, may distort the result because they may be too far out of the interval; in other words, if the availability ratio or the import price ratio is too high or too low, it will lower the discriminating power of the indicator. For this reason, we have done an adjustment by establishing a cut-off line for each particular case, in which, from a maximum point and a minimum point, the availability ratio and the import price ratio are considered equal (maximum = 1, minimum = 0).
We established this cut-off line in a similar way to the method for assessing water scarcity—Available Water Remaining (AWARE), changing only the levels for the cut-off because in our method it is not possible to use the levels of 0.1 and 100 established in AWARE [
47]. The difficulty lies in the values obtained for each indicator having too much variation. We assigned a distinct value for each case.
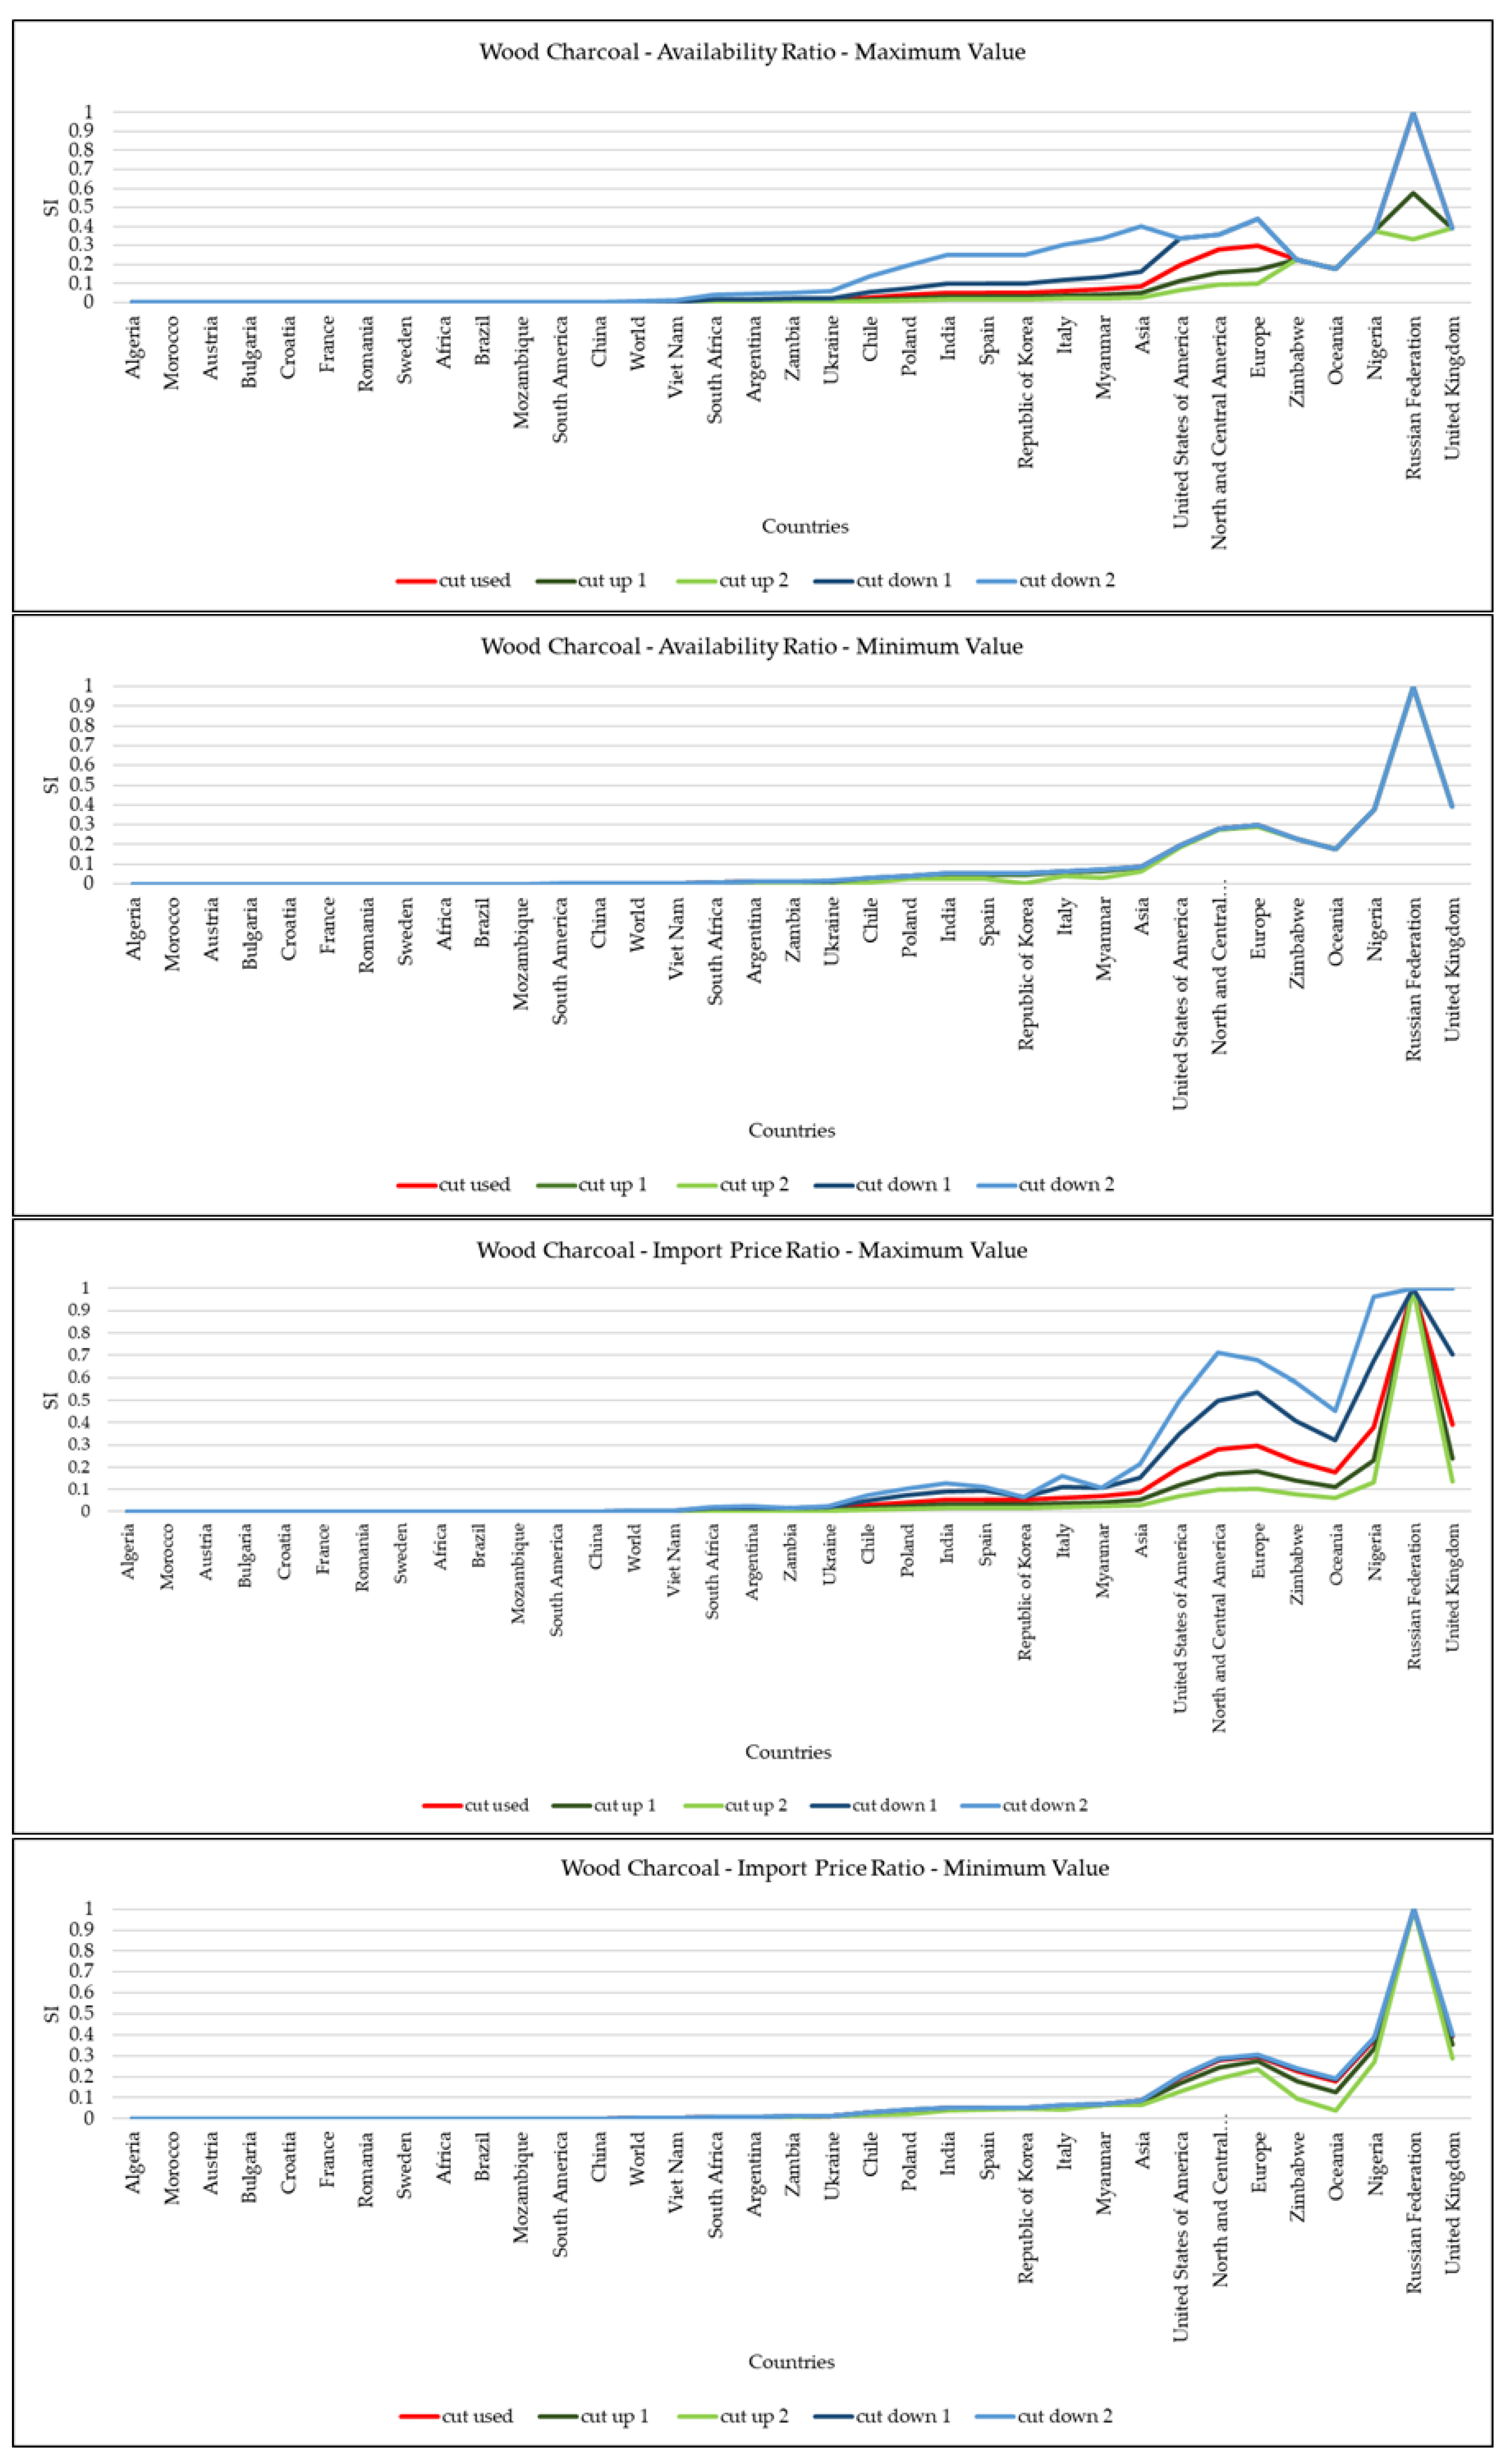
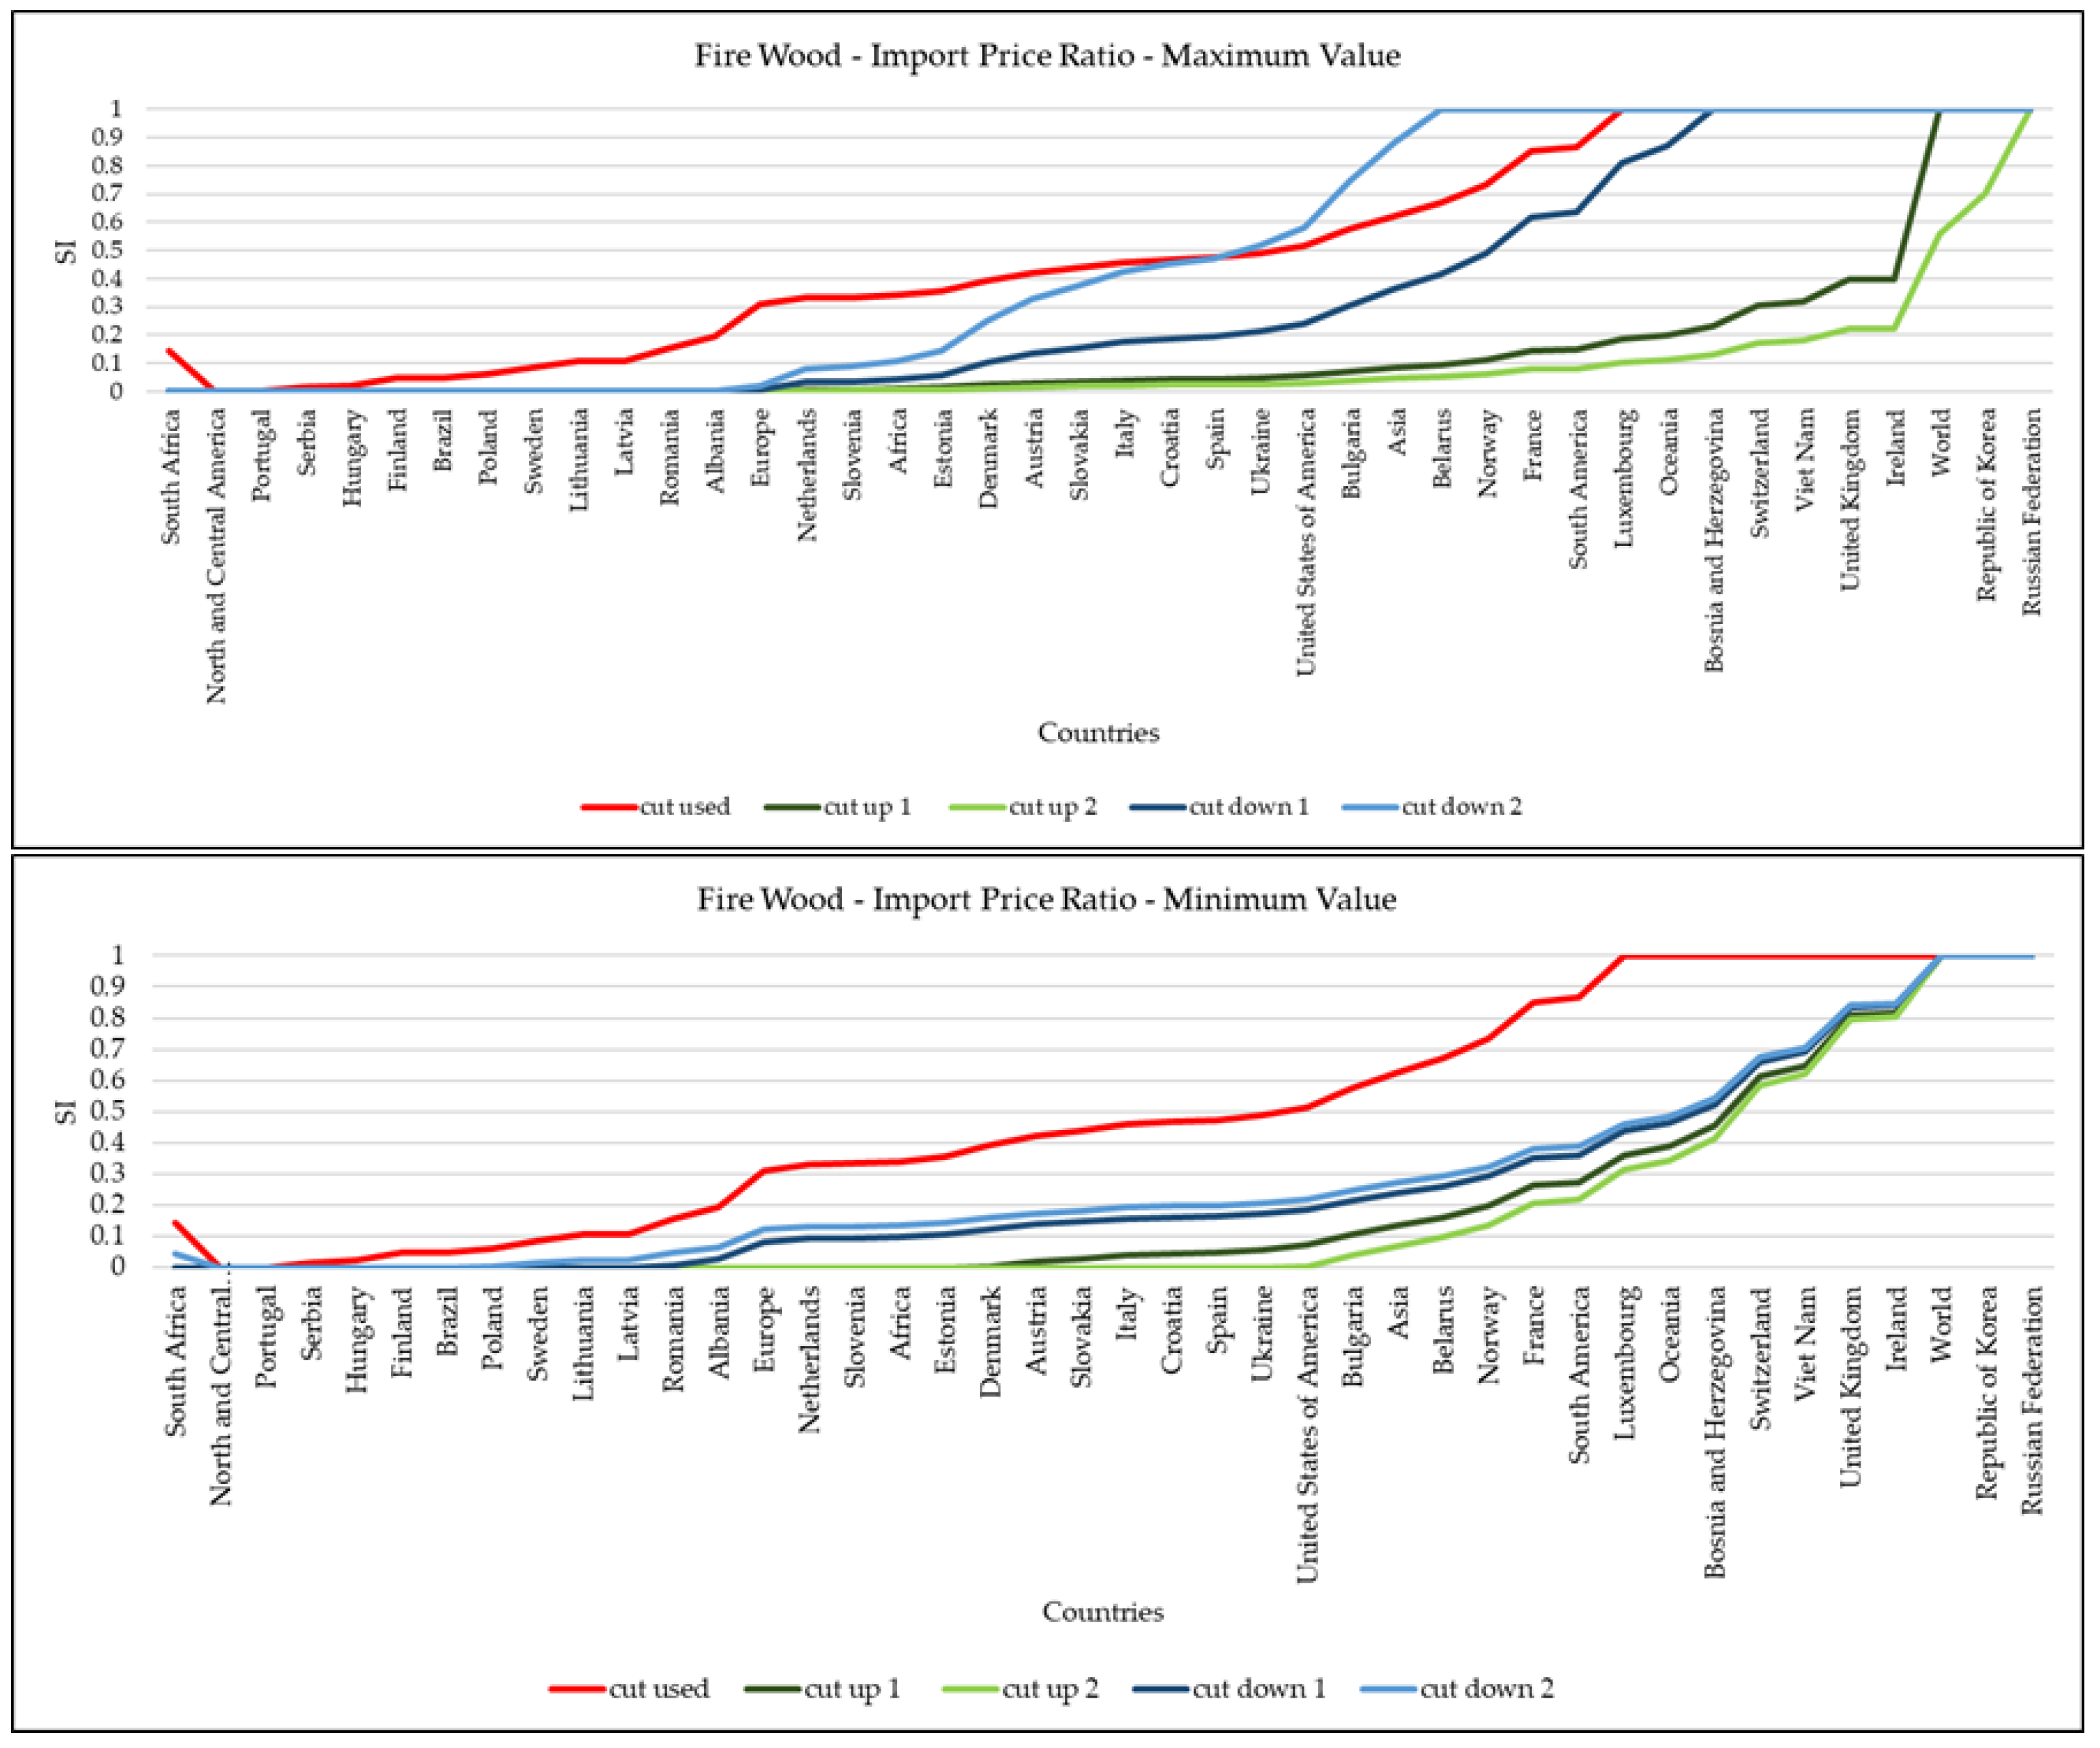
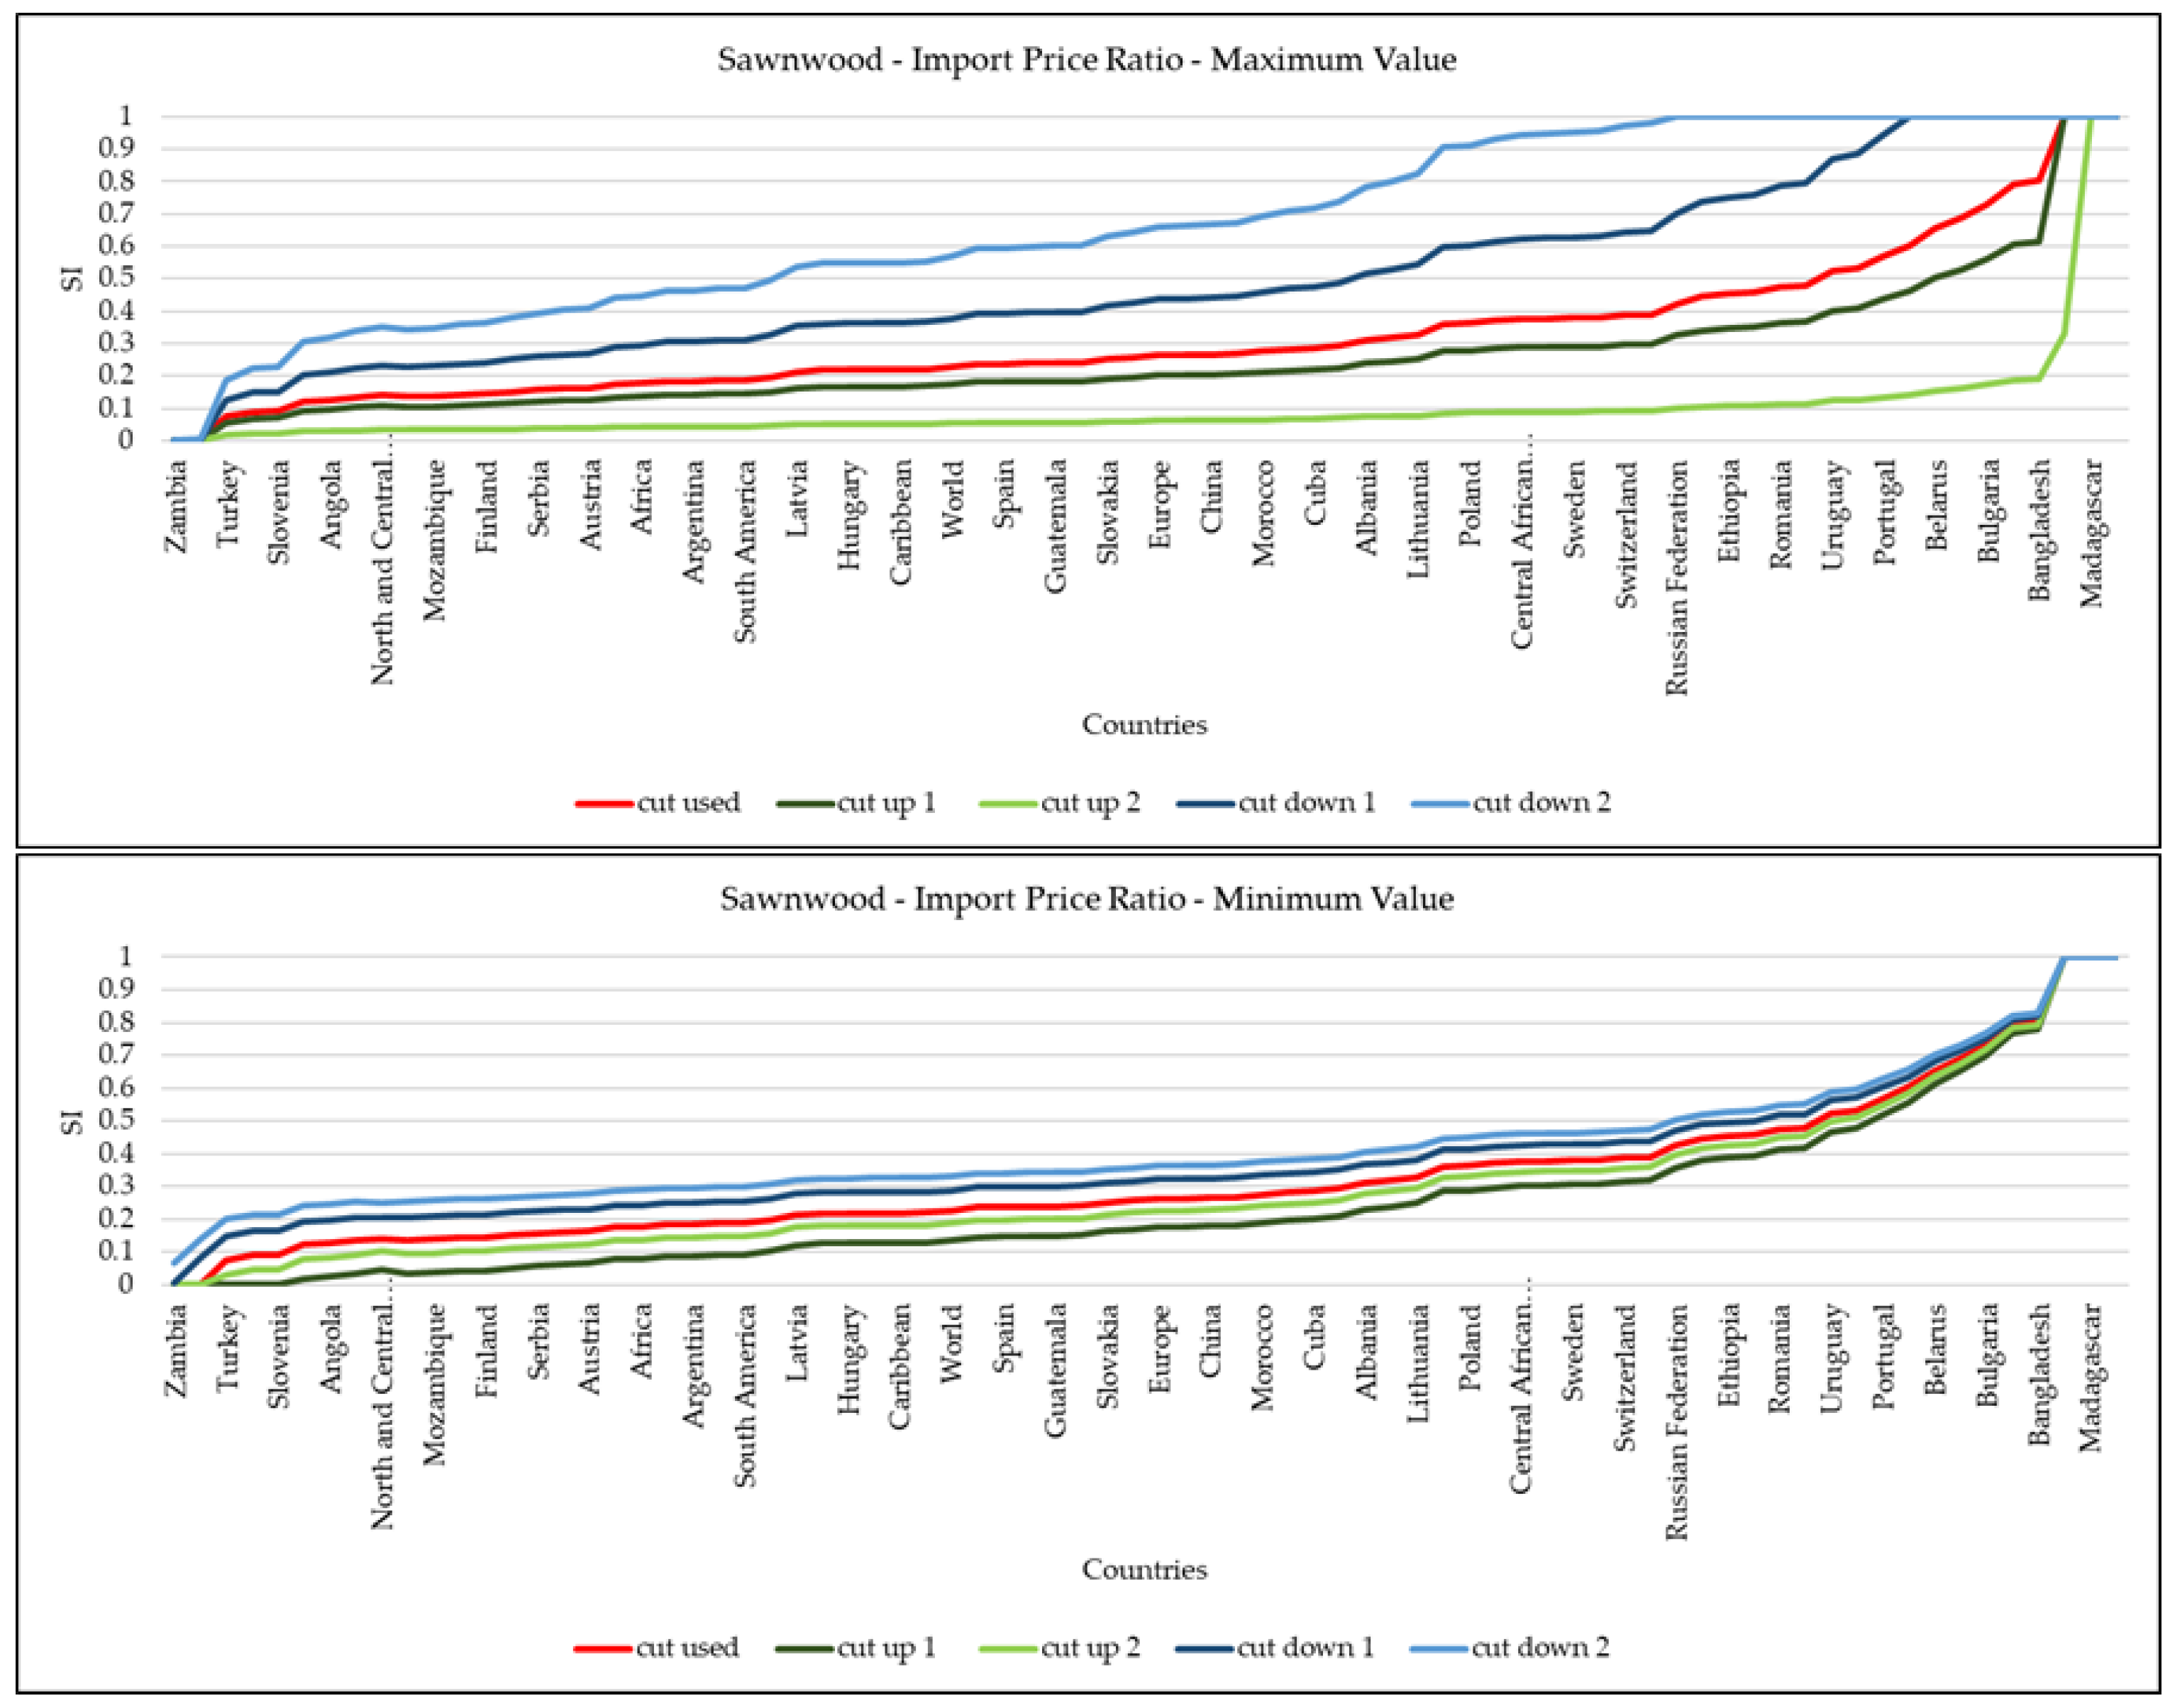
Figure 5 shows schematically how we applied the cut-off lines for all functions regarding both indicators.
Aiming to assess if the cut-off lines have significantly altered the results, we applied a sensitivity analysis, varying the values of the points of cut-off. We applied the sensitivity analysis randomly to all functions. That is, we did not establish a pattern for the maximum and minimum values from the cut-off line used, but changed the cut-off point to higher and lower values. Specifically, we changed each cut-off point (maximum and minimum) twice in each direction. These new cut-off points were also obtained randomly, just to ascertain if there would be great variations in the results.
We applied the normalized and adjusted data to Equation (9) in order to determine the SI. The equation calculates the SI by multiplying both indicators and is a contribution to the method in which we have based ours [
11], which uses the average of the indicators. It is also a means to test a new alternative, since there is no clear physical relationship between the SI and its indicators. By using the multiplication, we ensure that if the availability ratio is zero, there is no substitutability possible, just as if the import price ratio is zero there will also be no substitutability
where:
SI = substitution index; ϕ
A = availability ratio; and ϕ
IMP = import price ratio.
Just like in Graedel et al. [
11], our study also weighed each of them equally. In this way, we assume that the implications for each indicator are similar in determining the substitutability of the functions of wood. These weights can be altered in future studies if the difference in the influence of these indicators on the
SI is proven. When the result for one indicator is equal to 0,
SI also will be 0; that is, if the resource is not available or if the import price is too high, there will be no substitution, and that is a plausible result.
The equations used to calculate the
SI are summarized in
Table 5.
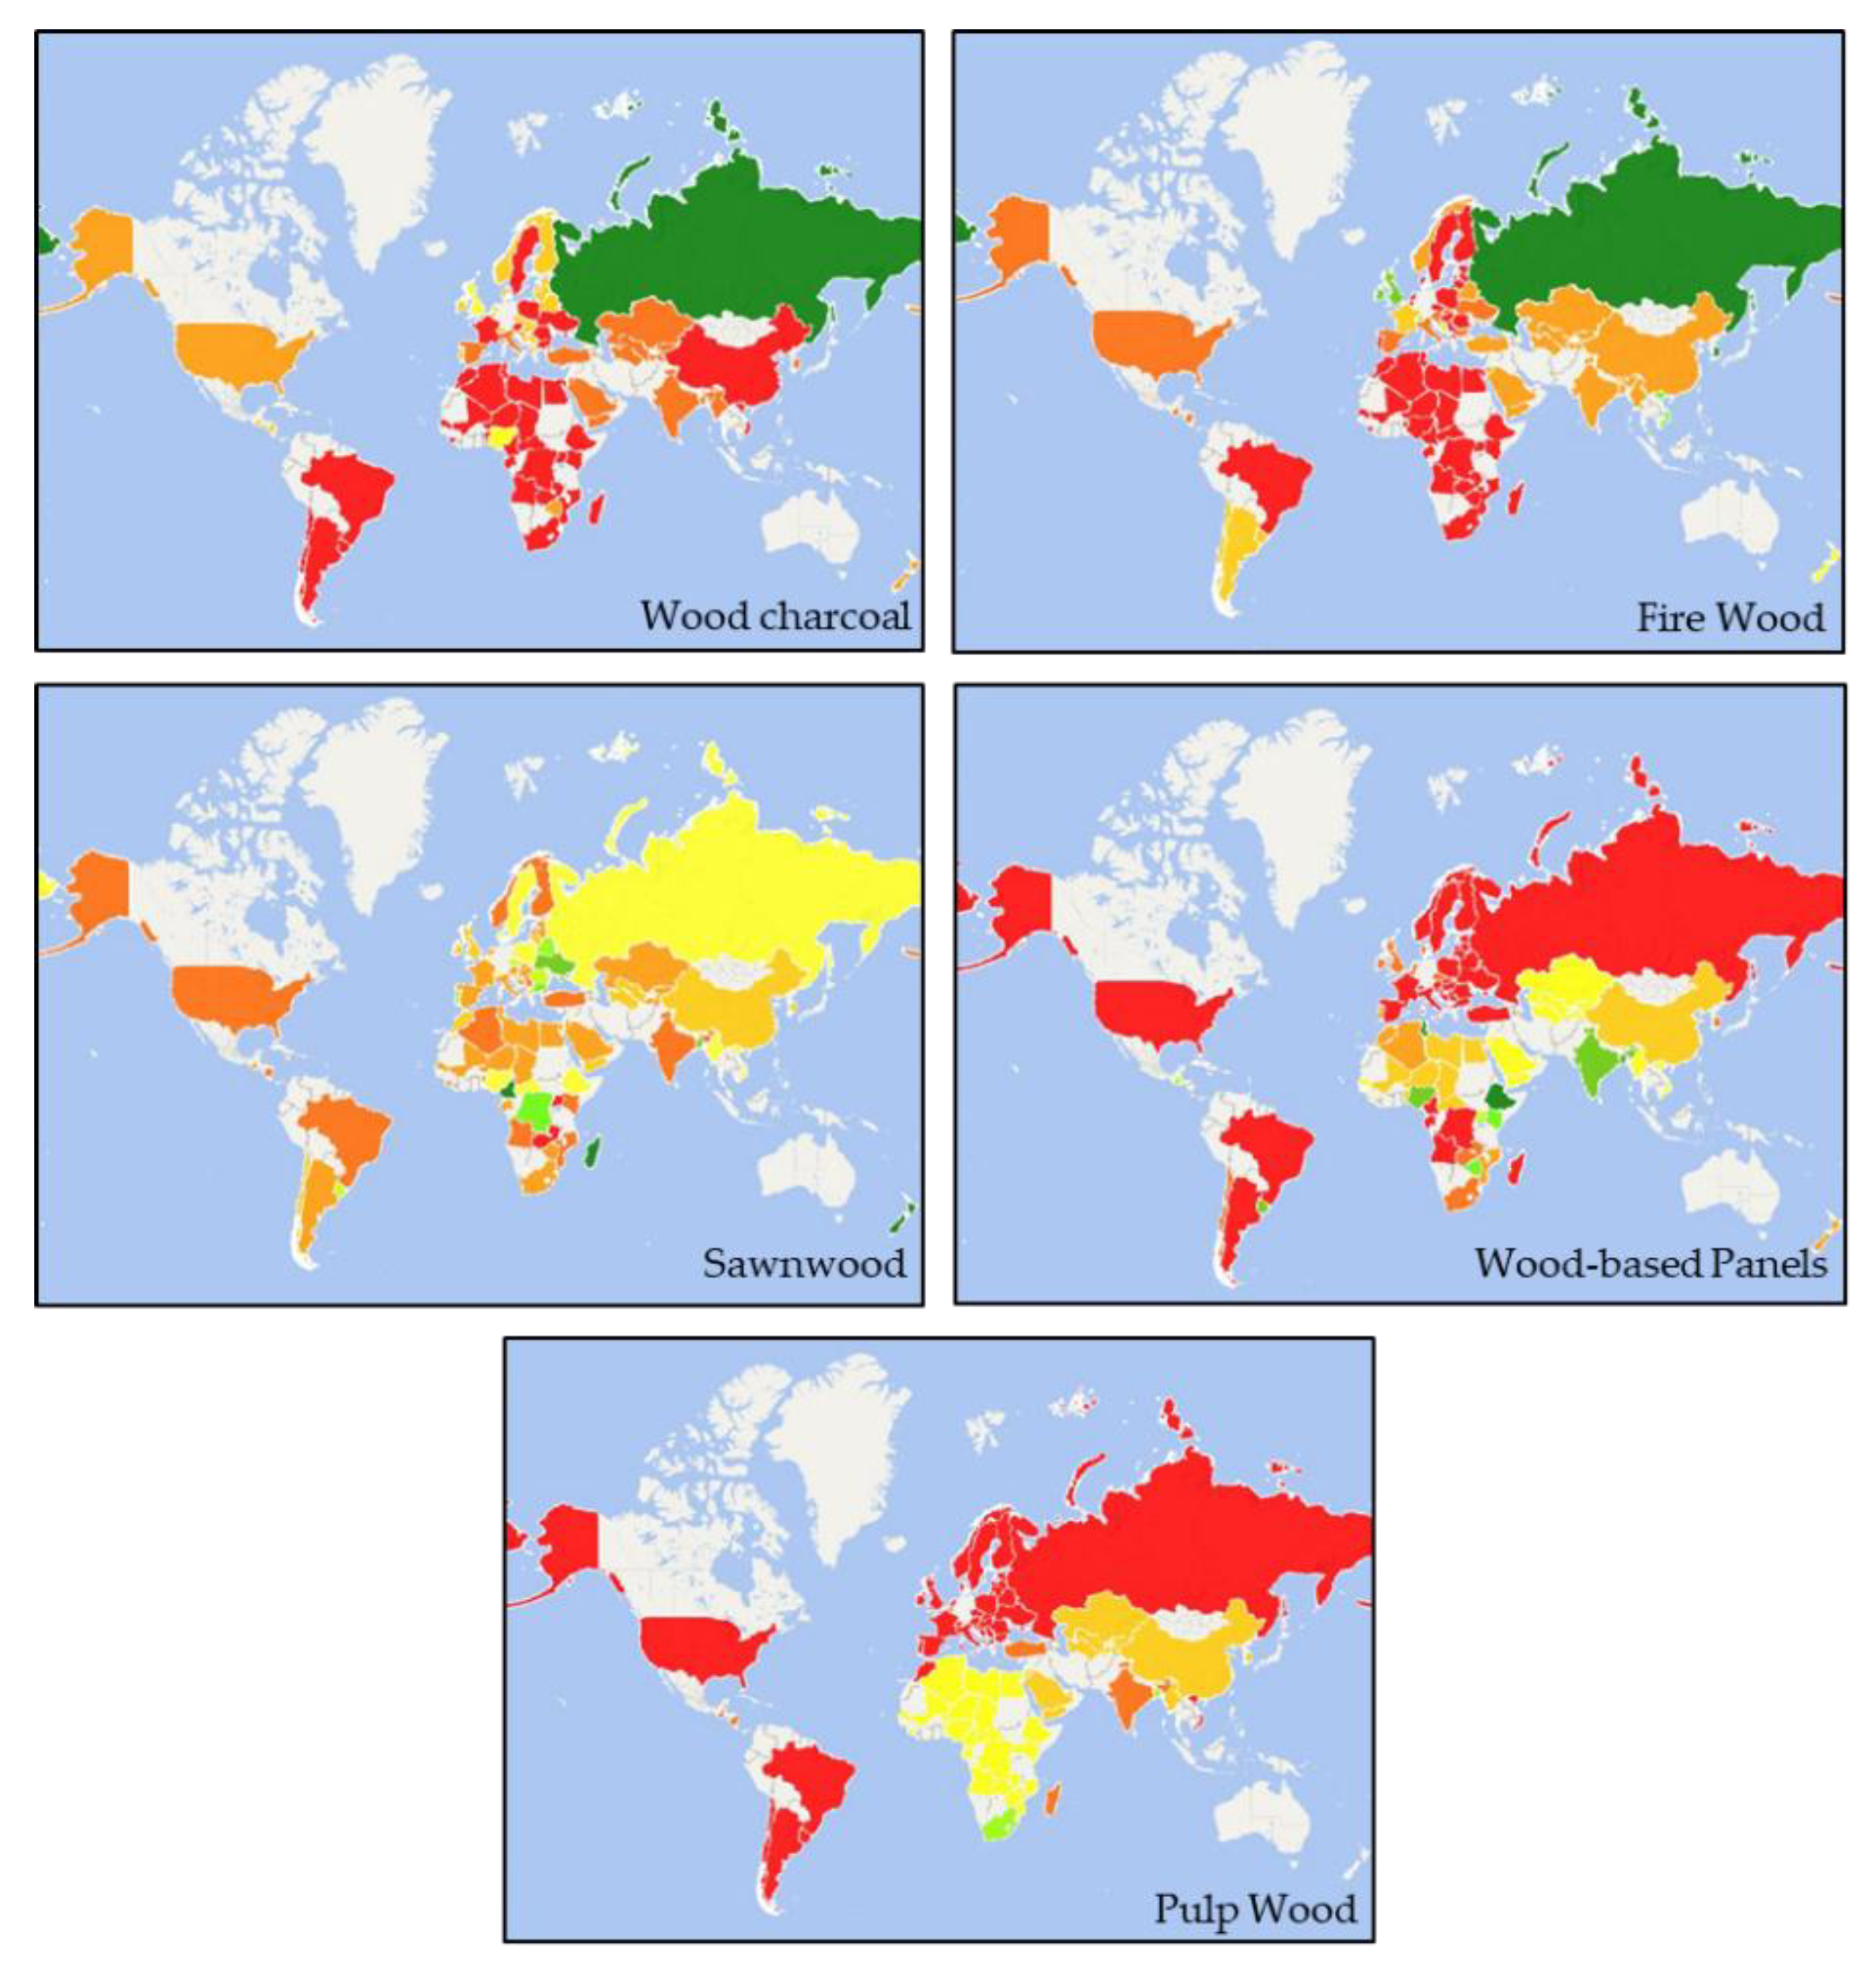
3.6. Wood Substitution Index
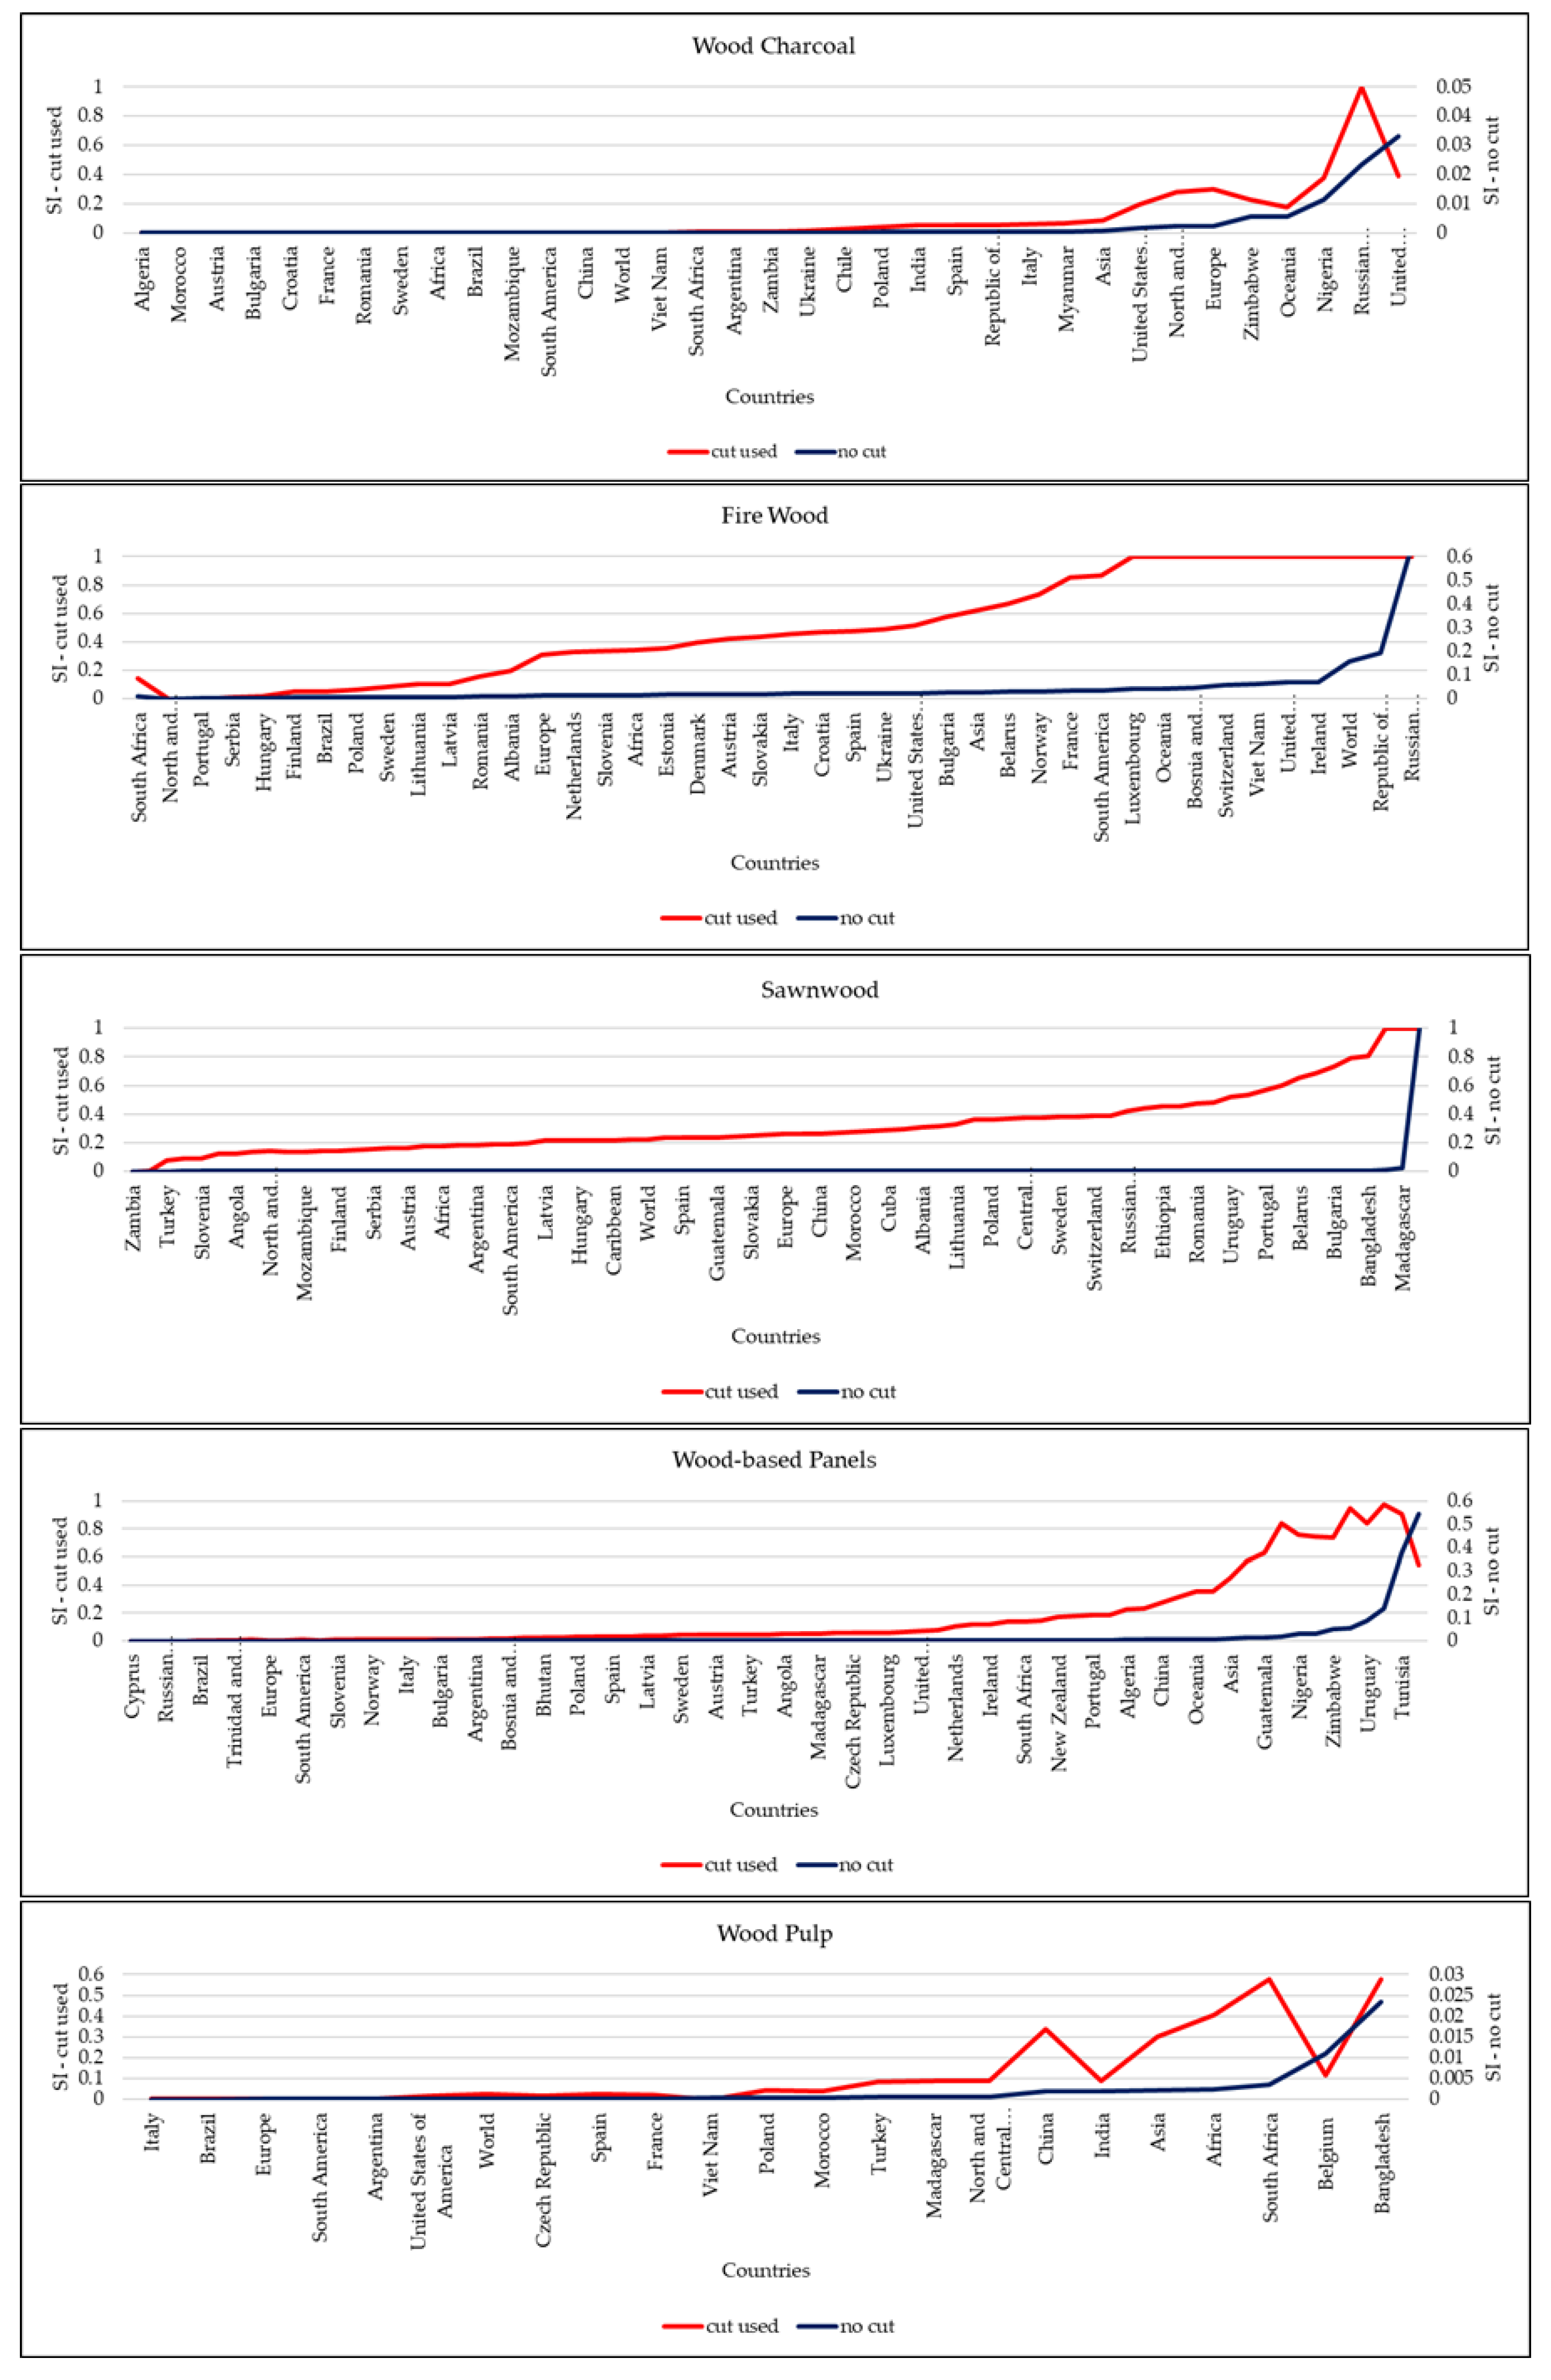
Next, we applied the data to the equations in order to calculate the substitution indexes. After applying the cut-off line to the indicators, we calculated the SI for all the selected functions and the results are shown in
Figure 6, by means of maps, and in
Table 6. The SI values are available in
Table A2.
Table 6 presents the percentage of SI results for each function distributed in the scale of 0 to 1 and also shows the percentage of countries that were left without results due to lack of data for calculation.
3.6.1. Wood Charcoal
Charcoal’s selected substitute for calculation was coal, according to
Section 3.2.1, and the base year is 2010. However, the latest available data for mineral coal is for 2014. For this reason, all data is for the year 2014, except for the commercial growing stock data, which is also for 2010.
The SI trend for charcoal, after comparing the results for each country, points to the worst case scenario, making it clear that it is not possible to replace charcoal with mineral coal, due the fact that most countries (18%) present SI = 0.0, indicating that there is no substitution. These results are mainly related to the availability ratio indicator.
Up to now, we did not find any publications that present similar results by establishing an SI for charcoal. For this reason, it is not possible to compare directly the results found. It is generally assumed that replacing a renewable resource with a fossil resource is not a good choice because the risk of scarcity is much greater for the second compared to the former. We confirmed this hypothesis in our results, despite the method not estimating the increase of the availability of charcoal due to its renewable capacity. According to an expert in the field, coal can be used not only as a substitute for charcoal but also for other energy sources, if we do not consider the environmental impacts that its utilization can cause [
20]. For this reason, it would seem that the SI would have a high value for most countries. However, the results presented do not reflect this reality since coal’s SI was very low.
3.6.2. Firewood
Wood pellets were the best substitute for firewood, according to Sectioj 3.2.2. All data used is for the year 2012, since pellet data is available as of this year, except for the commercial growing stock, which has the latest data available for the year 2010. For firewood, the results show a tendency to low substitutability. The vast majority of countries present a result in which the substitution of wood pellets for firewood is not good (SI = 0.0 in 16% of the countries with results). In this case, the import price ratio indicator had a greater influence on the results.
As with the SI for charcoal, we could not directly compare this result with others because there is no published data for firewood substitution. Since pellets are made of wood particles, which may have residues in their composition, it may be advantageous to replace firewood with pellets, thus preserving the use of roundwood. Since the production of wood pellets is still small relative to the production of firewood, its use as a substitute cannot be expressive. The use and production of pellets has increased substantially, mainly in Europe [
19,
24]. This shows that the results are partially in line with reality, especially in the case of the Russian Federation, which presents the best index, and of Europe, that should have had better results than the rest of the world.
3.6.3. Sawnwood
The substitute of sawnwood was wood-based panels, according to
Section 3.2.3, and all the data used was from the FaoStat [
13] database because, just like sawnwood, wood-based panels come from forest resources. The SI results within the scale are distributed mostly between 0.2 and 0.1, which indicates that the replacement of sawnwood with wood-based panels is viable. These results are mostly influenced by the import price ratio indicator.
The result obtained in this study is close to the result presented by the EC report [
15], which indicates that sawnwood from coniferous trees can be replaced, but only to some extent, due to the performance and cost of substitutes. However, the scope of the EC study [
15] differs from this one because it presents a single index, without indicating which country nor which substitute is being considered, besides being specific to coniferous sawnwood and not covering sawnwood from hardwoods. Another point is the choice of indicators, which the EC report [
15] relates to performance and cost. In the present study, however, we evaluated the performance prior to the application of the method, and we also analyzed the availability of both resources besides the price.
The expert in the field reports that wood panels have already been used as substitutes for sawnwood, mainly in countries with great forestry potential, there being a tendency towards this substitution [
19]. Thus, the results partially represent this reality.
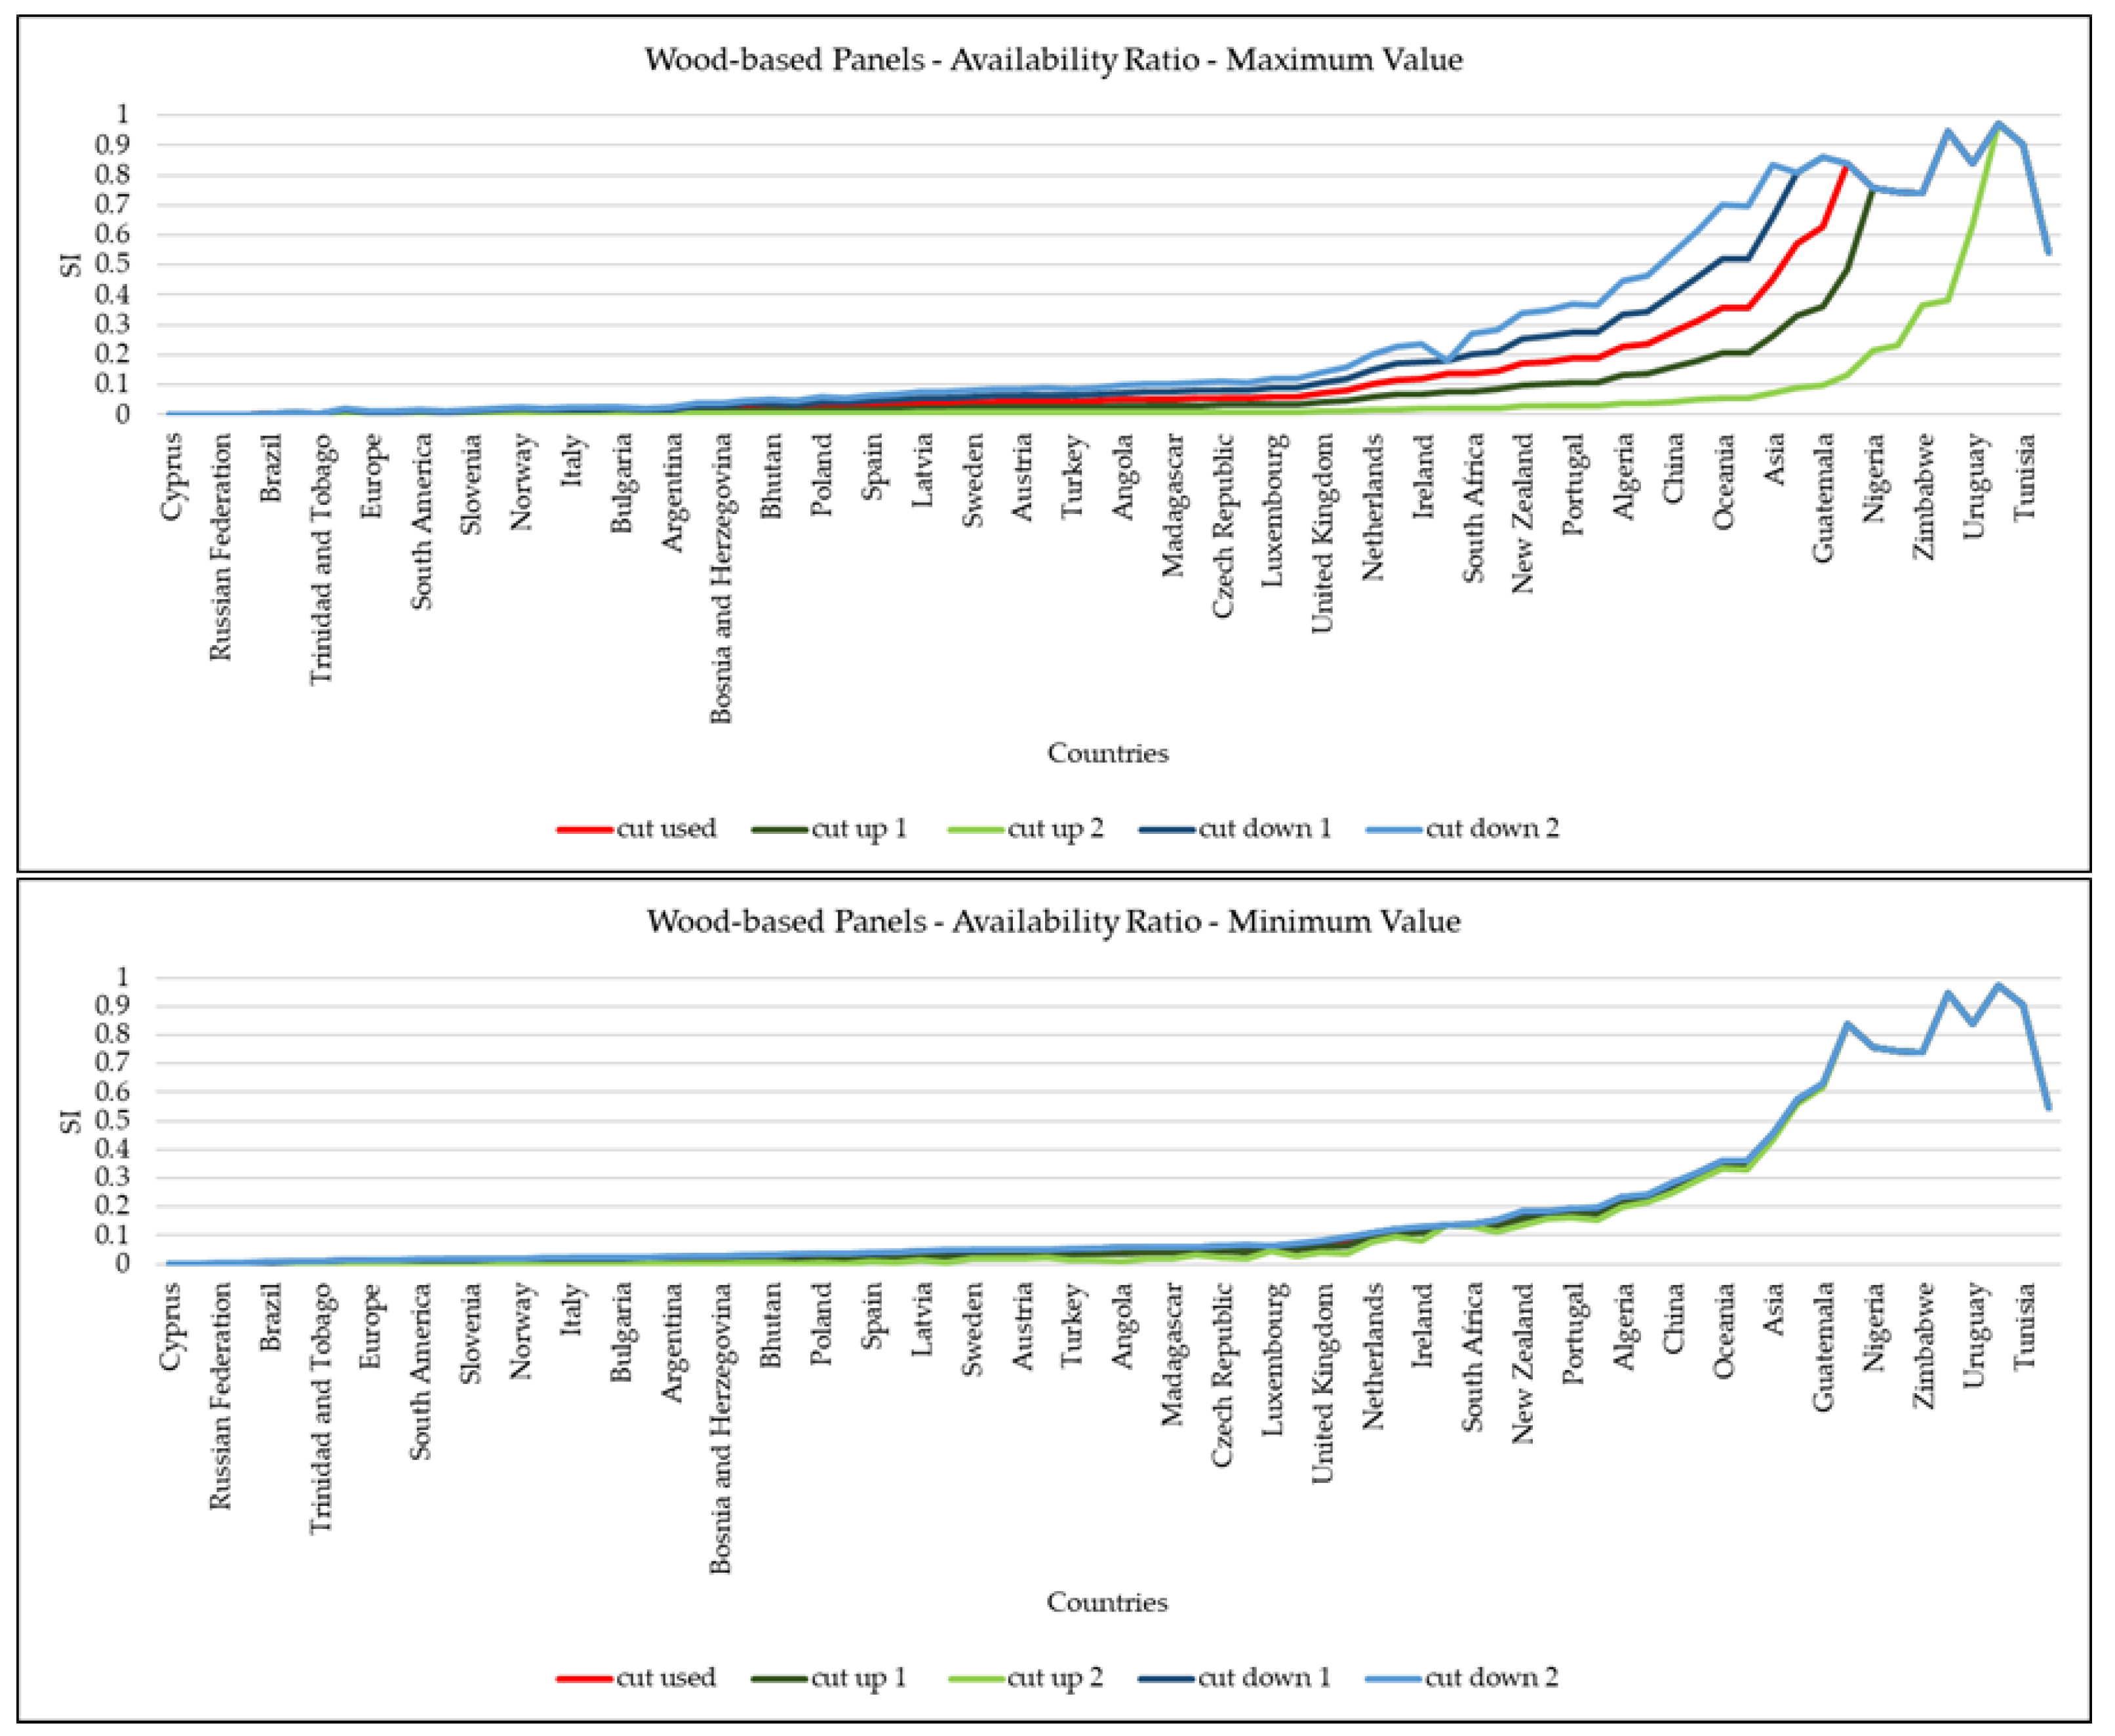
3.6.4. Wood-Based Panels
Wood-based panels are used as substitutes for sawnwood, according to
Section 3.2.4. Here, however, they are treated as a function of the wood to be replaced and the substitutes for the wood-panels were wood residues. In the case of the residues, we did not use commercial growing stock data because the residue is a product resulting from wood industrial processing and not a product made from wood in its natural state. Most countries have SI = 0.0, indicating that the substitution of wood residues for wood-based panels is also not a good alternative. The availability ratio indicator is the factor that mainly influences the results.
Up to now, according with this study, no results were reported with indices indicating the substitution of wood-based panels. According to an expert in the area, the replacement of wood panels by panels made of wood residues is very incipient because it is easier to control the quality of the panels if only one species of wood is used in its composition, which does not occur using residues [
19]. Another point to be highlighted is that the panel industry is well established, making it a difficult product to replace [
19]. Thus, the results obtained are in line with reality.
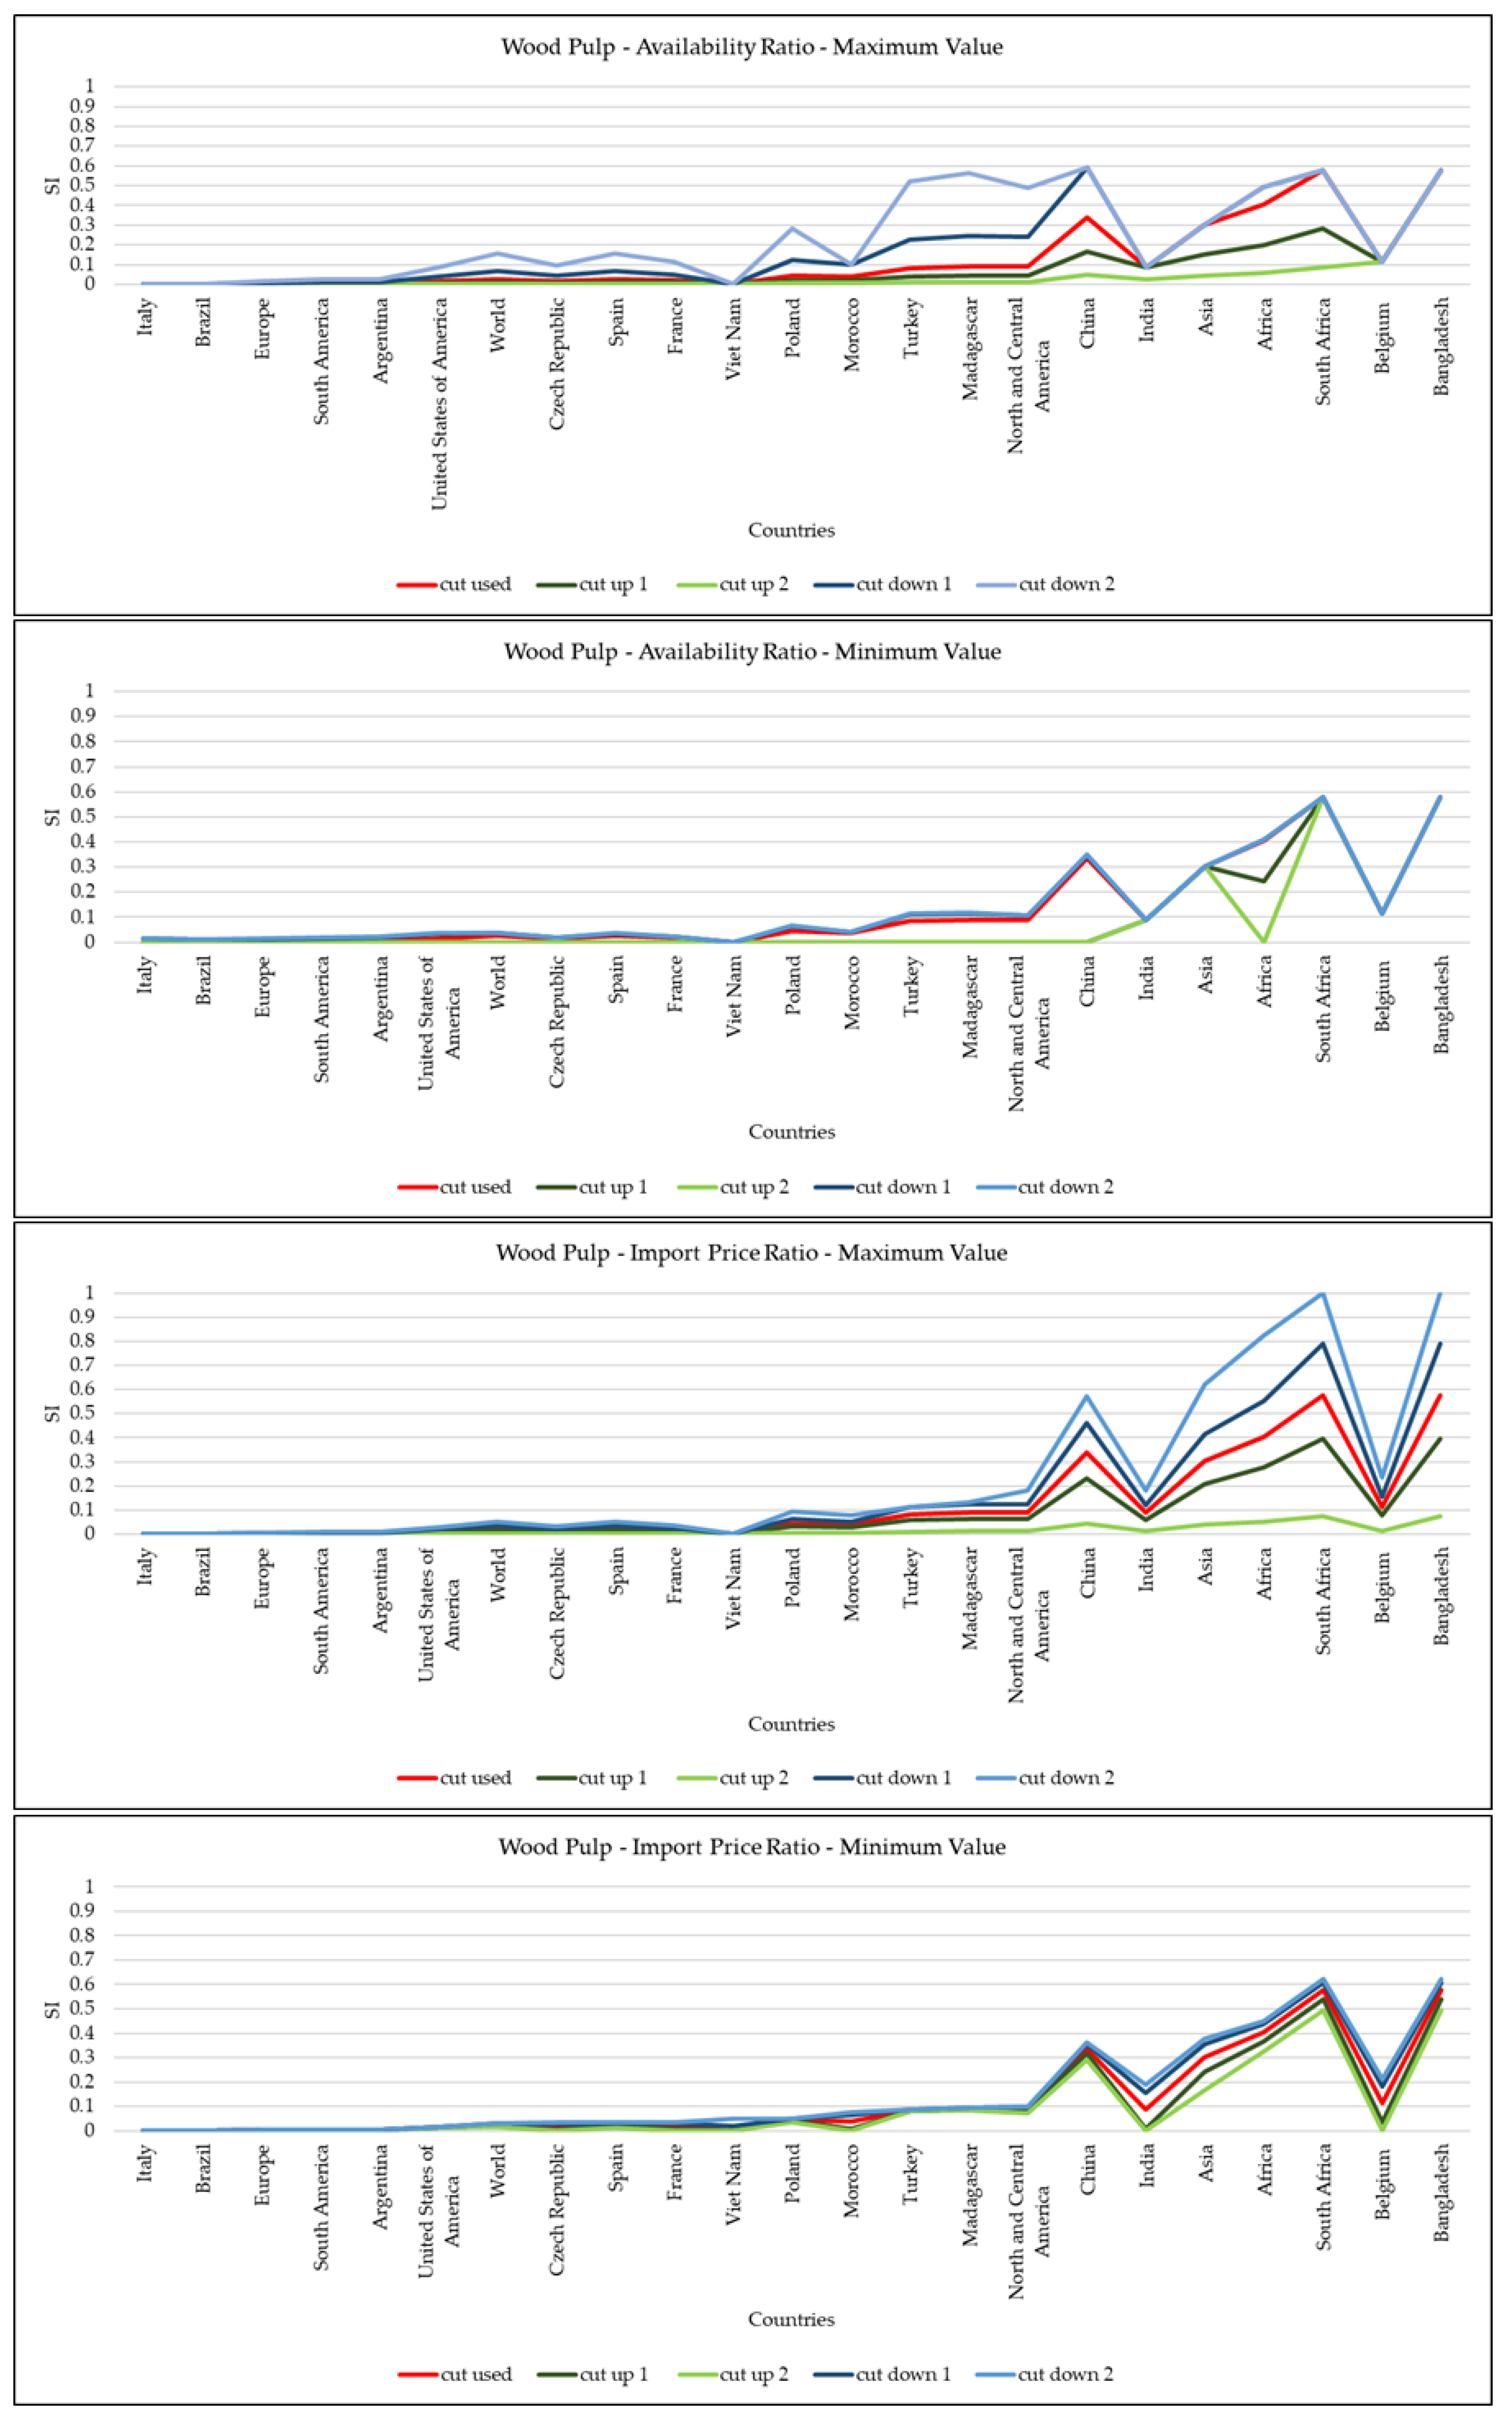
3.6.5. Wood Pulp
The substitute for wood pulp in our study was pulp from fibers other than wood, according to
Section 3.2.5. As for wood residues, we did not use the commercial growing stock data for other fiber pulp. In this case, it was because we do not have information on which type of fiber was used in the pulp production. That was also the case of fibers extracted from products with annual planting and that do not have a growth stock, such as rice hull fibers.
This function was the one that generated results for the least number of countries. This is because few regions in the world record data for alternative fiber production for paper production. The replacement of wood pulp by other fiber pulp usually is not very satisfactory. Most countries show no substitution, presenting the index SI = 0.0; 10% of the countries studied generated results for this function. The availability ratio indicator had the most influence on these results.
The results presented by the EC report [
15] show that the substitution of wood pulp has little viability due to its applications. There is, however, a possibility of reducing its use by means of electronic alternatives, for example by using e-books. Likewise, the results of this study indicate a great difficulty in replacing wood pulp. Besides, as previously, we emphasize that these results cannot be compared directly because the indicators are not the same and were not used in the same way. Another factor to highlight regarding the difficulty of substitution is that, according to an expert in the area, other fiber pulp production is still very rudimentary in relation to the global production of wood pulp [
19]. For this reason, the high percentage of countries with no results is justified. Therefore, the results are in line with reality.
3.7. Method Evaluation
3.7.1. Sensitivity Analysis
After obtaining the results, we performed a sensitivity analysis for the cut-off.
Table 7 presents the data for the cut-off points, which were based on the distribution of the values according to their concentration. The spaces with no data are those for which it was not necessary to make the cut-off because the data did not present many variations.
Figure 7 shows the results for SI with and without the cut-off for all functions. SI scales with and without the cut-off are different for better viewing.
The new cut-off points resulted in variation of the substitution indexes. These variations are presented in
Table A2, and they showed that:
sensitivity depends on the variations of the values for the indicators before normalization -the greater the variation, the greater the sensitivity;
sensitivity is always lower for minimum values, for all the functions;
cut-off does not influence the final ranking; therefore, there is no problem in eliminating maximum and minimum values.
3.7.2. Qualitative Evaluation
We also carried out a qualitative analysis of our method, in which we verified that:
the method is functional, as it provides results for the substitution indexes for the wood functions as proposed;
it is an effective method, since its results are clear and objective, but it is not completely efficient, as it depends on obtaining data, which in some cases is difficult; it also requires a qualitative evaluation of resource performance;
the method is easy to apply and to reproduce with accuracy by any researcher in the area of LCIA of resources;
although generic in the sense of allowing for a global application, it has certain limitations in being applied to other resources if these are not natural—in this case, the calculation of availability must be adapted;
the method provides punctual and static results, so it cannot be applied to forecasting purposes, and it presents low sensitivity;
it only partially represents reality, as discussed in previous sections, requiring a future evaluation by a group of experts;
when compared to other substitution assessment methods, it presents some advantages, such as identifying substitutes for the resources, unlike the other researched methods which only indicate if the resource is replaceable or not;
the results may be useful not only for the application of LCIA models that use the substitution approach, but also in other areas that seek to identify alternatives for resource utilization—but, in this case, the application is not straightforward and requires new studies.
We analyzed and discussed all these criteria, pointing out the attributes and limitations of the method. Considering that the evaluation was qualitative and applied by the author of the method, we suggest that in the future other researchers reevaluate it, increasing its reliability.
4. Conclusions
This study aims to contribute to the LCIA field by proposing a quantitative method to assess the substitution of resources. Most resource characterization models in endpoint LCIA analyze resource exploitation to assess its scarcity. This method offers an alternative (indicating the substitutability of wood with an emphasis on its functionality) which shows promise in assessing the impact of resource use.
With respect to the main objective, we consider that this study proved satisfactory. The substitution indexes were calculated for all countries with available and accessible data. In addition to providing substitution indexes for wood, this method can be applied to other natural resources.
Other important contributions are: it provides a classification for determining the functionality of the wood and indicates its main uses; it also identifies and evaluates the main substitutes for each of the functions of wood.
The main conclusions are the following:
With respect to the functionality of wood - wood can be classified at different levels depending on its production chain; we selected the level in which it was still possible to obtain a substitute for wood according to its end use; the method can be extended to other functions.
As for the substitutes: the substitutes analyzed were those that are already used to perform the same function of the wood; the substitutes were chosen according to a similar performance of wood, but the selection depended on the availability of data; other substitutes could be chosen, especially if the method is applied in a limited manner, with specific data collection.
Regarding the substitution indexes: we have developed an equation that determines the index substitution index (SI) by country and wood function, which has two indicators (availability ratio—ϕA and import price ratio—ϕIMP); most of the functions presented indexes of less than 0.5 within the scale of 0 to 1; the indexes are specific to each function and present regional variation; the results partially reflect the reality according to consultation with a forestry expert.
Although this study offers relevant considerations, it also has some limitations. We believe that these limitations are opportunities for the development of further research on this subject.
This study focused on biotic resources, specifically on wood forest resources. The method was developed and applied to wood, but it is perfectly feasible to adapt it to other resources. However, it is particularly applicable to other natural resources that have a stock available in nature. An interesting research opportunity is to identify a way to calculate the availability of other resources without regard to their natural stock.
Another point to highlight is that this method does a static evaluation; in other words, it is dependent on temporal data, reflecting the reality of the timeframe to which it is applied. Since biotic resources are renewable, we suggest evaluating the possibility of adding variables related to the renewability of the resource.
The dependence on the availability of data for application of the method has limited the identification of substitutes, especially in the case of new alternatives still in development. For this reason, we suggest adapting the method to regional or even local application, and also to a single function, ensuring that data is collected specifically for research purposes.
Finally, our last suggestion is to investigate the possibility of using the method in the development of a characterization model in LCIA, in order to obtain characterization factors for resources, using substitution as one of its evaluation parameters.


