Abstract
Online customer reviews are a sustainable form of word of mouth (WOM) which play an increasingly important role in e-commerce. However, low quality reviews can often cause inconvenience to review readers. The purpose of this paper is to automatically predict the helpfulness of reviews. This paper analyzes the characteristics embedded in product reviews across five different product types and explores their effects on review helpfulness. Furthermore, four data mining methods were examined to determine the one that best predicts review helpfulness for each product type using five real-life review datasets obtained from Amazon.com. The results show that reviews for different product types have different psychological and linguistic characteristics and the factors affecting the review helpfulness of them are also different. Our findings also indicate that the support vector regression method predicts review helpfulness most accurately among the four methods for all five datasets. This study contributes to improving efficient utilization of online reviews.
1. Introduction
Online product reviews written by customers who have already purchased products help future customers make better purchase decisions. Reviews can be defined as peer-generated, open-ended comments about the product posted on company or third party websites [1]. Since reviews are autonomously updated by customers themselves without corporate efforts, they are perceived as a sustainable form of word of mouth (WOM) in e-business.
However, as the reviews accumulate, it becomes almost impossible for customers to read all of them; furthermore, poorly authored low-quality reviews can even cause inconvenience. Thus, it becomes important for e-business companies to identify helpful reviews and selectively present them to their customers.
In fact, customers often require only a small set of helpful reviews. Some online vendors provide mechanisms to identify reviews that customers perceive as most helpful [1,2,3]. The most widely applied method is simply asking review readers to vote on the question: “Was this review helpful to you?”, and the answer can be either “Yes” or “No”. Then, review helpfulness is evaluated by calculating the number of helpful votes divided by the total number of votes [4]. Thereafter, the reviews that receive the highest ratings are reorganized to the top of the web page so that customers can easily check them. Leading online retailers—such as Amazon.com and TripAdvisor—also use this method to measure review helpfulness. Figure 1 shows how Amazon.com gathers helpful votes of the reviews from their readers.

Figure 1.
An example of helpful votes in a review on Amazon.com.
However, a large proportion of online reviews have few or no votes at all; thus, it is hard to identify their helpfulness. According to Yang et al. [5], more than 80% of the reviews in the Amazon review dataset [6] have fewer than five votes. Moreover, newly authored reviews and less well-known products have fewer opportunities to be read by other customers, and thus, cannot receive many votes. Therefore, to use the entire review dataset efficiently, it is necessary to estimate the helpfulness of online reviews by using an automatic system rather than depending entirely on the manual helpfulness voting system.
The purpose of this paper is to predict the helpfulness of product reviews automatically by analyzing psychological as well as linguistic features of the reviews. This study helps online customers to access helpful reviews easily and efficiently even when reviews do not have any manual votes, which supports sustainable e-business strategy in terms of improving continuous utilization of online reviews.
There are some previous studies on this issue; however, most of them focus on linguistic characteristics or limit themselves to a consideration of basic psychological characteristics, such as positivity. This study considers some in-depth psychological characteristics, such as the level of analytical thinking, authentic expression, expertise, the ratio of perceptual process words, and cognitive process words embedded in reviews, as well as the basic features. Also, the product type is used as a control variable in this study. It is because the determinant factors affecting review helpfulness for different product types can vary according to product types. For example, a highly analytical review may be perceived as helpful to readers looking for cell phone products, while it may not be perceived as helpful for those buying clothing products.
In short, our research focuses on the following three questions. First, what are the psychological and linguistic review characteristics across different product types and how are they different? Second, what are the factors determining perceived helpfulness of reviews based on product type? Finally, which data mining method, among the four widely used data mining methods, best predicts review helpfulness?
To address these research questions, five different online datasets from different product types (beauty, cellphone, clothing, grocery, and video) on Amazon.com are used. The psychological and linguistic characteristics of online reviews for each product type are extracted by using a widely adopted text analysis software, Linguistic Inquiry and Word Count (LIWC). Then, the review characteristics across five product types are compared with each other using one-way analysis of variance (ANOVA). Next, the determinant factors of review helpfulness for each product type are examined using regression analysis. Finally, instead of depending on a single analytical method, four widely used data mining methods (linear regression, support vector regression, M5P, and random forest) are implemented to predict review helpfulness by using datamining package WEKA and Java programming language. The methods’ MAE performances are compared to determine the one that predicts review helpfulness most accurately.
The rest of this paper is organized into four sections. Section 2 presents literature related to the current study. Section 3 describes the research settings, and Section 4 presents the results and discussion of this study. Finally, the conclusion and scope for further research are described in Section 5.
2. Literature Review
Many previous studies consider two important issues for predicting the helpfulness of reviews. First, finding out the variables affecting the helpfulness of reviews and, second, adopting a suitable analyzing method for predicting review helpfulness. In Section 2.1, the related studies focusing on the first issue are reviewed and, in Section 2.2, the studies focusing on the second issue are described.
2.1. The Characteristics of Online Reviews Affecting Their Helpfulness
There are many features, such as linguistic characteristics (the number of words, word per sentences, etc.), the content of reviews (positivity/negativity, subjectivity/objectivity, etc.) and other peripheral factors (product rating score, review time, reputation of a reviewer, etc.) affecting review helpfulness, addressed by previous studies.
In terms of the linguistic aspect, the reviews with an appropriate length, high readability, and that are free of grammatical errors are likely to be perceived as helpful [1,4,7,8,9,10,11]. Mudambi and Schuff [1] study the effect of review length (word count) and review extremity on review helpfulness by analyzing Amazon.com’s review datasets. Their results show that the review length has a positive effect on review helpfulness and the product type has a moderating effect on their relationship. Pan and Zhang [7] also collected review datasets from Amazon.com for both experiential and utilitarian products and show the positive relationship between review length and review helpfulness. Korfiatis et al. [8] examine the effects of readability on review helpfulness using Amazon.com’s review datasets. They use four readability measures—Gunning’s fog index, Flesch reading ease index, automated readability index, and Coleman–Liau index—and show that the readability has a greater effect on review helpfulness than the review length. Ghose and Ipeirotis [9] consider six readability predictors with other variables, such as reviewer information, subjectivity levels, and the extent of spelling errors using Amazon.com’s review datasets. Their study also supports the view that readability-based features matter in influencing perceived review helpfulness and product sales. Similarly, Forman et al. [10] examine the effect of readability and spelling errors on review helpfulness as well as the subjectivity of the review text and reviewer information. They use three types of products on Amazon.com (audio and video players, digital cameras, and DVDs) and show that the readability of reviews has a positive impact on perceived helpfulness, and spelling errors have a negative impact on perceived helpfulness. Furthermore, Krishnamoorthy [11] considers a greater variety of linguistic features such as the ratio of adjectives, state verbs, and action verbs in reviews. This study considers four different kinds of features—metadata, subjectivity, readability, and linguistic category—and shows that a hybrid set of features deliver the best predictive accuracy. Additionally, the results show that, in most cases, a stand-alone model that uses linguistic features delivers a superior performance compared to a model that uses either subjectivity or readability as features.
In terms of the content aspect of reviews, the semantic features and sentiment features have been covered in some previous studies. Cao et al. [2] extracted the meaning of reviews with the help of latent semantic analysis (LSA). They empirically examined the impact of the basic, stylistic, and semantic characteristics of online reviews on review helpfulness and show that the semantic characteristics are more influential than other characteristics. Some previous research examines the effect of subjectivity of reviews on review helpfulness. Ghose and Ipeirotis [9] show that reviews having a mixture of objective and subjective sentences are rated as more helpful by other users than reviews that tend to include only subjective or objective information. Forman et al. [10] also showed that reviews with a mixture of subjective and objective elements are more helpful.
Emotions embedded in a review are also indicated as important determinants affecting review helpfulness [7,12]. Pan & Zhang [7] find that consumers tend to rate positive reviews to be more helpful than negative ones; this is often manifested in the inflated helpfulness ratings for positive reviews, which misguide consumers. On the other hand, there are some studies claiming that negative reviews tend to be more influential than positive ones [13,14,15,16]. The study of Chevalier and Mayzlin [13], which uses Amazon.com and Barnesandnoble.com datasets, shows that most reviews are overwhelmingly positive; however, negative reviews have a greater impact on sales than positive reviews. Kuan et al. [14] also show that negative reviews are more likely to receive helpful votes, and that they are generally considered to be more helpful. Yin et al. [3] explore the effects of emotions in greater detail. They specially focus on two negative emotions—anxiety and anger. They claim that anxiety-embedded reviews are considered as more helpful than anger-embedded reviews, because anxious reviewers write theirs more carefully than angry ones. Ahmad and Laroche [17] also study how discrete emotions—such as hope, happiness, anxiety, and disgust—affect the helpfulness of a product review. They adopt LSA to measure the emotional content in reviews, and their results show that discrete emotions have different effects on review helpfulness.
There are other peripheral factors influencing review helpfulness, such as reviewer’s reputation or product rating score. Otterbacher [18] collected data on the total votes a reviewer has received, the total reviews written, and the reviewer rank on Amazon.com, to measure reviewer reputation; their results show that reviewer reputation is positively correlated to review helpfulness. Product rating score was also found to be a strong determinant of review helpfulness in some previous research [1,2,8]. In addition, Luan et al. [19] studied on consumers’ review search behavior according to the product types and showed that customers more positively respond to attribute-based online reviews than experience-based reviews for search products, while responding oppositely for experience products.
In previous work related to this study, Park and Kim [20] analyze the review characteristics using LIWC and explore the determinant factors affecting review helpfulness. However, this research is limited to a focus on finding out determinant factors using Linear Regression for two types of products—electronics and clothing—on Amazon.com and does not predict review helpfulness using datamining methods.
2.2. The Analyzing Methods for Predicting Review Helpfulness
Analyzing methods can differ depending on whether the dependent variable (DV) is numeric or nominal. Aforementioned in Section 1, the dependent variable ‘review helpfulness’ is defined as the percentage of the helpfulness votes, which is numeric. In this case, one of the most widely adopted analyzing methods is Linear Regression. It has been frequently used in many previous studies because it is generally faster than the other methods, and it has an explanation capability as to how explanatory variables affect a dependent variable. Thus, many previous studies including Mudambi and Schuff [1], Yin et al. [3], Yang et al. [5], Korfiatis et al. [8], Forman et al. [10], Chevalier & Mayzlin [13], Otterbacher [18], and Park and Kim [20] have adopted Linear Regression for predicting review helpfulness scores. Some studies transformed the raw percentage of the helpfulness votes to nominal data such as “unhelpful” or “helpful”, based on whether the raw percentage exceeds a benchmark cutoff value [10]. In that case, it becomes a classification problem. Cao et al. [2] uses logistic regression to examine the impact of the basic, stylistic, and semantic characteristics of a “helpfulness rank” based on the number of votes a review receives. Likewise, Pan and Zhang [7] also used logistic regression for classifying helpful reviews.
Support vector machines (SVM) have also been used in some related research. SVM can handle both linear and nonlinear relationship between the dependent variable (DV) and independent variables (IVs). Moreover, they can predict both numeric and nominal types of DV. Specifically, a version of SVM called support vector regression (SVR) is used for regression, and a version of SVM called support vector classification (SVC) is used for classification. Kim et al. [4] and Zhang [21] applied a SVR method for predicting the review helpfulness using Amazon.com dataset. Similarly, Hu and Chen [22] predict review helpfulness using TripAdvisor dataset using three datamining methods (SVR, linear regression, and M5P) and show that M5P significantly outperforms the other two methods. Other related research adopts the SVC method. Martin and Pu [12] apply SVC with two other data mining methods—naïve bayes and random forest—and show that SVC performs the best among the three methods for TripAdvisor.com dataset. Krishnamoorthy [11] also adopted SVC, naïve bayes and random forest methods using Amazon.com dataset, however, unlike the results of Martin and Pu’s study [12], they show that random forest produces the best results.
Finally, decision tree methods such as JRip, J48, and random forest are also applied in some related research. Decision trees are a non-parametric supervised learning method used for classification and regression [23]. They produce output rules which are easy to understand and suitable for non-linear relationships between DV and IVs. Ghose and Iperirotis [9] use random forest based classifiers for predicting the impact of reviews on sales and their perceived usefulness. O’Mahony and Smyth [24] use two decision tree methods—JRip and J48—and naïve bayes, and show that JRip predicts review helpfulness most accurately.
In our study, we adopted four datamining methods (linear regression, SVR, M5P, and random forest) and compared their results in order to find the best method for predicting review helpfulness. Linear regression was selected because it is the most popular method in the previous research. The other three methods (SVR, M5P, and random forest) were selected because they were indicated as the best performing methods in more than one related studies. The various features and analyzing methods of the previous studies are shown in Table 1.

Table 1.
Previous studies on review helpfulness.
3. Research Settings
3.1. Data & Research Variables
The data used in this study was originally collected from Amazon.com spanning May 1996–July 2014, which we gathered from http://jmcauley.ucsd.edu/data/amazon/. We chose five product types having different product characteristics with each other as follows. The selected product types are beauty, cellphone, clothing, grocery, and video. Beauty and grocery products are both categorized as experience goods, for which it is relatively difficult and costly to obtain information on product quality prior to interaction with it [1]. The difference is that beauty products are closer to hedonic products, which are consumed for luxury purposes, while grocery products are closer to utilitarian products, which are consumed for practical use or for survival. Cellphone products are categorized as search goods, for which it is relatively easy to obtain information on product quality prior to interaction [1]. In addition, they are electronic products based on relatively advanced technology, and thus, the subject of more complex reviews. Clothing involves a mix of search and experience attributes. Branded clothing is categorized as search goods, whereas, non-branded clothing could be considered as experience goods. Video products are categorized as digital products, unlike the other four product types, which are physical products.
The original dataset contained 859,998 reviews; however, we selected 41,850 reviews that had more than 10 votes, because review helpfulness based on a small number of votes can be biased and unreliable. The details of the data used in this experiment for each product type are presented in Table 2.
Table 2.
Number of data in each product type.
The initial form of the review data is presented in Figure 2a; we used the review text, rating, the number of votes on review helpfulness, and the total number of votes from the original dataset. Review time was excluded because it does not contain recency information, that is, information about the time the review was written and the time it got votes.
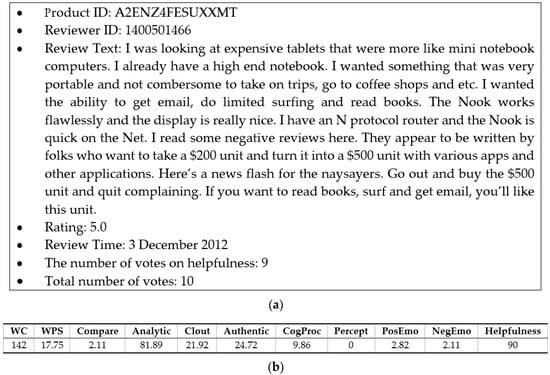
Figure 2.
Transformation of unstructured review data to structured data. (a) An example of the original review data in an unstructured form; (b) transformed review data in a structured form.
Because the review text was in unstructured form, we transformed it to a structured form with numeric scores, as presented in Figure 2b. To transform the text, LIWC 2015 was used. LIWC is a text analysis software program developed by Pennebaker et al. [25] for evaluating psychological and structural components of text samples. The tool has been widely adopted in psychology and linguistics [26], and its reliability and validity have been investigated extensively [25,27]. It operates on the basis of an internal dictionary and produces approximately 90 output variables.
However, these 90 output variables are not all mutually exclusive and many of them are part of a hierarchy [28]. For example, as shown in Table 3, the sadness variable belongs to the broader negative emotion variable, and negative emotion belongs to the affective process variable. Thus, using both higher and lower variables belonging to the same hierarchy would cause information redundancy and multi-collinearity problems. Furthermore, many of these variables may not influence the prediction of review helpfulness. For example, a proportion of biological process words may not affect the review helpfulness. Therefore, we selectively use 11 variables which may influence the review helpfulness, rather than using the entire range of LIWC variables.
Table 3.
Example of output variables of LIWC in the affective process category.
We categorize these variables into three groups—psychological, linguistic, and metadata. The psychological group is related to thinking and feeling processes based on semantics, while the linguistic group is related to the structure of sentences, or grammar. Unlike the previous two groups, the metadata group captures observations which are independent of the text [4]. The seven selected psychological variables are Analytic, Clout, Authentic, CogProc, Percept, PosEmo, and NegEmo; the three structural variables are WC, WPC, and Compare; the one metadata variable is product rating given by a reviewer. Analytic, Clout, Authentic, CogProc, Percept, and Compare are exploratory variables, which have been considered for the first time in research on this topic, whereas the other variables are confirmatory which have already been considered as determinants in previous research. The explanation of the research variables and the reason for selecting each variable are given below. Furthermore, the detailed explanations, including the scales and calculation methods, are explained in Table 4.
Table 4.
Explanation of the research variables.
- Explanotory Variables[Psychological variables]
- -
- Analytic: The level of formal, logical, and hierarchical thinking. Reviews containing analytical thinking are assumed to be more helpful, especially for information-intensive search goods.
- -
- Clout: The level of expertise and confident thinking. Reviews containing more professional expressions are assumed to be more helpful for complex products, such as hi-tech electronic products.
- -
- Authentic: The level of honest and disclosing thinking. Reviews containing more personal expressions and disclosures are assumed to be more helpful for high-involvement goods, which customers consider as their representatives.
- -
- CogProc: The ratio of cognitive process words such as “cause”, “know”, and “ought”. Reviews containing terms related to cognitive processes are assumed to be more helpful, especially for search goods, since their product qualities are often measured cognitively, rather than through the senses.
- -
- Percept: The ratio of perceptual process words such as “look”, “heard”, and “feeling”. Reviews containing terms related to perceptual processes are assumed to be more helpful for the goods whose quality is often evaluated by using senses.
- -
- PosEmo: The ratio of positive emotion words. It is a confirmatory variable identified as a determinant of review helpfulness in the previous studies [7,13,14,15,16,29].
- -
- NegEmo: The ratio of negative emotion words. It is a confirmatory variable identified as a determinant of review helpfulness in the previous studies [7,13,14,15,16,29].
[Linguistic variables]- -
- WC: The length of a review measured by the number of words in the review text. It is a confirmatory variable identified as a determinant of review helpfulness in the previous studies [1,7].
- -
- WPS: The level of conciseness of a review, measured by the average number of words per sentence. A lower value reflects more concise and readable sentences. It is a confirmatory variable identified as a determinant of review helpfulness in the previous studies [8,9,10].
- -
- Compare: The ratio of comparison words such as “bigger”, “best”, and “smaller”. Reviews with more comparison expressions are assumed to be more helpful for describing experience goods, which are hard to explain by focusing on their characteristics, and are rather easier to explain by comparing them to other products.
[Metadata variable]- -
- Rating: Product rating score received from a reviewer. It is a confirmatory variable identified as a determinant of review helpfulness in previous studies [1,2,8,29].
- Dependent Variables
- -
- Helpfulness: The helpful quality perceived by readers, measured by the number of helpful votes in the total number of votes.
3.2. Research Method
The overall procedure and research methodologies used in this research are explained step by step in this section. In the first step, the charactieristics of review text in Amazon.com dataset explained in Section 3.1 were transformed into numeric form. In order to do this, each word in review text was searched from LIWC dictionary file. If the target word was matched with a dictionary word, then the matched word category scale was incremented. In this way, the resulting scores of explanatory variables, explained in Table 4, were produced. Figure 3 shows how target words were categorized using LIWC 2015 and, in Figure 4, the resulting scores of review text representing psychological and linguistic characteristics are presented.
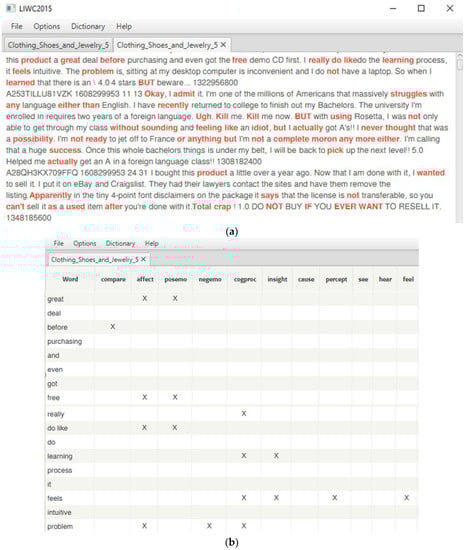
Figure 3.
Categorizing target words in review text using LIWC 2015. (a) Matched target words in review text in LIWC dictionary; (b) categorizing target words in review text.
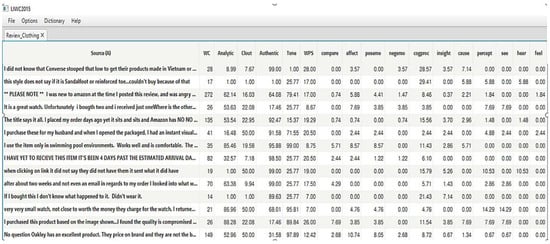
Figure 4.
Transformed review text into numeric scores representing psychological and linguistic characteristics.
In the second step, the characteristics embedded in product reviews across five different product types were explored by performing exploratory data analysis (EDA). In other words, we calculated the averages and standard deviations of review characteristics for each product type. After then, the average scores of explanatory variables across five product types were statistically compared with each other using one-way ANOVA. These results are presented in Section 4.1.
In the third step, the effect of explanatory variables on review helpfulness was explored using linear regression (LR) with a stepwise option in statistical software SPSS. LR has many advantages, such as being easy to understand and capable of explaining how the explanatory variables affect a dependent variable; thus, it is one of the most widely adopted methods for identifying determinants. The performances of the derived LR models were measured using the adjusted R-squared values and p-values of the F-test. These results are presented in Section 4.2.
Next, in step four, the helpfulness of online reviews were predicted using the four most widely used data mining methods (LR, SVR, M5P, and RandF). Every data mining method has its own advantages and disadvantages; so, it is important to choose a method suitable for the data being analyzed [33]. Thus, we compared the results of these four data mining methods to determine the best method for the review dataset. In this step, we excluded the computationally expensive Neural Networks method and the less scalable case-based reasoning (CBR) method and included relatively fast and simple methods. The models were built according to a 10-fold cross-validation so that all the examples in a dataset could be used for both training and testing process. In this 10-fold cross validation, the entire dataset was divided into 10 mutually exclusive subsets with the same class distribution. Each fold was used once as a test dataset to evaluate the performance of the predictive model that was generated from the training dataset which was a combination of the remaining nine folds [34]. The datamining methods were implemented using the Java programing language with the WEKA package. The detail explanation of these datamining methods and the WEKA functions used for implementing them are explained as follows.
- Explanation of the examined data mining methods:
- (1)
- Linear regression (LR): This approach is used to analyze the linear relationship between a dependent variable and one or more independent variables. The standard least-squares LR method, contained in weka.classifiers.functions.LinearRegression, was used.
- (2)
- Support vector regression (SVR): This is a sequential minimal optimization algorithm for solving regression problems. SVR is the adapted form of SVM when the dependent variable is numerical rather than categorical [23]. The weka.classifiers.functions.SMOreg method with the PolyKernel option was used.
- (3)
- Random forest (RandF): This is an ensemble learning algorithm that operates by constructing a multitude of decision trees [35,36]. The weka.classifiers.trees.RandomForest method was used.
- (4)
- M5P (M5P): This is a decision tree algorithm for solving regression problems using the separate-and-conquer approach. In each iteration, it builds a model tree using M5P and makes the “best” leaf into a rule [37,38]. The weka.classifiers.trees.M5P method was used.
The performances of these four datamining methods were measured by MAE using the formula
(Y: real helpfulness, predictive helpfulness, n: the number of records in a test dataset)
Lastly, the MAE results were compared with each other using repeated-measure ANOVA. In other words, MAE results for each fold of a method were compared with the corresponding fold for the other methods in 10-fold cross validation results. The results of Step 4 are presented in Section 4.3.
The whole procedure of this research explained above are breifly summarized in Figure 5.
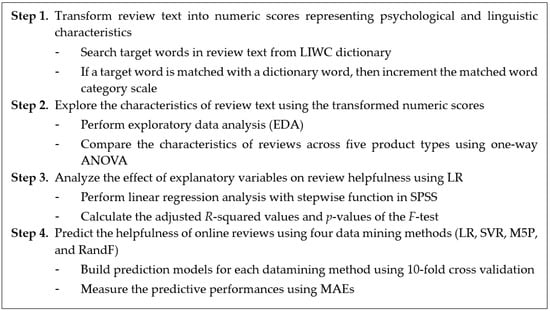
Figure 5.
Overall procedure of this research.
4. Results and Discussion
4.1. Review Characteristics According to Product Type
Our first research question was concerned with whether review characteristics varied across different product types, and if so, how they were different. The averages of review characteristics were explored, and one-way ANOVA was performed to examine the differences, as presented in Table 5. The ANOVA result shows that all research variables are significantly different at the 95% confidence interval across the five product types. In Figure 6, we also graphically illustrated the averages of some variables having similar scale to compare them conveniently. The distinctive results according to product types can be interpreted as follows. Product reviews for the cellphone category (345 words) are found to be the longest among the five product types based on WC, and approximately triple the length of reviews for video products (103 words). Moreover, WPS (22.233) and Analytic (65.447) for cellphone are the highest. This means that the reviews for cellphones are composed of lengthy and analytical sentences. This phenomenon may occur since reviewers may require more words to write reviews containing analytical expressions for complex and hi-technology cellphone products. The level of Clout shows the highest score (44.037) for video, but the lowest score (27.531) for beauty. On the other hand, the Authentic and Compare scores showed the opposite results. Reviews for beauty have the highest Authentic (53.836) and Compare (2.998) scores, while video has the lowest Authentic (30.735) and Compare (2.232) scores. In other words, product reviews for video tend to be written in an expert manner, whereas those of beauty are written authentically, with many comparative expressions. Additionally, CogProc (12.454) and Percept (5.211) scores for beauty were the highest among the five product types. For Percept, this is expected because reviewers may use many sensory-based expressions such as “looked”, “heard”, or “feeling” for beauty, the quality of which is evaluated based on senses. On the other hand, the results of CogProc are surprising, since reviews for cellphones are expected to include more cognitive process than those for beauty. This may be due to functional cosmetic products, however, further research is needed to analyze this result. The PosEmo (positive emotions) contained in reviews for clothing were the highest (4.479), whereas those for cellphones were the lowest (3.424). The NegEmo (negative emotions) contained in reviews for video were the highest, whereas those for clothing were the lowest (0.976). In other words, reviews for electronic and digital products tend to be written more critically than the other product types.
Table 5.
Descriptive statistics and comparison of the average scores for review characteristics across product types.
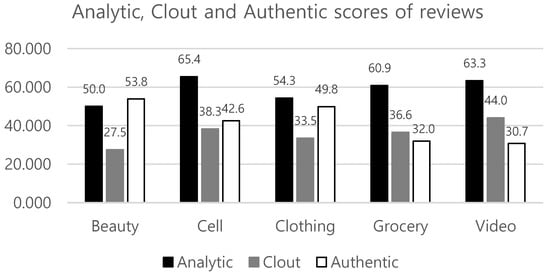
Figure 6.
Average scores of Analytic, Clout, and Authentic across product types.
In conclusion, as seen in the previous results, reviews for different product types have different characteristics, thus it would be necessary to analyze review helpfulness for each product type separately.
4.2. Factors Determining Review Helpfulness
Our second research question was related to identifying the determinant factors in the perceived helpfulness of reviews depending on their product type. We performed a preliminary correlation analysis to check the linear relationships between the explanatory variables and the dependent variable, review helpfulness, as presented in Table 6. It was found that all explanatory variables were significant for more than one product category at the 95% confidence interval. However, Pearson’s correlation coefficients for Authentic, Compare, and Percept ranged between −0.1 and 0.1 for all product types, which means there was almost no linear relationship between Authentic, Compare, and Percept and review helpfulness. In this research, we did not remove any of the explanatory variables, because even though their correlation coefficients were small, they were statistically significant and there may have been non-linear relationships between them and review helpfulness.
Table 6.
Results of the correlation analysis.
Next, regression analysis was performed to examine the explanatory variables affecting the review helpfulness for each product category. Table 7 shows the detail regression result for the beauty category. Because there were five different regression models for each product type, we summarized the results for the sake of brevity, as presented in Table 8. In Table 8, the standard coefficients of the explanatory variables which are statistically significant are marked as * for all datasets.
Table 7.
Regression result for beauty products.
Table 8.
Summary regression results.
For all product types, Rating, WC, and Analytic have a positive effect on review helpfulness. In other words, a review with a high rating score, comprising many words, and being highly analytical, is perceived as helpful to their readers for all the five datasets, while the other variables only influence the review helpfulness for some product types. Clout has a negative effect on helpfulness for the grocery dataset; however, it has a positive effect on the video dataset, which means that reviews with a high level of expertise and confidence are perceived to be more helpful for video products, whereas such reviews negatively affect helpfulness in the case of grocery dataset. Authentic only affects the review helpfulness for cellphone products, and WPS only influences clothing. That is, a reviews containing more honest, personal, and disclosing expressions are perceived as more helpful only for cellphone products, and reviews comprising concise sentences are perceived as more helpful only for clothing products. Similarly, Percept, which has expressions such as “looking”, “hearing”, and “feeling”, positively affects the review helpfulness only for beauty products. In the beauty and clothing datasets, reviews with more comparative expressions tend to be perceived as more helpful. PosEmo and NegEmo also affect review helpfulness. PosEmo has a positive relationship with helpfulness for the beauty category, and NegEmo has a negative relationship with helpfulness for the cellphone and clothing categories. CogProc has a negative effect on helpfulness for the beauty category; however, its effect is the opposite for cellphone and video categories.
In short, not only the conventional explanatory variables, such as Rating, WC, WPS, PosEmo and NegEmo, but also the novel variables used in this research, such as Analytic, Clout, Authentic, Compare, CogProc, and Percept, have a significant influence on review helpfulness. In particular, Analytic affects the review helpfulness for all five datasets, and the others partially influence the review helpfulness for some product types, according to their characteristics.
Adjusted R-square values of the regression models range from 0.135 to 0.388. The p-value for the F-test is less than 0.001 for all datasets; thus, the five regression models are significant overall.
4.3. Prediction Results of Review Helpfulness Using Datamining Methods
In this section, the prediction results of the four data mining methods (SVR, LR, RandF, and M5P) are examined and the results of their comparison are presented. The detailed MAE results of the four methods for each fold are presented in Table A1, Table A2, Table A3, Table A4 and Table A5 in the Appendix; they are arranged sequentially for the beauty, cellphone, clothing, grocery, and video datasets. To graphically compare the results of these four data mining methods, we depict the results for beauty products in Figure 7. The results show that the SVR method performs the best, producing the smallest MAE among the four methods. Likewise, the SVR method performs the best among the four methods for the other four datasets as well, as presented in Table A2, Table A3, Table A4 and Table A5.
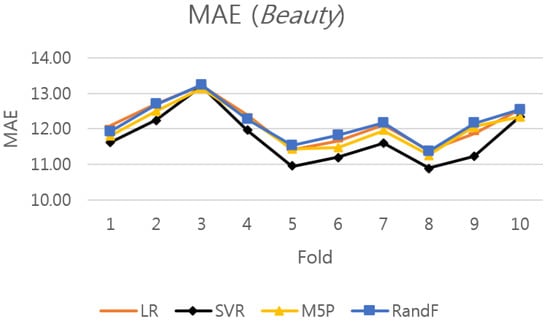
Figure 7.
Performance of the four data mining methods for the 10 folds of the beauty dataset.
To compare the overall results more efficiently, the average MAE of each data mining method is calculated and ranked, as presented in Table 9. The results indicate that the SVR method produces the most accurate predictive results among the four data mining methods across all five datasets, and the M5P method produces the second-best results.
Table 9.
Rank-ordered MAE for each data mining method and repeated-measure ANOVA results.
In order to verify whether the differences in MAEs across the four data mining methods are statistically significant, repeated-measure ANOVA was performed. The null hypothesis in the ANOVA is that there is no difference in the average MAEs, and the alternative hypothesis is that they are not all equal. As presented in Table 9, the p-values indicate that the differences among the data mining methods are statistically significant for four out of the five datasets (beauty, clothing, grocery, and video) at the 95% confidence interval and they are statistically insignificant for the cellphone dataset.
Furthermore, we examined the MAE results of the best-performing SVR, which statistically outperforms the other methods, by performing the paired t-test. Even though ANOVA can statistically compare the results among the four data mining methods, it does not imply that SVR statistically outperforms the others. Thus, the paired t-tests between SVR and the other methods were also examined. The results show that SVR statistically outperforms the other methods in 7 out of 15 comparisons at the 95% confidence interval, as presented in Table 10. Conclusively, based on the previous experimental results, SVR would be the most desirable method among the four datamining methods for predicting review helpfulness.
Table 10.
Overview of the paired t-test results.
Finally, the estimated results of helpfulness using the SVR method for sample reviews having no votes are presented in Figure 8. Although these reviews do not have manual votes, the SVR model can predict their helpfulness automatically and these prediction results can be gainfully used for reordering the reviews.
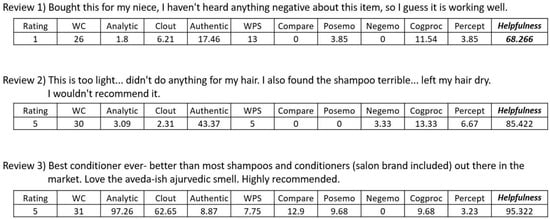
Figure 8.
Estimated helpfulness using the SVR method for sample reviews having no votes.
5. Conclusions and Future Work
In this paper, three research questions were examined. First, we examined the psychological, as well as linguistic characteristics, embedded in product reviews across five different product types, and showed how they were different. The reviews for the cellphone product category were found to be the longest and most analytical among the five product types. The reviews for video products were the most professional and confident, but the least authentic. The reviews for beauty products were the most authentic, while the least analytical. Moreover, they contained the most comparison expressions, cognitive process words and perceptual expressions. We demonstrated that the differences in review characteristics among the five product types were statistically significant at the 95% confidence interval. Second, the determinant factors for each product category were explored. The results showed that rating, word count, and analytical thinking affect the review helpfulness for all five product types; however, positive/negative emotions, comparative expressions, cognitive process words, and perceptual process words influence the review helpfulness for only some product types. Finally, among the four widely used data mining methods, the method that best predicted review helpfulness was determined. The results showed that the support vector regression (SVR) performs the best for all data types. This study would help online customers efficiently access helpful reviews, even when reviews have only a few or no manual votes.
There are several limitations of this study. First, we did not verify the reliability and validity of the review characteristics extracted by LIWC. Although the reliability and validity of LIWC have been investigated in prior research, whether LIWC works well for analyzing review text must be further studied. Second, we chose five different products in the present study without broadly categorizing them into groups such as hedonic vs. utilitarian or experience vs. search products. Even though some product groups have been changed in the e-commerce era and the boundary between them has become obscured, analyzing reviews according to these product groups would be still meaningful. Finally, we implemented the experiments using only Amazon.com datasets. In order to get more general results, we would like to expand this study by obtaining datasets from other e-business companies.
There are several possible future works related to this study. First, providing personalized reviews for each customer considering his/her preferences can be an interesting research topic. Second, comparing review characteristics written in social media with reviews posted on online shopping malls would be a prospective future work, since social media has become increasingly an important marketing channel spreading e-WOM [39]. Lastly, customer reviews can be analyzed based on several different methods and combining them using grey systems theory [40] could be useful for future research.
Funding
This study was supported by the research program funded by the SeoulTech (Seoul National University of Science and Technology).
Conflicts of Interest
The author declares no conflict of interest.
Appendix A
Table A1.
Average MAEs of employing the data mining methods for each fold (beauty).
Table A1.
Average MAEs of employing the data mining methods for each fold (beauty).
| Fold | Data # | LR | SVR | M5P | RandF |
|---|---|---|---|---|---|
| 0 | 836 | 12.0820 | 11.6135 | 11.7944 | 11.9215 |
| 1 | 836 | 12.7120 | 12.2497 | 12.4989 | 12.6919 |
| 2 | 836 | 13.2242 | 13.1854 | 13.1315 | 13.2427 |
| 3 | 836 | 12.3903 | 11.9664 | 12.3084 | 12.2743 |
| 4 | 836 | 11.4204 | 10.9451 | 11.4255 | 11.5257 |
| 5 | 836 | 11.6658 | 11.1959 | 11.4729 | 11.8278 |
| 6 | 836 | 12.1031 | 11.5863 | 11.9537 | 12.1718 |
| 7 | 835 | 11.3936 | 10.8911 | 11.2587 | 11.3696 |
| 8 | 835 | 11.8692 | 11.2281 | 12.0592 | 12.1587 |
| 9 | 835 | 12.5354 | 12.3415 | 12.3263 | 12.5452 |
| Average | 12.1396 | 11.7203 | 12.0229 | 12.1729 | |
| (Std. Dev) | (0.5567) | (0.6862) | (0.5414) | (0.5300) |
Table A2.
Average MAEs of employing the data mining methods for each fold (Cellphone).
Table A2.
Average MAEs of employing the data mining methods for each fold (Cellphone).
| Fold | Data # | LR | SVR | M5P | RandF |
|---|---|---|---|---|---|
| 0 | 520 | 12.5359 | 11.1354 | 12.1070 | 12.0818 |
| 1 | 520 | 13.2352 | 11.5486 | 12.5098 | 12.8459 |
| 2 | 520 | 11.8478 | 10.4736 | 11.7598 | 11.9244 |
| 3 | 520 | 11.2427 | 10.3240 | 10.6372 | 10.7557 |
| 4 | 520 | 12.6055 | 11.8700 | 12.2581 | 12.8158 |
| 5 | 520 | 11.7116 | 11.5203 | 11.8930 | 11.9088 |
| 6 | 520 | 12.6367 | 11.9216 | 12.4486 | 12.4628 |
| 7 | 520 | 11.6525 | 12.1916 | 11.8303 | 11.9767 |
| 8 | 520 | 12.4423 | 13.3505 | 12.2984 | 12.4866 |
| 9 | 520 | 12.8362 | 12.9721 | 12.6732 | 12.8100 |
| Average | 12.2746 | 11.7308 | 12.0415 | 12.2068 | |
| (Std.dev) | 0.5938 | 0.9178 | 0.5495 | 0.6025 |
Table A3.
Average MAEs of employing the data mining methods for each fold (clothing).
Table A3.
Average MAEs of employing the data mining methods for each fold (clothing).
| Fold | Data # | LR | SVR | M5P | RandF |
|---|---|---|---|---|---|
| 0 | 751 | 9.8365 | 9.5695 | 9.8050 | 9.6974 |
| 1 | 751 | 9.5054 | 9.5225 | 9.3553 | 9.6078 |
| 2 | 750 | 9.0600 | 8.3580 | 8.8952 | 9.1874 |
| 3 | 750 | 9.1818 | 8.6497 | 8.9937 | 9.4431 |
| 4 | 750 | 9.7132 | 9.1588 | 9.7762 | 10.0726 |
| 5 | 750 | 9.3782 | 8.7390 | 9.3870 | 9.6297 |
| 6 | 750 | 8.2561 | 7.4258 | 8.0411 | 8.4316 |
| 7 | 750 | 9.4463 | 8.8855 | 9.3704 | 9.6762 |
| 8 | 750 | 8.9833 | 7.8892 | 8.9548 | 9.1500 |
| 9 | 750 | 8.8458 | 8.1802 | 9.0928 | 9.5963 |
| Average | 9.2207 | 8.6378 | 9.1671 | 9.4492 | |
| (Std.dev) | 0.4397 | 0.6566 | 0.4822 | 0.4213 |
Table A4.
Average MAEs of employing the data mining methods for each fold (grocery).
Table A4.
Average MAEs of employing the data mining methods for each fold (grocery).
| Fold | Data # | LR | SVR | M5P | RandF |
|---|---|---|---|---|---|
| 0 | 586 | 13.8986 | 14.2439 | 13.4640 | 13.9866 |
| 1 | 585 | 13.6954 | 13.4277 | 13.2228 | 13.2893 |
| 2 | 585 | 13.4438 | 13.2304 | 12.9410 | 13.1115 |
| 3 | 585 | 12.0219 | 11.7364 | 11.9728 | 12.0896 |
| 4 | 585 | 14.4767 | 13.8730 | 14.0294 | 14.2847 |
| 5 | 585 | 13.2147 | 12.3069 | 13.2147 | 13.3313 |
| 6 | 585 | 11.9302 | 10.7235 | 11.8649 | 12.0930 |
| 7 | 585 | 12.6908 | 11.8275 | 12.3122 | 12.7311 |
| 8 | 585 | 13.3153 | 12.6267 | 13.2127 | 13.6465 |
| 9 | 585 | 14.2575 | 13.8538 | 14.4272 | 14.5736 |
| Average | 13.2945 | 12.7850 | 13.0662 | 13.3137 | |
| (Std.dev) | 0.8200 | 1.0764 | 0.7892 | 0.8040 |
Table A5.
Average MAEs employing the data mining methods for each fold (video).
Table A5.
Average MAEs employing the data mining methods for each fold (video).
| Fold | Data # | LR | SVR | M5P | RandF |
|---|---|---|---|---|---|
| 0 | 1494 | 20.7592 | 20.2875 | 20.6702 | 20.9268 |
| 1 | 1494 | 21.2397 | 20.7469 | 21.1785 | 21.5217 |
| 2 | 1494 | 21.9531 | 21.6277 | 21.8754 | 21.9022 |
| 3 | 1494 | 21.6837 | 21.3527 | 21.3362 | 21.5131 |
| 4 | 1494 | 18.7974 | 18.0692 | 18.5636 | 19.0017 |
| 5 | 1494 | 19.9168 | 19.2861 | 19.5705 | 20.0399 |
| 6 | 1494 | 19.5824 | 19.5126 | 19.2674 | 19.5827 |
| 7 | 1494 | 19.7675 | 20.4105 | 19.4794 | 19.4520 |
| 8 | 1494 | 18.8761 | 18.4220 | 18.6284 | 19.5134 |
| 9 | 1494 | 18.9859 | 19.2449 | 18.8067 | 19.0826 |
| Average | 20.1562 | 19.8960 | 19.9376 | 20.2536 | |
| (Std.dev) | 1.1177 | 1.1276 | 1.1603 | 1.0484 |
References
- Mudambi, S.M.; Schuff, D. What makes a helpful online review? A study of customer reviews on Amazon.com. MIS Q. 2010, 34, 185–200. [Google Scholar] [CrossRef]
- Cao, Q.; Duan, W.; Gan, Q. Exploring determinants of voting for the ‘helpfulness’ of online user reviews: A text mining approach. Decis. Support Syst. 2011, 50, 511–521. [Google Scholar] [CrossRef]
- Yin, D.; Bond, S.; Zhang, H. Anxious or angry? Effects of discrete emotions on the perceived helpfulness of online reviews. MIS Q. 2014, 38, 539–560. [Google Scholar] [CrossRef]
- Kim, S.M.; Pantel, P.; Chklovski, T.; Pennacchiotti, M. Automatically assessing review helpfulness. In Proceedings of the 2006 Conference on Empirical Methods in Natural Language Processing, Sydney, Australia, 22–23 July 2006; pp. 423–430. [Google Scholar]
- Yang, Y.; Yan, Y.; Qiu, M.; Bao, F. Semantic analysis and helpfulness prediction of text for online product reviews. In Proceedings of the 53rd Annual Meeting of the Association for Computational Linguistics and the 7th International Joint Conference on Natural Language Processing, Beijing, China, 26–31 July 2015; pp. 38–44. [Google Scholar]
- McAuley, J.; Leskovec, J. Hidden factors and hidden topics: Understanding rating dimensions with review text. In Proceedings of the 7th ACM Conference on Recommender Systems, RecSys’, Hong Kong, China, 12–16 October 2013; pp. 165–172. [Google Scholar]
- Pan, Y.; Zhang, J.Q. Born unequal: A study of the helpfulness of user-generated product reviews. J. Retail. 2011, 87, 598–612. [Google Scholar] [CrossRef]
- Korfiatis, N.; Garcia-Bariocanal, E.; Sanchez-Alonso, S. Evaluating Content Quality and Helpfulness of Online Product Reviews: The Interplay of Review Helpfulness vs. Review Content. Electron. Commer. Res. Appl. 2012, 11, 205–217. [Google Scholar] [CrossRef]
- Ghose, A.; Ipeirotis, P.G. Estimating the helpfulness and economic impact of product reviews: Mining text and reviewer characteristics. IEEE Trans. Knowl. Data Eng. 2011, 23, 1498–1512. [Google Scholar] [CrossRef]
- Forman, C.; Ghose, A.; Wiesenfeld, B. Examining the relationship between reviews and sales: The role of reviewer identity disclosure in electronic markets. Inf. Syst. Res. 2008, 19, 291–313. [Google Scholar] [CrossRef]
- Krishnamoorthy, S. Linguistic features for review helpfulness prediction. Expert Syst. Appl. 2015, 42, 3751–3759. [Google Scholar] [CrossRef]
- Martin, L.; Pu, P. Prediction of helpful reviews using emotions extraction. In Proceedings of the 28th AAAI Conference on Artificial Intelligence, Québec City, QC, Canada, 27–31 July 2014. No. EPFL-CONF-210749. [Google Scholar]
- Chevalier, J.A.; Mayzlin, D. The effect of word of mouth on sales: Online book reviews. J. Mark. Res. 2006, 43, 345–354. [Google Scholar] [CrossRef]
- Kuan, K.K.; Hui, K.L.; Prasarnphanich, P.; Lai, H.Y. What makes a review voted? An empirical investigation of review voting in online review systems. J. Assoc. Inf. Syst. 2015, 16, 48–71. [Google Scholar] [CrossRef]
- Sen, S.; Lerman, D. Why are you telling me this? An examination into negative consumer reviews on the web. J. Interact. Mark. 2007, 21, 76–94. [Google Scholar] [CrossRef]
- Willemsen, L.M.; Neijens, P.C.; Bronner, F.; De Ridder, J.A. “Highly recommended!” The content characteristics and perceived usefulness of online consumer reviews. J. Comput. Mediat. Commun. 2011, 17, 19–38. [Google Scholar] [CrossRef]
- Ahmad, S.N.; Laroche, M. How do expressed emotions affect the helpfulness of a product review? Evidence from reviews using latent semantic analysis. Int. J. Electron. Commer. 2015, 20, 76–111. [Google Scholar] [CrossRef]
- Otterbacher, J. ‘Helpfulness’ in online communities: A measure of message quality. In Proceedings of the SIGCHI Conference on Human Factors in Computing Systems, Boston, MA, USA, 4–9 April 2009; pp. 955–964. [Google Scholar]
- Luan, J.; Yao, Z.; Zhao, F.; Liu, H. Search product and experience product online reviews: An eye-tracking study on consumers’ review search behavior. Comput. Hum. Behav. 2016, 65, 420–430. [Google Scholar] [CrossRef]
- Park, Y.-J.; Kim, K.-J. Impact of semantic characteristics on perceived helpfulness of online reviews. J. Intell. Inf. Syst. 2017, 23, 29–44. [Google Scholar]
- Zhang, Z. Weighing stars: Aggregating online product reviews for intelligent e-commerce applications. IEEE Intell. Syst. 2008, 23, 42–49. [Google Scholar] [CrossRef]
- Hu, Y.H.; Chen, K. Predicting hotel review helpfulness: The impact of review visibility, and interaction between hotel stars and review ratings. Int. J. Inf. Manag. 2016, 36, 929–944. [Google Scholar] [CrossRef]
- Witten, I.H.; Frank, E.; Hall, M.A.; Pal, C.J. Data Mining: Practical Machine Learning Tools and Techniques; Morgan Kaufmann: Burlington, MA, USA, 2016. [Google Scholar]
- O’Mahony, M.P.; Smyth, B. Learning to recommend helpful hotel reviews. In Proceedings of the 3rd ACM Conference on Recommender Systems, RecSys’, New York, NY, USA, 23–25 October 2009; pp. 305–308. [Google Scholar]
- Pennebaker, J.W.; Booth, R.J.; Francis, M.E. Linguistic Inquiry and Word Count (LIWC2007); LIWC: Austin, TX, USA, 2007; Available online: http://www.liwc.net (accessed on 27 April 2018).
- Tausczik, Y.R.; Pennebaker, J.W. The psychological meaning of words: LIWC and computerized text analysis methods. J. Lang. Soc. Psychol. 2010, 29, 24–54. [Google Scholar] [CrossRef]
- Pennebaker, J.W.; Francis, M.E. Cognitive, emotional, and language processes in disclosure. Cogn. Emot. 1996, 10, 601–626. [Google Scholar] [CrossRef]
- Pennebaker, J.W.; Boyd, R.L.; Jordan, K.; Blackburn, K. The Development and Psychometric Properties of LIWC2015. Available online: http://hdl.handle.net/2152/31333 (accessed on 27 April 2018).
- Hu, N.; Koh, N.S.; Reddy, S.K. Ratings lead you to the product, reviews help you clinch it? The mediating role of online review sentiments on product sales. Decis. Support Syst. 2014, 57, 42–53. [Google Scholar] [CrossRef]
- Pennebaker, J.W.; Chung, C.K.; Frazee, J.; Lavergne, G.M.; Beaver, D.I. When small words foretell academic success: The case of college admissions essays. PLoS ONE 2014, 9, e115844. [Google Scholar] [CrossRef] [PubMed]
- Kacewicz, E.; Pennebaker, J.W.; Davis, M.; Jeon, M.; Graesser, A.C. Pronoun use reflects standings in social hierarchies. J. Lang. Soc. Psychol. 2013, 33, 125–143. [Google Scholar] [CrossRef]
- Newman, M.L.; Pennebaker, J.W.; Berry, D.S.; Richards, J.M. Lying words: Predicting deception from linguistic style. Personal. Soc. Psychol. Bull. 2003, 29, 665–675. [Google Scholar] [CrossRef] [PubMed]
- Auria, L.; Moro, R.A. Support Vector Machines (SVM) as a Technique for Solvency Analysis; DIW Berlin Discussion Paper; Deutsches Institut für Wirtschaftsforschung (DIW): Berlin, Germany, 2008. [Google Scholar]
- Park, Y.-J.; Kim, B.-C.; Chun, S.-H. New knowledge extraction technique using probability for case-based reasoning: Application to medical diagnosis. Expert Syst. 2006, 23, 2–20. [Google Scholar] [CrossRef]
- Ho, T.K. Random decision forests. In Proceedings of the 3rd International Conference on Document Analysis and Recognition, Montreal, QC, Canada, 14–15 August 1995; pp. 278–282. [Google Scholar]
- Breiman, L. Random Forests. Mach. Learn. 2001, 45, 5–32. [Google Scholar] [CrossRef]
- Quinlan, R.J. Learning with continuous classes. In Proceedings of the 5th Australian Joint Conference on Artificial Intelligence, Singapore, 16–18 November 1992; pp. 343–348. [Google Scholar]
- Wang, Y.; Witten, I.H. Induction of Model Trees for Predicting Continuous Classes. Available online: https://researchcommons.waikato.ac.nz/handle/10289/1183 (accessed on 25 May 2018).
- Mikalef, P.; Giannakos, M.; Pateli, A. Shopping and word-of-mouth intentions on social media. J. Theor. Appl. Electron. Commer. Res. 2013, 8, 17–34. [Google Scholar] [CrossRef]
- Julong, D. Introduction to grey system theory. J. Grey Syst. 1989, 1, 1–24. [Google Scholar]
© 2018 by the author. Licensee MDPI, Basel, Switzerland. This article is an open access article distributed under the terms and conditions of the Creative Commons Attribution (CC BY) license (http://creativecommons.org/licenses/by/4.0/).