Article

How Does Organizational Citizenship Behavior (OCB) Affect the performance of megaprojects? Insights from a System Dynamic Simulation

1
Research Institute of Complex Engineering & Management, School of Economics and Management, Tongji University, Shanghai 200092, China
2
Department of Building, School of Design and Environment, National University of Singapore, Singapore 117566, Singapore
3
School of Construction Management and Real Estate, Henan University of Economics and Law, Zhengzhou 450000, China
*
Author to whom correspondence should be addressed.
Sustainability 2018, 10(6), 1708; https://doi.org/10.3390/su10061708
Submission received: 9 May 2018 / Revised: 18 May 2018 / Accepted: 21 May 2018 / Published: 24 May 2018
(This article belongs to the Special Issue Sustainable Development and Management of Mega Projects)

Abstract

:
As one of the emerging research fields of sustainability management, Organizational Citizenship Behavior (OCB), especially its influence on project performance, has been drawing increased attention both in the academic and industrial areas. Nevertheless, existing studies mainly examine the static relationship between OCB and project performance but fail to explore the dynamic characteristic of the relationship as a project may evolve and proceed over the time. Therefore, this paper aims to evaluate the dynamic impacts of OCB on the performance of megaprojects with the assistance of a system dynamic model. Four causal feedback loops and a stock-flow diagram were developed to illustrate the dynamic influencing mechanism, and three distinct policies quantitatively simulated the possible impacts arising from the changes of OCB on the whole system and, specifically, on the performance megaproject. The results show that an increase in the AIRPP (actual increasing rate of potential promotion) exerts significant influence on the improvement in OCB and the performance of megaprojects. The higher the AIRPP in the multi-policy scenario, the higher the OCB and the performance. One major contribution is that this study is one of the first studies to explore the potential use of system dynamics to model megaproject organizational behavior and its performance with implications in both the practical and cultural promotion of OCB.

1. Introduction

Megaprojects are defined as large-scale and complex ventures that typically cost $1 billion or more and take many years to develop and build; these projects generally involve multiple public (national interested) and private stakeholders with transformational impacts on millions of people [1]. Megaprojects are not just magnified versions of smaller projects, but are comprised of interdependent subsystems aiming to achieve a comprehensive socio-economic development [1,2]. Since the early 2000s, megaprojects have become an emerging area in the field of construction project management due to global urbanization, urban revitalization, and redevelopment [3]. However, most megaprojects suffer from obsolete performance such as high risks, cost overruns, and schedule delays.
There are a lot factors that contribute to the variation of the performance of megaprojects. Academic research and industrial practices of megaprojects have shown that, apart from construction technologies and managerial strategies, a high degree of subjective initiatives and creativities is equally important to affect project performance [4,5,6]. For example, participants’ (for example, construction workers) willingness to work in extreme conditions is key to ensure the accomplishment of megaprojects [7]. This kind of phenomenon is a typical behavior known as Organizational Citizenship Behavior (OCB) in the context of megaprojects, referring to the positive behavior of participants in megaprojects, which contributes to the achievement of the construction projects’ goals, but has not been directly or explicitly stipulated in formal contracts [8]. Having originated in the field of organizational behavior, OCBs have been drawing increased attention in the context of construction management and sustainability management [9], particularly in areas such as governance and so forth. Although existing studies have demonstrated that OCB positively contributes to project performance [10], two problems are still found in previous studies. Firstly, most of existing papers have studied the relationship between OCB and project performance from a static and isolated perspective without a systematic consideration to the interrelationships among different influencing factors. Secondly, the existing studies have mainly concentrated on qualitative analyses based on surveys, failing to quantify the impact of OCB on project performance.
Therefore, the aim of this study is to assess the impacts of the OCBs of construction participants (including owners, contractors, and designers) on the performance of megaprojects with the aid of the System Dynamic (SD) approach. The reasons for adopting an SD approach mainly lie in two aspects. Firstly, since there are numbers of elements within the OCB system and their relationships tend to change and are complicated, the SD approach is demonstrated as a well-established method for studying and managing such complex feedback systems [11], and facilitating better understanding on the mutual relationships between the behavior of a system. Secondly, elements in the OCB system are largely interdependent [5]. SD modeling is able to discover and illustrate interrelationships among elements, and to facilitate the measurement of dynamics among elements [12]. In addition, the SD approach is also effective in evaluating the consequences of new policies and new structures [13]. Taking the aforementioned aspects, the SD approach is considered a suitable method to be used for fulfilling the research aims in this study. The proposed model is also expected to help decision-makers better understand how OCB affects the performance of megaprojects. The rest of this paper is organized as follows: Section 2 entails the literature review including the explanation of the concept, dimensions, and driving factors of OCBs. Section 3 introduces SD modeling with a detailed process of model development. Section 4 is the model validation, including the tests for structure verification, dimension consistency, and sensitivity. Section 5 is the policy analysis with a discussion on a base run and three policy scenarios (two single-policy scenarios and one multi-policy scenario). Section 6 concludes the study.

2. Literature Review

OCB was first put forward in the 1980s and defined as “individual behavior that is discretionary, not directly or explicitly recognized by the formal reward system, and that, in the aggregate, promotes the effective functioning of the organization” [14]. Afterwards, OCB attracted the interest of many scholars and many studies were conducted on it. However, there is rather limited literature on OCB in the context of megaprojects. Similar to the definition of OCB in organizational areas, OCB in the megaprojects field can be defined as the positive behaviors of participants that are not recognized by formal contracts or requirements, but would lead to the effective achievement of the project goals [8]. For example, in the South-to-North Water Transfer project, a labor contest (which is a typical practice in China to motivate and improve OCB engagement in the project implement) was held by the local government and all participants in this megaproject were involved. Participants voluntarily competed in the aspects of safety, quality, schedule, innovations, environmental protections, and so on forth [8]. Participants could only win by going beyond the typical requirements and achieving high performance. Meanwhile, winners were only awarded medals, trophies, and so forth, without any compensations [15]. Currently, existing studies have already demonstrated that OCB plays an important role of improving the effectiveness of the management, organizational efficiency, labor productivity, and so forth, and eventually benefits the megaproject on the whole [16].
Although OCBs have been observed in many megaprojects, studies in the context of megaprojects are still limited, especially on the dimensions and driving factors. One of the most presentative studies on the dimensions of OCB is the seven-dimensional model established by Podsakoff [4], which includes helping behavior, sportsmanship, organizational loyalty, organizational compliance, individual initiative, civic virtue, and self-development. However, the research carried out by Podsakoff mentioned above was conducted in permanent organizations which are, in fact, different from temporary organizations like project-based organizations [5,17]. Thus, OCBs in megaprojects would have unique dimensions and motivations [18]. Braun et al. [17] pointed out that no matter the project compliance or individual compliance, its essence is to obey the organization’s regulations and related rules, and the difference between the two kinds of behavior is only the subject that they should be compliant to. The nature of organizational loyalty and sportsmanship behavior are initially individual staff dedicated to their work, namely adhering to the high self-demand, having the initiative to work overtime, and working in extreme conditions voluntarily without any supervision; hence, the two behaviors can be summarized as conscientiousness [5,19]. Civic virtue refers to good interpersonal relationships in organizations, and the core is the maintenance of harmonious relationships [17]. Self-development and individual initiative both mean work completed creatively or improving work skills spontaneously [20]. Thus, these two behaviors can be interpreted as innovation behavior in the megaproject context. Helping behavior means providing direct help for others and taking the initiative to work with colleagues [19,21]. While in megaprojects, Luo et al. [22] believed this kind of behavior should be interpreted as collaboration behavior. Therefore, project compliance behavior, innovation behavior, collaboration behavior, conscientiousness, and harmonious relationship maintenance behavior are summarized as the five dimensions of OCB in this study.
In addition, the driving factors are another sub-topic to be researched in the OCB field, and employee characteristics, task characteristics, leadership behaviors, and organizational characteristics are the most important sort of driving factors for conducting OCB [4]. However, in megaprojects, actually, actions that participants act on are on behalf of the enterprises they belong to; thus, their behavioral motivations are more likely to be significant in sociality, and in the pursuit of long-term interests [10,23,24]. Meanwhile, megaprojects are normally launched and sponsored by governments, that is, participants are mostly state-owned enterprises or other successful enterprises cooperating with the government, especially in mainland China [25]. Hence, by participating in the construction of megaprojects, enterprises are likely to achieve their political appeal. To be specific, executives of state-owned enterprises are more likely to be promoted due to their good performance in megaprojects [1]. Moreover, except for internal factors like the potential promotion mentioned above, the external environment also drives OCB. Practically, the external environment has an important impact on participants’ behavior, such as regulations, project culture, corporate reputation and so forth [26,27,28]. Therefore, as summarized above, the driving factors considered in this study include project culture, potential promotion, corporate reputation, and public satisfaction.

3. Model Development

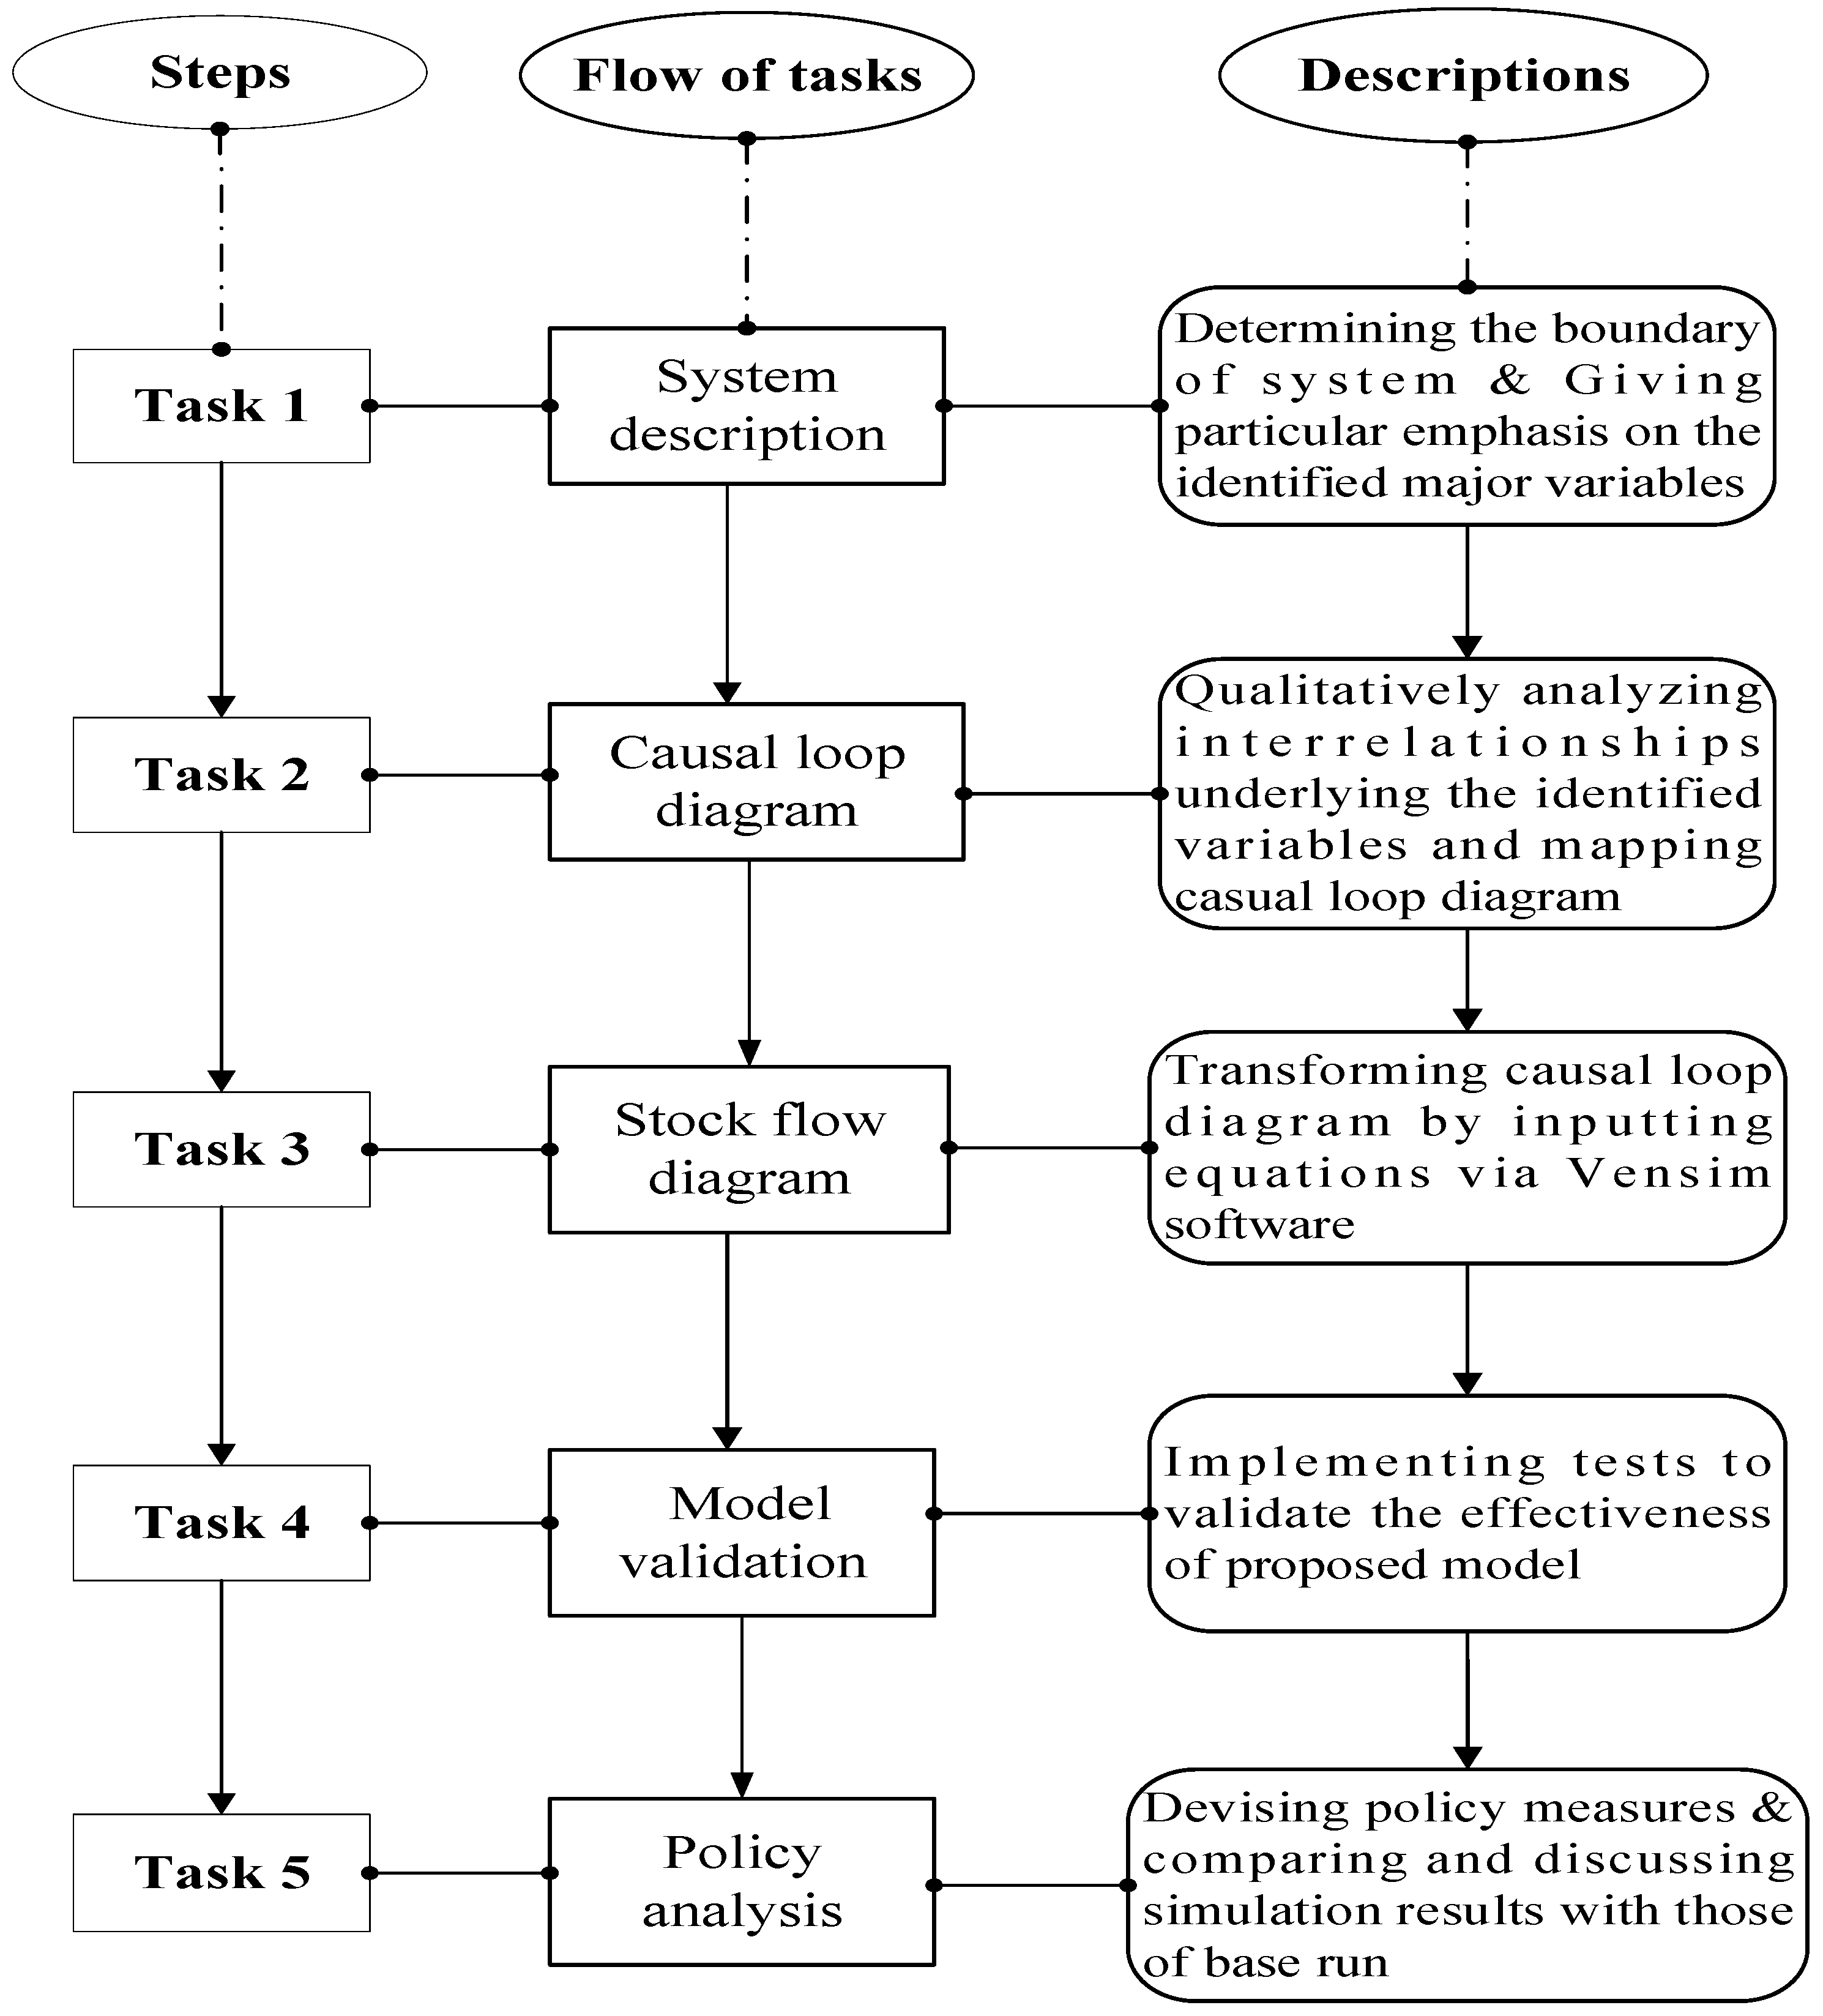
3.1. Steps of Model Development

SD, established by Forest in 1958, designed based on systems thinking, has been widely used in a vast range of disciplines. Over the past two decades, it has been used to address economic, environmental, societal, agricultural, and other systems of great complexity. This method is particularly widely applied to the disciplines of construction activities such as political decision-making systems [29], performance assessment of construction management, and so on forth [30,31]. Generally, an SD model can be visualized by a causal loop diagram or a stock-flow diagram. A causal loop diagram is always developed as a conceptual model of systems to be studied, while a stock-flow diagram is established based on a causal loop diagram and utilizing a computer simulation.
This paper is primarily based on a five-step procedure to construct the model (shown in Figure 1). Firstly, the boundary of the system and variables that can significantly influence the behavior of the system should be identified. Based on that, a causal-loop diagram can be established to describe the system simply. Afterwards, a stock-flow diagram will be developed according to the causal-loop diagram. Furthermore, model validation should start to test the confidence and robustness of the established model. Finally, policy analysis, which mainly consists of a base run simulation and three policy scenarios, would be conducted to simulate and analyze the impacts of the devised management policies after the model validation.

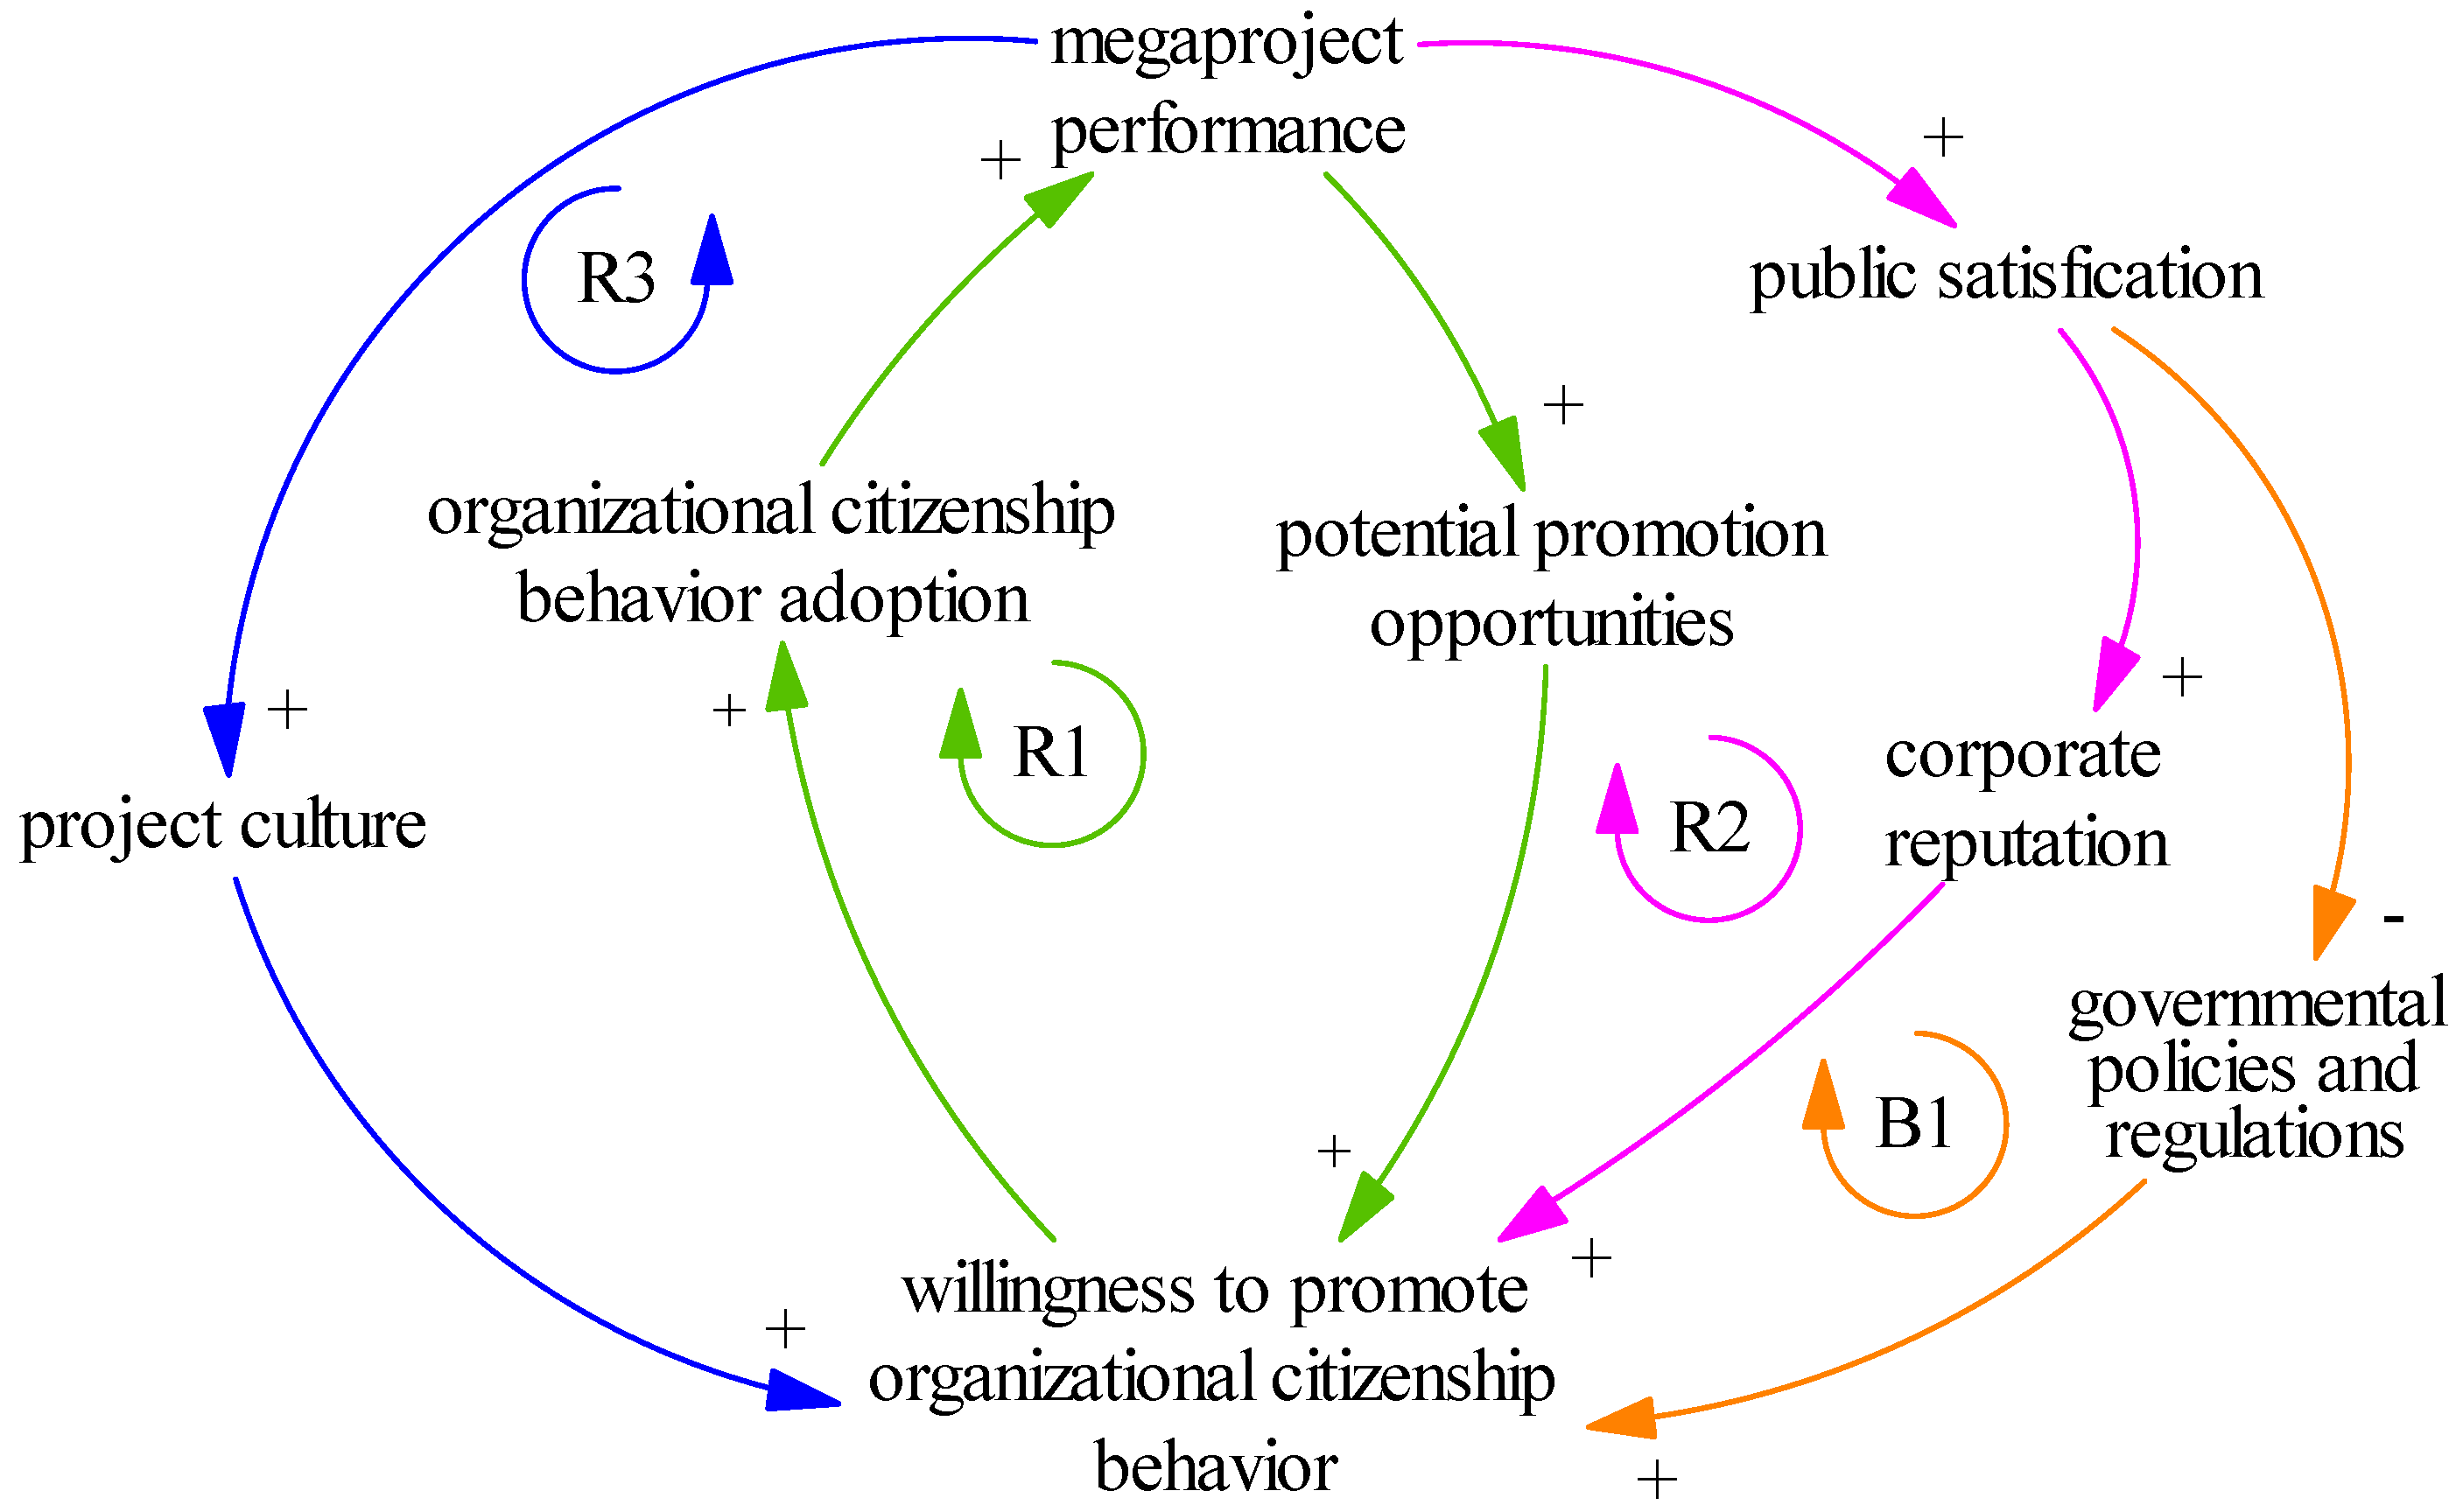
3.2. Causal Loop Diagram

Before the development of a qualitative model, key variables were majorly identified on the basis of the literature (discussed in Section 2). In this study, key variables in the proposed model are mainly two aspects, namely, the identified dimensions of OCB and its driving factors. OCB refers to project compliance behavior, innovation behavior, collaboration behavior, conscientiousness behavior, and harmonious relationship maintenance behavior. Its motivations mainly involve project culture, potential promotion, corporate reputation, and public satisfaction. These variables not only serve as essential units of the model but they define the boundary of the model. Additionally, in the established model, OCB is the only kind of factor that influences the performance of megaprojects, which means the time, budget, and quality in this study. The other factors are out of the scope of this study. After identifying the variables with the potential of influencing the behavior of the proposed system, a qualitative analysis was carried out to identify the interactions among the variables. Figure 2, which consists of four feedback loops that determine the behavior of the system by establishing connections among variables, illustrates the conceptual model of the qualitative analysis.
Positive feedback loop R1: It can be seen from Figure 2 that the OCB adoption would reinforce itself through the positive chain. Suppose that the performance of a megaproject accelerates through the adoption of OCB, bettering the performance of the megaproject during the construction phase. Consequently, considering the relationships between enterprises and the government, the leaders of the megaproject could have a higher potential of promotion [27]. That is, participants in megaprojects are more willing to augment OCB and thereby affect project performance again [32]. Positive feedback loop R2: In this loop, the adoption of OCB could reinforce itself through the feedback chain. Suppose that OCBs accelerate, then the performance of the megaproject will be positively influenced and the public’s satisfaction will be increased [1]. Furthermore, it positively contributes to the corporate reputation and thereby motives participants to increase OCB [28]. Hence, the magnified adoption of OCB will further accelerate the project performance. Positive feedback loop R3: This one shows a similar influence loop as R1. The only difference is that in loop R3, the improvements in the adoption of OCB directly lead to improvements in the project culture [28]. Negative feedback loop B1: In this loop, a change of any variable would affect itself in a negative way. Suppose that there is an increase in the adoption of OCB, then the project performance will be accelerated. As a result, the public’s satisfaction would be improved, which indicates that governmental regulations or policies would decline [27]. Due to reduced willingness to OCB, the adoption of OCB will decrease accordingly.

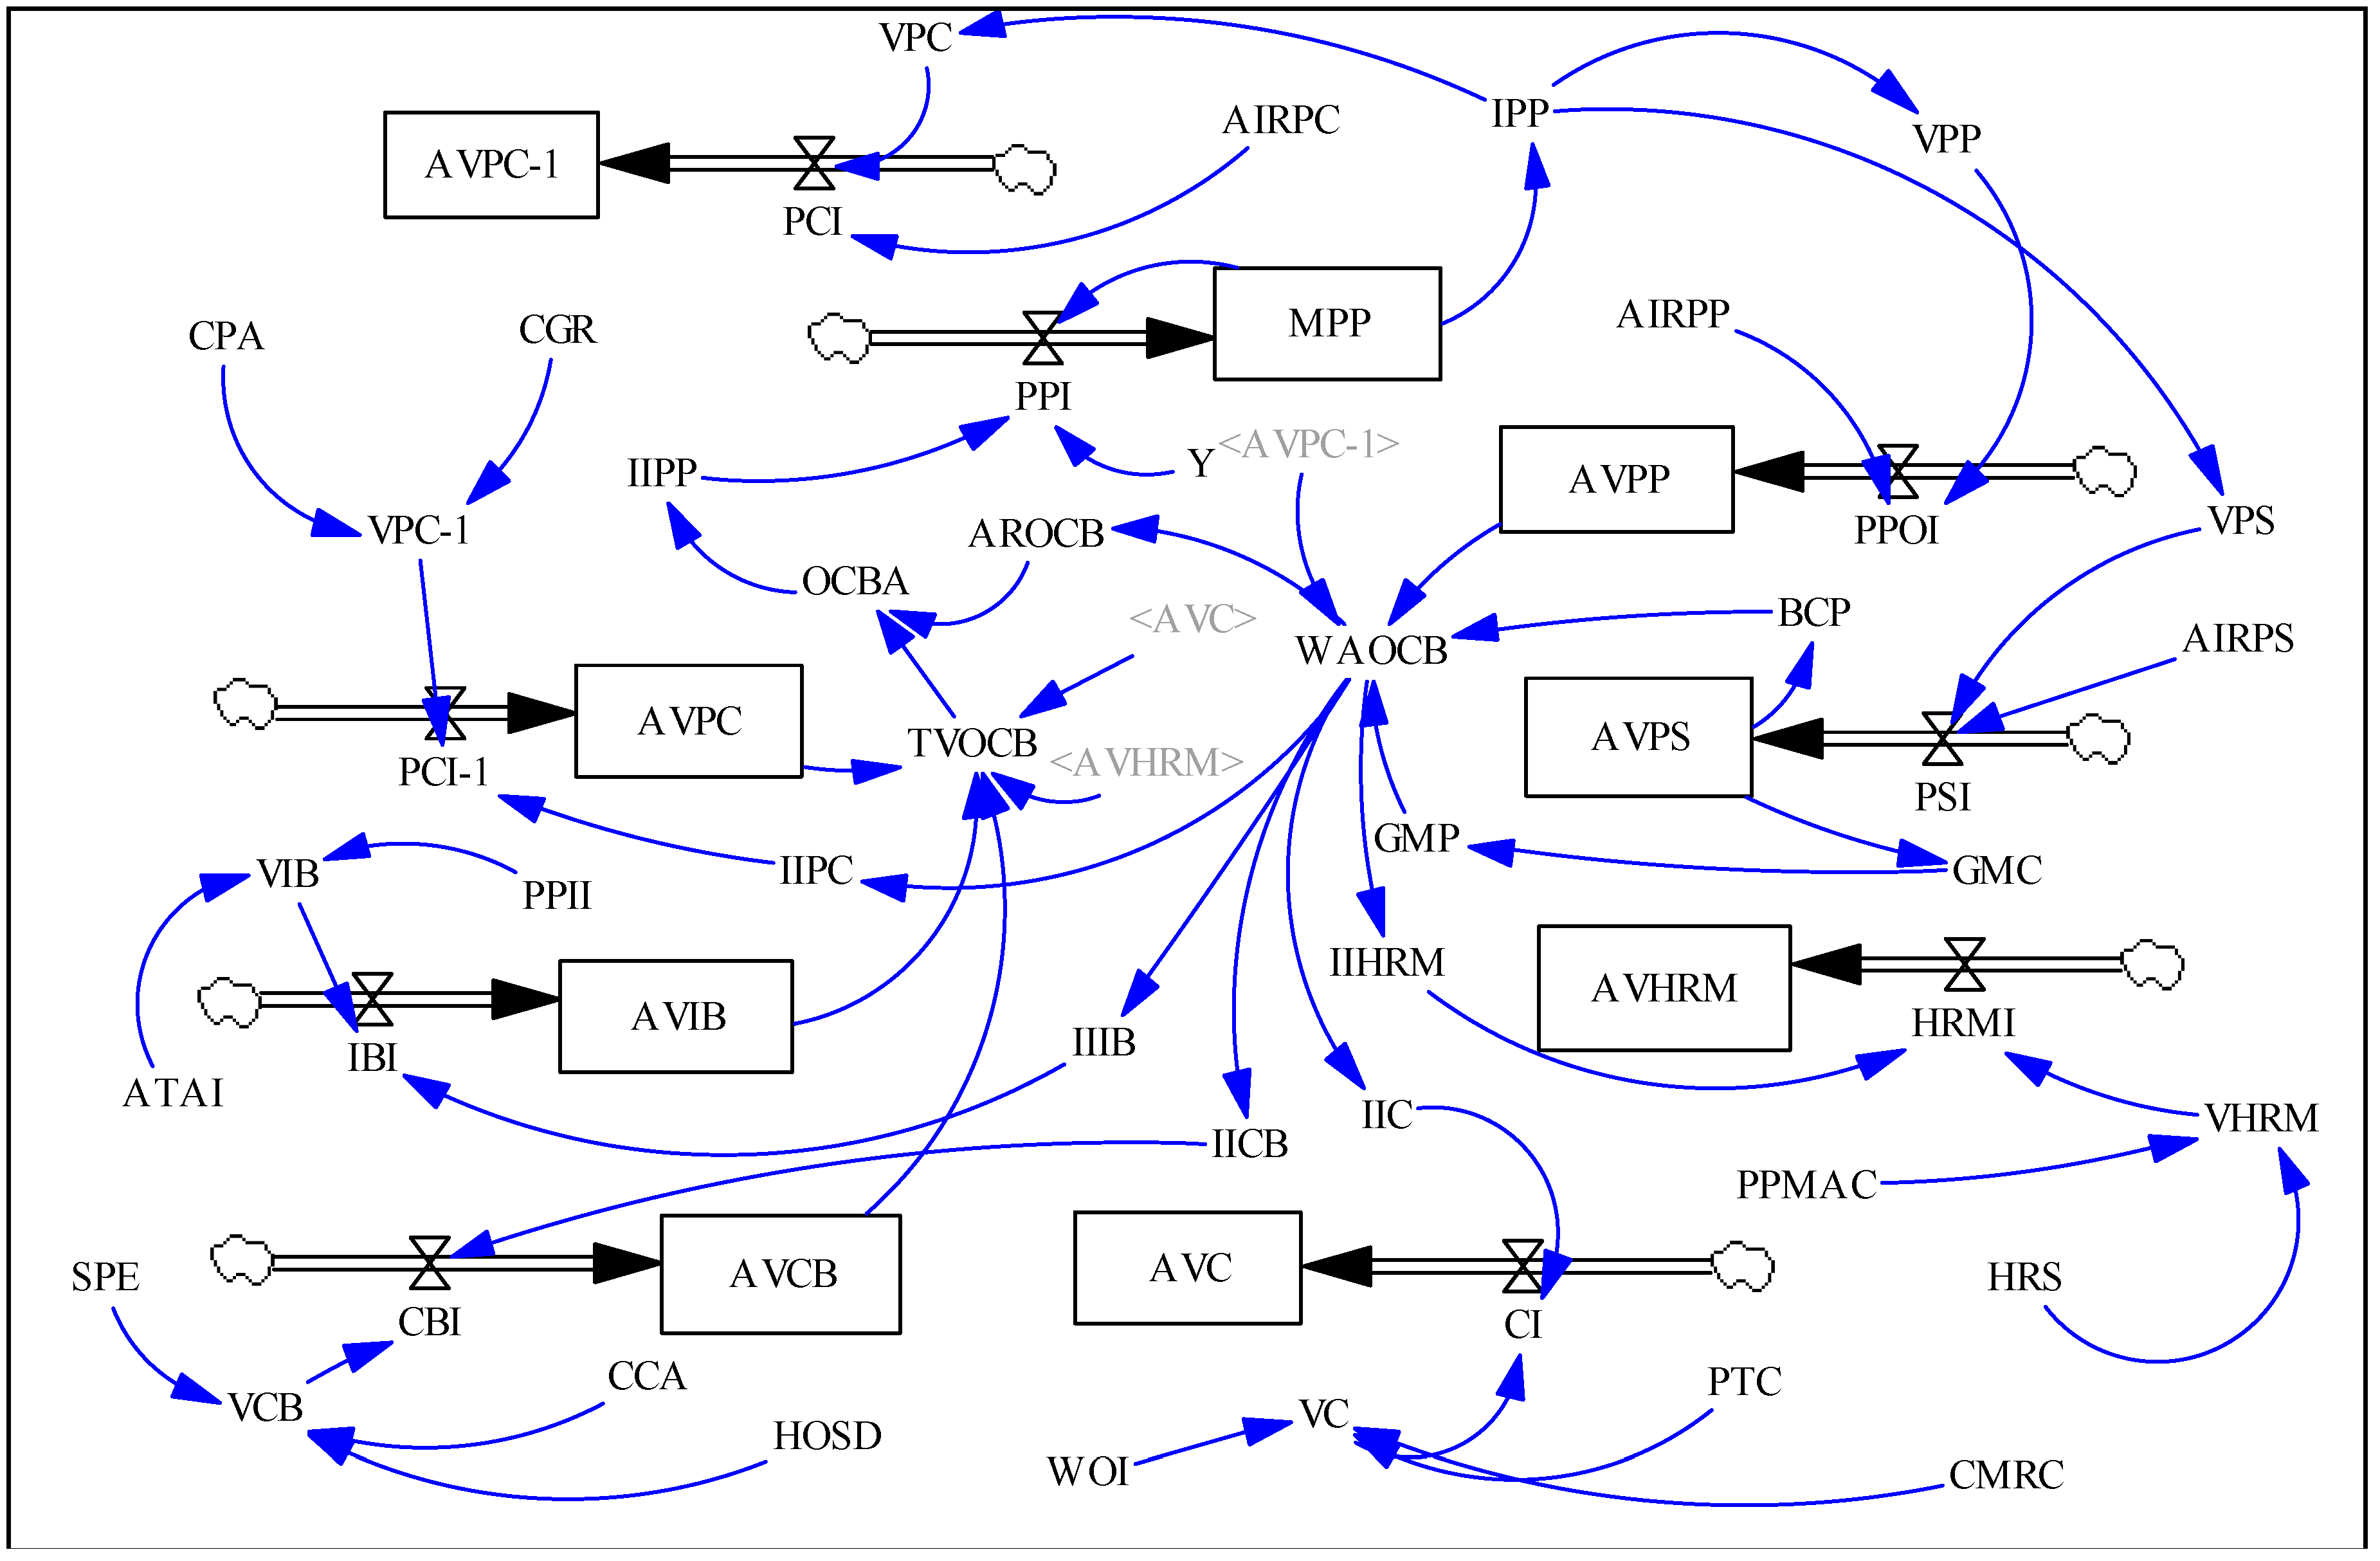
3.3. Stock-Flow Diagram

With the interrelationships underlying the identified variables defined within the causal-loop diagram, a stock-flow diagram was developed to quantify their impacts with the assistance of the Vensim software. A stock-flow diagram is a more detailed illustration of a causal-loop diagram. Furthermore, a stock-flow diagram consists of different kinds of icons so that the computer-based simulation can be run. To facilitate a better understanding, the proposed model, along with brief definitions of the variables within the model, is shown in Figure 3 and Appendix A, respectively.
Prior to performing the simulation, it is necessary to ensure that all the variables in the model can be quantified. The variables used in this model were divided into three categories, namely, constant, dependent, and qualitative variables. Each type of variable has corresponding data sources. The value of the constant variables—which are expected to remain unchanged and will not be affected by other variables during the whole simulation period—were generally quantified by referring to the materials available, such as literature. The values of the dependent variables depend on one or more variables within the model in terms of mathematical functions. The values of these kind of variables can be quantified by various functions in the Vensim software [33]. The values of the qualitative variables were quantified, in this study, by the judgement of experts. To be specific, the expert session was conducted in March 2017 in Shanghai and lasted around 15 min. The expert group consisted of five managers, each with 5 to 10 years of working experience in construction project management. To facilitate understandings in the process of quantification, detailed data and equations related to the established model are shown in Appendix B.

4. Model Validation

Before quantitative simulation and analysis, it is essential to ensure that the validity of the SD model through a series of tests. Tests ensure that the accuracy of the model reflects the real world in a meaningful way [34]. In this part, three typical tests for the SD were selected, namely, a structure verification test (test 1), a dimensional consistency test (test 2), and a sensitivity test (test 3).
Test 1 was to make sure that the structure of the established model is logical and generally supported by the existing literature. This test was conducted by referring back to the causal loop diagram in Figure 2. Obviously, all cause-and-effect chains in the diagram are based on existing studies and acknowledged knowledge. The purpose of test 2 was to ensure that each equation in the model is dimensionally consistent with the use of the parameters [35]. The Vensim software provides users with a test function automatically after all the units of the variables have been determined. Dimensional consistency was correct verified by Vensim in this model. The sensitivity test is the test for understanding how the proposed model will behave if the variables vary over a reasonable range. To be specific, the behavioral sensitivity analysis mainly focuses on identified variables and the rationality of the behavior of the system after adjusting the value of the identified variables [33,36]. This test is regarded as vital to ensure the reliability of the model. Due to the limited size of the paper, only one typical example in relation to the sensitivity of the model was conducted to demonstrate if the behavior of the model reflects the real-world situation. An example in Figure 4 illustrates how the OCBA (organizational citizenship behavior adoption) varies in line with the changes of the AIRPP (actual increasing rate of potential promotion). Five scenarios were designed and simulated in this test, namely, scenario 1 (AIRPP = 0.8, Line 1), scenario 2 (AIRPP = 0.5, Line 2), scenario 3 (AIRPP = 0.2, Line 3), scenario 4 (AIRPP = 0, Line 4), scenario 5 (AIRPP = 0.05, Line 5, the base scenario in the model). Obviously, all curves under the five different scenarios show a similar shape, demonstrating the fact that the larger the AIRPP is, the better the phenomenon of the OCB is. This is in accordance with the findings that political motivations, especially promotion, is an effective instrument for promoting OCB within organizations [24] and that the people who have a higher possibility of being promoted would also have a significantly higher probability of improving their OCB [37]. Therefore, it can be concluded that the established model can properly reflect the outcomes of the changes in variables. Thus, further simulation and policy analysis can be conducted.

5. Policy Analysis

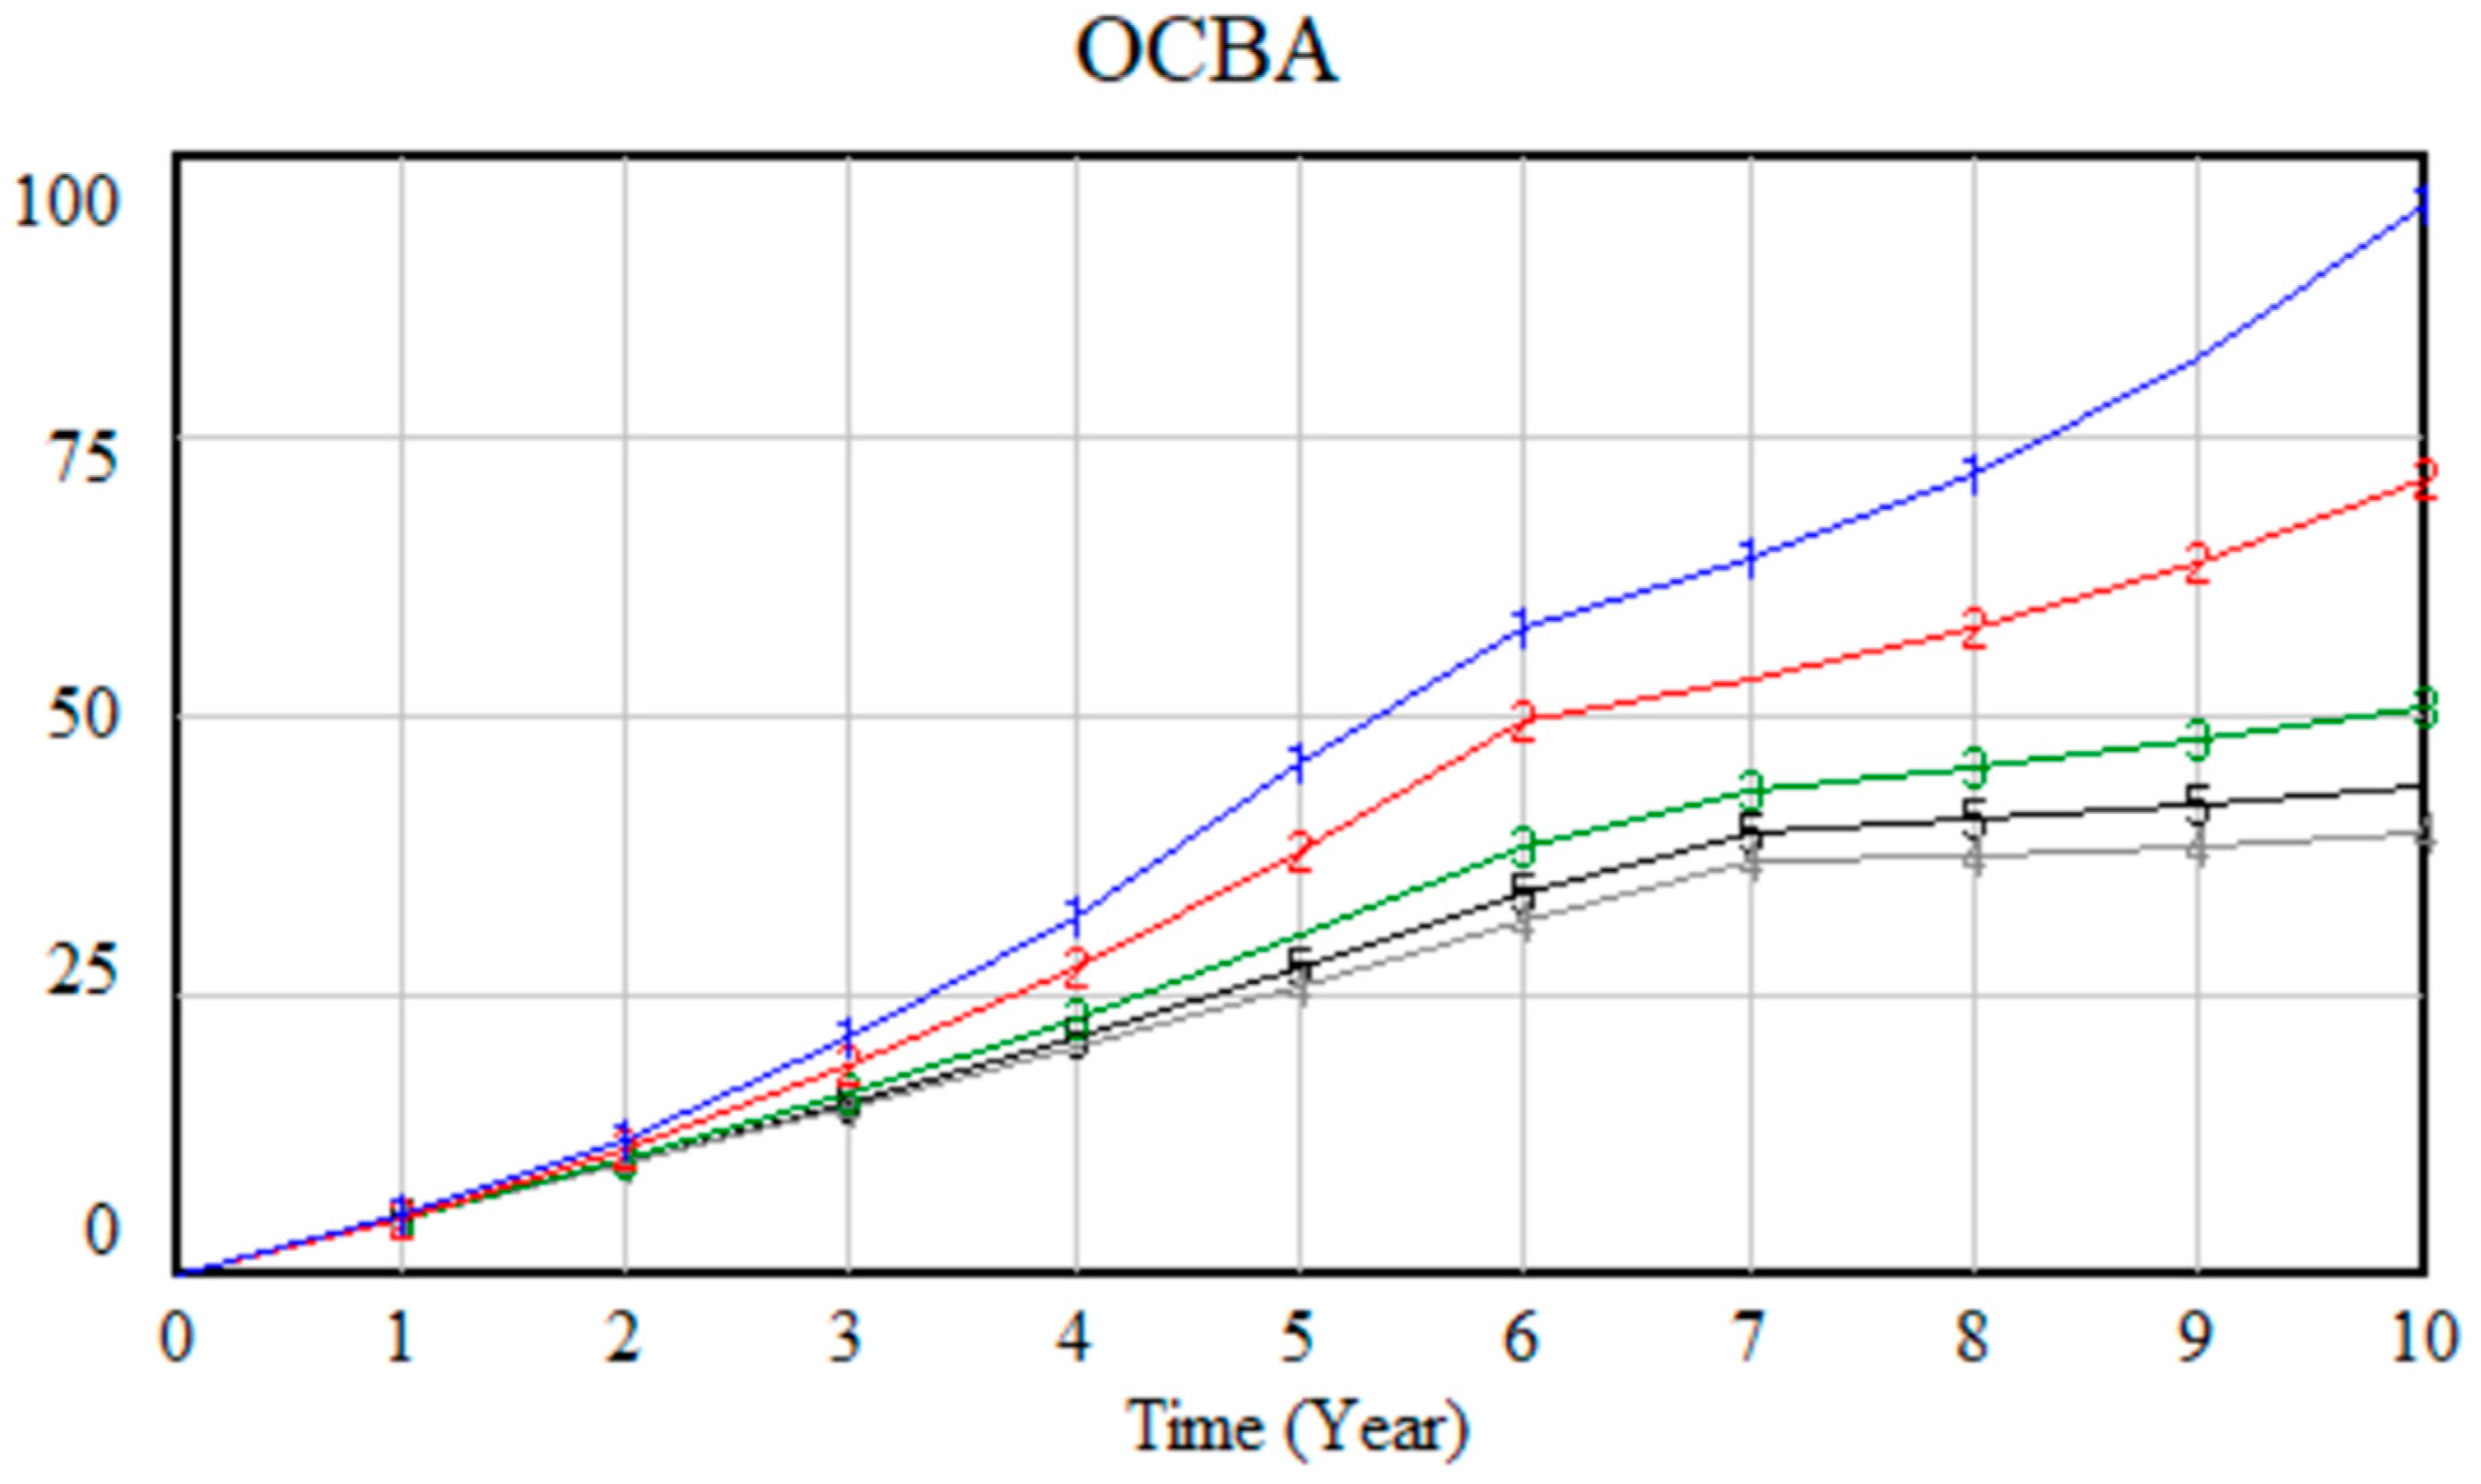
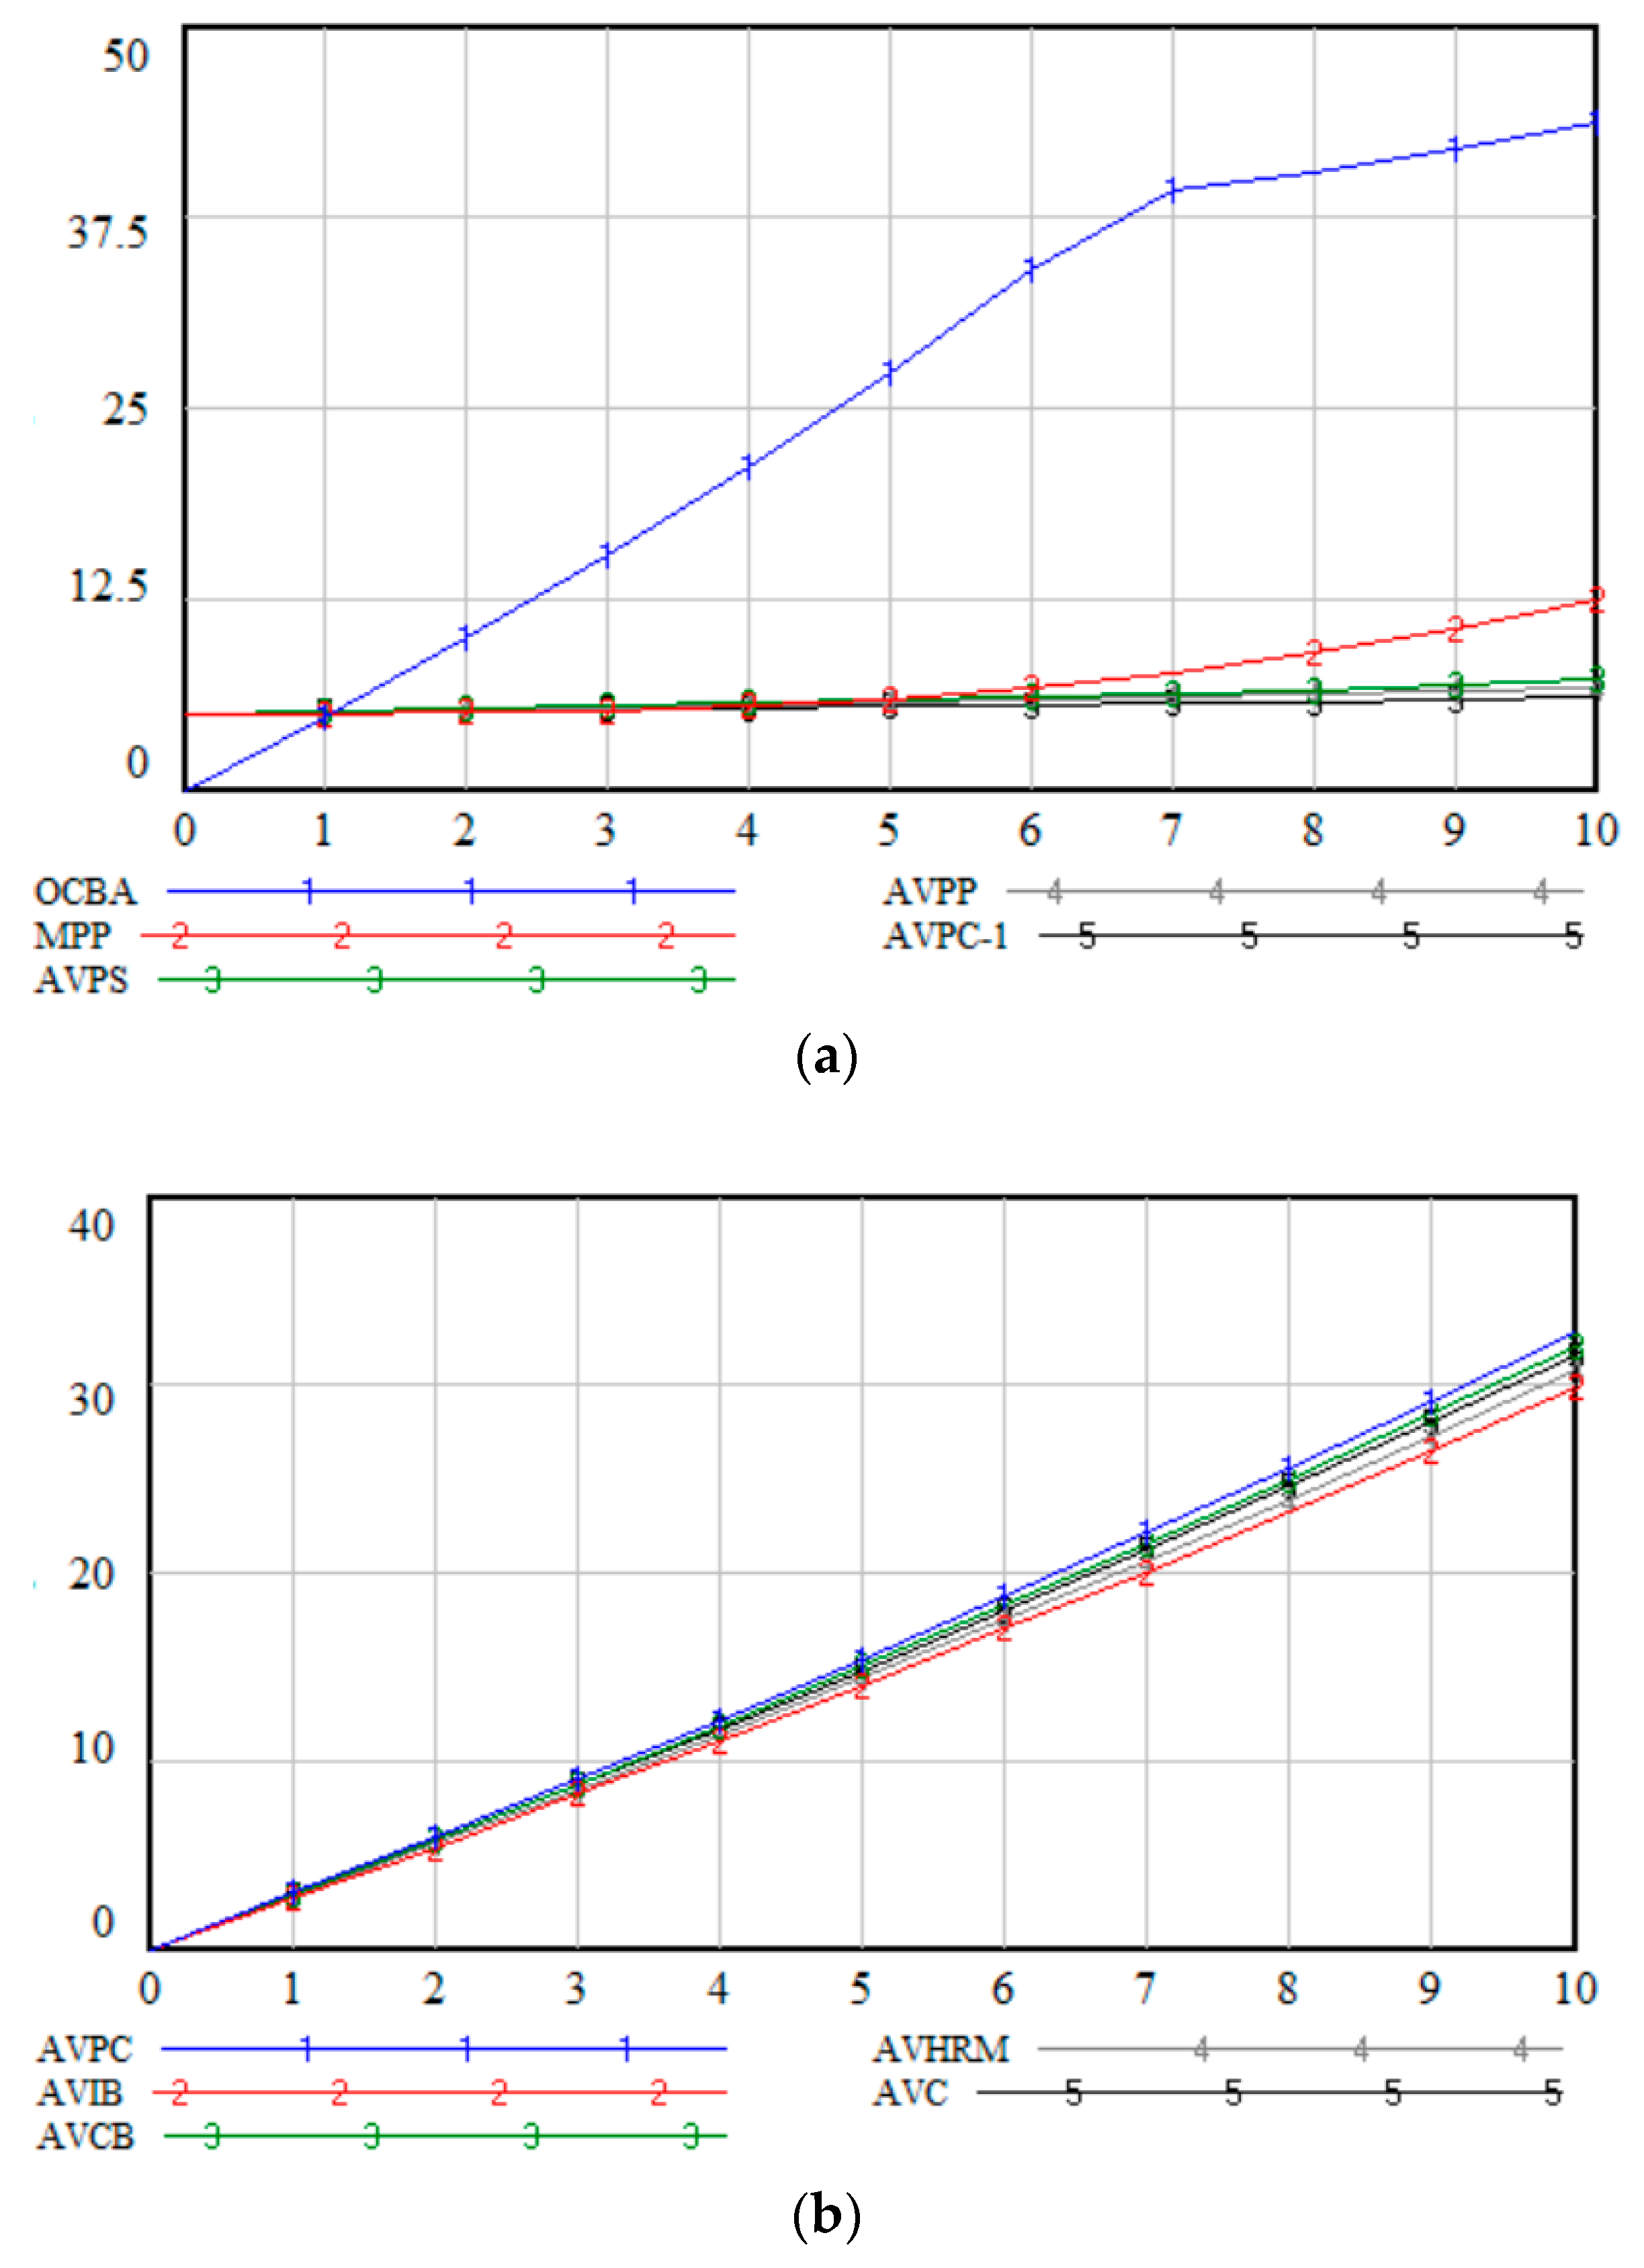
5.1. Results of Base Scenario

A simulation analysis was conducted after completing the model validation. In this model, the simulation period was set to 10 years given that the duration of one megaproject is longer than that of normal construction projects. The results of the baseline scenario are shown in Figure 5a,b and Table 1, respectively. Figure 5a shows the impacts on which the OCB construction project participants would have in the final performance of megaprojects. Meanwhile, the selected outputs included OCBA, the MPP (performance of megaprojects), the AVPC-1 (accumulated value of the project culture), the AVPP (accumulated value of the potential promotion), and the AVPS (accumulated value of the public’s satisfaction). Figure 5b illustrates the trends of the AVPC (accumulated value of the project compliance), the AVIB (accumulated value of the innovation behavior), the AVHRM (accumulated value of the maintenance of harmonious relationships), the AVCB (accumulated value of the collaboration behavior), the AVC (accumulated value of conscientiousness), and Table 1 shows the simulation values of all the selected variables.
The MPP is a key variable for measuring the performance of the construction project in the studied model. It was assigned to a value ranging from 0 to 100, where the value of 0 was expected to represent the lowest level and 100 was expected to represent the highest level. The OCBA is a variable for examining the OCB of participants in the model from 0 to 100 as well. Obviously, as shown in Figure 5, the value of the five outputs all increased across the whole period. The main difference is that the value of the MPP increased at a low rate in the first five years, but experienced a relatively sharp increase in the last five years (a rate of 12.55; Table 1). By contrast, it shows that the OCBA is on an increasing trend in the first seven years and then steadily ascends from 39.31 to 43.69 by the end of the period (Table 1). The possible explanations to the different trends could be that the delay in the OCB positively contributes to the increase of the MPP as the simulated project proceeds. Thus, the PP is expected to present a noticeable rise at last. As for the AVPS, its value rises from 5.17 to 7.17; for the AVPP, the value reaches 6.73 at the last year; the simulation figure of the AVPC-1 witnesses the slowest growth among the three, reaching its peak of 6.08 at the end of the period. The simulation results above indicate that the MPP was gradually improved along with the progression of a simulated project which echoes with the findings from the previous papers, such as Nielsen [5], who stated that the OCB could positively contribute to the project performance but that there is indeed a delay in its reflection on the performance. In Figure 5b, the value of the AVPC is the highest, reaching 32.88 at the end of the simulation period, followed by the AVCB (32.04), the AVC (31.62), the AVHRM (30.77), and the AVIB (29.88). Notably, this simulation result indicates that the project compliance could be the most significant OCB in the megaprojects, in agreement with a survey that concluded that compliance is, in fact, the most common kind of OCB in the megaprojects [38].

5.2. Results of Policy Scenarios

5.2.1. Single-Policy Scenario

Considering the contribution of OCB to the improvement of the performance of megaprojects, scholars in the academic and industrial areas have carried out various research on how to promote OCB. According to existing studies, political motivations, especially when reflecting a promotion, and project culture are widely regarded as typical factors [24,28]. Given the fact that illustrating all factors with respect to OCB is impractical due to the limited length of the paper, the two factors mentioned above were selected to simulate the policy analysis. By implementing the two policies individually and in combination with each other, various scenarios were simulated and analyzed. Policy scenario A and B are both single-policy scenarios, which means that only one variable was changed while the others remained unchanged. Policy scenario C is a multi-policy scenario and two variables were changed simultaneously.
• Scenario A: Promotion Effect
This one is a single-policy scenario, aiming at examining the impacts of changing the AIRPP on PP, OCBA, AVC, AVCB, AVHRM, AVIB, and AVPC. To analyze the various possible situations, two sub-scenarios aside from the base run (the initial value of the AIRPP is 0.05) were designed in which the AIRPPs were 0.2 and 0.4, respectively. Moreover, these two scenarios were defined as PSA-1 and PSA-2. Table 2 shows that the increase in the AIRPP significantly contributed to the improvement in the OCBA, thereby enhancing the performance of construction projects. To be specific, the OCBA witnesses an improvement of 29.77% and 60% in PSA-1 and PSA-2, reaching 52.61 and 65.97, respectively. Meanwhile, the PP shows an increase of 15.5% and 43.75% in PSA-1 and PSA-2, reaching 14.50 and 18.04, compared with the baseline scenario.
In addition, the significant increase are also illustrated in the other five selected variables, namely, AVPC, AVIB, AVCB, AVC, and AVHRM, with values of 35.68, 32.42, 34.77, 35.04, and 33.38 in PSA-1 and 39.54, 35.92, 38.52, 38.72, and 36.99 in PSA-2, respectively, at the end of the simulation period. In the meantime, the AVPC is the most significant one among the five variables with an increase of 8.52% in PSA-1 and 20.26% in PSA-2, increasing from 32.88 (the baseline run) to 35.68 and 39.54, respectively; then followed by AVC, AVCB, AVHRM, and AVIB. A possible reason for these simulation results is that the increased promotion opportunities drive the construction participants to work more actively in such ways as to improve their special skills and to have more of an initiative to participate in project meetings and activities, which are likely to improve OCB and contribute to a better performance of megaprojects.
• Scenario B: Cultural Effect
The policy scenario B, similarly to Scenario A, is also a single policy scenario that is designed to verify the effect of the increase in the AIRPC (actual increasing rate of project culture) on PP, the OCBA, the AVC, the AVCB, the AVHRM, the AVIB, and the AVPC over the simulation period. To examine the impact of the improvement in the AIRPC on the selected variables, two devised scenarios were simulated under policy scenario B for the comparison against the baseline scenario, namely PSB-1 and PSB-2. The initial value of the AIRPC was 0.05 in the base run and increased to 0.2 and 0.4 in PSB-1 and PSB-2, respectively. As presented in Table 3, the results indicated that the rise in the AIRPC could increase the value of the OCBA and PP, from 50.78 and 14.09 in run PSB-1, to 63.85 and 17.43 in run PSB-2, at the end of the simulation period. Compared with the baseline scenario, the OCBA was improved by 16.23% (PSB-1) and by 46.14% (PSB-2). Meanwhile, the MPP has increased by 12.27% (PSB-1) and by 38.88% (PSB-2) by the end of the period. Moreover, the enhancements were also observed in the other five selected variables. The values of the AVPC, the AVIB, the AVCB, the AVC, and the AVHRM arrived at 35.11, 31.90, 34.22, 33.50, and 33.85 in PSB-2, and 38.95, 35.39, 37.95, 37.16, and 37.44 in PSB-2. It is obvious that the value of the AVPC is the highest among the five variables, with improvements of 6.78% in the PSB-1 and 18.46% in the PSB-2. The improvements in all the selected variables could probably be a result of the fact that the participants of the construction influenced by a positive project culture within organizations and contributed to a high quality of their daily work, which is likely to lead to an improvement in the performance finally.
However, although the selected variables have increased in both PSA and PSB, some differences still exist in the simulation results of these two policy scenarios. Firstly, the simulation results of PSB are more moderate than those of PSA, indicating that providing opportunities of promotion is more effective than the project culture to improve OCB and project performance. This finding echoes with the existing results of other researchers [39] that pointed out that the motivation of promotion is more attractive to persons in the top of the management team. Secondly, PSA and PSB both posed different effects on the AVPC, the AVIB, the AVCB, the AVC, and the AVHRM. To be specific, in Scenario A, the AVPC, the AVC, and the AVCB are the top three variables which improved the most significantly/ In the meantime, the AVPC, the AVC, and the AVHRM are the top three in Scenario B. This result suggests that Scenario A could impose more significant effects on the collaboration behavior rather than on the maintenance of harmonious relationship in Scenario B. The explanation is that project culture effectively contributes to foster a harmonious atmosphere within organizations [40], especially in countries like China where there is an emphasis on harmony and people show high concern for group harmony.

5.2.2. Scenario C: Dual Effects

This scenario is a multi-policy scenario designed to simulate the influence of the combined changes in the AIRPP and the AIRPC to facilitate a comprehensive understanding on how their changes affect the OCBA and MPP. To be specific, five sub-scenarios were set, namely PSC-1 (AIRPC = 0, AIRPP = 0.4), PSC-2 (AIRPC = 0.1, AIRPP = 0.3), PSC-3 (AIRPC = 0.2, AIRPP = 0.2), PSC-4 (AIRPC = 0.3, AIRPP = 0.1), PSC-5 (AIRPC = 0.4, AIRPP = 0).
As illustrated in Table 4., two main results should be highlighted. Firstly, PSC-1 witnesses the most significant improvements both in OCBA and MPP, reaching 59.40 and 16.21, respectively; then followed by PSC-2, PSC-3, PSC-4, and PSC-5. This simulation result shows that the higher value of the AIRPP in the sub-scenarios, the higher the value of the OCBA and MPP would be. This finding is not only consistent with previous studies, which stated that opportunities of promotion are more effective than the project culture in improving OCB and project performance [39], but also echoes with the simulation results in the single-policy scenario. Secondly, whenever the AIRPC is 0 in PSC-1 or whenever the AIRPP is 0 in PSC-5, the values of OCBA and PP were not estimated as 0. The reason for this is that the system is an organic system whole running in a highly iterative manner and because promotion and project culture are not the only two driving factors in this system, thus, even though the AIRPC or the AIRPP is set to zero, it would not lead to a zero in OCBA and MPP.

6. Conclusions

Previous studies have demonstrated the important role of OCB in the construction sustainability management and considerable studies have been conducted to examine the relationship between OCB and project performance in the last few decades. However, there is still a gap to study the interdependent and dynamic relationships among the variables within the OCBs of construction megaprojects. Therefore, this study proposed to use system dynamics to quantitatively study the impact of OCB on the performance of megaprojects.
Based on SD modelling, both a causal loop diagram and a stock-flow diagram were proposed to identify the major variables and to describe their interrelationship. Once the model was validated, three policy scenarios including two single policy scenarios and a multi-policy scenario, were adopted to simulate the performance of megaprojects under various levels of the OCB adoption in megaprojects. The simulation results indicated that an increase in the AIRPP carries out more obvious effects on the improvement in OCB and in the performance of megaprojects than those of the AIRPC. Moreover, the simulation results of the multi-policy scenarios show that the higher the value of the AIRPP in combinations (the total value has been restricted), the higher the value of OCBA and the project performance would be. Thus, a finding that highlights the importance of considering improving AIRPC first, especially when resources are limited.
The main contributions of this study lie in four aspects. First, the inherently dynamic nature of the OCB system which has been neglected by most previous studies has been well envisaged. Second, the SD model not only facilitates the illustration of interrelationships among the variables from a quantitative perspective, but also deepens the stakeholders’ understanding of the entire system of OCB. Third, the established model can serve as a laboratory and as a platform to better simulate the potential effects of OCB on the performance of megaprojects, and to test the different scenarios of the possible futures which are have been relatively less studied before. Finally, the policy scenarios could identify the benefits that OCB would bring about, delivering a clearer and perhaps more realistic view of the appropriate actions that improve the performance of megaprojects in the real world. Despite significant contributions, the two main limitations cannot be ignored. On the one hand, the SD method only pays attention to the general dynamic trends of prediction and does not emphasize the accurate value in a specific year. Therefore, it is suggested to be applicable to long-term predictions which do not require accurate results. On the other hand, the SD model is a simplification and an abstraction of the system in the real world, thus, only major variables and their interrelationships are considered in the process of model development in this study, which would lead to an adverse impact on the accuracy and reliability of the simulation results. Therefore, future research is encouraged to encompass more variables involved in the OCB system to increase its credibility and predicting accuracy. In addition, given the limited length, only three policy scenarios have been simulated and analyzed through a comparison of the results with the base scenarios. In the future study, more similar simulations that are composed of different designed policies can be conducted and analyzed under different scenarios by using the method proposed in this study.

Author Contributions

T.W. designed the study and completed the paper in English. Q.H. provided useful advice and revised the manuscript. Y.L. provided comments, polished the language and revised the manuscript. D.Y. collected research data and provided advice.

Funding

This research was funded by the National Natural Science Foundation of China, grant number 71571137, 71390523.

Acknowledgments

The authors wish to express gratitude to the National Natural Science Foundation of China (Grant No. 71571137, No. 71390523) for financial support on this research.

Conflicts of Interest

The authors declare no conflict of interest.

Appendix A

Table A1. The descriptions of the variables used in the model.
AcronymDescriptionsVariable TypeAcronymDescriptionsVariable Type
AIRPCActual increasing rate of project cultureConstantIIHRMIncreasing index of harmonious relationship maintenanceAuxiliary
AIRPPActual increasing rate of potential promotionConstantIIIBIncreasing index of innovation behaviorAuxiliary
AIRPSActual increasing rate of public satisfactionConstantIIPCIncreasing index of project complianceAuxiliary
AROCBAdoption rate of organizational citizenship behaviorAuxiliaryIIPPIncreasing index of project performanceAuxiliary
ATAIAdvanced technology adopted initiativelyConstantIPPIncreasing index of project performanceAuxiliary
AVCAccumulated value of conscientiousnessStockOCBAOrganizational citizenship behavior adoptionAuxiliary
AVCBAccumulated value of collaboration behaviorStockPCIProject culture incrementFlow
AVHRMAccumulated value of harmonious relationship maintenanceStockPCI-1Personal compliance incrementFlow
AVIBAccumulated value of innovation behaviorStockMPPThe performance of megaprojectsFlow
AVPCAccumulated value of project complianceStockPPIProject performance incrementStock
AVPC-1Accumulated value of project cultureStockPPIIProject program improved initiativelyConstant
AVPPAccumulated value of potential promotionStockPPMACConscious participation in project meetings and activitiesConstant
AVPSAccumulated value of public satisfactionStockPPOIPotential promotion opportunities incrementFlow
BCPBenefits of corporate reputationAuxiliaryPSIPublic satisfaction incrementFlow
CBICollaboration behavior incrementFlowPTCParticipation in training consciouslyConstant
CCACoordination conflicts activelyConstantSPEShares with project experienceConstant
CGRCompliance with governmental requirements on the projectConstantTVOCBTotal value of organizational citizenship behaviorAuxiliary
CIConscientiousness incrementFlowVCValue of conscientiousnessAuxiliary
CMRCConduct mission requirements consciouslyConstantVCBValue of collaboration behaviorAuxiliary
CPACompliance with project arrangementsConstantVHRMValue of harmonious relationship maintenanceAuxiliary
GMCGovernmental management changingAuxiliaryVIBValue of innovation behaviorAuxiliary
GMPGovernmental management performanceAuxiliaryVPCValue of project cultureAuxiliary
HOSDHelps others to solve the difficultiesConstantVPC-1Value of project complianceAuxiliary
HRMIHarmonious relationship maintenance incrementFlowVPPValue of potential promotionAuxiliary
HRSHarmonious relationship with stakeholdersConstantVPSValue of public satisfactionAuxiliary
IBIInnovation behavior incrementFlowWAOCBWillingness to adopt organizational citizenship behaviorAuxiliary
IICIncreasing index of conscientiousnessAuxiliaryWOIWork overtime initiativelyConstant
IICBIncreasing index of collaboration behaviorAuxiliaryYYearlyConstant

Appendix B

Equations of the model
ATAI = 4.07
CCA = 4.17
AIRPC = 0.05
AIRPP = 0.05
AIRPS = 0.1
AVC(t) = AVC(t − dt) + (CI) × dt
INTI AVC = 0
AVCB(t) = AVCB(t − dt) + (CBI) × dt
INTI AVCB = 0
AVHRM(t) = AVHRM(t − dt) + (AVHRMI) × dt
INTI AVHRM = 0
AVIB(t) = AVIB(t − dt) + (IBI) × dt
INTI AVIB = 0
AVPC(t) = AVPC(t − dt) + (PCI-1) × dt
INTI AVPC = 0
AVPP(t) = AVPP(t − dt) + (PPOI) × dt
INTI AVPP = 5
AVPC-1(t) = AVPC-1(t − dt) + (PCI) × dt
INTI AVPC-1 = 5
AVPS(t) = AVPS(t − dt) + (PSI) × dt
INTI AVPS = 5
HRS = 4.23
CBI = VCB × IICB
IICB = 1/5 × IAOCB
VCB = 1/3 × (CCA + HOSD + SPE)
CMRC = 4.28
CGR = 4.48
CI = IIC × VC
IIC = 1/5 × IAOCB
CPA = 4.38
PPMAC = 4.06
PTC = 4.21
VC = 1/3 × (CMRC + PTC + WOI)
BCP = 1/2 × AVPS
GMC = 1/2 × AVPS
GMP = GRAPH(GMC)
([(0,0)-(100,80)],(0,0),(10,3),(20,6),(30,11),(40,16),(50,22),(60,26),(70,29),(80,31),(90,32.5),(100,33))
HRMI = IIHRM × VHRM
IIHRM = 1/5 × IAOCB
VHRM = 1/2 × (BHRS + PPMAC)
HOSD = 4.37
IAOCB = 1/4 × (AVPP + GMP + BCP + AVPC-1)
IBI = IIIB × VIB
IIIB = 1/5 × IAOCB
VIB = 1/2 × (ATAIAATI + PPII)
IPP = MPP
PPII = 3.98
OCBA = OCBAR × TVOCB
OCBAR = IF THEN ELSE(IAOCB >= 100, 0.1, IAOCB/10)
VPC = 1/3 × IPP
PCI = AIRPC × VPC
PCI-1 = IIPC × VPC-1
IIPC = 1/5 × IAOCB
VPC = 1/3 × IPP
VPC-1 = 1/2 × (CGR + CPA)
MPP = MPP(t − dt) + (PPI) × dt
INTI MPP = 5
PPI = IIPP × Y × MPP
IIPP = GRAPH(OCBA)
([(0,0)-(100,1)],(0,0),(10,0.02),(20,0.08),(30,0.13),(40,0.18),(50,0.24),(60,0.31),(70,0.35),(80,0.39),(90,0.41),(100,0.42))
PPOI = AIRPP × VPP
PSI = AIRPS × VPS
VPS = 1/3 × IPP
SPE = 4.41
TVOCB = IF THEN ELSE((AVC +AVCB + AVHRM + AVIB + AVPC) > 100, 100, (AVC + AVCB + AVHRM + AVIB + AVPC))
WOI = 4.29

References

  1. Flyvbjerg, B. What You Should Know About Megaprojects and Why: An Overview. Proj. Manag. J. 2014, 45, 6–19. [Google Scholar] [CrossRef]
  2. He, Q.; Luo, L.; Hu, Y.; Chan, A.P.C. Measuring the complexity of mega construction projects in China—A fuzzy analytic network process analysis. Int. J. Proj. Manag. 2015, 33, 549–563. [Google Scholar] [CrossRef]
  3. Hu, Y.; Chan, A.P.C.; Le, Y.; Jin, R.-Z. From Construction Megaproject Management to Complex Project Management: Bibliographic Analysis. J. Manag. Eng. 2015, 31, 1–11. [Google Scholar] [CrossRef]
  4. Podsakoff, P.M.; MacKenzie, S.B.; Paine, J.B.; Bachrach, D.G. Organizational Citizenship Behaviors: A Critical Review of the Theoretical and Empirical Literature and Suggestions for Future Research. J. Manag. 2000, 26, 513–563. [Google Scholar] [CrossRef]
  5. Nielsen, T.M.; Hrivnak, G.A.; Shaw, M. Organizational Citizenship Behavior and Performance: A Meta-Analysis of Group-Level Research. Small Group Res. 2009, 40, 555–577. [Google Scholar] [CrossRef]
  6. Song, Y.; Tan, Y.; Song, Y.; Wu, P.; Cheng, J.C.P.; Kim, M.J.; Wang, X. Spatial and temporal variations of spatial population accessibility to public hospitals: A case study of rural–urban comparison. GISci. Remote Sens. 2018, 55, 1–27. [Google Scholar] [CrossRef]
  7. Xing, X.; Chalip, L. Marching in the Glory: Experiences and Meanings When Working for a Sport Mega-Event. J. Sport Manag. 2009, 23, 210–237. [Google Scholar] [CrossRef]
  8. Yang, D.; He, Q.; Cui, Q.; Hsu, S.-C. Organizational Citizenship Behavior in Construction Megaprojects. J. Manag. Eng. 2018, 34, 1–11. [Google Scholar] [CrossRef]
  9. Wang, T.; Wang, J.; Wu, P.; Wang, J.; He, Q.; Wang, X. Estimating the environmental costs and benefits of demolition waste using life cycle assessment and willingness-to-pay: A case study in Shenzhen. J. Clean. Prod. 2018, 172, 14–26. [Google Scholar] [CrossRef]
  10. Braun, T.; Ferreira, A.I.; Sydow, J. Citizenship behavior and effectiveness in temporary organizations. Int.l J. Proj. Manag. 2013, 31, 862–876. [Google Scholar] [CrossRef]
  11. Forrester, J. Industrial dynamics: A mojor break through for dicision makers. Harv. Bus. Rev. 1958, 36, 37–660. [Google Scholar]
  12. Coyle, R.G. System Dynamic Modelling: A Practical Approach; Chapman & Hall: London, UK, 1996. [Google Scholar]
  13. Sterman, J.D. System Dynamics:Systems Thinking and Modeling for a Complex World; McGraw-Hill Higher Education: Cambridge, USA, 2002. [Google Scholar]
  14. Organ, D.W. Organizational Citizenship Behavior: The Good Soldier Syndrome; LexingtonBooks: Lexington, USA, 1988. [Google Scholar]
  15. Tang, T.; Wan, J.; Zhang, R. Discussion on successful practices and experience of working competition on the South-to-North Water Transfer Project. South-North Water Transf. Water Sci. Technol. 2013, 11, 174–176. [Google Scholar]
  16. Patanakul, P.; Kwak, Y.H.; Zwikael, O.; Liu, M. What impacts the performance of large-scale government projects? Int. J. Proj. Manag. 2016, 34, 452–466. [Google Scholar] [CrossRef]
  17. Braun, T.; Müller-Seitz, G.; Sydow, J. Project citizenship behavior?—An explorative analysis at the project-network-nexus. Scand. J. Manag. 2012, 28, 271–284. [Google Scholar] [CrossRef]
  18. Tao, R. Research on Multilevel and Multidimensional Model Building of Organizational Citizenship Behavior in Construction Megaproject; Tongji University: Shanghai, China, 2016. [Google Scholar]
  19. Farh, J.L.; Zhong, C.B.; Organ, D.W. Organizational Citizenship Behavior in the People’s Republic of China. Organ. Sci. 2004, 15, 241–253. [Google Scholar] [CrossRef]
  20. George, J.M.; Jones, G.R. Organizational Spontaneity in Context. Hum. Perform. 1997, 10, 153–170. [Google Scholar] [CrossRef]
  21. Podsakoff, N.P.; Podsakoff, P.M.; MacKenzie, S.B.; Maynes, T.D.; Spoelma, T.M. Consequences of unit-level organizational citizenship behaviors: A review and recommendations for future research. J. Organ. Behav. 2014, 35, S87–S119. [Google Scholar] [CrossRef]
  22. Luo, L.; Li, Y.-K.; Yang, D.-L.; He, Q.-H. Research on Multidimensional Connotations of Megaproject Construction Organization Citizenship Behavior. Front. Eng. Manag. 2015, 2, 148–153. [Google Scholar]
  23. Turner, J.; Rodney, M.L.R. On the nature of the project as a temporary organization. Int. J. Proj. Manag. 2003, 21, 1–8. [Google Scholar] [CrossRef]
  24. Li, X.H.; Liang, X. A Confucian Social Model of Political Appointments among Chinese Private-Firm Entrepreneurs. Acad. Manag. J. 2014, 58, 592–617. [Google Scholar] [CrossRef]
  25. He, Q.; Luo, L. Management Coordination and Organizational Integration of Complex Mega Project; Science Press: Beijing, China, 2014; p. 241. [Google Scholar]
  26. Cao, D.; Li, H.; Wang, G.B. Impacts of Isomorphic Pressures on BIM Adoption in Construction Projects. Am. Soc. Civ. Eng. 2014, 140, 04014056. [Google Scholar] [CrossRef]
  27. Müller, R.; Turner, R.; Andersen, E.S.; Shao, J.; Kvalnes, Ø. Ethics, Trust, and Governance in Temporary Organizations. Proj. Manag. J. 2014, 45, 39–54. [Google Scholar] [CrossRef]
  28. Wang, L.; Hinrichs, K.T.; Prieto, L.; Howell, J.P. Five dimensions of organizational citizenship behavior: Comparing antecedents and levels of engagement in China and the US. Asia Pac. J. Manag. 2010, 30, 115–147. [Google Scholar] [CrossRef]
  29. Yuan, H.; Wang, J. A system dynamics model for determining the waste disposal charging fee in construction. Eur. J. Oper. Res. 2014, 237, 988–996. [Google Scholar] [CrossRef]
  30. Ding, Z.; Yi, G.; Tam, V.W.; Huang, T. A system dynamics-based environmental performance simulation of construction waste reduction management in China. Waste Manag. 2016, 51, 130–141. [Google Scholar] [CrossRef] [PubMed]
  31. Wang, T.; Wang, J.; Wu, D.; Gao, Y. Assessment Model of the Effectiveness of Construction and Demolition Waste Reduction Measures: A Case of Shenzhen. In Proceedings of the 20th International Symposium on Advancement of Construction Management and Real Estate, Hangzhou, China, 23–25 October 2015; Springer: Hangzhou, China, 2015; pp. 1077–1090. [Google Scholar]
  32. Yen, H.R.; Li, E.Y.; Niehoff, B.P. Do organizational citizenship behaviors lead to information system success? Inf. Manag. 2008, 45, 394–402. [Google Scholar] [CrossRef]
  33. Li, Z.; Shen, G.Q.; Alshawi, M. Measuring the impact of prefabrication on construction waste reduction: An empirical study in China. Resour. Conserv. Recycl. 2014, 91, 27–39. [Google Scholar] [CrossRef]
  34. Qudrat-Ullah, H.; Seong, B.S. How to do structural validity of a system dynamics type simulation model: The case of an energy policy model. Energy Policy 2010, 38, 2216–2224. [Google Scholar] [CrossRef]
  35. Jahangir, N.; Akbar, M.M.; Haq, M. Organizational Citizenship Behavior: Its Nature and Antecedents. BRAC Univ. J. 2004, 1, 75–85. [Google Scholar]
  36. Maani, K.E.; Cavana, R.Y. System Thinking and Modeling—Understanding Change and Complexity; Prentice Hall: Auckland, New Zealand, 2000. [Google Scholar]
  37. Jia, M.; Zhang, Z. The CEO’s Representation of Demands and the Corporation’s Response to External Pressures: Do Politically Affiliated Firms Donate More? Manag. Organ. Rev. 2015, 9, 87–114. [Google Scholar] [CrossRef]
  38. Yang, D.-L. Research on the Identification, Drivers and Effectiveness Emergency of Organizational Citizenship behavior in Construction Megaprojects Tongji University; Tongji University: Shanghai, China, 2016. [Google Scholar]
  39. Le, Y.; Bai, J.; Li, Y.; Zheng, X. The factors and mechanism of administrative incentives on top managers in Chinese major infrastructure projects-based on 208 samples in 43 projects. Chin. J. Manag. 2016, 13, 1164–1173. [Google Scholar]
  40. Hofstede, G. The Cultural Relativity of the Quality of Life Concept. Acad. Manag. Rev. 1984, 9, 389–398. [Google Scholar] [CrossRef]
Figure 1. The research path for model development.
Sustainability 10 01708 g001
Figure 2. The causal loop diagram of the Organizational Citizenship Behavior (OCB) system.
Sustainability 10 01708 g002
Figure 3. The stock-flow diagram of the model.
Sustainability 10 01708 g003
Figure 4. An example of a sensitivity test (Line 1 for AIRPP = 0.8; Line 2 for AIRPP = 0.5; Line 3 for AIRPP = 0.2; Line 4 for AIRPP = 0; Line 5 for AIRPP = 0.05).
Sustainability 10 01708 g004
Figure 5. (a) The simulation results of the five selected outputs in the base scenario. (b) The simulation results of the five selected outputs in the base scenario.
Sustainability 10 01708 g005
Table 1. The simulation results of the selected outputs in the base scenario.
YearSelected Outputs
OCBAMPPAVPC-1AVPPAVPSAVPCAVIBAVCBAVHRMAVC
14.7655.085.135.172.932.672.862.752.82
29.875.055.175.275.335.945.405.795.565.71
315.345.155.255.405.509.028.208.798.448.67
421.185.425.345.545.6712.1711.0611.8611.3911.71
527.455.885.435.685.8515.4013.9915.0014.4114.81
634.196.575.525.846.0518.7017.0018.2217.5017.98
739.317.565.636.016.2722.0920.0721.5220.6721.24
840.548.895.766.226.5225.5723.2324.9223.9224.59
941.9810.535.916.456.8229.1626.5028.4227.2928.05
1043.6912.556.086.737.1732.8829.8832.0430.7731.62
Table 2. The simulation results of policy scenario A.
YearPSA-1PSA-2
OCBAMPPAVPCAVIBAVCBAVCAVHRMOCBAMPPAVPCAVIBAVCBAVCAVHRM
14.8452.932.672.862.802.754.9652.932.672.862.802.75
210.305.055.605.455.845.725.6110.915.056.075.525.925.795.68
316.425.169.198.358.958.778.6017.945.189.418.559.178.988.80
423.245.4612.5011.3612.1911.9311.7026.155.5312.9511.7612.6212.3512.12
530.845.9915.9514.5015.5515.2214.9335.726.1416.7015.1716.2715.9315.62
639.386.7919.5417.7619.0418.6518.2946.977.1120.6718.7820.1419.7219.34
744.187.9923.2821.1622.6922.2221.7950.848.6924.8922.6124.2523.7423.29
846.479.6327.2024.7115.5025.9525.4554.7910.8329.3926.7028.6428.0427.50
949.2411.7431.3228.4530.5119.8829.3059.7113.7934.2531.1133.3732.6732.04
1052.6114.5035.6832.4234.7735.0433.3865.9718.0439.5435.9238.5238.7236.99
Table 3. The simulation results of scenario B.
YearPSB-1PSB-2
OCBAMPPAVPCAVIBAVCBAVCAVHRMOCBAMPPAVPCAVIBAVCBAVCAVHRM
14.8352.932.672.862.802.754.9452.932.672.862.802.75
210.235.055.995.445.835.715.6010.825.056.065.515.905.785.67
316.225.169.158.328.928.738.5617.715.189.378.529.148.948.77
422.855.4512.4411.3012.1211.8711.6425.705.5212.8811.7012.5512.2912.05
530.195.9715.8414.4015.4415.1214.8234.976.1216.5915.0716.1615.8215.52
638.376.7519.3717.6018.8818.4818.1345.797.0720.5018.6319.9719.5619.18
743.207.9123.0520.9422.4621.9921.5649.838.5824.6522.3924.0123.5123.06
845.279.4826.8724.4216.1825.6425.1453.5110.6329.0626.4028.3227.7327.19
947.7611.4930.8828.0630.0929.4728.9058.0813.4433.8030.7132.9432.2531.63
1050.7814.0935.1131.9034.2233.5033.8563.8517.4338.9535.3937.9537.1637.44
Table 4. The simulation results of scenario C.
YearPSC-1PSC-2PSC-3PSC-4PSC-5
OCBAMPPOCBAMPPOCBAMPPOCBAMPPOCBAMPP
14.9054.8854.8654.8454.825
210.625.0510.525.0510.415.0510.305.0510.205.05
317.215.1716.955.1716.685.1616.425.1616.165.16
424.755.5024.245.4823.745.4723.245.4622.745.45
533.366.0732.516.0431.676.0130.845.9930.025.96
643.296.9641.966.9040.666.8439.386.7938.136.73
747.658.3546.498.2245.338.1044.187.9943.037.88
850.7810.2349.3310.0247.899.8246.479.6345.079.45
954.6212.7452.8012.3951.0012.0549.2411.7447.5111.43
1059.4016.2157.0815.6054.8215.0352.6214.5050.4614.01

