Article

A Hybrid Fuzzy BWM-COPRAS Method for Analyzing Key Factors of Sustainable Architecture

by
Hannan Amoozad Mahdiraji
1,
Sepas Arzaghi
2,
Gintaras Stauskis
3,* and
Edmundas Kazimieras Zavadskas
4
1
Faculty of Management, University of Tehran, Tehran 1417614418, Iran
2
Department of Management, University of Tehran, Kish International Campus, Kish 7941655655, Iran
3
Faculty of Architecture, Department of Urban Design, Vilnius Gediminas Technical University, Vilnius 10223, Lithuania
4
Faculty of Civil Engineering, Institute of Sustainable Construction, Vilnius Gediminas Technical University, Vilnius 10223, Lithuania
*
Author to whom correspondence should be addressed.
Sustainability 2018, 10(5), 1626; https://doi.org/10.3390/su10051626
Submission received: 4 April 2018 / Revised: 7 May 2018 / Accepted: 16 May 2018 / Published: 18 May 2018
(This article belongs to the Special Issue Sustainability in Construction Engineering)

Abstract

:
Sustainable development by emphasizing on satisfying the current needs of the general public without threating their futures, alongside with taking the environment and future generations under consideration, has become one of the prominent issues in different societies. Therefore, identifying and prioritizing the key factors of sustainable architecture according to regional and cultural features could be the first step in sustaining the architecture as a process and an outcome. In this paper, the key indicators of the environmental sustainability in contemporary architecture of Iran has been identified and prioritized. This study has been performed in three phases. First, identifying key factors of environmental sustainability according to the experts’ point of view and transforming the collected data to triangular fuzzy numbers. Subsequently, the best-worst multi-criteria decision-making method (henceforth BWM) under grey system circumstances has determined the weights and priority of the identified criteria. Eventually, identified key factors were prioritized by the complex proportional assessment method (hereafter COPRAS) under the condition of fuzzy sets. The results indicate that the key factors of creating engagement between buildings and other urban systems has the highest priority in the built environment sustainability in contemporary architecture and proving building management systems has the lowest.

1. Introduction

Sustainability is not a new concern; since the introduction of the concept in 1987, there has been a proliferation of competing notions of sustainability to the extent that it has become an empty box, a fragmented concept. It seems that sustainability is what you make of it [1]. The etymology of the word “sustainability” originates from the Latin sustin_ere in which the words sub—from below—and ten_ere—held up—combine to generate the idea of something that supports, maintains, or endures [2]. However, the term ‘sustainability’ is increasingly used in the context of ecological, economic, and social studies. In green economics it is often used interchangeably with the term ‘sustainable development’, defined by the World Commission on Environment and Development as, “development which meets the needs of the present without compromising the ability of future generations to meet their own needs” [3]. The concept of sustainable development refers to the ideas of “our common future” based upon a report published by the United Nations World Commission on Environment and Development [4]. In fact, sustainable development is all about ensuring a better quality of life for everyone, now and for generations to come [5]. The World Commission of Environment and Development identified sustainable development as a development that can fulfill requirements, including two concepts:
  • The concept of needs, especially poor populace basic needs, as a top priority; and
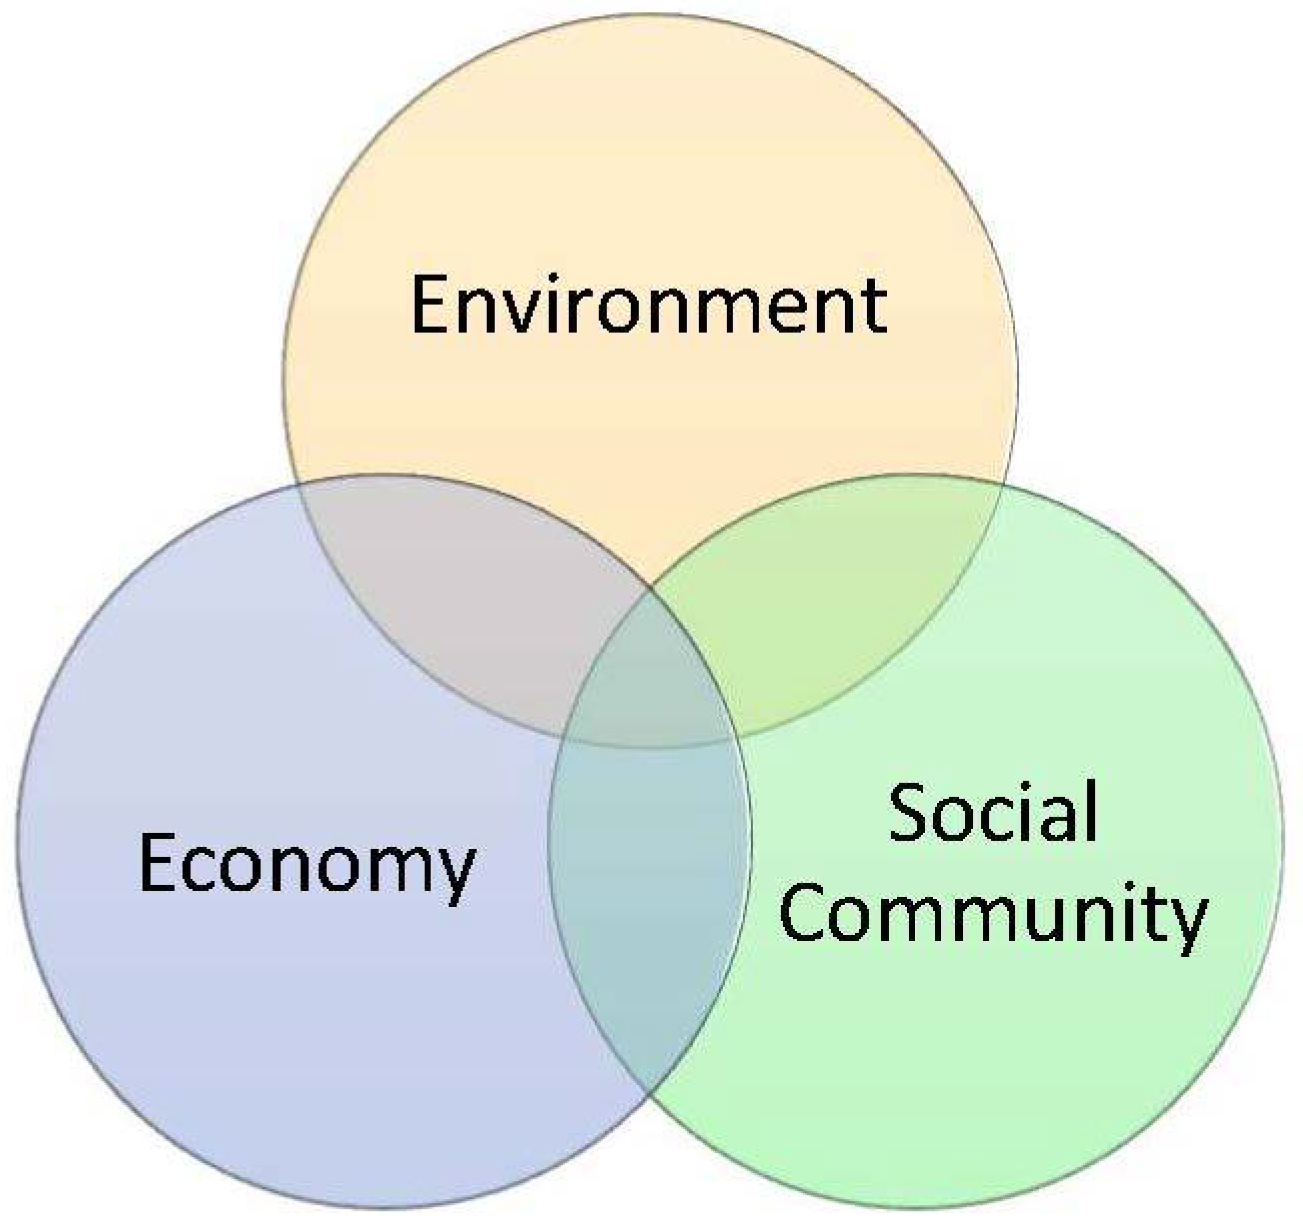
  • Sustainable development, which includes the ideas that limit every country because of ecological, social, and environmental situations (Figure 1). It means that each country should identify the sustainable development purposes operationally inside itself, according to human soberness of himself and natural resources of the Earth, and it wants a unique and sustainable lifestyle for everyone. It is against the overuse and the dissipation of resources, disregard for future generations, and disconnection with the past [6]. Several models have been constructed for the identification of sustainable development, on the basis of its understanding. The best known is the three-pillar model, generally considered that there are three distinct sectors via which sustainability can be affected and enhanced, encompassing environmental sustainability, economic sustainability, and social sustainability [7]. Accordingly, the achievement of a sustainable built environment leads to holistic design methods capable of balancing the varied demands of environmental, social, and economic issues [8].
Based on a 1987 Brundtland report, sustainable development is rooted in sustainable forest and environmental issues in the 20th century. ‘Sustainability’ should be considered as humanity’s target goal of human-ecosystem equilibrium, while sustainable development refers to the holistic approach and temporal processes [10]. Furthermore, it can be considered as the practice of maintaining processes of productivity indefinitely by replacing resources used with resources of equal or greater value without degrading or endangering natural biotic systems [11].
In the territory of environmental sustainability, sustainable architecture has been introduced as the most prominent component. Environment and its changes, reduction in energy consumption, and green building are the most important factors in shaping different approaches of sustainable architecture [12]. A building, energy and resource efficient to sustain the lifecycle of its operations, meanwhile conducive to the health and comfort of its occupants, could be considered a green building [13]. Sustainable architecture is a way of prolonging the aging process of existing architecture [14]. Furthermore, is the inclusive part of the Green Building paradigm—the comprehensive professional philosophy, design methodology, and assessment toolkit that came into use in the 1990s along with the introduction of the BREEAM (Building Research Establishment Environmental Assessment Method) sustainability assessment system that has identified ten performance areas to measure sustainability of new or in-use buildings [15]. Recently, many similar systems elaborate analogous assessment criteria and are used for creating sustainable architecture internationally, regionally, or nationally.
Architectural sustainability in developing countries such as Iran, is still in the early stages compared with developed countries. Although, in recent decades, construction has been one of the most beneficial industries in Iran, but, unfortunately, most of the buildings suffer from a lack of sustainability. In Iran, the running architect’s education programs still poorly address the questions of sustainable architecture, there is no sustainability assessment tradition, and for this reason there is a great need for scientifically-based methods for prioritizing the sustainable architecture indicators. Zarghami et al., in 2018, published a report investigating the opportunities to customize the well-known sustainability assessment systems for the Iranian architecture and construction environment and underline the need for a method that explicitly displays the key factors of sustainable architecture [16]. In 2017, Shareef and Altan published research analyzing the sustainability assessment systems that are in use in the Middle East and globally, to determine qualitative and quantitative ways to weight the selected sustainability indicators and use this for developing the national sustainability codes, including the digital calculation systems [17]. The scope of sustainability theories, methodologies, and assessment systems often unreasonably limit themselves to the scale of a separately-taken building with its internal systems, as Hashemkhani and Zolfani note in 2018 [18]. At the same moment, architects and planners seamlessly neglect the necessity of an integrated approach with the superior urban structures as blocks and districts and urban systems as mobility and technical infrastructure. There, urban planners and architects make the strategic decisions for sustainability and clients harvest the major benefits, and we aim to check this for the Iranian environment.
Statistics indicate that, in the developing countries, approximately 40% of the energy is consumed in the construction sector [19]. It is predicted that this percentage will rise up to 50% by the year 2050 [20]. Consequently, each year a great amount of energy, and financial and non-financial resources are wasted during the process of building, and even during the regular use of the built buildings. The main aim of this particular research is to increase the pace of sustaining Persian architecture by applying innovative analysis methods and relevant conceptual tools. Moreover, the results of the following research could cause a reduction of energy, financial, and non-financial resources that the construction industry annually uses in Iran. For this reason, key factors of environmental sustainability in the contemporary architecture of Iran have been introduced and prioritized. Prioritizing these key factors will help the architecture and the other related companies to put more emphasis on necessary factors that will lead to sustainable buildings in the context of sustainable city spaces.
In the following, related subjects to this paper, such as sustainable architecture, Persian contemporary architecture, best-worst, and the complex proportional assessment (hereafter COPRAS) methods have been demonstrated.

2. Literature Review

2.1. Sustainable Architecture

Sustainability has become one of the most important and progressive trends in architecture over the last two decades [21]. The environmental awareness of professionals has put sustainability in the center of the profession of architecture and has resulted in introducing and implementing ecological designs both in the scale of buildings and cities [22]. Multiple investors with different viewpoints and, often, conflicting interests are involved in the sustainable design of buildings [23]. In fact, sustainability is a broad field relating to many areas in architecture as education, design, construction, and others. Therefore, sustainable architectural education is encouraged to be integrated throughout the program across the disciplines, where more opportunities will enable architects to acquire the knowledge effectively and transform it practically [24]. The concept of sustainable architecture is upon an undeniable reality that ecological conditions influence economic and social activities, including the idea of creating a logical environment [6].
Architects took over the criteria of green building as to achieve more sustainable architecture outcomes whereas the new approach put more focus on building performance in a longer time. By trying to cover all the important environmental, social, and economic aspects, still the most emphasis went to the environmental dimension and partly to the social aspects, while economic sustainability was a hard nut for architects before the German Sustainable and Building Council (DGNB) system brought that into use in 2007. The implemented green building assessment schemes definitely increased attention to the quality of architect’s work and brought more interdisciplinary design work in sustainable architecture [25]; nonetheless, their impact on sustainable development and greenhouse gas emissions was lower than expected [26].
Sustainable architecture employs a conscious approach to energy and ecological conservation in the design of the built environment (Dublin Institute of Technology). The results of sustainable architecture are founded on the symbiosis of ecologist’s and architects common work. These two professional groups could propose a change in the function of the building, such as a transition from a linear approach to a closed circulation plan. A building in a linear pattern would be treated as a place of processing natural resources into waste. For instance, energy is converted into heat losses. On the other hand, a building in a closed circulation plan approach could change from a voracious consumer of energy into a more self-sufficient unit [27]. Although sustainable design and construction might have a higher capital cost, it would provide savings through lower operating costs over the life cycle of the building in the long term [17].
Furthermore, sustainable architecture defines an understanding of environmentally-friendly architecture and contains [28] many characteristics, as listed below:
  • Designing efficient ventilation infrastructures;
  • Energy-efficient lighting and appliances;
  • Facilities for water-saving plumbing systems;
  • Increasing passive solar energy by landscape scheduling;
  • Diminishing harm to natural habitat;
  • Employing other possible power sources;
  • Non-synthetic, non-toxic materials;
  • Locally-obtained and responsibly-harvested woods and stone;
  • Compatible usage of former constructions;
  • Use of recycled architectural salvage; and
  • Efficient use of space.
While most green buildings do not have all of these features, the highest goal of green architecture is to be fully sustainable [29]. Green building involves considering four main areas including site development (to reduce the impact of development on the natural environment); material selection and minimization, contemporary sustainable building practice and looking for a reliable way of assessing and certifying materials. Critical review underline the need to upgrade the sustainability assessment requirements in the “Materials” section of different green building assessment schemes [21].
Based on this idea, the use of materials is progressively detected through ecological specifications that refer to various interaction between a material and the environment including embodied energy, pollution, waste generation and recycling possibilities [30]. Architectural sustainability must go down to standards that underscore the use of renewable energy, the maintenance and renewal of energy without contamination, contrary to minimum energy consumption [31]. Intelligent building systems monitor various parts of the building and create the right conditions to provide concurrent services, which can lead to the optimization of energy consumption, improvement in efficiency, productivity of devices, value- added, and the facilities in the building [32]. Take advantage of the natural elements and technologies engenders conservation of resources and increases occupant comfort/productivity, while lowering long-term operational costs and pollutants [33]. Furthermore, design for high indoor air quality to promote occupant health and productivity, minimizes the waste in construction, and demolition processes by recovering materials and reusing or recycling [34].
While seeking for sustainable solutions architects try to reuse the traditional construction and crafts techniques as vernacular climatic strategies (VCS) that focus on the natural ventilation, external walls insulation, and integrated shading. These vernacular low-cost solutions can reduce energy consumption and CO2 emissions as well as have positive impact on the aesthetics of modern architecture by minimizing the volumes of externally and internally-located equipment [35].
Several paradigms could be defined in the framework of sustainable architecture. The first paradigm focuses on characteristic parameters, which could be mentioned as a function of design and operational variables (reverse aspect). The next paradigm is the framework of environment-friendly approach to architecture, being known as “from cradle to grave” among architects, the building analysis should be applied throughout its entire life cycle. The final paradigm of sustainable policy indicates that, between one to three years, buildings should be designed with a demand for energy close to zero [27].

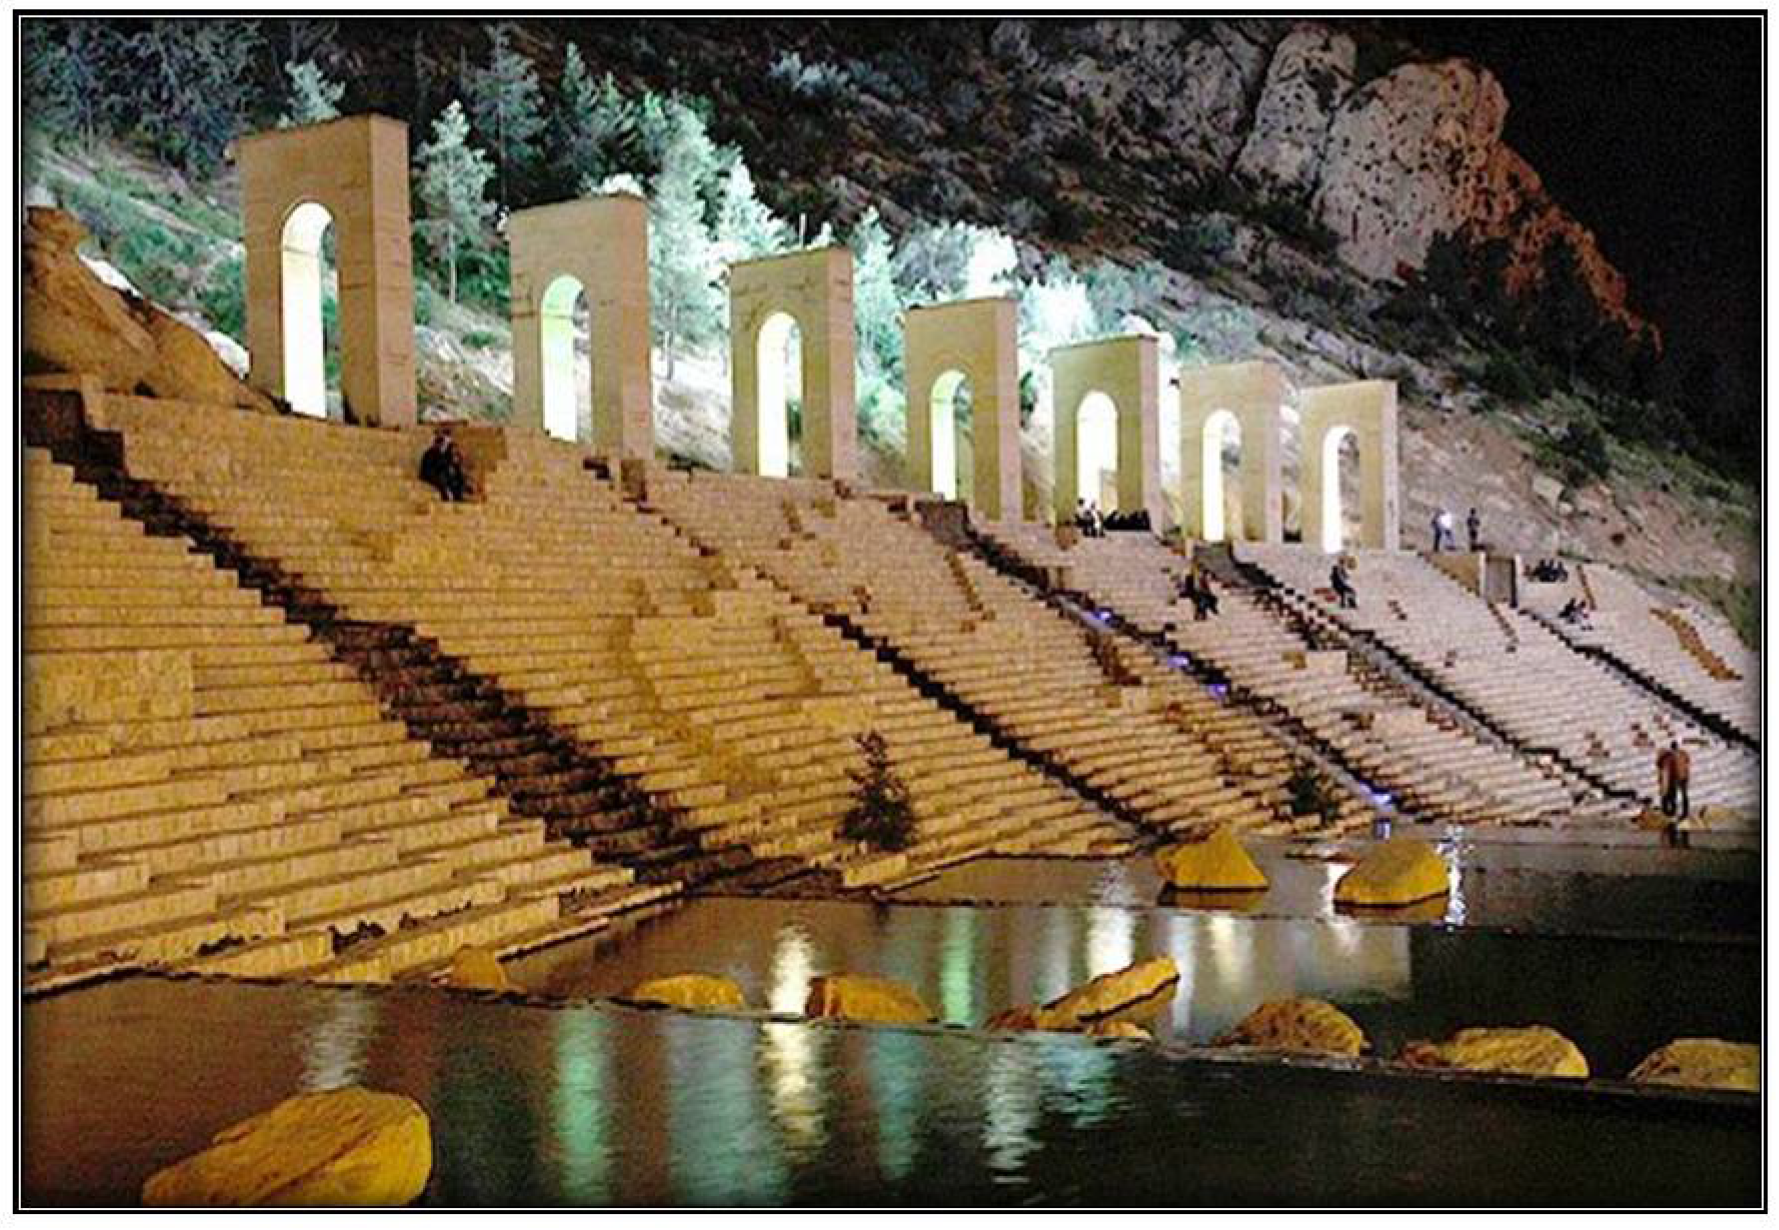
2.2. Contemporary Architecture of Iran

Modern architecture of Iran is a period of Persian architecture that started during the empire of QAJARS and continues to the present. At first, modern architecture of Iran was deeply affected by European architecture. Hence, more spacing creativity could be seen in the buildings of that era. Concurrently, new spaces are created and were faced with more various spaces. In other words, Persian architecture during Qajars Empire can be named as the evolution phase of Persian traditional architecture. Qajars architecture improved principles and patterns of Persian architecture and provided space innovations. Construction of castles and palaces is the most important component of Persian architecture during this period. The Sepahsalar School is known as the first modern building of Iran designed by the first Iranian architect who had been trained in Europe (Figure 2) [36].
During the Pahlavi Empire, transformation of European architecture, such as using concrete, steel, and glass, instead of traditional materials, is observable in Persian architecture. Since this era, European decoration and elements are presented in the houses and interior design of the buildings. In Pahlavis architecture, some building elements, such as, porches, doors, and windows became more look like European forms. In fact, Persian architecture during this time was a combination of Qajars architecture and some imported elements. Modern architecture of Iran was affected by expressionism architecture of Germany before 1930. In addition to forming public and residential architecture, during this era, industrial architecture, which is one of the components of modern architecture, were detected. Sa’dabad Palace is one of the best-known buildings of this era. (Figure 3) [36].
After the Islamic revolution, architecture in Iran changed to a combination of modern architecture, Persian architecture, and Islamic architecture. Since then, Iranian architecture consisted of a wide range of tendencies embracing postmodern classicism (Figure 4 and Figure 5). Among the mentioned tendencies, Iranian-Islamic tendency was strongly supported by the government. In fact, the main purpose of Persian architects during this time was to provide a balance between Persian traditional architecture and modern architecture [36].
In Table 1 case studies which have been introduced in Figure 2, Figure 3 and Figure 4, have been investigated based on typology, material, and technology.
In recent years, a few studies have been performed in the field of sustainability related to the contemporary architecture of Iran. For example, in 2016, Alidadi and Zadeh indicated the effect of sustainable architecture in designing a five-star hotel in Iran [37]. Karimi and Zandieh compared modern architectural principles of sustainability in Persian architecture with five modern sustainable cities in the world [38]. Moreover, in 2016, Makari Faraji and Mokhtari Taleghani studied regarding the role of sustainable architecture in valuable historical districts of Tehran [39]. Table 2 demonstrates a classification of recent studies related to sustainable architecture.
The innovative aspect of the current research in comparison with the aforementioned studies is argued as follow: First, we used the new hybrid approach of MCDM methods and sustainability for the first time to analyze the contemporary architecture of Iran. Furthermore, this research presents a follow-up discussion and builds upon the Bonenberg’s and Kaplinski’s research [27].
The next, for the novelty of our proposed approach based upon the literature review, the authors found only four articles related to MCDM methods that were applied in the field of sustainable architecture in the Web of Science (Clarivate Analytic) database [16,18,23,40]. Furthermore, based upon review articles [41,42,43,44], many studies focusing on sustainable decision-making in civil engineering, construction, and building have been made, but nearly no applications in architecture were identified. Moreover, even fewer hybrid MCDM methods were applied for sustainability and engineering problems, though it was proved that they are extremely suitable [42,44]. Accordingly, they argued that sustainability studies could be considered in the best way by applying MCDM methods when evaluating several criteria groups. Thus, our proposed method considering hybrid MCDM models and their application in sustainable architecture is novel according to the studied literature. Moreover, a new hybrid method, including BMW and COPRAS methods under a fuzzy environment, has been developed and applied for the first time.

3. Research Methodology

In this section, at first, best-worst multi-criteria decision-making method (BWM), complex proportional assessment method (COPRAS), fuzzy sets theory, and a defuzzification technique are explained in detail. Afterwards, the stages of multi-criteria analysis of prioritizing key factors of sustainability in Persian contemporary architecture are described.

3.1. Best-Worst Method (BWM)

BWM is one of the newest methods for solving multi-criteria decision-making problems, and was introduced by Rezaei [45] in 2015. In this method, first, the best (e.g., most desirable, most important) and the worst (e.g., least desirable, least important) criteria are chosen by the decision-maker. Afterwards, upon the BWM questionnaire, pairwise comparisons should be performed between each of these two criteria (best and worst) and the other criteria. For determining the weights of decision-making criteria a maximum problem is formulated. In order to check the reliability of the comparisons a consistency ratio is proposed for the BWM [45]. In our proposed approach, this method was employed in order to weight the decision-making criteria, considering each one’s advantages in comparison with other existing MCDM methods, being the requirement of less comparison data in conjunction with more consistent comparisons and more reliable results.
In 2017, Gupta and Barua applied BWM in order to select suppliers among SMEs on the basis of their green innovation ability [46]. Likewise, Ahmadi et al. performed BWM in favor of assessing the social sustainability of supply chains [47]. Van de Kaa, Kamp, and Rezaei practiced the mentioned method for the selection of biomass thermochemical conversion technology in the Netherlands [48]. BWM was also tested to analyze the barriers to humanitarian supply chain management by Sahebi et al. [49]. In addition, a supplier selection life cycle approach integrating traditional and environmental criteria by using BWM, was presented by Rezaei et al. [50]. Eventually, Mokhtarzadeh et al., presented a hybrid model including BWM to analyze the technology portfolio selection problem [51]. In this part, the steps of BWM for deriving the weights of the criteria are described [45].
Step 1. A set of decision criteria { c 1 ,   c 2 ,   ,   c n } have to be determined.
Step 2. The best and the worst criteria in general are identified by the decision-maker.
Step 3. Based on the BWM questionnaire, the preference of the best criterion over all the other criteria using a number between 1 and 9 should be determined. The resulting best-to-others vector would be:
A B = ( a B 1 ,   a B 2 ,   ,   a B n )
where a B j indicates the preference of the best criterion B over criterion j. It is clear that a B B = 1 .
Step 4. According to the BWM questionnaire the preference of all the criteria over the worst criterion using a number between 1 and 9 must be determined. The resulting others-to-worst vector would be:
A w = ( a 1 W ,   a 2 W ,   ,   a n W )
where a j W indicates the preference of the criterion j over the worst criterion W. It is clear that a W W = 1 .
Step 5. Finding the optimal weight { W 1 * ,   W 2 * ,   ,   W n *   } by solving Equation (3). It should be mentioned that the optimal weight for the criteria is the one where for each pair of W B W j   and W j W W , we have W B W j = a B j and W j W W = a j W . Considering the non-negativity and sum condition for the weights, the following problem results:
m i n   ε s . t . | W B W j a B j | ε ,   f o r   a l l   j | W j W W a j W | ε ,   f o r   a l l   j W j = 1 W j 0 ,   f o r   a l l   j
By using ε * , the consistency ratio can be calculated. It is clear that the greater the ε * , the higher the consistency ratio, and the less reliable the comparisons are [45]. The consistency ratio can be obtained from the following formula (Table 3):
C o n s i s t e n c y   R a t i o = ε * C o n s i s t e n c y   I n d e x
Considering uncertain circumstances, the following two models are used to calculate the lower and upper bounds of the weights of criterion j based on the grey systems [52]:
m i n   W j s . t . | W B W j a B j | ε * ,   f o r   a l l   j | W j W W a j W | ε * ,   f o r   a l l   j W j = 1 W j 0 ,   f o r   a l l   j
m a x   W j s . t . | W B W j a B j | ε * ,   f o r   a l l   j | W j W W a j W | ε * ,   f o r   a l l   j W j = 1 W j 0 ,   f o r   a l l   j
Solving these two models for each criterion, the optimal weights as interval values can be determined. For ranking the criteria the center of the intervals can be used. However, another option is to rank the criteria based on the interval weights by the help of a matrix of preferences [52].

3.2. Complex Proportional Assessment Method (COPRAS)
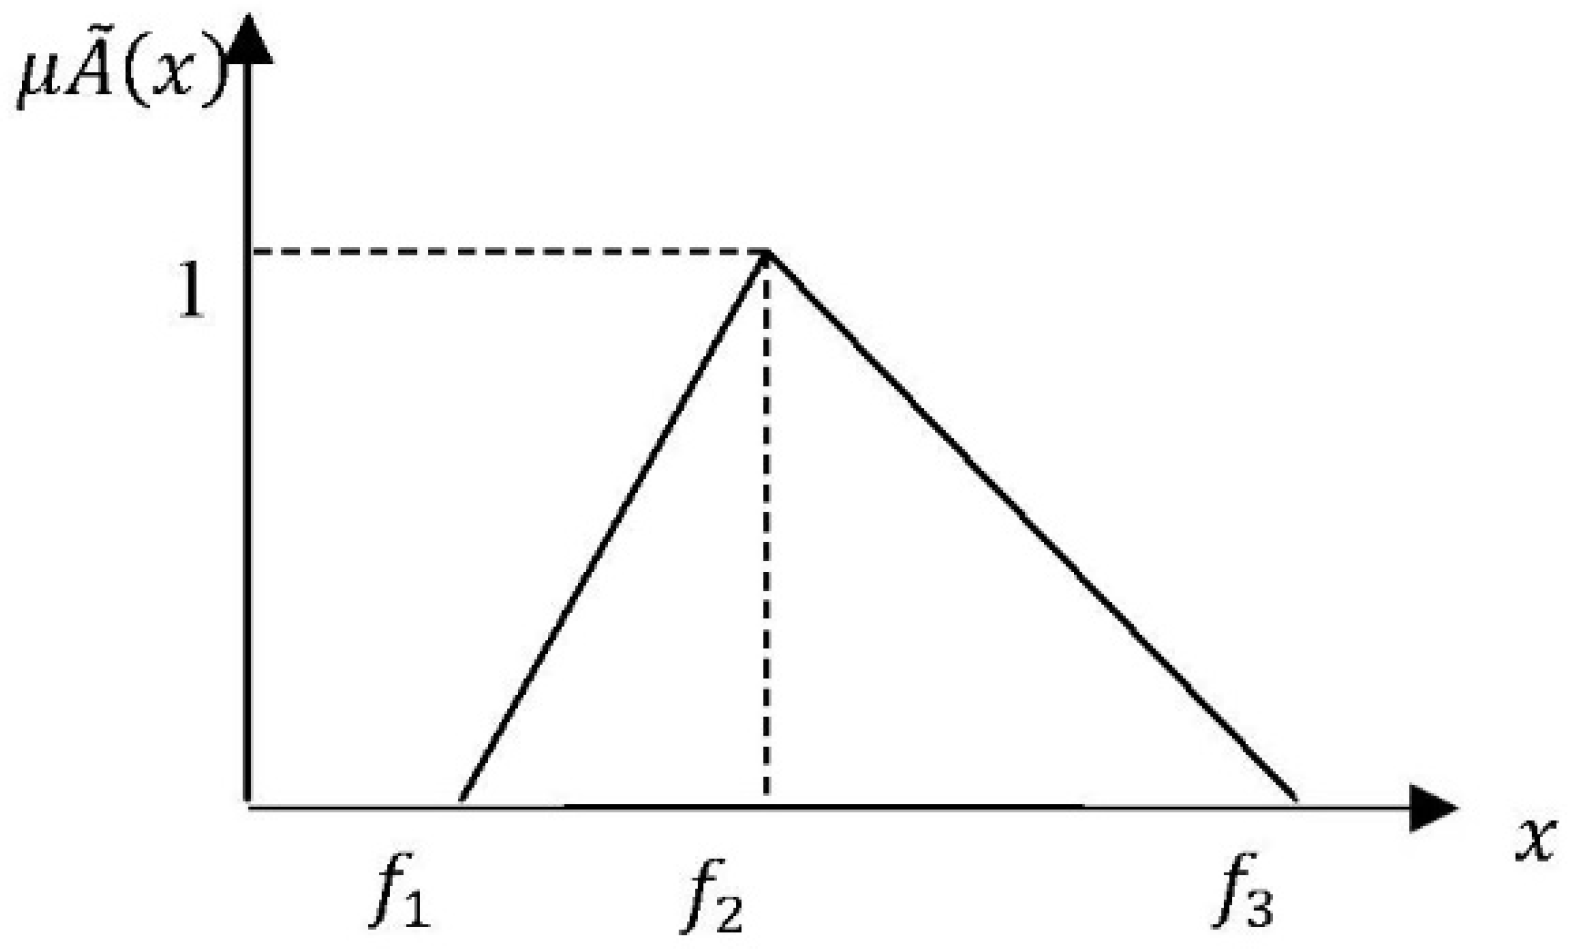
The COPRAS method was introduced by Zavadskas et al. [53]. The reliability and accuracy of the COPRAS method is acknowledged by several scholars and, nowadays, it is used to solve different engineering and management multi-attribute problems [54,55,56,57,58]. Moreover, the accuracy of performance measures in the COPRAS method assumes direct and proportional dependence of the significance and utility degree of investigated alternatives on a system of criteria [59].
COPRAS with fuzzy sets information is a developed method for solving decision-making problems under uncertain situations, introduced by Zavadskas and Antucheviciene [60]. In this paper, the assessment and prioritizing of the key factors of environmental sustainability in contemporary rural buildings is analyzed by the fuzzy COPRAS method.
In 2016 Beheshti et al. performed the COPRAS method for strategy portfolio optimization [53]. Pitchipoo et al. applied the COPRAS method in order to optimize blind spots in heavy vehicles [61]. In addition, the mentioned method was used to assess the neglected areas in Vilnius by Bielinskas et al. [62]. By applying the COPRAS method, the evaluation of construction projects of hotels based on environmental sustainability was practiced by Hashemkhani Zolfani et al. [18]. Moreover, Polat et al. applied the COPRAS method as a tool for mechanical designer selection [63].
Lithuanian scientists Zavadskas and Kaklauskas presented a method of multi-criteria complex proportional evaluation for formulating construction and engineering multi-objectives and multi-attribute problems since 1996 [64]. The four stages of this method are presented as below.
Stage 1: Calculate the normalized matrix by the following formula [18,65,66]:
d i j = x i j q i j = 1 n x i j ,   i = 1 ,   ,   m ,   j = 1 ,   ,   n
Remark that xij demonstrates the ith criterion in the jth alternative, m presents the number of criteria, where n stands for alternatives. Moreover, qi illustrates the weight of ith criteria and Dij is the normalized weighted value of each criterion. Note that:
i = 1 m q i = 1
The values of weight qi are usually determined based on the experts’ point of view [18]. The influence of weight qi on aj distributes in proportion to the values of the investigated criterion xij:
q i = j = 1 n d i j ,   i = 1 ,   ,   m ,   j = 1 , ,   n
Stage 2: Following Equation (7), d i j ,   i = 1 ,   ,   m ,   j = 1 , ,   n indicates the normalized weighted value of the i th criteria, which could be a benefit criteria (+) or cost (−). Thus, the j th alternative would be indicated by maximizing d i j + ,   i = 1 ,   ,   m , where i is a benefit and minimizing d i j ,   i = 1 ,   ,   m , where i is a cost [67]. Maximizing the higher value and minimizing the lower value would be more desirable. Minimizing indices ( d i j ) and maximizing indices ( d i j + ) are calculated for each jth alternative. The sum of weighted normalized minimizing and maximizing indices S j and S j + , are calculated by [18,67]:
S ˜ i + =   d i j + ,   i = 1 ,   2 ,   ,   m
S ˜ i =   d i j ,   i = 1 ,   2 ,   ,   m
In all the cases, S j + is the sum of maximizing values from j row’s alternative and S j is the sum of minimizing values from j row’s alternative [68]:
S + = j = 1 n s i + = i = 1 m j = 1 n d i j +
S = j = 1 n s i = i = 1 m j = 1 n d i j
i = 1 ,   ,   m ,   j = 1 , ,   n
Stage 3: The relative significance ( Q ˜ i ) of each alternative aj should be determined according to positive S ˜ j + and negative S ˜ j . It could be calculated by the following formula [69]:
Q ˜ i = s m i n s i s i s m i n s i + s i + ,   i = 1 ,   2 ,   ,   m
Stage 4: After stage 3, the priority of alternatives would be determined. The assessment results of alternatives reflect the initial data submitted by experts [68]. Based on Equation (7), the normalized weighted value of each i th criterion d i j ,   i = 1 ,   ,   m ,   j = 1 , ,   n ; would have a direct and proportional relationship with the variables x i j and q i . According to Equations (10) and (11), it is clear that the sums of S ˜ j + and S ˜ j are linear functions of d i j . In addition, based on Equation (14), the generalizing criterion Q j has a direct linear relationship with the values and weights of the investigated criteria [60]. As a result, the greater the value of the generalizing criterion Q j , the more effective the alternative will be. The satisfaction degree of demands and goals pursued by experts would be indicated by Q j of a j . The significance Q m a x will always be the highest [60].
In order to visually assess the efficiency of alternative the utility degree N i can be calculated. The degree of utility is determined by comparing the alternative analyzed with the most efficient alternative from the set of alternatives [70]. By comparing the variant which is analyzed with Q m a x , the degree of the variant utility ( N i ) can be determined [60]:
N i =   Q i Q m a x × 100
All the utility degree values related to the alternatives analyzed range from 0% to 100%.

3.3. Fuzzy Numbers

Considering the fuzziness of the available data, hereby, the decision matrix can be converted into a fuzzy decision matrix and a weighted normalized fuzzy decision matrix will be constructed [71]. In this paper the triangular fuzzy numbers were applied [72]. A triangular fuzzy number can be defined by a triplet (f1, f2, f3) and is shown in Figure 6.
The membership function μ of is defined as [67]:
μ A ˜ ( x ) = { 0 , x < f 1 x f 1 f 2 f 1 , f 1 x f 2 x f 3 f 2 f 3 , f 2 x < f 3 0 , x > f 3
The operations on fuzzy triangular numbers used in this research are defined as follows [72,73].
f ˜ + f ` ˜ = ( f 1 + f ` 1 ,   f 2 + f ` 2 ,   f 3 + f ` 3 )
f ˜ × f ` ˜ = ( f 1 × f ` 1 ,   f 2 × f ` 2 ,   f 3 × f ` 3 )
f ˜ ÷ f ` ˜ = ( f 1 ÷ f ` 3 ,   f 2 ÷ f ` 2 ,   f 3 ÷ f ` 1 )

3.3.1. A Linguistic Variable

According to Zadeh, it is complicated for a conventional quantification to reasonably express those situations being complex to describe. Accordingly, a linguistic variable is useful in such circumstances [71,74]. Fuzzy numbers can represent linguistic variables. The relationship between linguistic variables and TFN are presented in Table 4 and Table 5.
In this paper, the ratings of qualitative criteria and the weights, and evaluating key factors of environmental sustainability in contemporary architecture of Iran, are considered as linguistic variables.

3.3.2. Defuzzification

The results of fuzzy decisions are fuzzy numbers. As a result, a problem of ranking fuzzy numbers may appear in MCDM. In order to solve this problem a defuzzification should be performed. The procedure of defuzzification is to locate the best non-fuzzy performance (BNP) value [72]. Several methods of defuzzification are available, such as mean-of-maximum, center-of-area, and a-cut methods [76,77]. In this research the center-of-area method is used. The defuzzified value of a fuzzy number would be obtained by applying the following equation [74]:
Q i = f 1 + [ ( f 3 f 1 ) + ( f 2 f 1 ) ] 3
where BNP is the best non-fuzzy performance value, f2 is a mode, and f1 and f3 are the lower and the upper limits of fuzzy triangular number f, respectively.

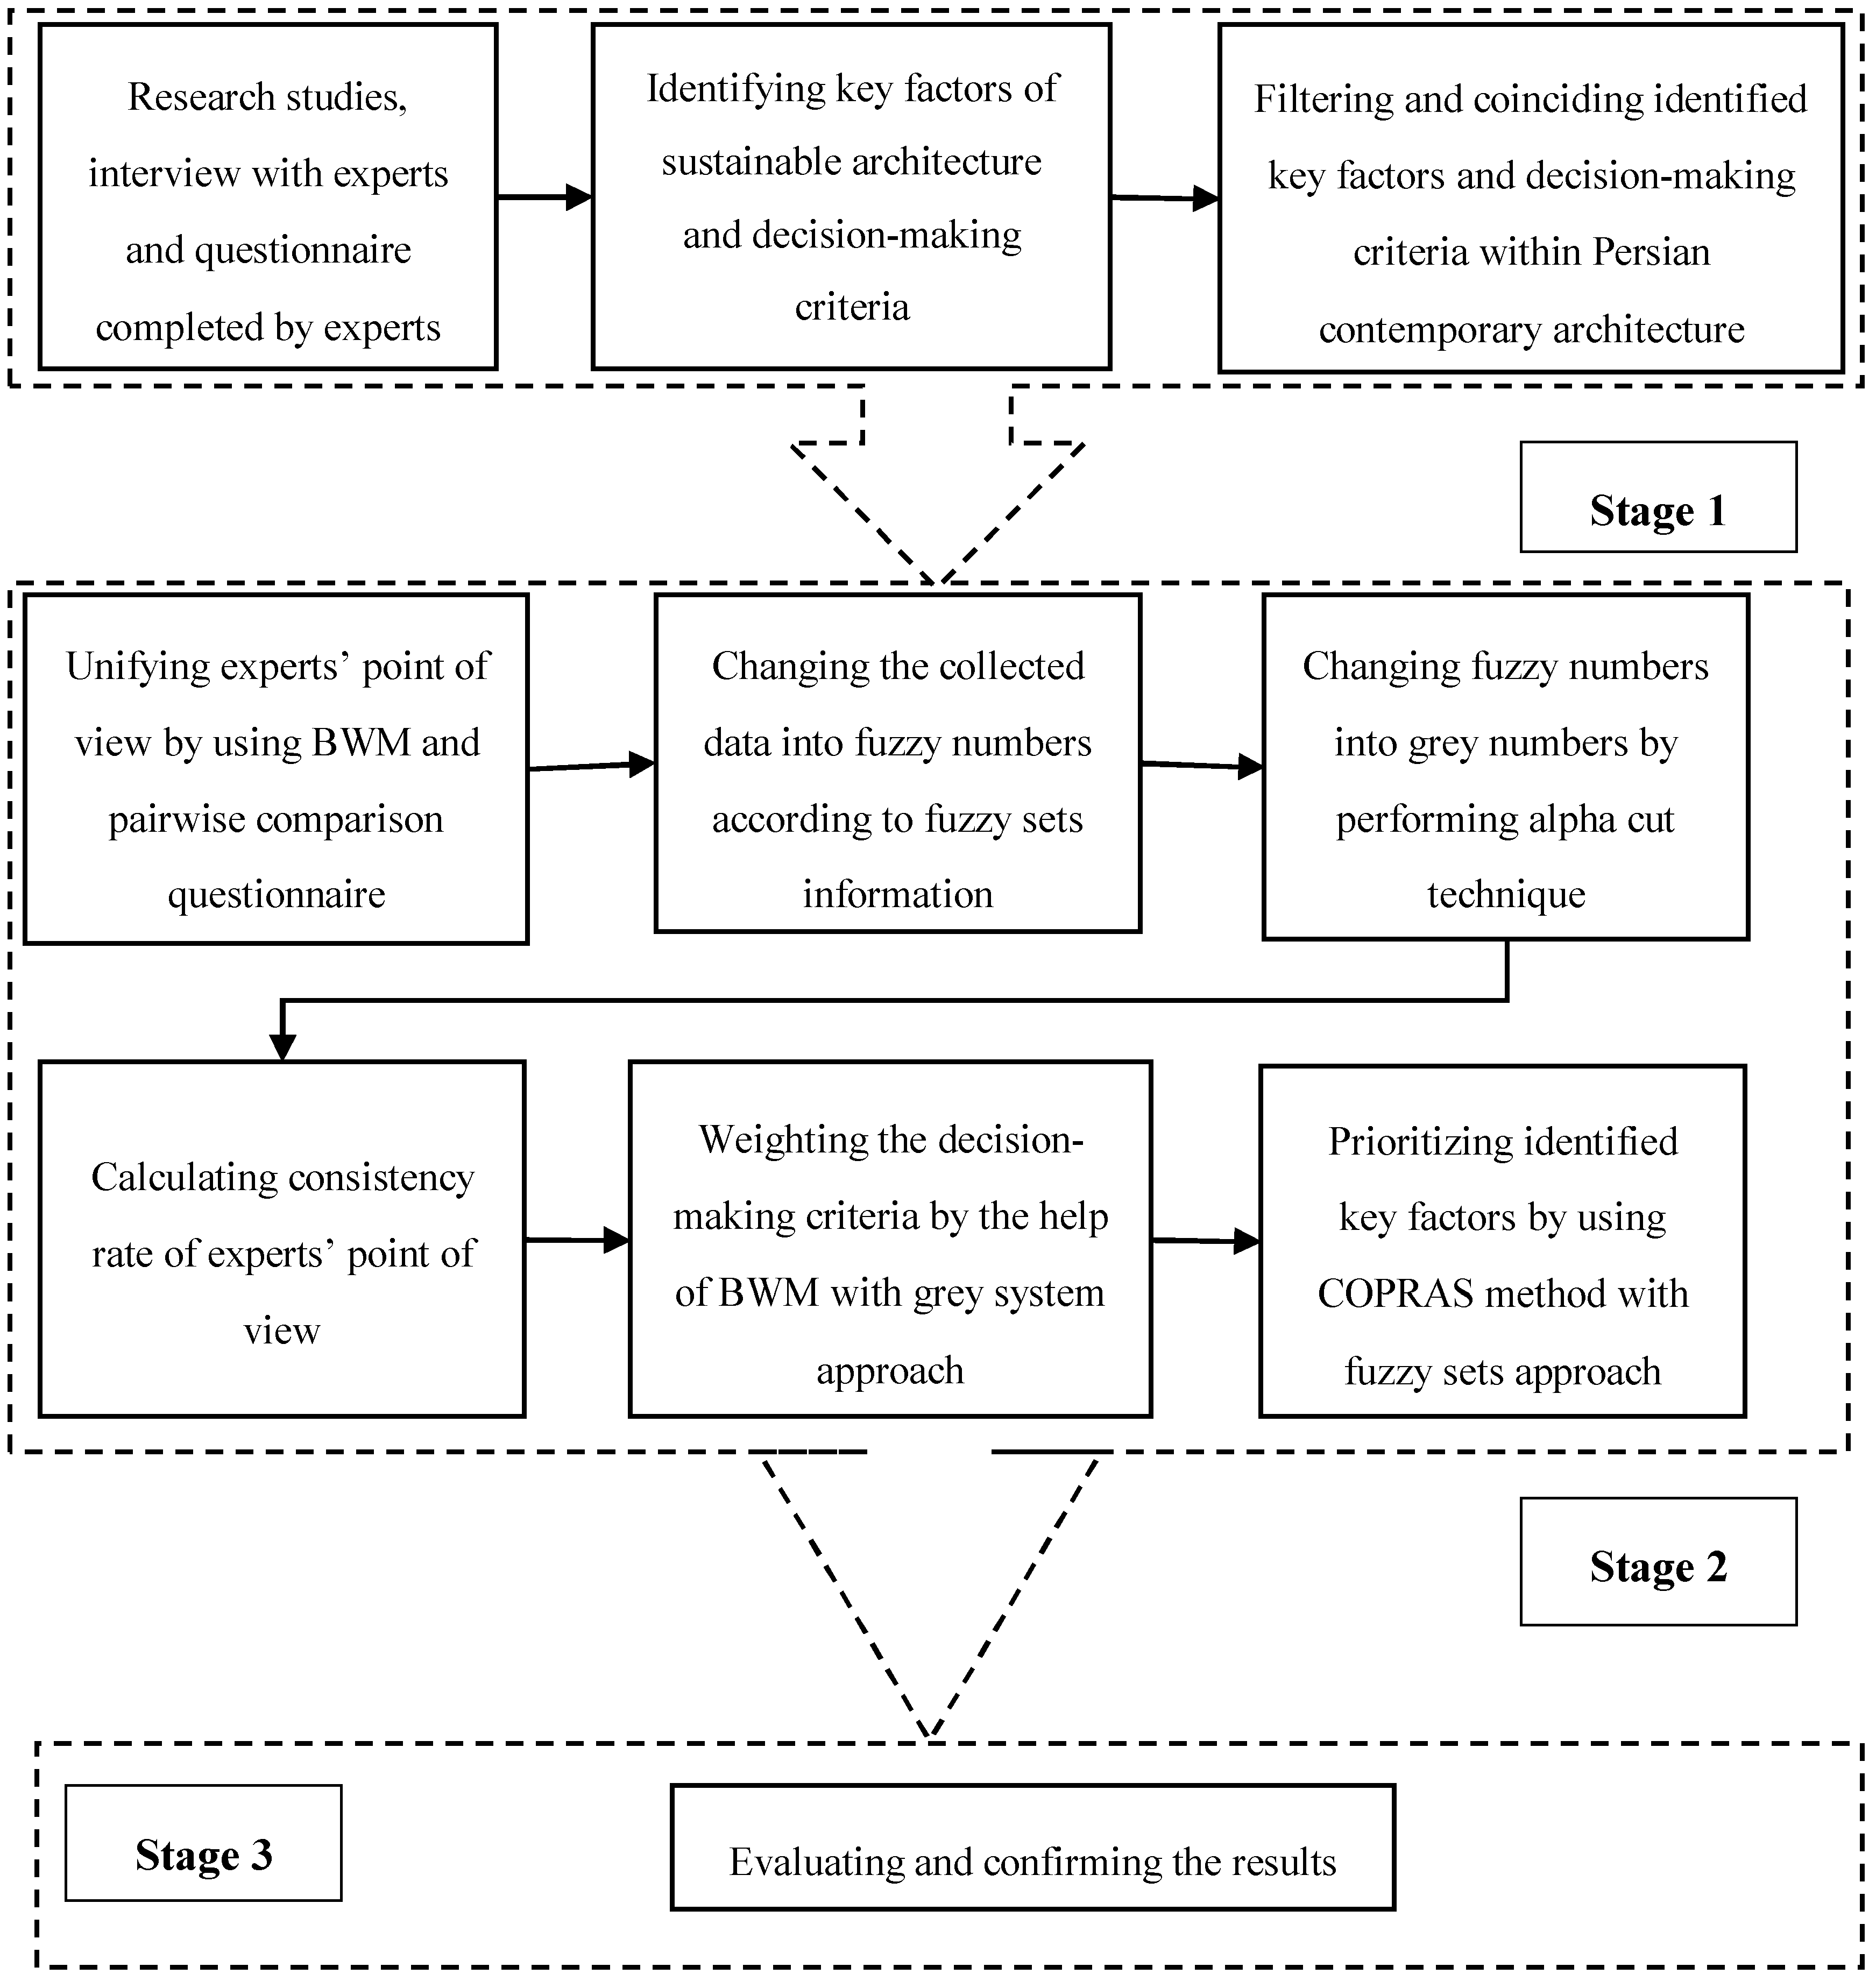
3.4. Proposed Approach

The process of multiple-criteria analysis in identifying and prioritizing key factors of environmental sustainability of Iranian contemporary architecture by performing the fuzzy set approach is performed in several stages, being presented in Figure 7.
Stage 1. According to the method of multiple-criteria decision-making, the key factors of environmental sustainability should be determined. For this reason, the initial information was collected by the help of research studies, interviews, and questionnaires.
Stage 2.
Step 1
  • After identifying key factors and criteria of the decision-making problem according to the experts, their opinions should be unified. For this reason, at first, the best and the worst criteria are resolved. Thereupon, the experts determine the preference of the best criterion over all the other criteria. Moreover, preference of the criteria over the worst criterion is determined accordingly.
Step 2
  • The results of pairwise comparisons are transferred into triangular fuzzy numbers. By means of unification, the average of triangular fuzzy numbers is calculated.
Step 3
  • Since the mathematical model of BWM is a deterministic nonlinear model, in this step, the average of the triangular fuzzy numbers should be transformed into grey numbers through alpha cut technique by using the following equation:
    ( l ( α ) ,   u ( α ) ) = ( f 1 + α ( f 2 f 1 ) ,   f 3 + α ( f 2 f 3 ) )
Step 4
  • After changing triangular fuzzy numbers into grey numbers by the help of the alpha cut technique, AB (the preference of the best criterion over all the other criteria) and AW (the preference of all the criteria over the worst criterion) can be created based on the different amounts of alpha between zero and one.
  • Since the center of the grey numbers for different amounts of alpha is the same, based on Equation (3), a mathematical model could be defined. By solving the model, ξ* is obtained. According to ξ* and Table 3, the consistency ratio can be calculated.
Step 5
  • In order to determine the lower and upper bounds of the weight of criterion j, two mathematical models should be proposed for different amounts of alpha based on Equations (5) and (6). By solving these two models for all the criteria, the optimal weights of the criteria can be determined as interval values.
Step 6
  • In this part, each expert fills out the evaluation questionnaire of alternatives over decision-making criteria based on fuzzy numbers. Next, by means of unification, the average of triangular fuzzy numbers is calculated.
  • In order to prioritizing alternatives with COPRAS method, first of all, the decision-making matrix with triangular numbers must be created. Afterwards, the decision-making matrix should be turned into normalized weighted matrix.
  • After creating the normalized weighted decision-making matrix, the values S j + and S j have to be figured out for all the alternatives.
  • In the last step, the relative significance of each alternative a j ( Q j ) is determined according to positive S j + and negative S j . Then, the determined Q ˜ i should be defuzzied ( Q j ) and, finally, the degree of the variant utility ( N i ) is calculated by a comparison of the variant that is analyzed with the most efficient one.
Stage 3.
  • Eventually the results are emanated and the comparison between different alpha cuts is presented for more consideration.

4. Results and Case Study

4.1. Identifying Alternatives and Criteria

Based on the explored principles of the sustainable architecture, including energy saving, harmony with climate, reduction in the use of new resources, satisfying the needs of residents, harmony with the site and unification [32], and according to the experts’ point of view, six factors were chosen as the key factors of environmental sustainability in the contemporary architecture of Iran. Experts were chosen among academic and executive professionals in the fields of architecture, civil engineering, and project management. Moreover, they were divided into three different groups based on their professions. Table 6 shows three expert groups in detail.
The mentioned six factors of environmental sustainability in contemporary architecture of Iran, emanated from the aforementioned approach, are illustrated as follows:
  • Proving building management systems (a1);
  • Applying rules of continental design (a2);
  • Practicing renewal sources (a3);
  • Performing human design (a4);
  • Adopting ecological rules in design (a5); and
  • Creating engagement between buildings and other urban systems (a6).
Similarly, the following six items were determined as the criteria of the decision-making problem, to evaluate the key factors of environmental sustainability in contemporary architecture of Iran:
  • Execution cost (c1);
  • Maintenance cost (c2);
  • Easiness of execution (c3);
  • Reducing current costs (c4);
  • Adaptability with built buildings (c5); and
  • Accessibility to required knowledge (c6).

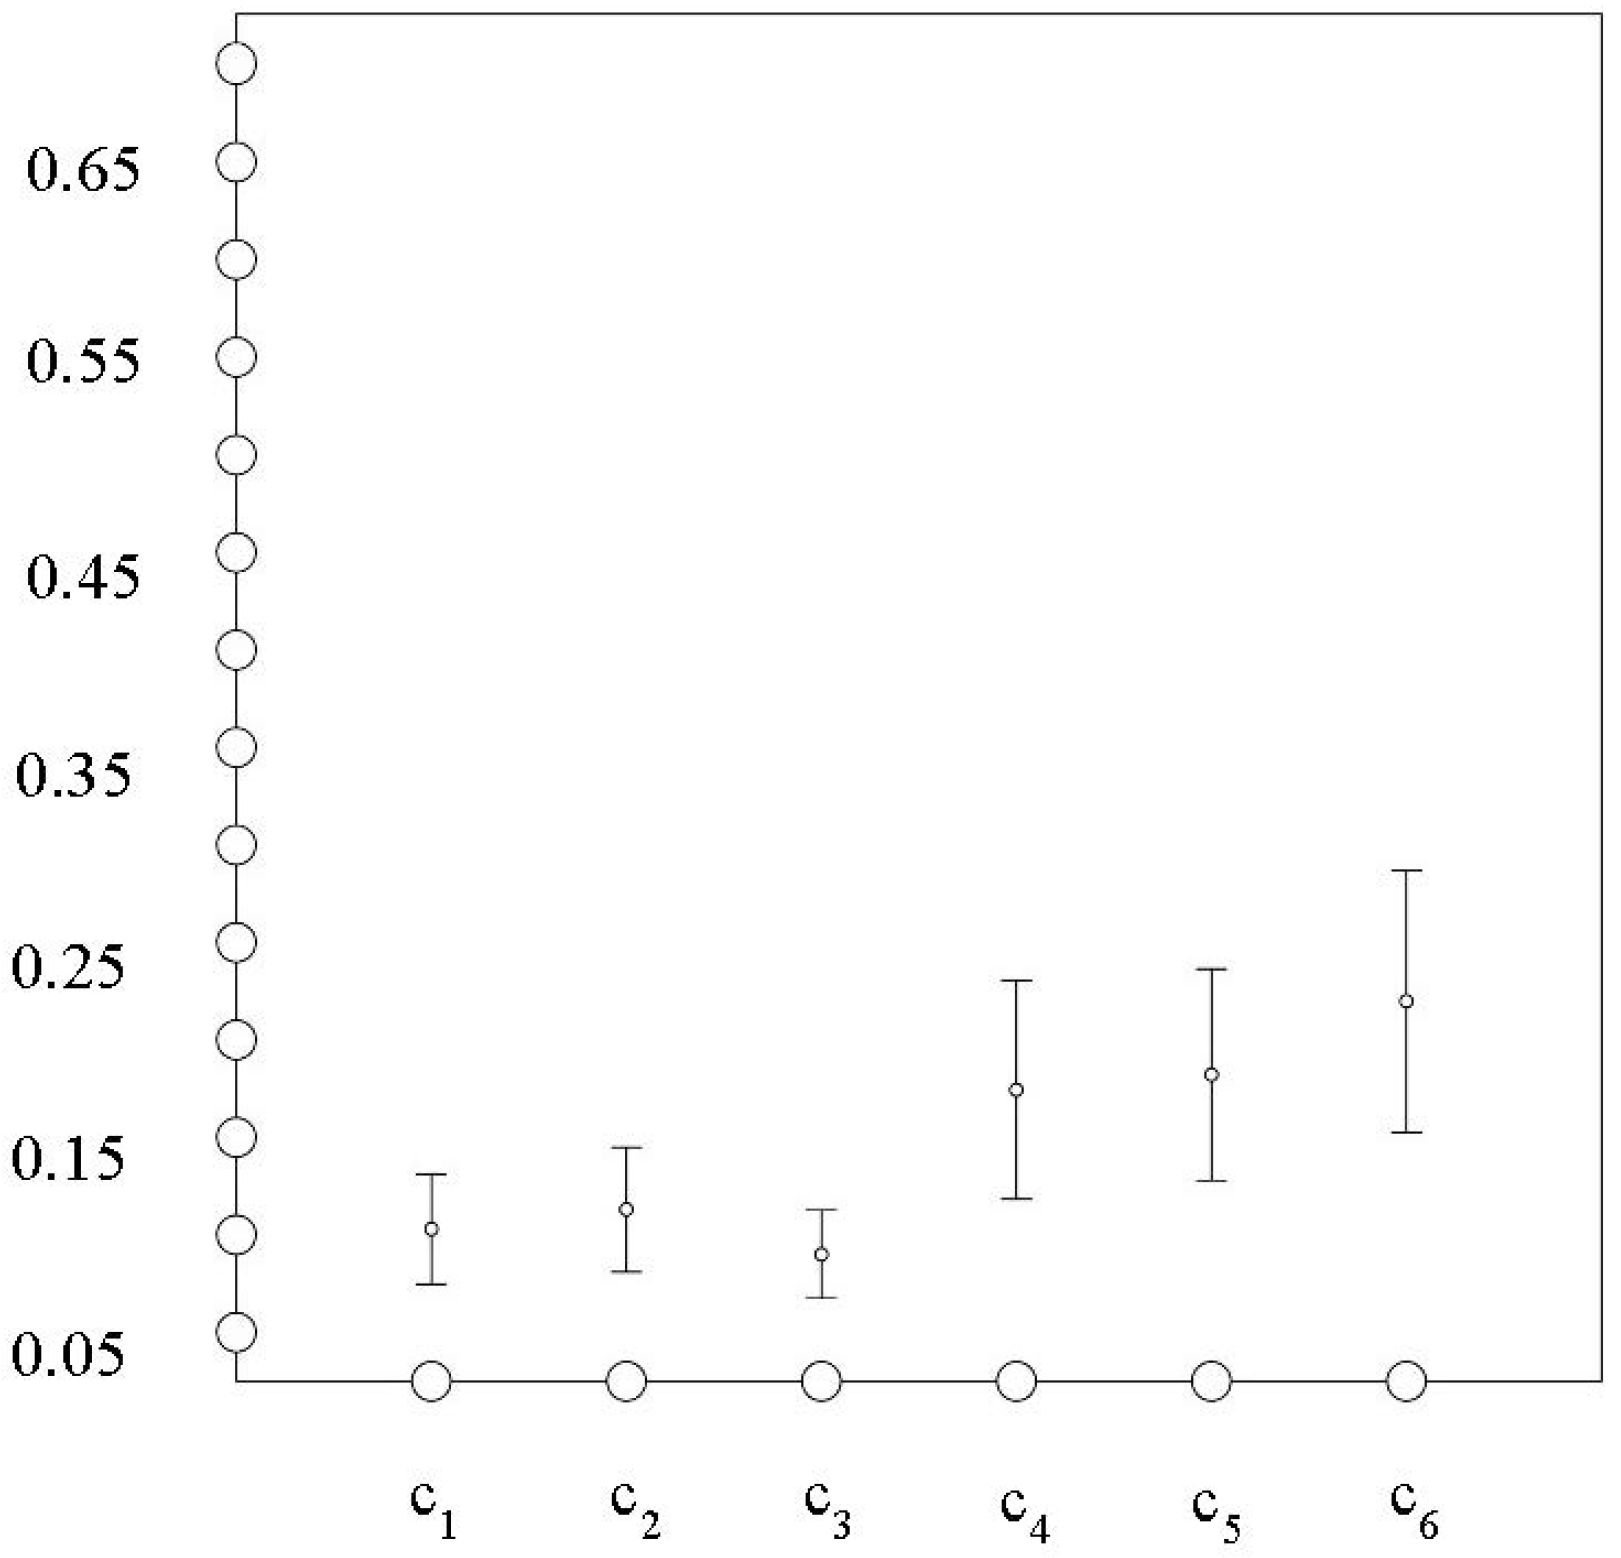
4.2. Weighting Criteria with BWM

As it was mentioned in Section 3.1, BWM was chosen for weighting criteria because of its advantages, which require less comparison data in conjunction with more consistent comparisons and more reliable results.
Step 1. At first, c6 (accessibility to required knowledge) was determined as the best criteria and c3 (easiness of execution) was determined as the worst criteria by the brain-storming among the experts. Subsequently, the preference of the best criterion (c6) over all the other criteria was determined by the experts. Table 7 shows the results of this step.
Preference of the criteria over the worst criterion was determined according to the experts’ opinion. Table 8 indicates the results of this step.
Step 2. The average of the triangular fuzzy numbers has transformed into grey numbers through the alpha cut technique and by Equation (20). Table 9 shows the results of changing triangular fuzzy numbers into grey numbers according to different amounts of alpha.
Moreover, Table 10 indicates the results of pairwise comparison vector for the worst criterion with grey numbers according to different amounts of alpha.
In this step, according to Equations (1) and (2), AB (the preference of the best criterion over all the other criteria) and AW (the preference of all the criteria over the worst criterion) were created based on the different amounts of alpha.
Step 3. Since the center of the grey numbers for different amounts of alpha is the same, according to Equation (3), the following problem could be defined:
M i n   M a x   { | W 6 W 1 2.33 | , | W 6 W 2 1.83 | , | W 6 W 3 2.83 | , | W 6 W 4 1.16 | , | W 6 W 5 1.5 | , | W 1 W 3 1 | , | W 2 W 3 1.16 | , | W 4 W 3 2.33 | , W 5 W 3 2.16 }
s . t : W 1 + W 2 + W 3 + W 4 + W 5 + W 6 = 1 W j 0 ,   j n
This problem can be transferred to the following problem:
M i n   ε S . t . | W 6 W 1 2.33 | ε | W 6 W 2 1.83 | ε | W 6 W 3 2.83 | ε | W 6 W 4 1.16 | ε | W 6 W 5 1.5 | ε | W 1 W 3 1 | ε | W 2 W 3 1.16 | ε | W 4 W 3 2.33 | ε | W 5 W 3 2.16 | ε W 1 + W 2 + W 3 + W 4 + W 5 + W 6 = 1 W j 0 ,   j n
By solving the problem with Lingo 17.0 software (Chicago, IL, USA), ε * is obtained (0.2611469). According to ε * , Table 2, and Equation (4), the consistency ratio can be calculated as below, indicating the appropriate consistency of results obtained from average opinion:
C R =   0.261 3 =   0.087
Step 4. Based on Equations (5) and (6), the following two models can be proposed for different amounts of alpha, in order to determine the upper and lower weights of criterion j:
Lower bound of w1Upper bound of w1
M i n   W 1 S . t . | W 6 W 1 2.33 | 0.261 | W 6 W 2 1.83 | 0.261 | W 6 W 3 2.83 | 0.261 | W 6 W 4 1.16 | 0.261 | W 6 W 5 1.5 | 0.261 | W 1 W 3 1 | 0.261 | W 2 W 3 1.16 | 0.261 | W 4 W 3 2.33 | 0.261 | W 5 W 3 2.16 | 0.261 W 1 + W 2 + W 3 + W 4 + W 5 + W 6 = 1 W j 0 ,   j n
M a x   W 1 S . t . | W 6 W 1 2.33 | 0.261 | W 6 W 2 1.83 | 0.261 | W 6 W 3 2.83 | 0.261 | W 6 W 4 1.16 | 0.261 | W 6 W 5 1.5 | 0.261 | W 1 W 3 1 | 0.261 | W 2 W 3 1.16 | 0.261 | W 4 W 3 2.33 | 0.261 | W 5 W 3 2.16 | 0.261 W 1 + W 2 + W 3 + W 4 + W 5 + W 6 = 1 W j 0 ,   j n
By solving these two models for all the criteria, we can determine the optimal weights of the criteria as interval values. The center of intervals can be used to rank the criteria or alternatives. Table 11 shows the optimal weights of the criteria.
Figure 8 illustrates the width, lower, and upper bounds of the optimal weights.
However, another option is to rank the criteria or alternatives based on the interval weights. The matrix of the degree of preference and the matrix of preferences were applied for final prioritization. The results are presented in Table 12 [42].
Based on the sum of the rows, the following ranking emerges as below, being compatible with the initial weights emanated from nonlinear model:
c6 > c5 > c4 > c2 > c1 > c3

4.3. Prioritizing Alternatives with the COPRAS Method

In order to prioritize alternatives, the COPRAS method was selected according to its superiority compared to other existing MCDM methods, including easiness of the procedure, considering every aspect of each criteria, and separation of negative and positive criteria.
Step 1. In the first step, evaluation of alternatives over decision-making criteria was applied by the experts. Table 13 demonstrated the results of this step.
Step 2. In order to prioritize alternatives with the fuzzy COPRAS method, the decision-making matrix with triangular fuzzy numbers was created. It should be mentioned that, in this matrix in order to use the calculated weights of the criteria, the center of the grey numbers has been applied. Table 14 indicates the decision-making matrix with fuzzy numbers; (+) presents positive criteria and (−) illustrates negative criteria.
Step 3. The decision-making matrix has been transferred into a normalized weighted matrix using Equations (7)–(9). Table 15 denotes the normalized weighted decision-making matrix with fuzzy numbers.
Step 4. Subsequently, the values S ˜ i + and S ˜ i have been determined for all the alternatives according to Equations (11) and (12). The results are uncovered in Table 16.
Step 5. The relative significance of each alternative a j ( Q ˜ i ) was determined according to Equation (14). Afterwards, the determined Q ˜ i has been defuzzied ( Q i ) by Equation (19). Finally, the degree of the variant utility ( N i ) was calculated by Equation (15). The results are illustrated in Table 17.
As Table 17 reveals, the priority of key factors of environmental sustainability in Iranian contemporary architecture is presented as below:
  • Creating engagement between buildings and other urban systems;
  • Applying rules of continental design;
  • Performing human design;
  • Adopting ecological rules in design;
  • Practicing renewable resources; and
  • Proving building management systems.

5. Conclusions

In this research, key factors of environmental sustainability were analyzed with an emphasis on Iranian contemporary architecture, and by combining economic benefits of sustainable architecture, environmental potential, and social interest. Six possible alternatives for sustaining Persian architecture were suggested, including using building management systems, applying rules of continental design, using renewable energy and construction resources, applying human design, applying ecological rules in design, and creating engagement between buildings and other urban systems. Ranking of alternatives was performed on the mathematical statistical calculations and was based on the criteria system, as developed by the experts.
Calculations by applying fuzzy COPRAS and BWM were suggested, which took into consideration the uncertainty caused by incomplete and inconsistent information that related to sustainable development. The consistency ratio was calculated and the priority of alternatives was determined (Table 17). It has been concluded that among the alternatives, creating engagement between buildings and other urban systems has the first priority, and proving building management systems has the last one. The alternative of applying rules of continental design has the second, performing human design has the third, adopting ecological rules in design has the fourth, and practicing renewable resources presents the fifth priority.
In order to complete this research, and based on the limitations that the authors had been faced with, some suggestions could be mentioned for future studies. Instead of using a lower and upper bounded grey model, the grey model could be solved with other approaches. Approaches possible to perform in uncertain conditions, such as the interval-valued intuitionistic fuzzy approach, could be applied instead of fuzzy and grey approaches. Moreover, one could observe and evaluate other components of sustainable development, like economic sustainability and social sustainability, next to environmental sustainability.
The findings are important for further driving the development of sustainable architecture in Iran, mainly by giving the grounds for weighting different sustainability criteria for the decision-making in the strategy, design, implementation, and impact assessment phases. It is important to note that the number and the list of sustainability criteria may change depending on the country, the region, or the urban setting analyzed, and the method will still work. The demonstrated method allows the architects and urban planners to compose the individually-shaped set of sustainability indicators and weight them accordingly. In particular, both the authorities and the specialists may adapt the findings of this paper to the national sustainability standards and design guidelines, as well as for the sustainability assessment tools in Iran and beyond. The wider question remains: how the research findings can find their way to the regulatory and professional development environments, and this may be the topic for coming research.

Author Contributions

The individual contributions of the authors are indicated as follows: The initial idea was proposed by H.A.M.; The real world case data gathering was prepared by S.A.; applying the proposed approach and analyzing the data was carried out by H.A.M. and S.A.; E.K.Z. and G.S. revised the manuscript completely regarding the abstract, introduction, research design, research methodology, and conclusions; and all authors have read and approved the final manuscript.

Conflicts of Interest

The authors declare no conflicts of interest.

References

  1. Zaib Khan, A.; Vandevyvere, H.; Allacker, K. Design for the Ecological Age: Rethinking the Role. J. Archit. Educ. 2013, 67, 175–185. [Google Scholar] [CrossRef]
  2. Martek, I.; Hosseini, M.R.; Shrestha, A.; Zavadskas, E.K.; Seaton, S. The Sustainability Narrative in Contemporary Architecture: Falling Short of Building a Sustainable Future. Sustainability 2018, 10, 981. [Google Scholar] [CrossRef]
  3. Grierson, D.; Salama, A. Forging advances in sustainable architecture and urbanism. Open House Int. 2016, 41, 4–6. [Google Scholar]
  4. Hamiti, S.W.; Wydler, H. Supporting the Integration of Sustainability into Higher Education Curricula—A Case Study from Switzerland. Sustainability 2014, 6, 3291–3300. [Google Scholar] [CrossRef]
  5. Rahaei, O.; Derakhshan, S.; Shirgir, N. Environmental architecture: The role of sustainable structures in futuristic buildings. J. Fundam. Appl. Sci. 2016, 8, 559–613. [Google Scholar] [CrossRef]
  6. Amiri, N.; Vatandoost, M. The Study of the Relationship between Sustainable Architecture and Vernacular Architecture in the North of Iran. J. Hist. Cult. Art Res. 2017, 6, 436–450. [Google Scholar] [CrossRef]
  7. Maywald, C.; Riesser, F. Sustainability-the art of modern architecture. Procedia Eng. 2016, 155, 238–248. [Google Scholar] [CrossRef]
  8. Farmer, G. From Differentiation to Concretisation: Integrative Experiments in Sustainable Architecture. Societies 2017, 7, 35. [Google Scholar] [CrossRef]
  9. Rieh, S.-Y.; Lee, B.-Y.; Oh, J.-G.; Schuetze, T.; Álvarez, S.P.; Lee, K.; Park, J. Integration of Sustainability into Architectural Education at Accredited Korean Universities. Sustainability 2017, 9, 1121. [Google Scholar] [CrossRef]
  10. Shaker, R.R. The spatial distribution of development in Europe and its underlying sustainability correlations. Appl. Geogr. 2015, 63, 304–314. [Google Scholar] [CrossRef]
  11. Kahle, L.; Gurel-Atay, E. Communicating Sustainability for the Green Economy; M.E. Sharpe: New York, NY, USA, 2014. [Google Scholar]
  12. Hoseynof, E.; Fikret, O. Planning of sustainable cities in view of green architecture. Procedia Eng. 2011, 21, 534–542. [Google Scholar] [CrossRef]
  13. Wang, X.; Altan, H.; Kang, J. Parametric study on the performance of green residential buildings in China. Front. Archit. Res. 2015, 4, 56–67. [Google Scholar] [CrossRef]
  14. Zebari, H.; Ibrahim, R. Methods and strategies for sustainable architecture in Kurdistan region, Iraq. Procedia Environ. Sci. 2016, 34, 202–211. [Google Scholar] [CrossRef]
  15. BREEAM. Available online: http://www.breeam.org (accessed on 16 March 2018).
  16. Zarghami, E. Azemati, H. Fatourehchi, D. Karamloob, M. Customizing well-known sustainability assessment tools for Iranian residential buildings using Fuzzy Analytic Hierarchy Process. Build. Environ. 2018, 128, 107–128. [Google Scholar] [CrossRef]
  17. Shareef, S.L.; Altan, H. Building sustainability rating systems in the Middle East. Proc. Inst. Civ. Eng. Eng. Sustain. 2017, 170, 283–293. [Google Scholar] [CrossRef]
  18. Hashemkhani Zolfani, S.; Pourhossein, M.; Yazdani, M.; Zavadskas, E.K. Evaluating construction projects of hotels based on environmental sustainability with MCDM framework. Alex. Eng. J. 2018, 57, 357–365. [Google Scholar] [CrossRef]
  19. Mazraeh, H.M.; Pazhouhanfar, M. Effects of vernacular architecture structure on urban sustainability case study: Qeshm Island, Iran. Front. Archit. Res. 2018, 7, 11–24. [Google Scholar] [CrossRef]
  20. Sahebzadeh, S.; Heidari, A.; Kamelnia, H.; Baghbani, A. Sustainability Features of Iran’s Vernacular Architecture: A Comparative Study between the Architecture of Hot–Arid and Hot–Arid–Windy Regions. Sustainability 2017, 9, 749. [Google Scholar] [CrossRef]
  21. Park, J.; Yoon, J.; Kim, K.-H. Critical Review of the Material Criteria of Building Sustainability Assessment Tools. Sustainability 2017, 9, 186. [Google Scholar] [CrossRef]
  22. Celiker, A. Sustainable housing: A conceptual approach. Open House Int. 2017, 42, 49–57. [Google Scholar]
  23. Arroyo, P.; Fuenzalida, C.; Albert, A.; Hallowell, M.R. Collaborating in decision making of sustainable building design: An experimental study comparing CBA and WRC methods. Energy Build. 2016, 128, 132–142. [Google Scholar] [CrossRef]
  24. Ismail, M.; Keumala, N.; Dabdoob, R. Review on integrating sustainability knowledge into architectural education: Practice in the UK and the USA. J. Clean. Prod. 2017, 140, 1542–1552. [Google Scholar] [CrossRef]
  25. Lowe, J.; Watts, N. An evaluation of a Breeam case study project. Built Environ. Res. Trans. 2011, 3, 42–53. [Google Scholar]
  26. Yudelson, J. Reinventing Green Building. Why Certification Systems Aren’t Working and What We Can Do About It; New Society Publishers: Gabriola Island, BC, Canada, 2016. [Google Scholar]
  27. Bonenberg, W.; Kapliński, O. The Architect and the Paradigms of Sustainable Development: A Review of Dilemmas. Sustainability 2018, 10, 100. [Google Scholar] [CrossRef]
  28. Burcu, G. Sustainability Education by sustainable School Design. Procedia Soc. Behav. Sci. 2015, 186, 868–873. [Google Scholar] [CrossRef]
  29. Ragheb, A.; El-Shimy, H.; Ragheb, G. Green architecture: A concept of sustainability. Procedia Soc. Behav. Sci. 2016, 216, 778–787. [Google Scholar] [CrossRef]
  30. Tomovska, R.; Radivojevic, A. tracing sustainable design strategies in the example of the traditional. J. Clean. Prod. 2017, 147, 10–24. [Google Scholar] [CrossRef]
  31. Safi, S.; Rahro Mehrabani, S. Design based on sustainable environmental architecture emphasizing maximum natural light output in mountainous climates. Rev. QUID 2017, 1, 593–596. [Google Scholar]
  32. Nastarani, S.; Khaksari, P.; Mohammadi, M. Intelligent buildings with sustainable architecture approach. Rev. QUID 2017, 1, 912–920. [Google Scholar]
  33. CBFEE. Skylighting and Retail Sales: An Investigation into the Relationship between Daylighting and Human Performance; The Heschong Group on behalf of California Board for Energy Efficiency Third Party Program; Pacific Gas and Electric Co.: San Francisco, CA, USA, 1999. [Google Scholar]
  34. CGB, C. Building the GREEN Garden State. New Jersey Municipalities Magazine, 2009; 86. [Google Scholar]
  35. Mohammadi, A.; Saghafi, M.; Tahbaz, M.; Nasrollahi, A. Effects of Vernacular Climatic Strategies (VCS) on Energy Consumption in Common Residential Buildings in Southern Iran: The Case Study of Bushehr City. Sustainability 2017, 9, 1950. [Google Scholar] [CrossRef]
  36. Bani Masoud, A. Iranian Contemporary Architecture; Honar-E-Memari Gharn: Tehran, Iran, 2009. [Google Scholar]
  37. Alidadi, S.; Yousefi Zadeh, Z. The effect of sustainable architecture in designing five star hotel. Turk. Online J. Des. Art Commun. TOJDAC 2016, 6, 2765–2771. [Google Scholar] [CrossRef]
  38. Karimi, S.; Zandieh, M. The development of modern architectural principles of sustainability in order to compare Iran traditional architecture with five modern sustainable city in the world (case study: Vancouver, Copenhagen, Oslo, Curitiba and Masdar). Turk. Online J. Des. Art Commun. TOJDAC 2016, 6, 3141–3157. [Google Scholar] [CrossRef]
  39. Makari Faraji, M.; Mokhtari Taleghani, E. The role of sustainable architecture in valuable historical districts of tehran (a case study of sustainable residential development in Sanglaj district). Turk. Online J. Des. Art Commun. TOJDAC 2016, 6, 1860–1869. [Google Scholar] [CrossRef]
  40. Pons, O.; de la Fuente, A.; Aguado, A. The Use of MIVES as a sustainability assessment MCDM method for architecture and civil engineering applications. Sustainability 2016, 8, 460. [Google Scholar] [CrossRef] [Green Version]
  41. Zavadskas, E.K.; Antucheviciene, J.; Vilutiene, T.; Adeli, H. Sustainable Decision-Making in Civil Engineering, Construction and Building Technology. Sustainability 2017, 10, 14. [Google Scholar] [CrossRef]
  42. Zavadskas, E.K.; Govindan, K.; Antucheviciene, J.; Turskis, Z. Hybrid multiple criteria decision-making methods: A review of applications for sustainability issues. Econ. Res. Ekon. Istraž. 2016, 29, 857–887. [Google Scholar] [CrossRef]
  43. Kaplinski, O. Innovative solutions in construction industry: Review of 2016–2018 events and trends. Sustainability 2018, 10, 27–33. [Google Scholar] [CrossRef]
  44. Zavadskas, E.K.; Antucheviciene, J.; Turskis, Z.; Adeli, H. Hybrid multiple-criteria decision-making methods: A review of applications in engineering. Sci. Iran. 2016, 23, 1–20. [Google Scholar]
  45. Rezaei, J. Best-worst multi-criteria decision-making method. Omega 2015, 53, 49–57. [Google Scholar] [CrossRef]
  46. Gupta, H.; Barua, M. Supplier selection among SMEs on the basis of their green innovation ability using BWM and fuzzy TOPSIS. J. Clean. Prod. 2017, 152, 242–258. [Google Scholar] [CrossRef]
  47. Badri Ahmadi, H.; Kusi-Sarpong, S.; Rezaei, J. Assessing the social sustainability of supply chains using Best Worst Method. Resour. Conserv. Recycl. 2017, 126, 99–106. [Google Scholar] [CrossRef]
  48. Van de Kaa, G.; Kamp, L.; Rezaei, J. Selection of biomass thermochemical conversion technology in the Netherlands: A best worst method approach. J. Clean. Prod. 2017, 166, 32–39. [Google Scholar] [CrossRef]
  49. Ghasemian Sahebi, I.; Arab, A.; Sadeghi Moghadam, M. analyzing the barriers to humanitarian supply chain management: A case study of the Tehran Red Crescent Societies. Int. J. Disaster Risk Reduct. 2017, 24, 232–241. [Google Scholar] [CrossRef]
  50. Rezaei, J.; Nispeling, T.; Sarkis, J.; Tavasszy, L. A supplier selection life cycle approach integrating traditional and environmental criteria using the best worst method. J. Clean. Prod. 2016, 135, 577–588. [Google Scholar] [CrossRef]
  51. Mokhtarzadeh, N.; Amoozad Mahdiraji, H.; Beheshti, M.; Zavadskas, E. A Novel Hybrid Approach for Technology Selection in the Information Technology Industry. Technologies 2018, 6, 34. [Google Scholar] [CrossRef]
  52. Rezaei, J. Best-worst multi-criteria decision-making method: Some properties and a linear model. Omega 2016, 64, 126–130. [Google Scholar] [CrossRef]
  53. Beheshti, M.; Amoozad Mahdiraji, H.; Zavadskas, E.K. Strategy Portfolio Optimization: A COPRAS G-MODM Hybrid approach. Transform. Bus. Econ. 2016, 15, 500–519. [Google Scholar] [CrossRef]
  54. Akahvan, P.; Barak, S.; Maghsoudlou, H.; Antucheviciene, J. FQSPM-SWOT for strategic alliance planning and partner selection; case study in a holding car manufacturer company. Technol. Econ. Dev. Econ. 2015, 21, 165–185. [Google Scholar] [CrossRef]
  55. Rasiulis, R.; Ustinovichius, L.; Vilutiene, T.; Popov, V. Decision model for selection of modernization measures: Public building case. J. Civ. Eng. Manag. 2016, 22, 124–133. [Google Scholar] [CrossRef]
  56. Ecer, F. A Hybrid banking websites quality evaluation model using AHP and COPRAS-G: A Turkey case. Technol. Econ. Dev. Econ. 2014, 20, 758–782. [Google Scholar] [CrossRef]
  57. Cereska, A.; Podvezko, V.; Zavadskas, E.K. Operating Characteristics Analysis of Rotor Systems Using MCDM Methods. Stud. Inform. Control 2016, 25, 59–68. [Google Scholar] [CrossRef]
  58. Cereska, A.; Zavadskas, E.; Cavallaro, F.; Podvezko, V.; Tetsman, I.; Grinbergiene, I. Sustainable Assessment of Aerosol Pollution Decrease Applying Multiple Attribute Decision-Making Methods. Sustainability 2016, 8, 586. [Google Scholar] [CrossRef]
  59. Tamošaitienė, J.; Gaudutis, E. Complex assessment of structural systems. J. Civ. Eng. Manag. 2013, 19, 305–317. [Google Scholar] [CrossRef]
  60. Zavadskas, E.; Antucheviciene, J. Multiple criteria evaluation of rural buildings. Build. Environ. 2007, 42, 436–451. [Google Scholar] [CrossRef]
  61. Pitchipoo, P.; Vincent, D.; Rajini, N.; Rajakarunakaran, S. COPRAS Decision Model to Optimize Blind Spot in Heavy Vehicles: A Comparative Perspective. Procedia Eng. 2014, 97, 1049–1059. [Google Scholar] [CrossRef]
  62. Bielinskas, V.; Burinskienė, M.; Palevičius, V. Assessment of Neglected Areas in Vilnius City Using MCDM and COPRAS Methods. Procedia Eng. 2015, 122, 29–38. [Google Scholar] [CrossRef]
  63. Polat, G.; Bingol, B.; Var, O. An Integrated Multi-criteria-decision-making Tool for Mechanical Designer Selection. Procedia Eng. 2017, 196, 278–285. [Google Scholar] [CrossRef]
  64. Zavadskas, E.; Kaklauskas, A. Multiple Criteria Evaluation of Buildings; Technika: Vilnius, Lithuania, 1996. [Google Scholar]
  65. Kvederyte, E.; Zavadskas, E.K.; Kaklauskas, A. Multiple Criteria Analysis of a Dwelling Life Cycle. J. Statyb. 2000, 6, 179–192. [Google Scholar] [CrossRef]
  66. Zavadskas, E.K.; Kaklauskas, A.; Banaitiene, N. Multiple Criteria Analysis of a Building’s Life Cycle; Technika: Vilnius, Lithuania, 2001. [Google Scholar]
  67. Zavadskas, E.; Kaklauskas, A.; Banaitis, A.; Kvederyte, N. Housing credit access model: The case for Lithuania. Eur. J. Oper. Res. 2004, 155, 335–352. [Google Scholar] [CrossRef]
  68. Staniunas, M.; Medineckiene, M.; Zavadskas, E.; Kalibatas, D. To modernize or not: Ecological–economical assessment of multi-dwelling houses modernization. Arch. Civ. Mech. Eng. 2013, 13, 88–98. [Google Scholar] [CrossRef]
  69. Šiožinytė, E.; Antuchevičienė, J. solving the problems of daylighting and tradition continuity in a reconstructed vernacular building. J. Civ. Eng. Manag. 2013, 19, 873–882. [Google Scholar] [CrossRef]
  70. Tupenaite, L.; Zavadskas, E.; Kaklauskas, A.; Turskis, Z.; Seniut, M. Multiple criteria assessment of alternatives for Built and Human Environment Renovation. J. Civ. Eng. Manag. 2010, 16, 257–266. [Google Scholar] [CrossRef]
  71. Chen, C. Extensions of the TOPSIS for group decision-making under fuzzy environment. Fuzzy Sets Syst. 2000, 114, 1–9. [Google Scholar] [CrossRef]
  72. Triantaphyllou, E.; Lin, C. Development and evaluation of five fuzzy multi-attribute decision-making methods. Int. J. Approx. Reason. 1996, 14, 281–310. [Google Scholar] [CrossRef]
  73. Hwang, C.; Yoon, K. Multiple Attribute Decision-Making Methods and Applications; Springer: Berlin/Heidelberg, Germany; New York, NY, USA, 1981. [Google Scholar]
  74. Tsaur, S.; Chang, T.; Yen, C. The evaluation of airline service quality by fuzzy MCDM. Tour. Manag. 2002, 23, 107–115. [Google Scholar] [CrossRef]
  75. Barbosa de Santis, R.; Golliat, L.; Pestana de Aguiar, E. Multi-criteria supplier selection using fuzzy analytic hierarchy process. Braz. J. Oper. Prod. Manag. 2017, 14, 428–437. [Google Scholar] [CrossRef]
  76. Van Leekwijck, W.; Kerre, E. Defuzzification: Criteria and classification. Fuzzy Sets Syst. 1999, 108, 159–178. [Google Scholar] [CrossRef]
  77. Bardossy, A.; Duckstein, L. Fuzzy Rule-Based Modeling with Applications to Geophysical, Biological and Engineering Systems; CRC Press: Boca Raton, FL, USA, 1995. [Google Scholar]
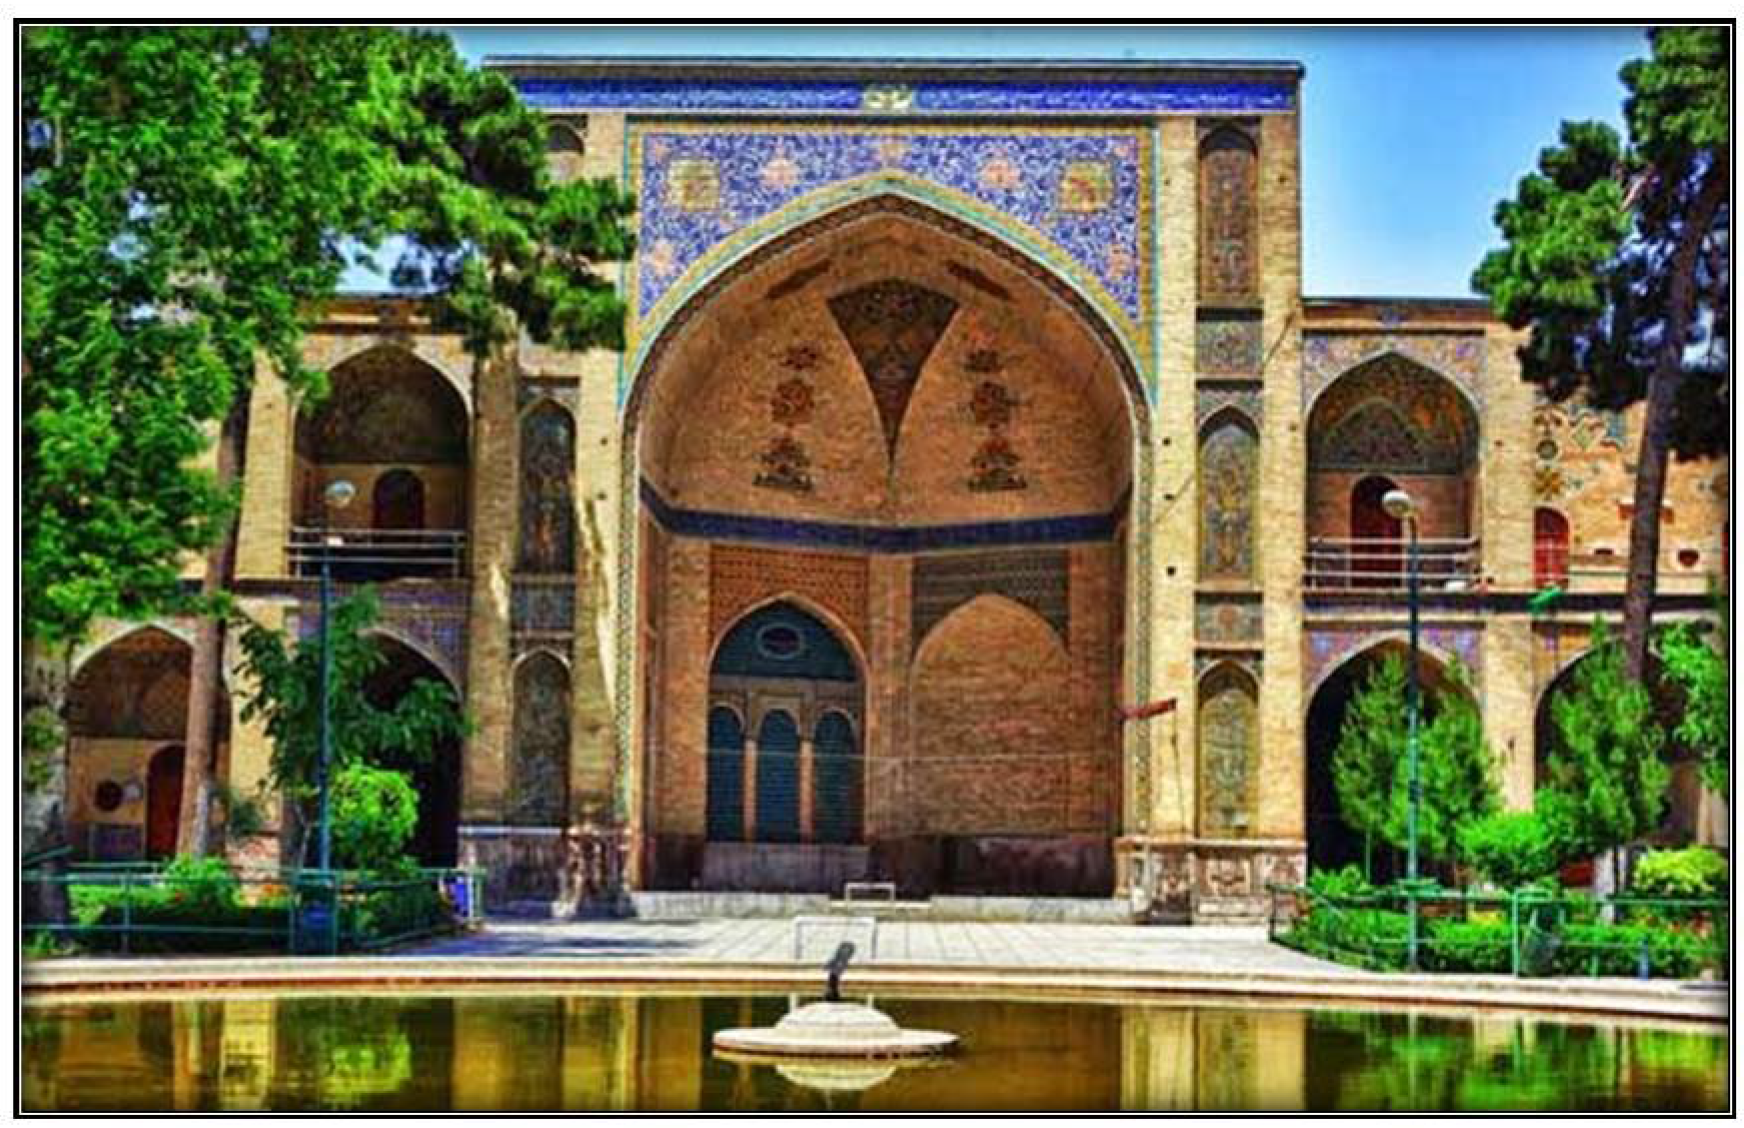
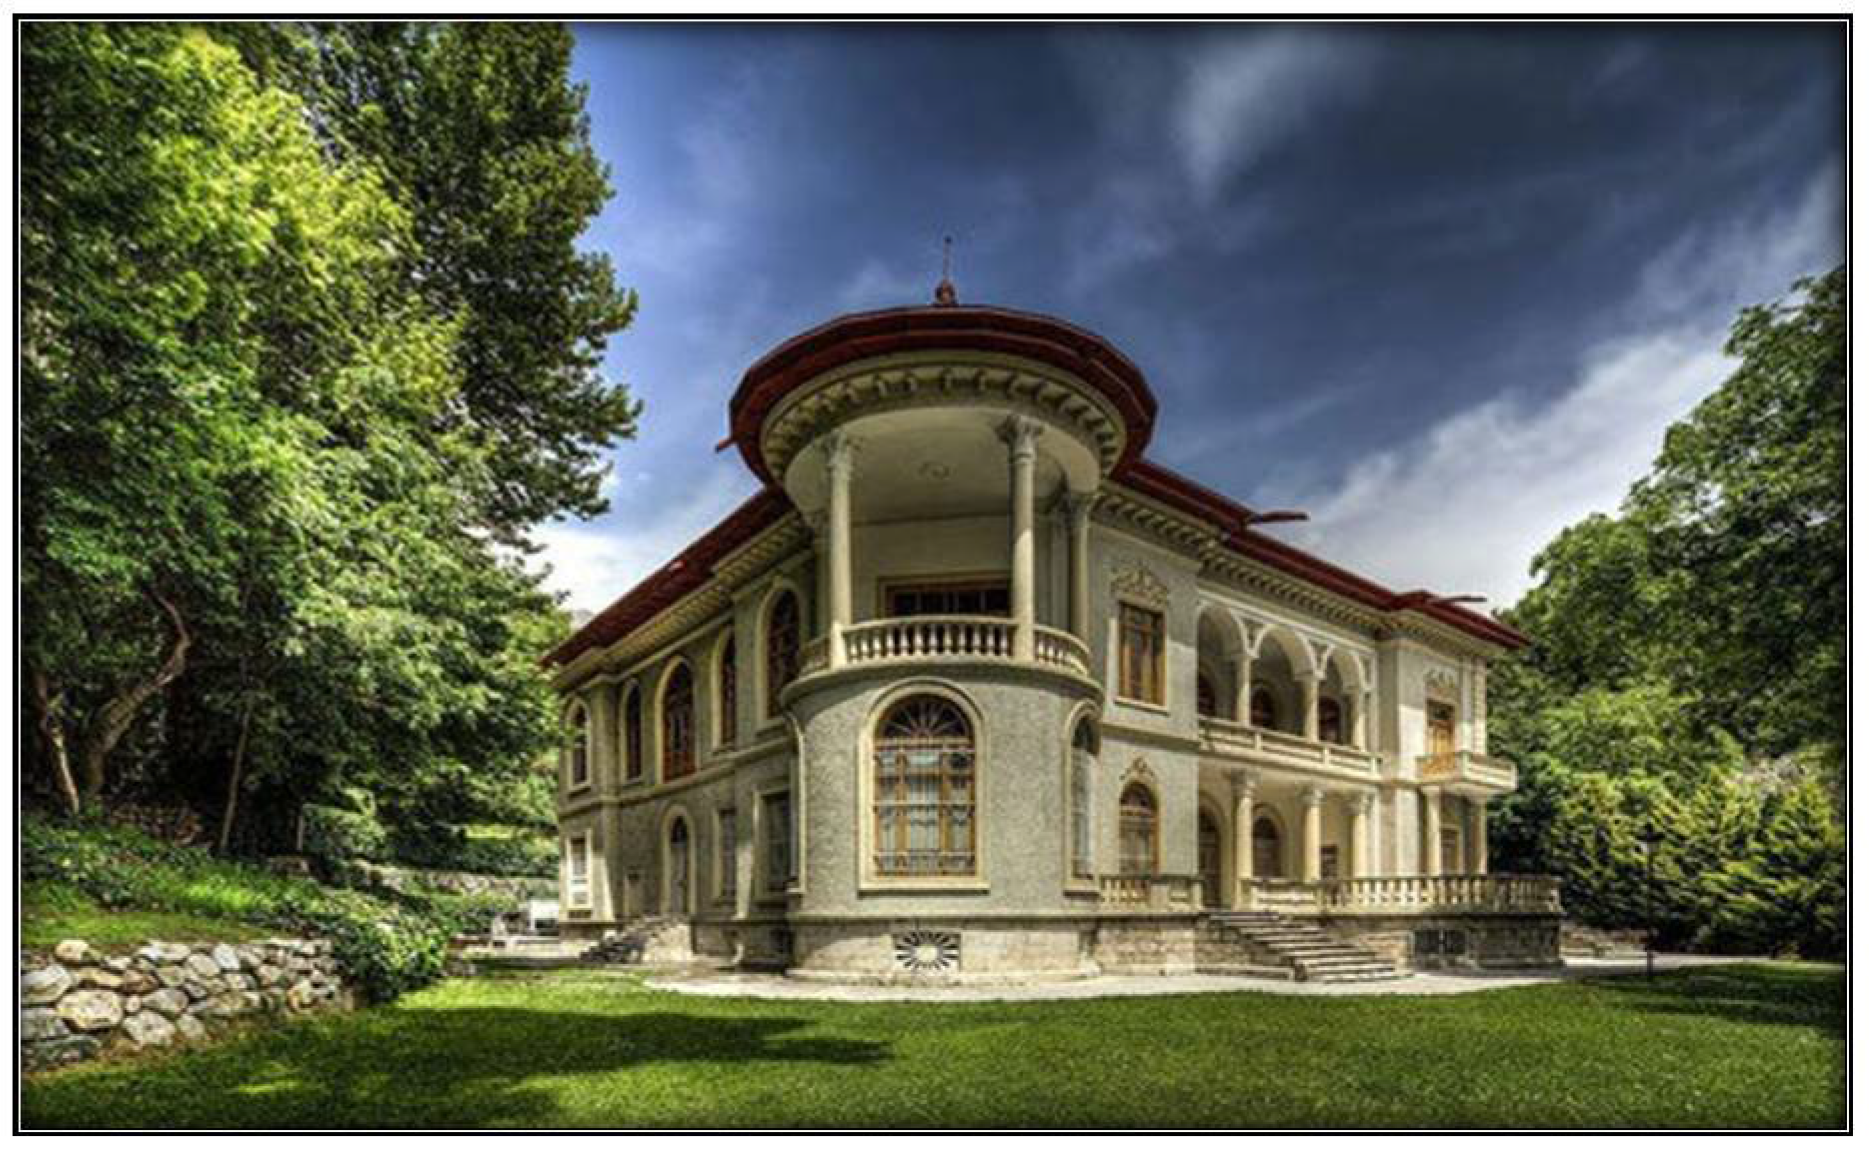
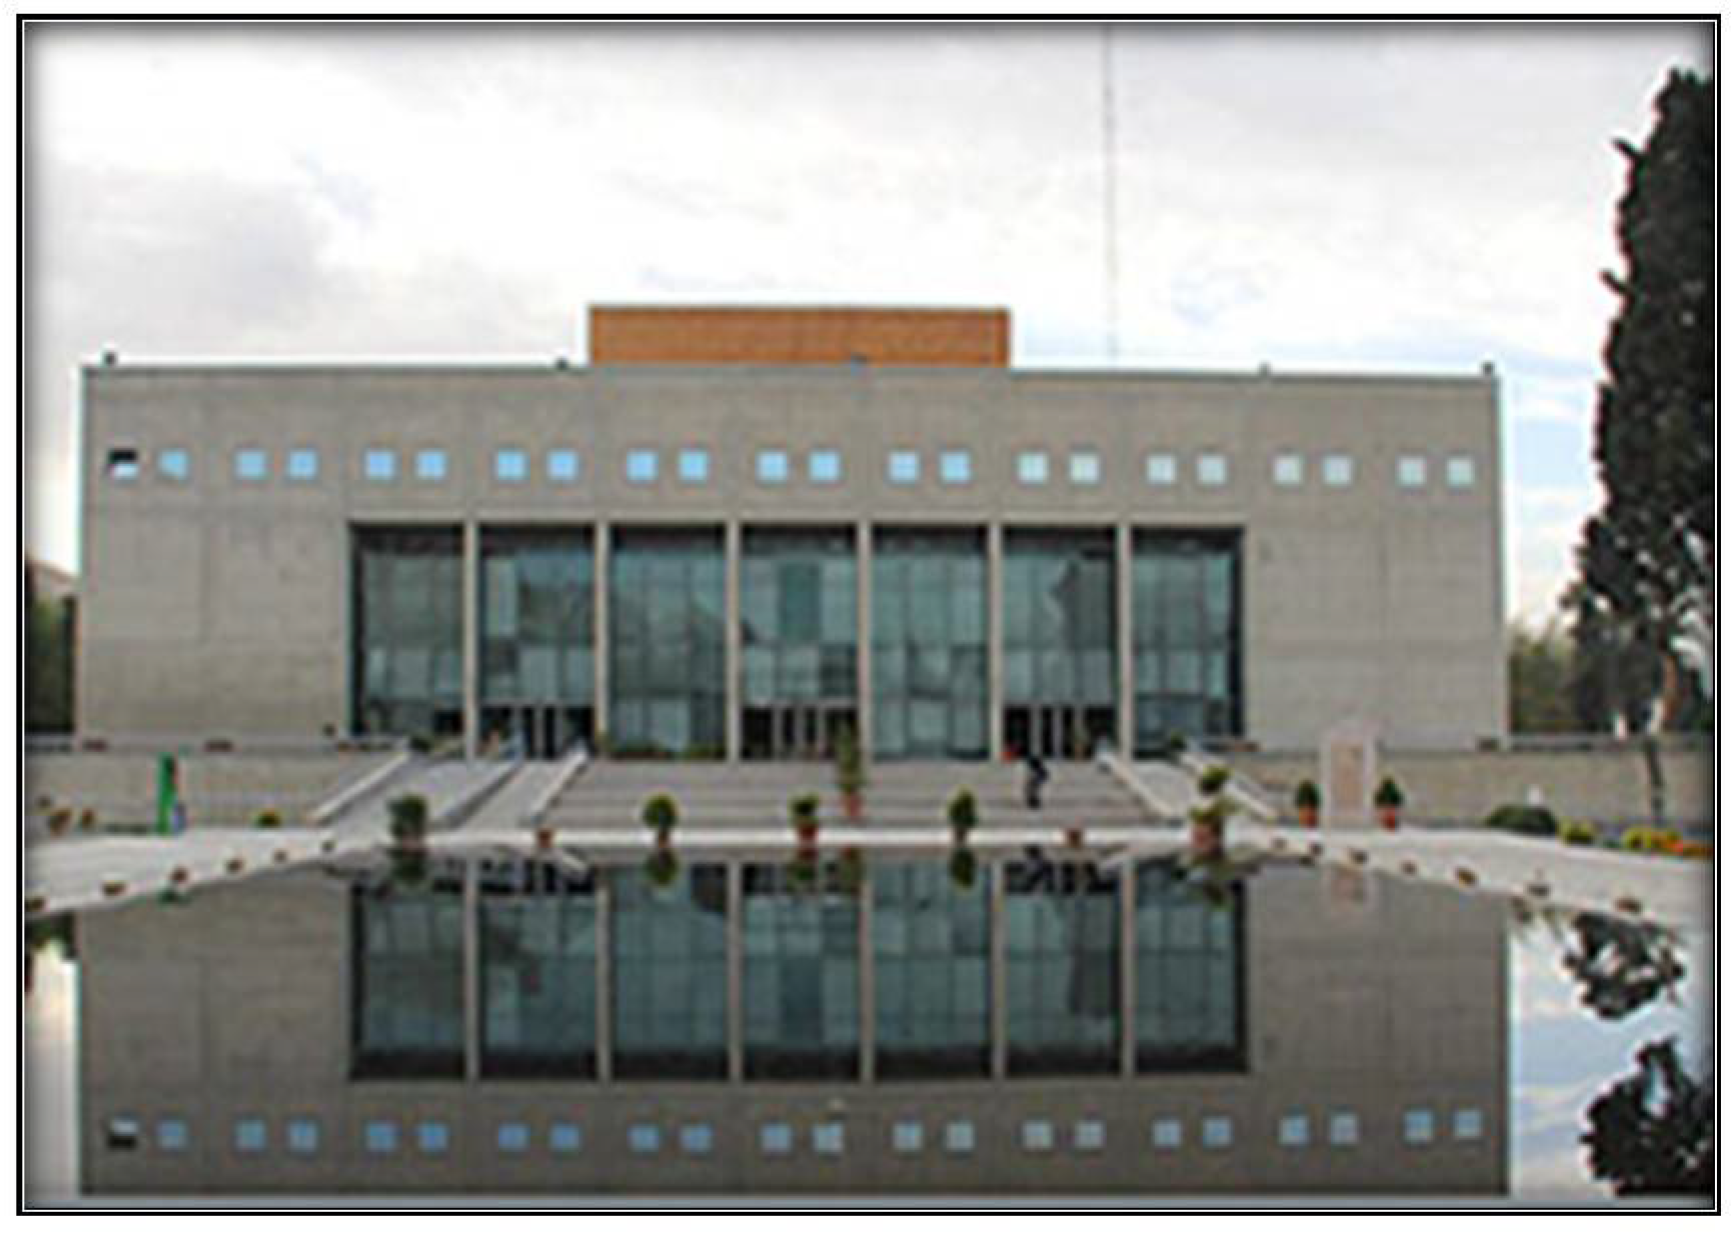
Figure 1. Venn diagram showing that sustainability consists of a balance between environmental quality (Environmental), sociocultural quality (Social), and economic quality (Economic) [9].
Sustainability 10 01626 g001
Figure 2. Sepahsalar School [36].
Sustainability 10 01626 g002
Figure 3. Sa’dabad Palace [36].
Sustainability 10 01626 g003
Figure 4. National Library of Shiraz [36].
Sustainability 10 01626 g004
Figure 5. Shiraz Northern Entrance [36].
Sustainability 10 01626 g005
Figure 6. Membership function of TFN [71].
Sustainability 10 01626 g006
Figure 7. Stages of multi-criteria analysis of prioritizing key factors of sustainability in Persian contemporary architecture, source: own.
Sustainability 10 01626 g007
Figure 8. Optimal interval weights, source: own.
Sustainability 10 01626 g008
Table 1. Investigation of case studies, source: own.
Figure No.TypologyMaterialTechnology
2introvertedtraditionaltraditional
3extrovertedtraditional and moderntraditional and modern
4extrovertedmodernmodern
5extrovertedtraditionalmodern
Table 2. Previous studies related to sustainability and contemporary architecture of Iran and internationally, source: own.
Researcher/sYearIranian Architecture/International ArchitectureAim and Focus
[27]2018InternationalPresenting the architect’s attitude towards the paradigms of sustainable development;
Presenting the place and role of the architect in the implementation of the multidimensional processes of sustainable design;
[6]2017IranianInvestigating sustainable architecture and reasons of its usage;
Introducing the unseen principles of sustainable architecture in vernacular architecture.
[30]2017InternationalExamining the sustainable design strategies of the Balkan vernacular architecture in the example of the traditional house.
[32]2017InternationalConsiders Intelligent Buildings with sustainable architecture Approach;
Defining the concepts of computerizing, intelligent buildings, sustainable development and architecture.
[31]2017IranianMaxing use of natural light out in mountainous climates based on sustainable architecture.
[9]2017InternationalExamining the integration of sustainability principles into architectural education programs in South Korean Universities;
Identifying eight sustainability-related SPCs that can be utilized to teach sustainability;
Identifying the average number of credits per sustainability-related SPC in different course types.
[37]2016IranianDesigning a hotel obtaining practical needs beside its aesthetic aspects.
[38]2016Iranian and InternationalThe objectives of human communities resorting to sustainable development have been studied in three separate domains, environmental, social and economic;
Reasons and features of sustainability of ancient Iranian cities are considered and compared to five cases of sustainable cities of the modern world.
[39]2016IranianModern architecture in valuable city textures is one of challengeable issues in modern architecture and renovation in Iran;
The old textures of Tehran are faced to severe structural erosion and social decline.
[5]2016InternationalConsidering the construction strategies in the fields of “Efficacy”, “maintenance” and “end of life” issues;
Concentrating the considerations on the structural members and materials in the buildings;
Proposing some outlines in design of futuristic structures.
[35]2017IranianReuse of vernacular climatic strategies VCS in modern sustainable architecture, application of dynamic modelling systems.
Table 3. Consistency index [45].
aBW123456789
Consistency Index00.4411.632.33.003.734.475.23
Table 4. Relationships between linguistic variables and triangular fuzzy numbers [75].
Linguistic VariableTriangular Fuzzy Numbers
Equal(1, 1, 1)
a little better(1/2, 1, 3/2)
mostly better(1, 3/2, 2)
Better(3/2, 2, 5/2)
much better(2, 5/2, 3)
completely better(5/2, 3, 7/2)
Table 5. Relationships between linguistic variables and triangular fuzzy numbers [60].
Linguistic VariableTriangular Fuzzy Numbers
very poor/very light(0, 1, 2)
poor/light(1, 2, 3)
mostly poor/mostly light(2, 3.5, 5)
Fair(4, 5, 6)
mostly good/mostly difficult(5, 6.5, 8)
good/difficult(7, 8, 9)
very good/very difficult(8, 9, 10)
Table 6. Three group of experts, source: own.
GroupProfessionNo. of Academic ExpertsNo. of Executive Experts
1Architecture43
2Civil engineering31
3Project manager12
Table 7. Pairwise comparison vector for the best criterion, source: own.
c1c2c3c4c5c6
Group expert 1
c6(5/2, 3, 7/2)(3/2, 2, 5/2)(5/2, 3, 7/2)(1, 1, 1)(1, 3/2, 2)(1, 1, 1)
Group expert 2
c6(3/2, 2, 5/2)(1, 3/2, 2)(5/2, 3, 7/2)(1, 3/2, 2)(3/2, 2, 5/2)(1, 1, 1)
Group expert 3
c6(3/2, 2, 5/2)(3/2, 2, 5/2)(2, 5/2, 3)(1/2, 1, 3/2)(1/2, 1, 3/2)(1, 1, 1)
Average(1.83, 2.33, 2.83)(1.33, 1.83, 2.33)(2.33, 2.83, 3.33)(0.83, 1.16, 1.5)(1, 1.5, 2)(1, 1, 1)
Table 8. Pairwise comparison vector for the worst criterion, source: own.
Group expert 1c3Group expert 2c3Group expert 3c3Average
c1(1/2, 1, 3/2)(1, 1, 1)(1, 1, 1)(0.83, 1, 1.16)
c2(1/2, 1, 3/2)(1, 1, 1)(1, 3/2, 2)(0.83, 1.16, 1.5)
c3(1, 1, 1)(1, 1, 1)(1, 1, 1)(1, 1, 1)
c4(2, 5/2, 3)(3/2, 2, 5/2)(2, 5/2, 3)(1.83, 2.33, 2.83)
c5(3/2, 2, 5/2)(3/2, 2, 5/2)(2, 5/2, 3)(1.66, 2.16, 2.66)
c6(5/2, 3, 7/2)(5/2, 3, 7/2)(2, 5/2, 3)(2.33, 2.83, 3.33)
Table 9. Pairwise comparison vector for the best criterion with grey numbers, source: own.
αc6c1c6c2c6c3c6c4c6c5c6c6
0[1.83, 2.83][1.33, 2.33][2.33, 3.33][0.83, 1.5][1, 2][1, 1]
0.1[1.88, 2.78][1.38, 2.28][2.38, 3.28][0863, 1.466][1.05, 1.95][1, 1]
0.2[1.93, 2.73][1.43, 2.23][2.43, 3.23][0896, 1.432][1.1, 1.9][1, 1]
0.3[1.98, 2.68][1.48, 2.18][2.48, 3.18][0.929, 1.398][1.15, 1.85][1, 1]
0.4[2.03, 2.63][1.53, 2.13][2.53, 3.13][0.962, 1.364][1.2, 1.8][1, 1]
0.5[2.08, 2.58][1.58, 2.08][2.58, 3.08][0.995, 1.33][1.25, 1.75][1, 1]
0.6[2.13, 2.53][1.63, 2.03][2.63, 3.03][1.028, 1.296][1.3, 1.7][1, 1]
0.7[2.18, 2.48][1.68, 1.98][2.68, 2.98][1.061, 1.262][1.35, 1.65][1, 1]
0.8[2.33, 2.43][1.73, 1.93][2.73, 2.93][1.094, 1.228][1.4, 1.6][1, 1]
0.9[2.28, 2.38][1.78, 1.88][2.78, 2.88][1.127, 1.194][1.45, 1.55][1, 1]
1[2.33, 2.33][1.83, 1.83][2.83, 2.83][1.16, 1.16][1.5, 1.5][1, 1]
Table 10. Pairwise comparison vector for the worst criterion with grey numbers, source: own.
αc1c3c2c3c3c3c4c3c5c3c6c3
0[0.83, 1.16][0.83, 1.5][1, 1][1.83, 2.83][1.66, 2.66][2.33, 3.33]
0.1[0847, 1.144][0863, 1.466][1, 1][1.88, 2.78][1.71, 2.61][2.38, 3.28]
0.2[0.864, 1.128][0.896, 1.432][1, 1][1.93, 2.73][1.76, 2.56][2.43, 3.23]
0.3[0.881, 1.112][0.929, 1.398][1, 1][1.98, 2.68][1.81, 2.51][2.48, 3.18]
0.4[0.898, 1.096][0.962, 1.364][1, 1][2.03, 2.63][1.86, 2.46][2.53, 3.13]
0.5[0.915, 1.08][0.995, 1.33][1, 1][2.08, 2.58][1.91, 2.41][2.58, 3.08]
0.6[0.932, 1.064][1.028, 1.296][1, 1][2.13, 2.53][1.96, 2.36][2.63, 3.03]
0.7[0.949, 1.048][1.061, 1.262][1, 1][2.18, 2.48][2.01, 2.31][2.68, 2.98]
0.8[0.966, 1.032][1.094, 1.228][1, 1][2.23, 2.43][2.06, 2.26][2.73, 2.93]
0.9[0.983, 1.016][1.127, 1.194][1, 1][2.28, 2.38][2.11, 2.21][2.78, 2.88]
1[1, 1][1.16, 1.16][1, 1][2.33, 2.33][2.16, 2.16][2.83,2.83]
Table 11. Optimal interval weights, source: own.
Optimal WeightLower BoundUpper BoundCenterWidth
w*10.0994730.1131670.106320.013694
w*20.1220480.1288450.1254470.00668
w*30.085880.0906630.0882720.004783
w*40.1876460.2247330.2061890.037087
w*50.2060140.2174870.211750.011473
w*60.2552210.2694340.2623280.014213
Table 12. Results of preferences matrix, source: own.
w1w2w3w4w5w6 w1w2w3w4w5w6sum
DPij =w10.501000Pij=w10010001
w210.51000w21010002
w3000.5000w30000000
w41110.50.380w41110003
w51110.620.50w51111004
w6111110.5w61111105
Table 13. Evaluation of alternatives over decision-making criteria, source: own.
Criteriac1c2c3c4c5c6
Alternative
a1(7, 8, 9)(7, 8, 9)(4, 5, 6)(7, 8, 9)(1, 2, 3)(7, 8, 9)
a2(8, 9, 10)(8, 9, 10)(5, 6.5, 8)(7, 8, 9)(4, 5, 6)(7, 8, 9)
a3(5, 6.5, 8)(4, 5, 6)(4, 5, 6)(7, 8, 9)(1, 2, 3)(7, 8, 9)
a4(2, 3.5, 5)(7, 8, 9)(2, 3.5, 5)(2, 3.5, 5)(4, 5, 6)(7, 8, 9)
a5(8, 9, 10)(8, 9, 10)(5, 6.5, 8)(5, 6.5, 8)(4, 5, 6)(7, 8, 9)
a6(4, 5, 6)(7, 8, 9)(5, 6.5, 8)(7, 8, 9)(4, 5, 6)(7, 8, 9)
Group Expert 1
a1(8, 9, 10)(8, 9, 10)(4, 5, 6)(8, 9, 10)(2, 3.5, 5)(5, 6.5, 8)
a2(5, 6.5, 8)(8, 9, 10)(4, 5, 6)(7, 8, 9)(4, 5, 6)(7, 8, 9)
a3(7, 8, 9)(7, 8, 9)(5, 6.5, 8)(7, 8, 9)(0, 1, 2)(5, 6.5, 8)
a4(4, 5, 6)(5, 6.5, 8)(2, 3.5, 5)(4, 5, 6)(5, 6.5, 8)(7, 8, 9)
a5(5, 6.5, 8)(7, 8, 9)(4, 5, 6)(7, 8, 9)(1, 2, 3)(7, 8, 9)
a6(1, 2, 3)(5, 6.5, 8)(7, 8, 9)(4, 5, 6)(7, 8, 9)(8, 9, 10)
Group Expert 2
a1(7, 8, 9)(8, 9, 10)(1, 2, 3)(8, 9, 10)(4, 5, 6)(8, 9, 10)
a2(7, 8, 9)(7, 8, 9)(7, 8, 9)(8, 9, 10)(7, 8, 9)(8, 9, 10)
a3(7, 8, 9)(5, 6.5, 8)(7, 8, 9)(8, 9, 10)(2, 3.5, 5)(4, 5, 6)
a4(1, 2, 3)(8, 9, 10)(5, 6.5, 8)(4, 5, 6)(5, 6.5, 8)(8, 9, 10)
a5(8, 9, 10)(7, 8, 9)(5, 6.5, 8)(8, 9, 10)(2, 3.5, 5)(5, 6.5, 8)
a6(5, 6.5, 8)(5, 6.5, 8)(7, 8, 9)(7, 8, 9)(5, 6.5, 8)(8, 9, 10)
Group Expert 3
a1(7.33, 8.33, 9.33)(7.66, 8.66, 9.66)(3, 4, 5)(7.66, 8.66, 9.66)(2.33, 3.5, 4.66)(6.66, 7.83, 9)
a2(6.66, 7.83, 9)(7.66, 8.66, 9.66)(5.33, 6.5, 7.66)(7.33, 8.33, 9.33)(5, 6, 7)(7.33, 8.33, 9.33)
a3(6.33, 7.5, 8.66)(5.33, 6.5, 7.66)(5.33, 6.5, 7.66)(7.33, 8.33, 9.33)(1, 2.16, 3.33)(5.33, 6.5, 7.66)
a4(2.33, 3.5, 4.66)(6.66, 7.83, 9)(3, 4.5, 6)(3.33, 4.5, 5.66)(4.66, 6, 7.33)(7.33, 7.33, 9.33)
a5(7, 8.16, 9.33)(7.33, 8.33, 9.33)(4.66, 6, 7.33)(6.66, 7.83, 9)(2.33, 3.5, 4.66)(6.33, 7.5, 8.66)
a6(3.33, 4.5, 5.66)(5.66, 7, 8.33)(6.33, 7.5, 8.66)(6, 7, 8)(5.33, 6.5, 7.66)(7.66, 8.66, 9.66)
Table 14. Decision-making matrix with fuzzy numbers, source: own.
c1
(+)
c2
(−)
c3
(+)
c4
(+)
c5
(+)
c6
(+)
a1(7.33, 8.33, 9.33)(7.66, 8.66, 9 9.66)(3, 4, 5)(7.66, 8.66, 9.66)(2.33, 3.5, 4.66)(6.66, 7.83, 9)
a2(6.66, 7.83, 9)(7.66, 8.66, 9.66)(5.33, 6.5, 7.66)(7.33, 8.33, 9.33)(5, 6, 7)(7.33, 8.33, 9.33)
a3(6.33, 7.5, 8.66)(5.33, 6.5, 7.66)(5.33, 6.5, 7.66)(7.33, 8.33, 9.33)(1, 2.16, 3.33)(5.33, 6.5, 7.66)
a4(2.33, 3.5, 4.66)(6.66, 7.83, 9)(3, 4.5, 6)(3.33, 4.5, 5.66)(4.66, 6, 7.33)(7.33, 8.33, 9.33)
a5(7, 8.16, 9.33)(7.33, 8.33, 9.33)(4.66, 6, 7.33)(6.66, 7.83, 9)(2.33, 3.5, 4.66)(6.33, 7.5, 8.66)
a6(3.33, 4.5, 5.66)(5.66, 7, 8.33)(6.33, 7.5, 8.66)(6, 7, 8)(5.33, 6.5, 7.66)(7.66, 8.66, 9.66)
Total(32.98, 39.82, 46.64)(40.3, 46.98, 53.64)(27.65, 35, 42.31)(38.31, 44.65, 50.98)(20.65, 27.66, 34.64)(40.64, 47.15, 53.64)
wj0.110.120.090.20.220.26
Table 15. Normalized weighted decision-making matrix with fuzzy numbers, source: own.
c1
(+)
c2
(−)
c3
(+)
c4
(+)
c5
(+)
c6
(+)
a1(0.017, 0.023, 0.031)(0.017, 0.022, 0.028)(0.006, 0.01, 0.016)(0.003, 0.004, 0.005)(0.014, 0.027, 0.049)(0.032, 0.043, 0.057)
a2(0.015, 0.021, 0.030)(0.017, 0.022, 0.028)(0.011, 0.016, 0.024)(0.002, 0.003, 0.004)(0.031, 0.047, 0.074)(0.035, 0.045, 0.059)
a3(0.014, 0.020, 0.028)(0.011, 0.016, 0.022)(0.011, 0.016, 0.024)(0.002, 0.003, 0.004)(0.006, 0.017, 0.035)(0.025, 0.035, 0.049)
a4(0.005, 0.009, 0.015)(0.014, 0.020, 0.026)(0.006, 0.011, 0.019)(0.001, 0.002, 0.003)(0.029, 0.047, 0.078)(0.035, 0.045, 0.059)
a5(0.016, 0.022, 0.031)(0.016, 0.021, 0.027)(0.009, 0.015, 0.023)(0.002, 0.003, 0.004)(0.014, 0.027, 0.049)(0.030, 0.041, 0.055)
a6(0.007, 0.012, 0.018)(0.012, 0.017, 0.024)(0.013, 0.019, 0.028)(0.002, 0.003, 0.004)(0.033, 0.051, 0.081)(0.037, 0.047, 0.061)
Table 16. Matrix of S ˜ i + and S ˜ i , source: own.
S ˜ i +   S ˜ i
a1(0.069, 0.107, 0.158)(0.017, 0.022, 0.028)
a2(0.094, 0.132, 0.191)(0.017, 0.022, 0.028)
a3(0.058, 0.091, 0.14)(0.011, 0.016, 0.022)
a4(0.076, 0.114, 0.174)(0.014, 0.020, 0.026)
a5(0.071, 0.108, 0.162)(0.016, 0.021, 0.027)
a6(0.092, 0.132, 0.192)(0.012, 0.017, 0.024)
Table 17. Matrix of Q ˜ i , Q i , and N i , source: own.
Q ˜ i Q i N i Priority
a1(0.073, 0.125, 0.237)0.145 78.37%6
a2(0.098, 0.15, 0.27)0.172 92.97%2
a3(0.063, 0.116, 0.261)0.146 78.91%5
a4(0.08, 0.134, 0.268)0.16 86.48%3
a5(0.075, 0.127, 0.245)0.149 80.54%4
a6(0.096, 0.155, 0.305)0.185 100%1

