Abstract
In this paper we apply a model of technological diffusion, Future Technology Transformations in the Transport Sector (FTT: Transport), linked to the E3ME macroeconomic model, to study possible future technological transitions in personal passenger transport in four East Asian countries. We assess how targeted policies could impact on these transitions by defining four scenarios based on policies that aim to reduce emissions from transport. For each country we find that an integrated approach of tax incentives, subsidies, regulations (fuel economy efficiency), kick-start programs and biofuel programs yield the most significant emission reductions because, when combined, they accelerate effectively the diffusion of electric vehicles in the region.
1. Introduction
As the Intergovernmental Panel on Climate Change 5th Assessment Report (AR5) highlighted, the transportation sector will need to play a key role in climate change mitigation, but will certainly face challenges in doing so [1]. Demand for road transport in East Asian countries, including China, Japan, Korea and Taiwan, has increased rapidly over the last two decades. Vehicle emissions and oil demand growth is driven primarily by growth in the vehicle population, especially private passenger cars. As of 2016, more than 250 million passenger cars were registered in China, Japan, Korea and Taiwan. The number of passenger cars in China increased by a factor of 9 between 2006 and 2016, compared with a per capita GDP increase of only 4.
The demand for crude oil and petroleum by the road transport sector has increased by nearly 60% in China, Japan, Korea and Taiwan since 2004 (IEA Energy Statistics). Passenger cars were found to account for over 50% of the increase [2,3] in gasoline demand. The dependence on fossil fuels has significant implications on energy security, emissions and climate change.
The use of existing technologies makes it possible to reduce dependency on fossil fuels, decarbonize, and reduce emissions in the passenger car sector. The dynamics generated by the diffusion of new technologies into the market place, and the improvement of existing technologies, determines technological trajectories that are critical to reducing future emissions from passenger vehicles [4]. As stated in the IPCC report [1], understanding how low-carbon transport and energy technologies will evolve (via experience curves and innovation processes) is not well developed, and assessing this gap remains challenging for the transportation sector.
The successful implementation of policies to reduce greenhouse gas (GHG) emissions from passenger cars is particularly challenging because of the dynamics of technological transition and consumer behavior. To design efficient policy instruments, knowledge of the mechanisms that facilitate the diffusion of new car technologies is needed. It is important to determine the relationship between policy instruments and the rate of adoption for low or zero-emission vehicles.
Previous studies that have assessed the effectiveness of policy incentives in reducing emissions from passenger vehicles have typically focused on a single country or region in Asia (e.g., [5,6,7,8]). These studies have looked at the effectiveness of taxation schemes (vehicle taxes, carbon taxes) and regulations (fuel economy standards) in shaping the diffusion of energy-efficient vehicles. We argue that there are two major gaps in existing studies:
- (1)
- Most existing studies and Integrated Assessment Models (IAMs) feature only a small number of policy instruments, applied to individual East Asian countries (e.g., [5,9]). It is not possible for these studies to study and compare the effectiveness of a range of policy instruments across countries.
- (2)
- The existing studies have either taken one particular representative car model or used a representative agent to examine the response of agents to a set of policy incentives. In the real world, consumers are diverse and do not respond to policy incentives collectively.
In this paper we use a model of technological diffusion, the FTT: Transport [10], linked to the E3ME macroeconomic model, to study possible future technological transitions in personal transport in East Asia. Our analysis covers China, Japan, Korea and Taiwan and includes a range of policy incentives. In contrast to other IAMs, the E3ME-FTT model considers consumer heterogeneity in the car market and enables the simulation of detailed climate policies in private road transportation [10].
We consider four policy scenarios, each with a layer of specific policy incentives for the four East Asian countries, to find a set of policy incentives that will lead to the diffusion of new energy vehicles (NEVs) and significant emission reductions from private passenger vehicles.
The paper is structured as follows. Section 2 discusses the current policy framework for reducing emissions in the passenger car sector in China, Japan, Korea and Taiwan. The theoretical framework of the E3ME-FTT model is discussed in Section 3 and the policy assumptions are summarized in Section 4. Section 5 provides an overview to the data used for the analysis. Section 6 presents the results for the scenario analysis and the policy implications for the East Asian countries. Section 7 and Section 8 provide overall conclusions and discuss the limitations of the model, along with recommendations for future work.
2. Policy Context
This section summarizes the main policies that have been implemented in East Asia to limit emissions from personal transport. First, Table 1 provides an overview of fuel economy standards around the world. The following sections then discuss each East Asian country individually.

Table 1.
Overview of regulation specifications for passenger cars in major economies.
2.1. China
Due to China’s rapid economic growth, demand for private passenger vehicles has grown rapidly. From 1991 to 2015, total annual vehicle production grew from around 700,000 units to 24 million units. Annual sales of passenger cars have grown by more than 20 times since 1990. By the end of 2015, there were more than 116 million cars on the road in China. However, in terms of passenger cars per 1000 people, China was measured at 154 cars in 2016 (http://www.mep.gov.cn/gkml/hbb/qt/201706/t20170603_415265.htm), which is still much lower than the USA, so the potential for future growth remains large.
At the national level, to reduce its dependency on foreign oil and to encourage more fuel-efficient vehicle technologies, the passenger vehicle market has been subject to fuel economy standards since 2004. Fuel economy limits for passenger cars are divided into 16 categories that are based on vehicle weight. The Phase I and Phase II standards require each individual vehicle model to comply with fuel consumption regulations before entering the market. The standards are set based on weight classes. China continues to reduce the fuel consumption limit and Phase IV fuel consumption standards for passenger vehicles are currently under development. In 2014, the Chinese Ministry of Industry and Information Technology (MIIT) released a fuel consumption standard for passenger cars. Compared to the Phase III standard, the new consumption standard would fall to 5 l/100 km, representing an overall reduction in fuel consumption of 28% between 2015 and 2020. The proposed fuel economy standard is presented in Table 1.
Electric Vehicles (EVs) offer opportunities to address oil security, local pollution and GHG emissions simultaneously; EV deployment is taken by the central government as an essential strategy to tackle local pollution. China launched the EV Subsidy Scheme (EVSS) in 2009, followed by an update in 2013. Under Phase I EVSS, subsidies for the private purchase of plug-in hybrid electric vehicles (PHEVs) and battery electric vehicle (BEVs) are based on battery capacity, with a subsidy rate of 3000 RMB/kWh (Hao, 2014). Under Phase II, subsidies for the private purchase to PHEVs and BEVs are based on the vehicle’s electric range. Vehicles with electric ranges of 250 km or higher, of 150–250 km, and of 80–150 km are qualified for 60,000 RMB (9520 USD), 50,000 RMB (7930 USD), and 35,000 RMB (5550 USD) in subsidies, respectively (Hao, 2014). Table 2 presents China’s Phase 1 and Phase 2 Electric Vehicles (EV) Subsidy Scheme (EVSS).
Table 2.
China’s Phase 1 and Phase 2 Electric Vehicles (EV) Subsidy Scheme (EVSS).
Environmentally-friendly and energy-efficient vehicles, including plug-in hybrid electric vehicles (PHEVs) and battery electric vehicles (BEVs), are exempt from vehicle excise duty and annual registration tax. Before 2010, car excise duty rates were based on engine size; with small engine cars enjoying a lower tax rate. After 2010, the excise duty was 10% before value-added-tax (17%) price regardless of car engine sizes. Registration tax was paid annually based on engine size and as established by individual provinces or cities.
In 2009, the Chinese government initiated the Ten Cities, Thousand Vehicles Program to stimulate electric vehicle development through large-scale pilots in ten cities. Initially, the program targeted the deployment of electric vehicles in government fleets. The program has since expanded to 25 cities and includes consumer incentives in six cities: Beijing, Shanghai, Hangzhou, Hefei, Changchun and Shenzhen [11]. Under this program, local authorities must increase the number of EVs on the road by either purchasing EVs themselves or introducing a rebate/subsidy for EV purchases. The program aims to kick-start demand for EVs.
The sales of EVs and PHEVs increased from 8000 units in 2011 to 330,000 units in 2015. Table 3 shows the change in EV and PHEV shares in China over this period. China had the largest share of global EV and PHEV sales in the world (33%) in 2015. China is targeting a domestic share of 20% NEV sales (2 million) by 2025 (http://www.reuters.com/article/us-china-autos-electric-idUSKBN17R086). The Chinese government has also announced that companies which sell cars in China will have a duty to sell a certain share of NEVs. In 2017, China’s MIIT proposed a production quota under which automakers will have to produce NEVs to earn credits and avoid penalties. According to MIIT, in 2019 automakers that sell 30,000 cars or more annually must earn points equivalent to a 10% share of NEVs, rising to 12% in 2020.
Table 3.
Market shares of EVs and plug-in hybrid electric vehicles (PHEVs) in China between 2011 and 2015.
2.2. Japan
Japan is the third largest auto manufacturing market, and Japanese automakers account for the majority of global hybrid cars and electric cars sales (http://www.theicct.org/blogs/staff/hybrids-break-through-japan-auto-market). Toyota is the largest Japanese car manufacturer, holding around 43% market share; Nissan and Honda are the second and third largest, with 17% and 15% shares respectively. More than 90% of the cars sold in Japan are Japanese [12]. Under the Paris Agreement, the Japanese government pledged to reduce its national GHG emissions by 26% from 2013 levels by 2030. Japan has one of the most energy-efficient economies in the world and its transportation sector is also among the most efficient.
Table 4 shows the market shares of next-generation vehicles in Japan. Sales of next-generation passenger cars have expanded to more than 20% share of Japan’s new passenger car market because of the Japanese government’s tax incentives and purchasing subsidies programs on them. The share of NEVs in Japan’s fleet remains relatively small but is growing quickly.
Table 4.
Market shares of EVs, PHEVs, and Fuel Cell Vehicles (FCVs) in Japan between 2011 and 2015.
Japan was one of the first countries to engage in research and policies for energy-efficient products. In 1998, Japan initiated the Top Runner Approach to encourage energy efficiency in end-use products. The scope of the program has since been reviewed every few years; by 2012, 23 products were included. The program has set mandatory efficiency standards or target values for automobiles that are based on the most efficient products. As part of the Energy Conservation Law, the program identified the most fuel-efficient automobile in each weight class and designated it as the ‘top runner’. The program set mandatory efficiency standards or target values for automobiles based on the most efficient standard products. All vehicles were required to exceed the new target values for their weight class within 3–10 years.
As a result of the Japanese top runner program, Japanese fuel economy for the new vehicles has improved significantly over the past 20 years. Overall, fuel economy has improved by more than 80% since 1995, and it has averaged a 6% annual improvement over the past five years [13].
There are nine different taxes for owning cars in Japan, including: acquisition tax, consumption tax, tonnage tax, automobile tax, mini-vehicle tax, gasoline tax, diesel tax, Liquefied Petroleum Gas (LPG) tax, and in use consumption tax [14]. Tax breaks are available for three automobile taxes: acquisition, tonnage, and ownership. Tax breaks are determined by the levels of compliance with the 2015 Japan Fuel Economy Standards (FES). Zero emissions vehicles are exempt from both the acquisition tax and the tonnage tax. Cars that are compliant with the 2015 FES enjoy up to 80% reductions in acquisition tax and 75% reductions in automobile tonnage tax [14].
2.3. Korea
The transportation sector accounts for about 20% of greenhouse gas emissions in South Korea and is the country’s second largest emitter, trailing only the industrial sector. Within the transportation sector, road transport dominates with an emissions share of over 80%. Thus, reducing transportation’s impact on the environment should require transforming the current automobile-based transport system into a more energy-efficient, low-carbon and eco-friendly one. Sustainable development in transportation has also been a major concern for Korea. Both vehicle ownership and transport demand have increased substantially during the past two decades. As a result, energy consumption has increased rapidly, and vehicles have become the major source of urban air and noise pollution in many Korean cities. Current growth rates shows no sign of subsiding.
One characteristic of automobile markets is that the demand for diesel cars has been increasing in the car market. Diesel vehicles, especially imported diesel cars, have dominated in the green car (environmentally-friendly car) market. The share of diesel in imported vehicles increased from 16.4% in 2007 to 68.2% in 2014. SUVs and MPVs led the sales of domestically produced diesel. Sedans have been popular, but SUV demand has been increasing in the imported diesel market.
Meanwhile, sales of hybrid vehicles have been increasing continuously. Hybrid vehicles are competing with diesel vehicles in the domestic market. However, imported hybrid car sales have been sluggish. Regarding EVs, prices have been falling and government subsidies have been increasing. For example, Kia automobile company cut its Ray EV price from 45 million Won (41,850 USD) to 35 million Won (32,550 USD). Local governments have also provided subsidies to EV buyers. In particular, Jeju special self-governing province has subsidized 8 million Won (7440 USD). The actual purchasing price was 19.5 million Won (18,135 USD) before tax. However, the lack of central government purchasing subsidy has hindered sales. For EVs to achieve a larger market share, there is also a requirement to expand charging infrastructure throughout Korea.
The key challenges for a low-carbon transition in the transportation sector in Korea may be summarized as follows:
- (1)
- Substituting fossil fuel cars with EVs requires a reduction in the cost of batteries (which depend on international technology actions) and building a nationwide charging infrastructure.
- (2)
- Green Car Developments: Current heavy fossil fuel dependence of transport should be reduced by diversifying energy sources. NEVs offer a promising alternative to conventional vehicles in short distance trips in urban areas. Wireless electricity technology could facilitate the introduction of electric vehicles by solving their current battery limitations. Fuel cell technology could be a long-term option in future alternative fuel vehicle developments. Legal support and economic incentives should be provided for the development of these types of green vehicles.
- (3)
- Non-Motorized Transportation: Non-motorized forms of transport provide zero carbon emissions. Bicycles are used extensively in many European and Asian cities, but their modal share in Korean cities is minimal due to limited infrastructure and low public reception. Bicycles should be promoted for short distance commuting by providing adequate infrastructure and by increasing safety.
2.4. Taiwan
Despite not being a member of the United Nations, Taiwan proposed its goal of CO2 emission reduction as its Intended Nationally Determined Contribution (INDC) after the U.N. Framework Convention on Climate Change (UNFCCC) Conference of the Parties (COP21) in Paris in 2015. Taiwan pledged a 50% reduction in emissions compared to the level of 2005 by 2050. The transportation sector is a major contributor to greenhouse gas emissions in Taiwan (about 15% of Taiwan’s total emissions) and it is also a major source of local air pollution, such as PM2.5.
In Taiwan, all vehicles put into the market must comply with the standards of energy consumption, which are categorized by vehicle engine size. In addition, all vehicles must declare their ranking in the energy labelling system: Class 1 to Class 5, as the reference of energy efficiencies for the general public and potential customers.
To encourage the purchase of green vehicles, there are several incentive programs offered by different governmental agencies. The financial incentives include the exemption of excise tax on all electric vehicles until the end of 2021 and the exemption of registration tax on all electric vehicles until the end of 2018. For hybrid cars, the excise tax was deducted by 50% from February 2009 to December 2014. There are also direct subsidies offered for purchasing electric motorcycles, electric-assisted bicycles and electric bicycles. The subsidies range from 1000 NTD to 10,000 NTD (30 USD to 330 USD).
In addition to the direct incentives to reduce greenhouse gas emissions from vehicles, the excise tax is deducted. In addition, 50,000 NTD, approximately equivalent to 1700 USD, is provided for each new passenger car that leads to the retirement of an older car owned by the same family, regardless of the fuel type of the new vehicle. For motorcycles, the deduction of the excise tax is 4000 NTD, or 130 USD in this program. Additional subsidies, 3000 NTD to 7000 NTD (100 USD to 230 USD), are provided for new motorcycles that are purchased to replace old motorcycles that are equipped with two-stroke engines.
For most cases, the incentives have been extended beyond their scheduled deadlines, except for the case of hybrid cars that was terminated in 2014. The termination of the 50% excise tax reduction was a key factor in the drop in sales of hybrid cars (which are mostly imported), from 17,788 in 2014 to 8341 in 2015.
3. Methodology
3.1. Theoretical Background
The Future Technology Transformation (FTT) model is a framework that models technological diffusion dynamically, based on market price competition and technological competition. Prior to the development of the Transport model, FTT was developed to assess decision making by investors in power generation technology [15]. More recently, an FTT model of household heating technologies was developed and efforts to build FTT models of the industrial sector are ongoing. As a member of the FTT framework, the FTT: Transport model aims to model technology diffusion dynamically in the transport sector, based on a decision-making module that represents the choices of a diverse group of agents that face restricted information and access to technology for consumers.
Instead of taking a representative agent approach, the FTT: Transport model assumes the presence of a diverse market with heterogeneous agents. This is done using a probabilistic treatment of consumer decision making using a distribution of cost values. We assume that the cost distribution corresponds to the heterogeneity of consumer choices as a result of revealed preferences. The cost distributions are related to whether the consumers are early adopters, early majority, late majority or laggards, which drives the adoption and diffusion of technology as suggested by [15]. Agent heterogeneity and consumer choice are represented by introducing cost distribution over agent perspective with the discrete choice theory.
As a result of increasing returns to adoption [16], a technology can gain increased market share as more consumers adopt and use it for the following reasons. Firstly, people make choices according to what is fashionable or in vogue. For example, people like to behave in a ‘socially desirable way’ and may purchase low emissions vehicles to boost their image in their own social groups [17]. Secondly, many studies find that consumers have a ‘wait and see’ attitude [18] in choosing new technologies, in particular new automobile technologies. This is because consumers are risk averse and EVs present uncertainty (e.g., range anxiety, availability of charging stations) when users are inexperienced. Thirdly, consumers may have a particular preference towards one range of car model (e.g., brand, engine size, style). If their preferences are not satisfied with the available EV models, the technology (e.g., EV) will not match the preference for this group of consumers. When EVs become more popular with consumers, this encourages the manufacturers to boost the number of EV models available, which will further boost EV sales. As we will discuss in the next section, the FTT framework captures path dependence and positive feedback effects in the diffusion process.
The following sections present an overview of the E3ME-FTT: Transport model. The values for the initial parameters are presented in the Appendix A.
3.2. Structure of FTT: Transportation
The FTT framework models technological diffusion by a set of logistic differential equations of the Lotka-Volterra family (The Lotka Volterra equations are a model of the population dynamics of species competing for common resources (Lotka, 1925; Volterra, 1939)), which represent gradual technological substitution processes [19].
Under the FTT framework, consumers are more likely to choose a technology that has a higher market share as a result of social influence. The flow of market shares from technology j to technology i is
and the flow of market shares from technology i to technology j is
where denotes the flow of shares from car technology j to i, denotes the fraction of agents that prefer technology i over j based on the difference in generalized cost of technologies i and technology j, is the turnover rate for cars. The cost of technologies includes the car capital cost, fuel cost, maintenance cost and fiscal pricing (tax/subsidies), and an intangible variable that determines the non-quantifiable cost for the consumers.
The diffusion processes are path dependent and involve positive feedbacks that are captured by the FTT framework. The FTT models of technological diffusion are consistent with social influence theory. It is assumed that decisions are recursive and self-reinforcing by assuming that social trends play an important role in the diffusion of technology. In other words, if a group of consumers purchase a new technology through social influence, it is more likely that people around this group of consumers will follow, leading to path dependence for a technology.
The technological diffusion rate is proportional to a comparison of cost distributions, equivalent to a binary logit model. In addition to quantifiable costs (e.g., capital cost, fuel tax), the model considers the non-quantifiable costs on consumer choices (e.g., comfort, luxury effect) by an arbitrary factor that is added to the quantifiable costs. A learning rate is incorporated to take into account the falling cost as production of the technology increases. Difference in the cost distribution is one of the key factors in facilitating future technological diffusion. It is assumed that cost distribution corresponds to the population heterogeneity, driving technological diffusion through comparison of cost distribution.
3.3. The Levelized Cost of Transportation (LCOT)
The cost of the vehicle, as perceived by the investor purchasing a vehicle or unit of transport technology, must be taken to include all components relevant to the decision making. Many of the components can be easily quantified with available data. Others are not straightforward, and we show how this is done in Section 3.3.1. When a vehicle is purchased, an initial investment is made, or a loan is obtained, for the capital cost, and henceforth fuel and maintenance costs are incurred for the lifetime of the technology, in addition to taxation.
Following this, the Levelized Cost of Transport (LCOT) after the introduction of policies is defined as
where,
- is a registration vehicle tax, in $/vehicle, paid at purchase time,
- is the capital cost of cars, in $/vehicle
- is the carbon tax based on fuel economy , in $/vehicle/(gCO2/km)
- is a tax on fuel consumption, in $/L
- is the fuel consumption, in L/vehicle
- is the vehicle maintenance cost in $/vehicle
- is a road tax in $/vehicle
3.3.1. The Generalized Cost as a Comparison Measure
The costs of transportation are not the only elements of consumer decisions when purchasing a vehicle. Other aspects such as infrastructure and car range are valued by the consumer, but we cannot obtain this information without a large-scale field survey or survey on the existing literature. We keep in mind that technologies have highly different pecuniary costs, particularly across engine size classes and, despite this, higher costs can be compensated by higher benefits, such that higher cost luxury vehicles maintain market shares.
Were we to simulate technology diffusion based on bare LCOT distribution comparisons, the lowest LCOT technologies would diffuse more successfully, which, as it turns out, is not consistent with our historical data. Clearly, components would be missing in the LCOT, for instance comfort, acceleration, style, that we may call the ‘intangibles’. We define these ‘intangibles’ for this model as the difference between the generalized cost, which leads to observed diffusion, and the LCOT as calculated from pecuniary vehicle properties for which we have data. The value of the intangibles, denoted γi, is an empirical parameter that we obtain from making the FTT diffusion trajectory match the trajectory observed in our historical data, at the year of the start of the simulation.
Taking into account the intangibles, we assume that the choice of investors is made based on pairwise comparisons general cost (Ci). For consistency with the data, we compare costs in lognormal space with a mean and a standard deviation with the following transformations:
3.3.2. The Determination of Intangibles (γ)
The technological diffusion rate is proportional to a comparison of cost distributions, equivalent to a binary logit model. In additional to quantifiable costs (e.g., capital cost, fuel tax), the model considers the non-quantifiable costs (γ) on consumer choices (e.g., comfort, luxury effect) by an arbitrary factor that is added to the quantifiable costs. γ is a parameter that represents all unknown constant non-pecuniary cost components (i.e., all costs and benefits not already explicitly included). This parameter has the unique value set that makes the diffusion rate continuous across the transition from historical data to simulated data at the start of the simulation (i.e., keeping the existing diffusion trends). To illustrate this, when γi = 0, we obtain a rate of diffusion that does not normally match historical diffusion (see Figure 1). This is because several factors such as comfort, luxurious effect and the availability of infrastructure cannot be readily quantified without a large-scale survey. Therefore, we find a set of γi leads to the diffusion of technology in the simulation to have the same rate as the historical rate at the starting point of the simulation (Figure 1).

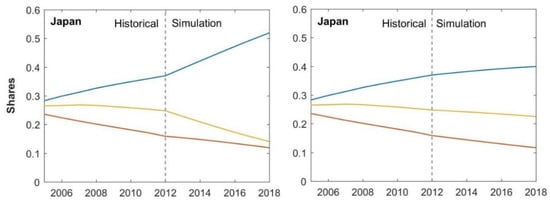
Figure 1.
Graphical representation of γ. Note: Left panels: the left to the dash lines show the historical market shares for petrol car without γ. The right to the dash lines show the projected shares for petrol cars without γ. Right panels: the left to the dash lines show the historical market shares for petrol car with γ. The right to the dash lines show the projected shares for petrol cars with γ.
Although it does not provide significant information on the non-pecuniary benefits themselves, it is in this way a robust methodology. We perform an exercise that determines that sensitivity of our simulation results to the variation of γ (see the sensitivity analysis in Appendix C of this paper).
3.3.3. Technology Learning
Endogenous technical change is assumed in the E3ME and FTT models, both at the aggregate level in and through learning by doing. The FTT: Transport model uses learning curves, and capital costs for vehicle technologies () fall by a certain percentage (learning rate ) every time the total quantity manufactured doubles:
The learning rate is the cost reduction achieved for a doubling of cumulative installed capacity. For niche technologies, the existence of technological learning implies that prices for the new technologies (e.g., electric cars) will fall as the quantity of production increases. Note that the learning rates for niche technologies are subject to great uncertainty (see [20,21]) as a result of different methods of estimation. Additionally, for some technologies, specific learning curves and product ratios have been observed in the past, but the ratio may not be applicable for the future since learning rates may change over time [22].
To account for the uncertainties regarding learning rates, a sensitivity analysis is presented in Appendix C, where we examine the extent to which the difference in learning rate creates uncertainties for the model. Further studies may consider using a stochastic model formulation, which can explicitly calculate the impact of learning rate uncertainties in a rigorous manner.
3.4. Energy Consumption and Emissions
The total service generated by a particular technology is equal to the product of transport demand in pkm and the transport capacity of the technology, defined as the number of seats in cars or public transport, thus we have:
where is the service generated by a transport technology, in pkm/year.
The energy consumption equation is calculated from fuel consumption per km and the services the vehicles provide, considering the filling factor ,
where is the number of seats for cars (i.e., = 4 in most cases), J is energy consumption in MJ/year, is the energy consumption factor in MJ/seat-km, calculated by a fuel economy factor 2 multiplied by energy densities 3 for petrol/diesel/ethanol. CO2 emissions from passenger vehicles are closely related to energy consumption. Emissions are defined as:
where is the fleet emissions in Gt/yr and CO2k,t is the emissions factor.
3.5. Linkage between FTT: Transport and E3ME
The E3ME model is a non-equilibrium macro econometric simulation model based on a demand-led post-Keynesian structure [23], which implies a non-equilibrium simulation framework. In the post-Keynesian world, models are simulations, and productivity change takes place through knowledge accumulation, using Kaldor’s technology progress functions [24] (for more details see [23,25]). The model is demand-driven. Endogenous technical change is considered in the E3ME model with a progress indicator. With a chosen set of econometric relationships, the model regresses over a high dimensional dataset covering the past 40 years in 59 regions and extrapolates these relationships up to 2050 (see further details in the E3ME manual) (http://www.e3me.com).
In contrast to the computable general equilibrium (CGE) approach where optimal behavior is assumed, in the E3ME model, the determination of output follows post-Keynesian theory. More specifically, prices are not always adjusted to market clearing level like the CGEs. Hence, there could be spare capacity as a result of regulations and increased economic output.
The E3ME model has a strong empirical grounding, with a historical database that covers the period 1970–2014. The E3ME model uses a system of error correction which allows short-term dynamic outcomes, moving towards a long-term trend [26]. Energy demand is a function of economic activity rates, relative prices, and technology. The transport activity in the E3ME model is determined by fuel prices, car prices and income. Emissions are calculated using the transport demand linked to the technology diffusion model (the FTT model).
The FTT model is fully integrated to E3ME with several dynamical feedbacks to the global economic simulation. The combination of the E3ME-FTT transport model and the E3ME-FTT power model provides a relatively high definition of dynamical coverage of global fossil fuel use and emissions [23].
The FTT framework captures path dependence and positive feedbacks. Here, it is assumed that agents may not be fully rational and only know a subset of information. Compared to the traditional models, the E3ME-FTT framework models technological transition incorporating complexity, path dependence and consumer heterogeneity, with low computational cost.
The dynamic interactions between the FTT model and the E3ME model are shown in Figure 2. Purchase decisions are affected by four components, including consumer preference, government policies, market environment, and the car model’s availability. Each of the components leads to a dynamic change of market share using the Future Technology Transformation (FTT) framework. The Transport demand is calculated within the E3ME model by regressing total vehicle use (in km/year) with respect to fuel prices and income, and these are projected to 2050, using fuel prices and income endogenously determined by E3ME. The number of cars is regressed against income and average vehicle prices, constrained by population. In the following sections, we describe the components within the FTT model, as well as the dynamics and interactions between components.
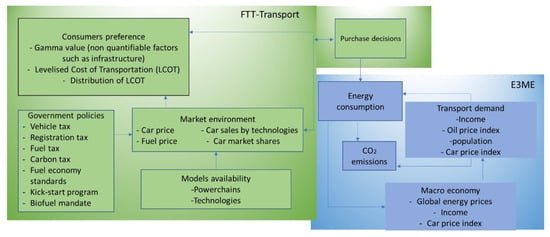
Figure 2.
Structure of E3ME-FTT: Transport Model.
4. Policy Assumptions
We have assessed four decarbonization scenarios that combine taxes, kick-start programs and biofuel mandates. The definition of the policy incentives is listed in Table 5. The policy assumptions are based on the current and proposed policy incentives as discussed in Section 2. The policy assumptions are presented in detail in Appendix B.
Table 5.
Definition of policy incentives.
The assumptions for the scenario analysis are presented in Appendix B. The baseline scenario makes projections based on the current policy framework. It is the benchmark scenario against which the other scenarios are compared. Scenario 1 assumes that all tax incentives are combined with a small kick-start program. The levels of tax incentives that we assumed in Scenario 1 are the average tax values taken from each of the four East Asian countries. It should be noted that we have included the cost of license plate registration as part of the vehicle tax. The kick-start program in Scenario 1 is assumed to be 5% higher than the number of EVs on the road by 2018 in China.
Scenario 2 assumes that tax incentives are combined with regulations and the kick-start program. We assume that the acquisition tax is increased by 3000 USD. The levels of regulations are set according to the expected fuel economy standards as shown in Table 1. We assume that the kick-start program is much stronger than it is in Scenario 1.
Scenario 3 assumes that regulations, the kick-start program and the biofuel mandate program are added on top of the taxes. The biofuel mandate is set based on IEA WEO 2014 assumptions. The scenario explores the effectiveness of the policy incentives in cutting emissions from private passenger vehicles and demonstrates the extent to which layers of fiscal policy measures and kick-start program will lead to a significant emissions reduction.
It is noted that the tax incentive assumptions and subsidies are higher than the level of existing policy incentives in East Asian countries. A kick-start program is assumed in every scenario to take into account current non-monetary programs (e.g., EV car sharing, EV license plate auctions) that have been introduced at national level to encourage EV diffusion.
5. Data Overview
We collected car sales data (for each model) from the Marklines data, which is then matched with car price data and car engine size data, taken from the car manufacturers’ websites (in 2012). Figure 3 and Figure 4 show the 2012 emissions distribution and car prices distribution for China, Japan, Korea and Taiwan. Sales of alternative technologies, hybrid and electric cars, are shown in pink and red, respectively.
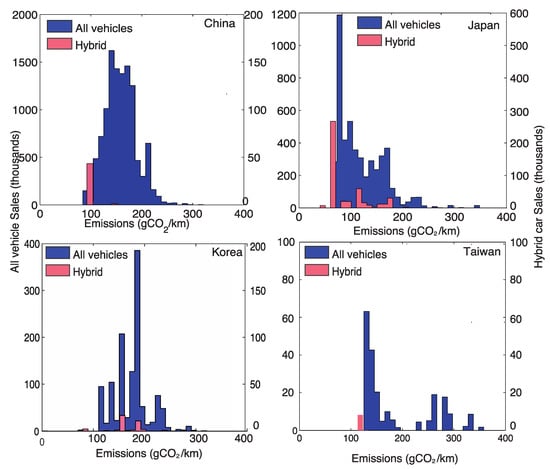
Figure 3.
Emissions distributions for the four East Asian countries. Note: The distributions for alternative fuel vehicles are shown in pink and red. The left axis shows the emissions distribution for conventional cars, and the right axis shows the emissions distribution for hybrid cars.
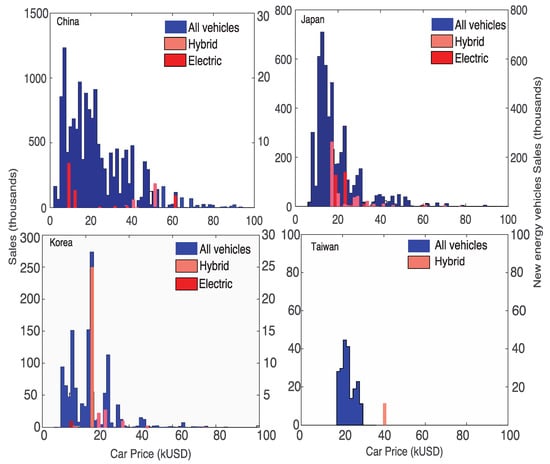
Figure 4.
Price distributions of 2012 vehicles sales for the four East Asian countries. Note: The distributions for alternative fuel vehicles are shown in pink and red. The left axis shows the sales distribution for conventional cars, and the right axis shows the price distribution for new energy vehicles, such as hybrid cars and electric cars.
The distributions show the diversity of consumers in car choices for each country. It is notable that the price distribution in China is much wider than in Japan, Korea and Taiwan. In particular, the price and emissions distributions are much narrower for Korea and Taiwan. This implies that consumer choices are more diverse in China, with most people showing preference for the small/medium-size vehicles. Regarding emissions distribution, due to consumer choices of car sizes and fuel efficiency, average emissions are lower in China and Japan, with the standard distribution of emissions much larger in China than in Japan.
6. Results
6.1. China
In the baseline scenario, we find that the fleet share for EVs increases very slowly, reaching below 10% of the fleet share in 2050 (Figure 5).
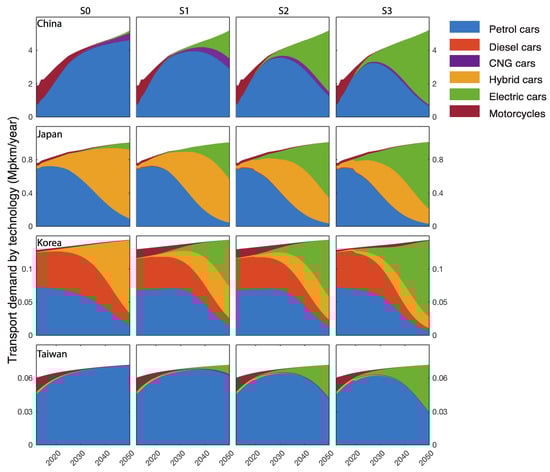
Figure 5.
Passenger transport demand from passenger vehicles for the four East Asian countries under four policy scenarios. Note: Column 1 shows the baseline scenario. Column 2 shows the scenario when vehicle tax, registration tax, fuel tax, a small kick start and carbon tax are imposed. Column 3 shows the scenario when tax incentives are combined with fuel economy regulations and a stronger kick-start program. Column 4 shows the scenario when tax incentives, regulations and a kick start program is combined with a biofuel mandate.
In scenario 1, we assume that the excise duty is increased by 1200 USD per vehicle, the annual registration tax is increased by 300 USD, and the fuel tax is increased by 1.2 USD/L. We assume that the subsidy for EVs is increased by up to 9000 USD. There is a kick-start program of 0.3%, meaning that there will be 600,000 EVs on road by 2020. As shown in Figure 5, even with these incentives to encourage EV diffusion, the fleet share for EV only increases to around 30% in 2050.
To cut emissions significantly and to encourage the diffusion of EV, we have to impose both tax incentives, regulations and a stronger kick-start program to facilitate the diffusion of zero-emission vehicles. In Scenario 2, we assume that there are an additional 2,000,000 EVs on the road by 2020, as a result of various kick-start programs (e.g., car sharing programs, license plate auctions, public EV mandates). A fuel economy standard is imposed so that old gasoline car models (car models before 2012) are phased out. Scenario 3 (column 3) shows the passenger cars emissions as a result of the fuel economy regulations and the phase out policies. The shares for EVs reach over 70% by 2050 and emissions peak around 2030, before falling to the 2005 level by 2050 (Figure 5).
6.2. Japan
We find that in the baseline scenario passenger car emissions in Japan fall by more than 40% below the 2005 emissions level, without any additional policy incentives, due to the diffusion of hybrid cars in Japan (Figure 5).
As a result of various vehicle taxes and a small kick-start program that adds 180,000 EVs (0.3% of the Japanese fleet) by 2020, passenger car emissions fall by 50% below the 2005 emissions level by 2050. In scenario 1 (column 2), we assume that the automobile acquisition tax for gasoline cars increases by up to 1200 USD for luxury vehicles and the fuel tax by up to 1.2 USD/L. The EV rebate is increased by around 9000 USD per vehicle (for up to eight years). As a result of the tax incentives and EV subsidies, the shares for EVs reach 30% in Japan by 2050.
To cut passenger car emissions further (by more than 50% below 2005), we assume that compared to the base year (2012), there are 900,000 EVs on the road by 2020 as a result of various kick-start programs (e.g., increasing the number of charging stations, EV car sharing). We assume that the previous gasoline car models will be phased out as a result of the top runner program. The fleet share for EVs increases by a further ten percentage points by 2050, reaching 40% fleet share. Emissions are reduced by nearly 80% below the 2005 level in scenario 2. In scenario 3, when a biofuel mandate is introduced in addition to the tax incentives, fuel economy standards, and a kick-start program, emissions fall by nearly 90% below 2005 levels (Figure 6).
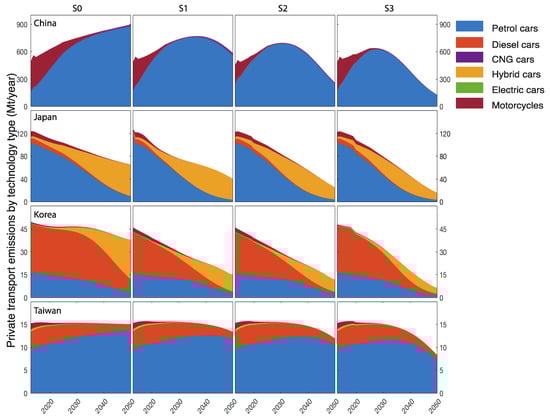
Figure 6.
Private passenger vehicles emissions (MtCO2/yr) for the four East Asian countries under four policy scenarios. Note: Column 1 shows the baseline scenario. Column 2 shows the scenario when vehicle tax, registration tax, fuel tax, a small kick start and carbon tax are imposed. Column 3 shows the scenario when tax incentives are combined with fuel economy regulations and a stronger kick-start program. Column 4 shows the scenario when tax incentives, regulations and a kick-start program is combined with a biofuel mandate.
6.3. Korea
In the baseline scenario, luxury diesel cars and gasoline cars have a large market share before the year 2030 (Figure 3). After 2030, luxury hybrid cars start to take off, and reach more than 60% market share by 2050. However, the penetration of hybrid cars is not sufficient to cut emissions in South Korea, as shown in Figure 4. Emissions continue to increase in the baseline scenario, as a result of a rapid rise in vehicle numbers in Korea (Figure 6).
In scenario 1, we assume that there is an increase in the fuel tax of 1.2 USD/L and that there is an increase in gasoline car taxation by up to 1200 USD for petrol cars. We assume that there is an additional subsidy that supports EVs, amounting to USD 9000 for luxury EVs. We assume that there is a kick-start program that adds 126,000 EVs on the road by 2020. As a result of the policy incentives, the shares for EVs increase to around 40% of the market by 2050 in scenario 1. Emissions are reduced by more 50% below the 2005 level.
To increase the rate of diffusion of EVs in South Korea, we assume that the numbers for EVs increase by 190,000 on the road by 2020 as a result of a kick-start program. As shown in Figure 3, the shares for EVs reach over 50% by 2050. As a result, emissions fall by 80% below the 2005 level (Figure 6). To cut emissions further, we assume that the biofuel mandate continues to increase in Korea, reaching 22% by the year 2050. With the biofuel mandate in place, in scenario 4, emissions fall by 90% below the 2005 level (Figure 6).
6.4. Taiwan
Unlike the other countries (e.g., Japan and Korea), the baseline shares for hybrid cars and EVs remain very small in Taiwan. The small shares in new energy technologies result in a very small fall in passenger vehicle emissions and energy consumptions in the baseline scenario.
When various tax incentives are added (as shown in Table A8 scenario 1) and the presence of a kick-start program (that places 20,000 EVs on the road by 2020), we observe that emissions fall slightly, by around 25% below the 2005 level. To cut emissions by 60% below the 2005 level, it is necessary to introduce more zero-emission vehicles and a biofuel mandate in Taiwan. In scenario 2, we assume that there would be a 1.5% EV share in 2020, meaning that there would be an additional 100,000 EVs in Taiwan. To cut emissions further in Taiwan, in scenario 3, we assume that the biofuel mandate rises to 20% by 2050.
7. Policy Implications and Conclusions
The decarbonization of the private passenger vehicles sector plays an important role in increasing our chance of staying within the 2 °C target set by the Paris Agreement. In this paper we assessed four scenarios that examine the interactive effect of transportation policy incentives on emissions reduction in private passenger vehicles in four East Asian countries. For all the countries, we find that an integrated approach of tax incentives, subsidies, regulations (fuel economy efficiency), kick-start programs and a biofuel mandate yield the most significant emission reductions, by allowing the diffusion of EVs. Other than taxes on conventional cars and subsidies for EVs, it is important to introduce non-monetary measures, so as to increase the rate of diffusion for zero emissions vehicles in the region.
We find that in the case of China, in the baseline scenario, EVs do not gain significant shares by 2050 without any policy incentives. However, an integrated approach (combining tax incentives, subsidies and kick start programs) will lead to more than 80% EV share in China by 2050. In reality, in addition to EV subsidies and taxes on gasoline cars, some kick-start programs have been introduced to increase the rate of EV diffusion in China.
For Japan, it is possible to achieve over 40% emission reductions without any policy incentives. Emissions from passenger vehicles can be reduced by over 50% with a higher acquisition tax and a higher EV rebate. With 900,000 EVs on the road (compared to the 2012 level), it is possible to achieve over 90% emissions reduction below the 2005 levels.
Similarly, for Korea we find that the tax incentives are not sufficient to cut emissions significantly. The diffusion of hybrid cars in South Korea will not lead to a significant emissions reductions, because of an increase in the car population. To cut emissions by more than 50% below the 2005 level, it is important to encourage the diffusion of EVs in South Korea by a kick-start program that increases the number of EVs by around 190,000 on the road (compared to the 2012 level) by 2020. Further emission reductions can be achieved with the introduction of a small biofuel mandate (around 20%).
In the case of Taiwan, without a kick-start program and fuel economy regulation, emissions from passenger cars will not be cut significantly. Due to the existing small number of EVs and hybrid cars in Taiwan, compared to other Asian countries, from the scenario analysis we find that the diffusion of new energy technology is slower. In order to increase the rate of diffusion of new energy technologies in Taiwan, it is necessary to introduce the EV kick-start program that increases the number of EVs in Taiwan.
A major barrier to introducing taxes, regulations and the kick-start program is the cost of the policies to the government, the car manufacturers and car owners. The true cost/benefit of policy incentives is difficult to estimate, given that the disruptive impact of new energy vehicles on the economy and on the car manufacturers is unclear. For example, while the introduction of new energy vehicles could potentially create new employment, some car manufactures may be unable to compete in the market. It is important for further research to investigate the economic impact of policy incentives that encourage the diffusion of new energy technologies.
8. Limitations and Recommendations
Like all modelling studies, we recognize there are limitations to our approach in modelling future technological change and emissions from cars. This section identifies the main limitations encountered and how improvements can be made in future studies:
- (1)
- In this research, we have identified the available technologies, although new technologies will emerge in the future. However, it is impossible for this model to predict technologies that have not penetrated into the market, for example, fuel cell vehicles.
- (2)
- The non-pecuniary cost is represented by a γ parameter, which is found by calculating the difference between the historical shares and future shares. Our projections from 2012 to 2020 follow the trend from 2004 to 2012. However, γ parameters for EVs in Taiwan and South Korea may carry a degree of uncertainty, because our basis to determine the γ parameter is not sufficient, based on the fact that there is currently a limited number of EVs on the road. A better calibration can be achieved with the EV market shares data obtained from recent years (2012–2017).
- (3)
- Autonomous vehicles (AVs) represent a disruptive technology that could potentially impact on the vehicle size and transport demand for passenger cars.
In addition, there are several parametric uncertainties for the E3ME-FTT-Tranpsort model. We take into consideration the possible consequences of these assumptions and perform a sensitivity analysis to determine the effects of the potential changes to the learning rate, the γi values, the discount rate and fuel prices on the final results. The sensitivity analysis provides insight into the effects of uncertainties on our projections.
As shown in Appendix C, we allow the parameters to vary by between 5% and 20%. The effect of the parametric uncertainties on the market shares and emissions projections depends on the scenario assumptions and the technology mix in a country. For example, the effect of the technology learning rate is more prominent as the shares for EVs increase. We observe that certain parameters, such as fuel prices and discount rates, may have a larger effect on shares and emissions than other parameters, such as EV learning rates. This is because while learning rates only impact on total emissions through variations in EV shares, a rise or fall in oil prices affect vehicle choices dynamically. We find that the uncertainties in γi values have an overall small impact on the final results. Overall, the changes in market shares and emissions as a result of the variations in parameters are within 20%.
Author Contributions
A.L. and S.L. co-designed the scenarios. A.L. parameterized the model and wrote the main text. S.L. contributed to the text. Y.C. and C.-H.L. provided data for S. Korea and Taiwan. J.-F.M. designed the theoretical model. U.C., S.B. and H.P. designed and executed the econometric specifications for transport demand, maintained the E3ME model and contributed to the text.
Acknowledgments
The authors wish to thank the The Society for Environmental Economics and Policy Studies SEEPS conference participants for lively discussion on the subject. We thank three anonymous referees for their supportive comments. The authors acknowledge C-EERNG and Cambridge Econometrics for support, and funding from EPSRC (JFM, fellowship no. EP/ K007254/1); the Newton Fund (JFM, HP, UC, SB EPSRC grant no EP/N002504/1 and ESRC grant no. ES/N013174/1), NERC (HP, UC, grant no. NE/P015093/1).
Conflicts of Interest
The authors declare no conflict of interest.
Appendix A. Initial Parameters
Table A1, Table A2, Table A3 and Table A4 show the values of the parameters assumed in the model for China, Japan, Korea and Taiwan respectively. Car prices, engine sizes and fuel economy data for each car model listed in data from the company Marklines (We have purchased the annual car sales data from the Marklines website in the year 2013 and 2014, which is an automotive industry portal that provides of motor vehicles market data. Marklines provides for the total car sales by car model and brand for 63 countries from 2004 onwards. Hence, it is possible to know the sales for each car model name for individual countries. https://www.marklines.com/en/vehicle_sales/index). Price data and fleet populations were are collected from various sources, including car manufacturers, car sales websites, car industry market reports and government institutions, matched to the car models listed in the Marklines data. Note that the prices obtained are the listed price in the year 2013 when the data were collected. Car fuel economy data were collected from the manufacturers’ websites when available. In many cases, some car models had several car prices and fuel economy values, depending on vehicle options for particular car models. We took the average value for prices and engine sizes, unless it was known to us that a particular vehicle option/alternative was more popular than the others. To ensure the reliability of the data outside the manufacturer’s website, we checked the prices, engine sizes and fuel economy data from these car sales, research websites and government institutions against the data obtained from the manufacturers.
Learning rate and the discount rates are subject to a certain degree of uncertainty. To account for the uncertainties regarding learning rates, a sensitivity analysis is presented in the Appendix C where we examine the extent to which the difference in learning rate and discount rate creates uncertainties for the model.
Table A1.
The initial parameters assumed for China.
Table A1.
The initial parameters assumed for China.
| Technology | Engine Size | Prices of Cars (USD/vehicle) | Standard Deviation of Price (USD/vehicle) | Fuel Cost (USD/km) | Discount Rate | Energy Use (MJ/vkm) | Learning Rate |
|---|---|---|---|---|---|---|---|
| Petrol | Econ | 9400.00 | 6249.00 | 0.07 | 0.15 | 2.05 | 1% |
| Mid | 21,036.00 | 12,005.00 | 0.08 | 0.15 | 2.26 | 1% | |
| Lux | 40,667.00 | 20,083.00 | 0.10 | 0.15 | 2.74 | 1% | |
| Adv Petrol | Econ | 9400.00 | 6249.00 | 0.05 | 0.15 | 1.64 | 5% |
| Mid | 21,036.00 | 12,005.00 | 0.06 | 0.15 | 1.81 | 5% | |
| Lux | 40,667.00 | 20,083.00 | 0.08 | 0.15 | 2.19 | 5% | |
| Diesel | Econ | 9400.00 | 1000.00 | 0.05 | 0.15 | 1.85 | 1% |
| Mid | 22,000.00 | 5631.20 | 0.06 | 0.15 | 2.12 | 1% | |
| Lux | 40,300.00 | 4404.40 | 0.07 | 0.15 | 2.40 | 1% | |
| Adv Diesel | Econ | 9400.00 | 1000.00 | 0.04 | 0.15 | 2.95 | 5% |
| Mid | 22,000.00 | 5631.20 | 0.05 | 0.15 | 1.70 | 5% | |
| Lux | 40,300.00 | 4404.40 | 0.06 | 0.15 | 1.92 | 5% | |
| CNG | Econ | 9635.00 | 1965.00 | 0.04 | 0.15 | 1.50 | 1% |
| Mid | 13,953.00 | 2654.00 | 0.05 | 0.15 | 1.70 | 1% | |
| Lux | 33,710.00 | 2654.00 | 0.06 | 0.15 | 2.09 | 1% | |
| Hybrid | Econ | 31,252.91 | 1654.00 | 0.02 | 0.15 | 0.68 | 5% |
| Mid | 41,018.00 | 1654.00 | 0.02 | 0.15 | 0.85 | 5% | |
| Lux | 47,584.00 | 1571.00 | 0.02 | 0.15 | 0.92 | 5% | |
| Electric | Econ | 13,250.00 | 3127.62 | 0.00 | 0.15 | 0.54 | 10% |
| Mid | 27,072.75 | 4372.41 | 0.00 | 0.15 | 0.76 | 10% | |
| Lux | 42,423.52 | 1492.71 | 0.00 | 0.15 | 0.94 | 10% | |
| Bikes | Econ | 1373.00 | 1859.00 | 0.02 | 0.15 | 0.72 | 1% |
| Lux | 4989.00 | 3031.00 | 0.05 | 0.15 | 1.44 | 1% | |
| Adv Bikes | Adv Econ | 1373.00 | 1859.00 | 0.00 | 0.15 | 0.00 | 5% |
| Adv Lux | 4989.00 | 3031.00 | 0.00 | 0.15 | 0.00 | 5% |
Note: ‘Econ’ denotes cars with engine sizes smaller or equal to 1400 cc. ‘Mid’ denotes cars with engine sizes larger than 1400 cc and smaller than 2000 cc. ‘Lux’ denotes cars with engine sizes larger than 2000 cc. N/A indicates that data is not available or the car technology is not widely used in the country.
Table A2.
The initial parameters assumed for Japan.
Table A2.
The initial parameters assumed for Japan.
| Technology | Engine Size | Prices of Cars (USD/vehicle) | Standard Deviation of Price (USD/vehicle) | Fuel Cost (USD/km) | Discount Rate | Energy Use (MJ/vkm) | Learning Rate |
|---|---|---|---|---|---|---|---|
| Petrol | Econ | 12,973.05 | 4044.80 | 0.064 | 0.150 | 2.052 | 1% |
| Mid | 22,197.47 | 9597.81 | 0.068 | 0.150 | 2.260 | 1% | |
| Lux | 31,879.83 | 17,485.23 | 0.077 | 0.150 | 2.740 | 1% | |
| Adv Petrol | Econ | 12,973.05 | 4044.80 | 0.051 | 0.150 | 1.642 | 5% |
| Mid | 22,197.47 | 9597.81 | 0.054 | 0.150 | 1.808 | 5% | |
| Lux | 31,879.83 | 17,485.23 | 0.061 | 0.150 | 2.192 | 5% | |
| Diesel | Econ | N/A | N/A | N/A | N/A | N/A | N/A |
| Mid | N/A | N/A | N/A | N/A | N/A | N/A | |
| Lux | N/A | N/A | N/A | N/A | N/A | N/A | |
| Adv Diesel | Econ | N/A | N/A | N/A | N/A | N/A | N/A |
| Mid | N/A | N/A | N/A | N/A | N/A | N/A | |
| Lux | N/A | N/A | N/A | N/A | N/A | N/A | |
| CNG | Econ | N/A | N/A | N/A | N/A | N/A | N/A |
| Mid | N/A | N/A | N/A | N/A | N/A | N/A | |
| Lux | 27,472.00 | 0.00 | 0.070 | 0.150 | 2.093 | 1% | |
| Hybrid | Econ | 27,547.72 | 836.16 | 0.023 | 0.150 | 0.684 | 5% |
| Mid | 31,488.10 | 5548.62 | 0.028 | 0.150 | 0.848 | 5% | |
| Lux | 40,417.93 | 17,197.10 | 0.031 | 0.150 | 0.923 | 5% | |
| Electric | Econ | 12,448.00 | 1300.00 | 0.000 | 0.150 | 0.540 | 10% |
| Mid | 16,841.40 | 2592.98 | 0.000 | 0.150 | 0.756 | 10% | |
| Lux | 28,407.61 | 2647.72 | 0.000 | 0.150 | 0.936 | 10% | |
| Bikes | Econ | 4516.00 | 2292.00 | 0.046 | 0.150 | 0.720 | 1% |
| Lux | 12,357.00 | 4541.00 | 0.057 | 0.150 | 1.440 | 1% | |
| Adv Bikes | Adv Econ | 4516.00 | 2292.00 | 0.037 | 0.150 | 0.000 | 5% |
| Adv Lux | 12,357.00 | 4541.00 | 0.046 | 0.150 | 0.000 | 5% |
Note: ‘Econ’ denotes cars with engine sizes smaller or equal to 1400 cc. ‘Mid’ denotes cars with engine sizes larger than 1400 cc and smaller than 2000 cc. ‘Lux’ denotes cars with engine sizes larger than 2000 cc. N/A indicates that data is not available or the car technology is not widely used in the country.
Table A3.
The initial parameters assumed for South Korea.
Table A3.
The initial parameters assumed for South Korea.
| Technology | Engine Size | Prices of Cars (USD/vehicle) | Standard Deviation of Price (USD/vehicle) | Fuel Cost (USD/km) | Discount Rate | Energy Use (MJ/vkm) | Learning Rate |
|---|---|---|---|---|---|---|---|
| Petrol | Econ | 17,842.45 | 30,920.21 | 0.079 | 0.15 | 2.05 | 1% |
| Mid | 19,342.74 | 5601.90 | 0.103 | 0.15 | 2.26 | 1% | |
| Lux | 38,942.42 | 29,216.44 | 0.139 | 0.15 | 2.74 | 1% | |
| Adv Petrol | Econ | 17,842.45 | 30,920.21 | 0.045 | 0.15 | 1.64 | 5% |
| Mid | 19,342.74 | 5601.90 | 0.059 | 0.15 | 1.81 | 5% | |
| Lux | 38,942.42 | 29,216.44 | 0.079 | 0.15 | 2.19 | 5% | |
| Diesel | Econ | N/A | N/A | N/A | N/A | N/A | N/A |
| Mid | 22,294.36 | 10,372.06 | 0.078 | 0.15 | 2.12 | 1% | |
| Lux | 29,919.85 | 15,199.82 | 0.093 | 0.15 | 2.40 | 1% | |
| Adv Diesel | Econ | N/A | N/A | N/A | N/A | N/A | N/A |
| Mid | 22,294.36 | 10,372.06 | 0.042 | 0.15 | 1.70 | 5% | |
| Lux | 29,919.85 | 15,199.82 | 0.050 | 0.15 | 1.92 | 5% | |
| CNG | Econ | N/A | N/A | N/A | N/A | N/A | N/A |
| Mid | N/A | N/A | N/A | N/A | N/A | N/A | |
| Lux | N/A | N/A | N/A | N/A | N/A | N/A | |
| Hybrid | Econ | 23,080.00 | 1000.00 | 0.040 | 0.15 | 0.68 | 5% |
| Mid | 30,655.62 | 3111.79 | 0.052 | 0.15 | 0.85 | 5% | |
| Lux | 35,031.11 | 10,048.45 | 0.103 | 0.15 | 0.92 | 5% | |
| Electric | Econ | 10,455.00 | 1000.00 | 0.004 | 0.15 | 0.67 | 10% |
| Mid | 12,272.00 | 100.00 | 0.005 | 0.15 | 0.81 | 10% | |
| Lux | 30,460.00 | 1000.00 | 0.008 | 0.15 | 0.93 | 10% | |
| Bikes | Econ | 2071.00 | 831.00 | 0.026 | 0.15 | 0.72 | 1% |
| Lux | 6306.00 | 2366.00 | 0.032 | 0.15 | 1.44 | 1% | |
| Adv Bikes | Adv Econ | 2071.00 | 831.00 | 0.026 | 0.15 | 0.00 | 5% |
| Adv Lux | 6306.00 | 2366.00 | 0.032 | 0.15 | 0.00 | 5% |
Note: ‘Econ’ denotes cars with engine sizes smaller or equal to 1400 cc. ‘Mid’ denotes cars with engine sizes larger than 1400 cc and smaller than 2000 cc. ‘Lux’ denotes cars with engine sizes larger than 2000 cc. N/A indicates that data is not available or the car technology is not widely used in the country.
Table A4.
The initial parameters assumed for Taiwan.
Table A4.
The initial parameters assumed for Taiwan.
| Technology | Engine Size | Prices of Cars (USD/vehicle) | Standard Deviation of Price (USD/vehicle) | Fuel Cost (USD/km) | Discount Rate | Energy Use (MJ/vkm) | Learning Rate |
|---|---|---|---|---|---|---|---|
| Petrol | Econ | 12,936.18 | 2872.35 | 0.068 | 0.15 | 1.98 | 0.01 |
| Mid | 21,320.53 | 3746.18 | 0.069 | 0.15 | 2.02 | 0.01 | |
| Lux | 27,991.15 | 15,787.11 | 0.095 | 0.15 | 2.77 | 0.01 | |
| Adv Petrol | Econ | 15,523.41 | 2872.35 | 0.061 | 0.15 | 1.59 | 0.05 |
| Mid | 25,584.64 | 3746.18 | 0.062 | 0.15 | 1.61 | 0.05 | |
| Lux | 33,589.37 | 15,787.11 | 0.085 | 0.15 | 2.22 | 0.05 | |
| Diesel | Econ | N/A | N/A | N/A | N/A | N/A | N/A |
| Mid | N/A | N/A | N/A | N/A | N/A | N/A | |
| Lux | 33,589.37 | 15,787.11 | 0.072 | 0.15 | 2.53 | 0.01 | |
| Adv Diesel | Econ | N/A | N/A | N/A | N/A | N/A | N/A |
| Mid | N/A | N/A | N/A | N/A | N/A | N/A | |
| Lux | 33,589.37 | 15,787.11 | 0.065 | 0.15 | 2.02 | 0.05 | |
| CNG | Econ | N/A | N/A | N/A | N/A | N/A | N/A |
| Mid | N/A | N/A | N/A | N/A | N/A | N/A | |
| Lux | N/A | N/A | N/A | N/A | N/A | N/A | |
| Hybrid | Econ | 19,513.46 | 2913.99 | 0.046 | 0.15 | 1.34 | 0.05 |
| Mid | 22,734.51 | 4844.60 | 0.057 | 0.15 | 1.67 | 0.05 | |
| Lux | 45,303.10 | 13,194.43 | 0.068 | 0.15 | 2.00 | 0.05 | |
| Electric | Econ | 18,984.94 | 190.13 | 0.000 | 0.15 | 0.21 | 0.1 |
| Mid | 31,287.74 | 1529.99 | 0.000 | 0.15 | 0.54 | 0.1 | |
| Lux | 40,650.00 | 2080.00 | 0.000 | 0.15 | 0.58 | 0.1 | |
| Bikes | Econ | 4516.00 | 2292.00 | 0.025 | 0.15 | 0.53 | 0.01 |
| Lux | 12,357.00 | 4541.00 | 0.026 | 0.15 | 0.77 | 0.01 | |
| Adv Bikes | Adv Econ | 4516.00 | 2292.00 | 0.000 | 0.15 | 0.53 | 0.05 |
| Adv Lux | 12,357.00 | 4541.00 | 0.000 | 0.15 | 0.77 | 0.05 |
Note: ‘Econ’ denotes cars with engine sizes smaller or equal to 1400 cc. ‘Mid’ denotes cars with engine sizes larger than 1400 cc and smaller than 2000 cc. ‘Lux’ denotes cars with engine sizes larger than 2000 cc. N/A indicates that data is not available or the car technology is not widely used in the country.
Appendix B. Assumptions for the Policy Scenarios
Table A5.
Assumptions for policy scenarios for China.
Table A5.
Assumptions for policy scenarios for China.
| China | Vehicle Tax (USD) | EV Subsidies (USD) | Registration Tax (USD) | Fuel Tax (USD/L) | Carbon Tax ($/(gCO2/km)) | Fuel Economy Standard | Kick-Start Program | Biofuel Mandate |
|---|---|---|---|---|---|---|---|---|
| Baseline scenario | 0 | 0 | 0 | 0 | 0 | N/A | N/A | N/A |
| Scenario 1 | Up to 1200 | Up to 9000 | Up to 300 | 1.2 | 20 | N/A | 0.3% | N/A |
| Scenario 2 | Up to 1200 | Up to 12,000 | Up to 300 | 1.2 | 40 | 20 km/L | 1.5% | N/A |
| Scenario 3 | Up to 1200 | Up to 15,000 | Up to 300 | 1.2 | 40 | 20 km/L | 3% | 20% |
Table A6.
Assumptions for policy scenarios for Japan.
Table A6.
Assumptions for policy scenarios for Japan.
| Japan | Vehicle Tax (USD) | EV Subsidies (USD) | Registration Tax (USD) | Fuel Tax (USD/L) | Carbon Tax ($/(gCO2/km)) | Fuel Economy Standard | Kick-Start Program | Biofuel Mandate |
|---|---|---|---|---|---|---|---|---|
| Baseline scenario | 0 | 0 | 0 | 0 | 0 | N/A | N/A | N/A |
| Scenario 1 | Up to 1200 | Up to 9,000 | Up to 300 | 1.2 | 20 | N/A | 0.3% | N/A |
| Scenario 2 | Up to 1200 | Up to 12,000 | Up to 300 | 1.2 | 40 | 20 km/L | 1.5% | N/A |
| Scenario 3 | Up to 1200 | Up to 15,000 | Up to 300 | 1.2 | 40 | 20 km/L | 3% | 20% |
Table A7.
Assumptions for policy scenarios for South Korea.
Table A7.
Assumptions for policy scenarios for South Korea.
| Korea | Vehicle Tax (USD) | EV Subsidies (USD) | Registration Tax (USD) | Fuel Tax (USD/L) | Carbon Tax ($/(gCO2/km)) | Fuel Economy standard | Kick-Start Program | Biofuel Mandate |
|---|---|---|---|---|---|---|---|---|
| Baseline scenario | 0 | 0 | 0 | 0 | 0 | N/A | N/A | N/A |
| Scenario 1 | Up to 1200 | Up to 9000 | Up to 300 | 1.2 | 20 | N/A | 0.3% | N/A |
| Scenario 2 | Up to 1200 | Up to 12,000 | Up to 300 | 1.2 | 40 | 20 m/L | 1/5% | N/A |
| Scenario 3 | Up to 1200 | Up to 15,000 | Up to 300 | 1.2 | 40 | 20 m/L | 3% | 20% |
Table A8.
Assumptions for policy scenarios for Taiwan.
Table A8.
Assumptions for policy scenarios for Taiwan.
| Taiwan | Vehicle Tax (USD) | EV Subsidies (USD) | Registration Tax (USD) | Fuel Tax (USD/L) | Carbon Tax ($/(gCO2/km)) | Fuel Economy Standard | Kick-Start Program | Biofuel Mandate |
|---|---|---|---|---|---|---|---|---|
| Baseline scenario | 0 | 0 | 0 | 0 | 0 | N/A | N/A | N/A |
| Scenario 1 | Up to 1200 | Up to 9000 | Up to 300 | 1.2 | 20 | N/A | 0.3% | N/A |
| Scenario 2 | Up to 1200 | Up to 12,000 | Up to 300 | 1.2 | 40 | 20 km/L | 1.5% | N/A |
| Scenario 3 | Up to 1200 | Up to 15,000 | Up to 300 | 1.2 | 40 | 20 km/L | 3% | 20% |
Note: The baseline scenario assumes that when there is no policy incentive in place. Scenario 1 assumes that there is an increase in the tax incentives and subsidies, with a small kick-start program. Scenario 2 assumes that there is a larger kick-start program (than scenario 1) in the presence of a fuel economy standard. Scenario 3 assumes there is a biofuel mandate in addition to a higher EV subsidy and a larger kick-start program than scenario 2.
Appendix C. Sensitivity Analysis
In this section, we carry out a sensitivity analysis over most relevant technological parameters of FTT: Transport, including the discount rate, the learning rate, the γ factor and the fuel prices. These parameters were chosen because they generate the most changes in emissions and technological shares.
The parameters varied here are as follows
- Learning rates for the EVs. We did not vary the learning rate for conventional petrol and diesel cars because the learning for the mature technologies is insignificant;
- Consumer discount rates;
- All γi values simultaneously; (for all vehicle types);
- The fuel prices.
The variation used is between 5% and 20%, depending on the parameters (see Table A9, Table A10, Table A11 and Table A12). The uncertainty range was chosen based on existing literature (discount rate, learning rate) or variations that we consider as reasonable (the γi values).
We did the sensitivity analysis for the all scenarios. The reason for doing this is that policies constrain model evolution direction, and thus one should not expect to find the same response for all scenarios.
It is important to analyse model responses to variations in key parameters, in order to ensure that the model is not ‘highly sensitive’ to very specific values for any particular parameter. As a benchmark, if the outcome variation is less than the input variation, we assume here that the model is not ‘highly sensitive’ to the particular values chosen.
Table A9, Table A10 and Table A11 show the results for the sensitivity analysis for the four scenarios. The tables show the change of emissions or market shares (in %) as a result of change in the values of the parameters.
We conclude with this analysis the following broad findings. (1) The effect of learning rates, discount rates, γi values and fuel prices varies between countries and scenarios. (2) Learning rates, discount rates and fuel prices have a relatively larger impact on results (changes in outcomes much larger than changes in the parameters) than γi values. Overall, the changes in market shares and emissions as a result of the variation in parameter are within 20%.
Table A9.
Sensitivity analysis on key technological parameters in the baseline scenario.
Table A9.
Sensitivity analysis on key technological parameters in the baseline scenario.
| Country | Variations in Key Parameters | Emissions | Technology Shares | |||||
|---|---|---|---|---|---|---|---|---|
| CO2 | Petrol Car | Diesel Car | Hybrid | CNG | EV | Motorcycles | ||
| China | Learning rate + 5% | −2.10% | −2.48% | −1.04% | 1.20% | 0.00% | 2.32% | 0.00% |
| Learning rate − 5% | 3.90% | 6.10% | 0.12% | 0.00% | 0.00% | −6.22% | 0.00% | |
| Discount rate + 10% | 1.80% | 1.38% | 0.00% | −1.04% | 2.45% | −2.80% | 0.00% | |
| Discount rate − 10% | −3.74% | −2.35% | −0.82% | 8.13% | -8.69% | 3.74% | −0.34% | |
| All Gamma values + 20% | 2.90% | 2.00% | 0.00% | 0.10% | −1.40% | −0.70% | 0.00% | |
| All Gamma values − 20% | 1.40% | 1.20% | 0.00% | 0.00% | −0.85% | −0.35% | 0.00% | |
| Fuel price + 20% | −5.90% | −6.61% | −0.01% | 3.07% | 3.40% | −0.55% | 0.70% | |
| Fuel price − 20% | 3.78% | 4.98% | 0.02% | 0.80% | −4.95% | −0.60% | −0.25% | |
| Japan | Learning rate + 5% | −3.45% | −4.67% | 0.00% | 3.57% | 0.00% | 1.10% | 0.00% |
| Learning rate − 5% | 0.95% | 2.00% | 0.00% | −0.45% | 0.00% | −1.55% | 0.00% | |
| Discount rate + 10% | 4.52% | 2.90% | 0.00% | −2.40% | 0.00% | −0.50% | 0.00% | |
| Discount rate − 10% | −3.56% | −3.10% | 0.00% | 2.10% | 0.00% | 1.00% | 0.00% | |
| All Gamma values + 20% | −2.22% | −2.37% | 0.00% | 2.39% | 0.00% | −0.02% | 0.00% | |
| All Gamma values − 20% | 0.02% | 0.01% | 0.00% | −0.02% | 0.00% | 0.00% | 0.00% | |
| Fuel price + 20% | −3.22% | −2.03% | 0.00% | 2.03% | 0.00% | 0.00% | 0.00% | |
| Fuel price − 20% | 3.31% | 3.77% | 0.00% | −3.55% | 0.00% | −0.22% | 0.00% | |
| Korea | Learning rate + 5% | −4.52% | −5.60% | 0.00% | 4.64% | 0.00% | 0.97% | 0.00% |
| Learning rate − 5% | 2.34% | 2.76% | −0.30% | −2.27% | 0.00% | −0.19% | 0.00% | |
| Discount rate + 10% | 4.80% | 3.60% | −2.00% | −1.70% | 0.00% | −0.50% | 0.60% | |
| Discount rate − 10% | −3.20% | 2.92% | 0.00% | −3.74% | 0.00% | 0.82% | 0.00% | |
| All Gamma values + 20% | 0.02% | 0.00% | 0.00% | 0.01% | 0.00% | 0.00% | 0.00% | |
| All Gamma values − 20% | 0.05% | 0.00% | −0.01% | 0.00% | 0.00% | 0.00% | 0.01% | |
| Fuel price + 20% | −0.31% | −0.11% | 0.00% | 0.00% | 0.00% | −0.06% | 0.17% | |
| Fuel price − 20% | 0.22% | 0.12% | 0.00% | 0.00% | 0.00% | −0.06% | −0.06% | |
| Taiwan | Learning rate + 5% | −0.02% | −0.01% | 0.00% | 0.00% | 0.00% | 0.00% | 0.00% |
| Learning rate − 5% | 0.01% | 0.00% | 0.00% | 0.00% | 0.00% | 0.00% | 0.00% | |
| Discount rate + 10% | 1.20% | −1.10% | 0.00% | 0.00% | 0.00% | 0.00% | 1.10% | |
| Discount rate − 10% | −0.49% | −0.41% | 0.55% | 0.00% | 0.00% | 0.00% | −0.14% | |
| All Gamma values + 20% | 0.00% | −0.25% | 0.00% | 0.00% | 0.00% | 0.00% | 0.25% | |
| All Gamma values − 20% | −0.57% | 0.07% | 0.07% | 0.00% | 0.00% | 0.00% | −0.14% | |
| Fuel price + 20% | −5.21% | −6.00% | 0.00% | 0.54% | 0.00% | 1.76% | 3.70% | |
| Fuel price − 20% | 8.54% | 4.17% | 0.00% | 1.21% | 0.00% | −1.61% | −3.77% | |
Note: Each number refers to a percentage change in CO2 emissions or technological shares (share of total fleet). Variations used are considered as realistic uncertainty values. Changes in rates are percentage point changes. Outcome changes on emissions are cumulated to 2050, while for shares the values are in 2050.
Table A10.
Sensitivity analysis on key technological parameters in Scenario 1.
Table A10.
Sensitivity analysis on key technological parameters in Scenario 1.
| Country | Variations in Key Parameters | Emissions | Technology Shares | |||||
|---|---|---|---|---|---|---|---|---|
| CO2 | Petrol Car | Diesel Car | Hybrid | CNG | EV | Motorcycles | ||
| China | Learning rate + 5% | −1.64% | −3.16% | 0.00% | 0.16% | 0.00% | 2.99% | 0.00% |
| Learning rate − 5% | 1.54% | 2.74% | 0.00% | 0.00% | 0.00% | −2.73% | 0.00% | |
| Discount rate + 10% | 3.98% | 2.15% | 0.01% | −1.62% | 3.81% | −4.35% | 0.00% | |
| Discount rate − 10% | −4.10% | −2.08% | −1.00% | 1.74% | −2.84% | 4.55% | −0.37% | |
| All Gamma values + 20% | 1.85% | 1.88% | 0.00% | 0.09% | −1.32% | −0.68% | 0.02% | |
| All Gamma values − 20% | 1.10% | 1.35% | 0.00% | 0.00% | −0.95% | −0.47% | 0.08% | |
| Fuel price + 20% | −1.74% | −1.50% | 0.00% | 0.02% | 0.00% | 1.06% | 0.42% | |
| Fuel price − 20% | 1.98% | 1.83% | 0.00% | −0.02% | 0.00% | −1.65% | −0.15% | |
| Japan | Learning rate + 5% | −3.70% | −3.99% | 0.00% | 3.05% | 0.00% | 0.94% | 0.00% |
| Learning rate − 5% | 1.90% | 1.71% | 0.00% | −0.40% | 0.00% | −1.31% | 0.00% | |
| Discount rate + 10% | 3.80% | 4.20% | 0.00% | −3.70% | 0.00% | −0.50% | 0.00% | |
| Discount rate − 10% | −1.42% | −1.66% | 0.00% | 1.90% | 0.00% | −0.24% | 0.00% | |
| All Gamma values + 20% | −0.44% | −0.38% | 0.00% | 2.12% | 0.00% | −1.74% | 0.00% | |
| All Gamma values − 20% | 0.55% | 1.37% | 0.00% | 0.00% | 0.00% | −1.37% | 0.00% | |
| Fuel price + 20% | −5.86% | −1.26% | 0.00% | 7.00% | 0.00% | −5.74% | 0.00% | |
| Fuel price − 20% | 6.90% | 7.28% | 0.00% | −4.20% | 0.00% | −3.08% | 0.00% | |
| Korea | Learning rate + 5% | −1.85% | −8.06% | −0.21% | 6.53% | 0.00% | 1.83% | 0.00% |
| Learning rate − 5% | 3.61% | 3.35% | 0.02% | −2.65% | 0.00% | −0.72% | 0.00% | |
| Discount rate + 10% | 7.45% | 6.42% | 0.41% | −3.70% | 0.00% | −3.64% | 0.51% | |
| Discount rate − 10% | −4.33% | −3.15% | −1.96% | 5.58% | 0.00% | −0.27% | −0.20% | |
| All Gamma values + 20% | 1.33% | 1.64% | 0.00% | 0.08% | 0.00% | −1.73% | 0.01% | |
| All Gamma values − 20% | 0.39% | 0.24% | 0.00% | −2.45% | 0.00% | 2.21% | 0.00% | |
| Fuel price + 20% | −10.50% | −9.17% | 4.00% | −1.38% | 0.00% | 6.29% | 0.26% | |
| Fuel price − 20% | 12.45% | 11.50% | −5.02% | 1.73% | 0.00% | −8.12% | −0.09% | |
| Taiwan | Learning rate + 5% | −0.02% | −0.01% | 0.00% | 0.00% | 0.00% | 0.14% | −0.13% |
| Learning rate − 5% | 0.40% | 0.10% | 0.00% | 0.00% | 0.00% | −0.22% | 0.12% | |
| Discount rate + 10% | 1.60% | 0.16% | 0.00% | −0.37% | 0.00% | −0.86% | 1.07% | |
| Discount rate − 10% | −0.54% | −0.47% | 0.00% | 2.22% | 0.00% | −1.61% | −0.14% | |
| All Gamma values + 20% | −0.34% | −0.27% | 0.26% | 0.43% | 0.00% | −0.48% | 0.06% | |
| All Gamma values − 20% | −0.05% | −0.04% | 0.14% | −0.14% | 0.00% | 0.07% | −0.03% | |
| Fuel price + 20% | −7.98% | −8.53% | −3.31% | # | 0.00% | 3.21% | 5.22% | |
| Fuel price − 20% | 6.65% | 0.67% | 0.00% | 0.13% | 0.00% | −4.80% | 4.00% | |
Note: Each number refers to a percentage change in CO2 emissions or technological shares (share of total fleet). Variations used are considered as realistic uncertainty values. Changes in rates are percentage point changes. Outcome changes on emissions are cumulated to 2050, while for shares the values are in 2050.
Table A11.
Sensitivity analysis on key technological parameters in Scenario 2.
Table A11.
Sensitivity analysis on key technological parameters in Scenario 2.
| Country | Variations in Key Parameters | Emissions | Technology Shares | |||||
|---|---|---|---|---|---|---|---|---|
| CO2 | Petrol Car | Diesel Car | Hybrid | CNG | EV | Motorcycles | ||
| China | Learning rate + 5% | −4.80% | −3.74% | 0.00% | 0.00% | 0.00% | 3.74% | 0.00% |
| Learning rate − 5% | 3.41% | 2.63% | 0.00% | 0.00% | 0.00% | −2.63% | 0.00% | |
| Discount rate + 10% | 3.10% | 3.20% | 0.00% | 0.04% | 0.00% | −3.65% | 0.41% | |
| Discount rate − 10% | −4.77% | −5.35% | 0.00% | 0.00% | 0.00% | 5.09% | −0.42% | |
| All Gamma values + 20% | 1.60% | 1.11% | 0.00% | 2.26% | −2.24% | −1.35% | 0.22% | |
| All Gamma values − 20% | 2.04% | 0.91% | 0.00% | 0.00% | −0.67% | −0.24% | 0.00% | |
| Fuel price + 20% | −8.10% | −7.80% | 0.01% | 2.10% | −2.00% | 7.32% | 0.37% | |
| Fuel price − 20% | 4.90% | 3.21% | −0.01% | −2.60% | 1.33% | −1.80% | −0.13% | |
| Japan | Learning rate + 5% | −2.45% | −5.65% | 0.00% | 4.32% | 0.00% | 1.33% | 0.00% |
| Learning rate − 5% | 4.24% | 3.42% | 0.02% | −2.75% | 0.00% | −0.69% | 0.00% | |
| Discount rate + 10% | 5.21% | 3.43% | 0.00% | −4.21% | 0.00% | 0.77% | 0.00% | |
| Discount rate − 10% | −3.41% | −4.27% | 0.00% | 6.10% | 0.00% | −1.83% | 0.00% | |
| All Gamma values + 20% | −0.32% | −0.37% | 0.00% | 1.79% | 0.00% | −1.42% | 0.00% | |
| All Gamma values − 20% | −1.40% | −0.92% | 0.00% | −0.25% | 0.00% | 1.17% | 0.00% | |
| Fuel price + 20% | −4.50% | −4.05% | 0.10% | 6.10% | 0.00% | −2.15% | 0.00% | |
| Fuel price − 20% | 5.96% | 3.83% | 0.09% | 2.11% | 0.00% | −6.03% | 0.00% | |
| Korea | Learning rate + 5% | −2.91% | −4.12% | 0.12% | 2.10% | 0.00% | 1.30% | 0.60% |
| Learning rate − 5% | 4.28% | 1.86% | 0.01% | −0.23% | 0.00% | −1.29% | −0.35% | |
| Discount rate + 10% | 6.45% | 4.29% | 0.98% | 0.35% | 0.00% | −5.61% | 0.00% | |
| Discount rate − 10% | −4.96% | −4.19% | −0.63% | 6.76% | 0.00% | −0.70% | −1.24% | |
| All Gamma values + 20% | 2.85% | 2.16% | 0.00% | 0.11% | 0.00% | −2.29% | 0.02% | |
| All Gamma values − 20% | 2.80% | 0.32% | 0.00% | −3.24% | 0.00% | 2.92% | 0.00% | |
| Fuel price + 20% | −5.79% | -7.00% | 3.00% | −1.24% | 0.00% | 4.88% | 0.36% | |
| Fuel price − 20% | 12.41% | 11.34% | 0.01% | −3.96% | 0.00% | -7.26% | −0.13% | |
| Taiwan | Learning rate + 5% | −3.04% | −2.85% | 0.00% | 0.00% | 0.00% | 3.08% | −0.23% |
| Learning rate − 5% | 2.86% | 2.69% | 0.00% | 0.00% | 0.00% | −2.90% | 0.21% | |
| Discount rate + 10% | 3.14% | 0.27% | 0.00% | 0.67% | 0.00% | −1.50% | 0.56% | |
| Discount rate − 10% | −2.53% | −0.83% | 0.00% | 3.87% | 0.00% | −2.81% | −0.24% | |
| All Gamma values + 20% | −0.34% | −0.28% | 0.29% | 0.48% | 0.00% | −0.54% | 0.05% | |
| All Gamma values − 20% | −0.27% | −0.05% | 0.16% | −0.16% | 0.00% | 0.07% | −0.03% | |
| Fuel price + 20% | −6.55% | −8.44% | 0.00% | 4.33% | 0.00% | 4.11% | 4.38% | |
| Fuel price − 20% | 9.21% | 7.34% | 0.00% | −3.77% | 0.00% | −3.58% | 3.36% | |
Note: Each number refers to a percentage change in CO2 emissions or technological shares (share of total fleet). Variations used are considered as realistic uncertainty values. Changes in rates are percentage point changes. Outcome changes on emissions are cumulated to 2050, while for shares the values are in 2050.
Table A12.
Sensitivity analysis on key technological parameters in Scenario 3.
Table A12.
Sensitivity analysis on key technological parameters in Scenario 3.
| Country | Variations in Key Parameters | Emissions | Technology Shares | |||||
|---|---|---|---|---|---|---|---|---|
| CO2 | Petrol Car | Diesel Car | Hybrid | CNG | EV | Motorcycles | ||
| China | Learning rate + 5% | −6.24% | −6.58% | 0.00% | 0.00% | 0.00% | 6.59% | 0.00% |
| Learning rate − 5% | 4.43% | 4.41% | 0.00% | 0.00% | 0.00% | −4.41% | 0.00% | |
| Discount rate + 10% | 4.10% | 3.75% | 0.00% | 0.05% | 0.00% | −3.80% | 0.00% | |
| Discount rate − 10% | -8.14% | −4.69% | 0.00% | 0.00% | 0.00% | 5.01% | 0.00% | |
| All Gamma values + 20% | 0.91% | 0.74% | 0.00% | 0.03% | 0.00% | −0.88% | 0.11% | |
| All Gamma values − 20% | 0.81% | 0.70% | 0.00% | 0.03% | 0.00% | −0.73% | 0% | |
| Fuel price + 20% | −9.11% | −10.92% | 0.01% | 1.17% | −2.80% | 12.50% | 0.00% | |
| Fuel price − 20% | 5.09% | 2.75% | −0.01% | −2.07% | 1.06% | −1.73% | 0.00% | |
| Japan | Learning rate + 5% | −4.09% | −6.85% | 0.00% | 3.87% | 0.00% | 2.98% | 0.00% |
| Learning rate − 5% | 7.12% | 2.52% | 0.02% | −1.75% | 0.00% | −0.78% | 0.00% | |
| Discount rate + 10% | 6.47% | 4.12% | 0.00% | −5.05% | 0.00% | 0.93% | 0.00% | |
| Discount rate − 10% | −4.02% | −5.10% | 0.00% | 0.20% | 0.00% | 4.90% | 0.00% | |
| All Gamma values + 20% | −0.99% | −0.21% | 0.00% | 0.93% | 0.00% | −0.72% | 0.00% | |
| All Gamma values − 20% | −0.26% | −0.16% | 0.00% | 0.45% | 0.00% | −0.29% | 0.00% | |
| Fuel price + 20% | −5.34% | −5.36% | 0.00% | −1.45% | 0.00% | 6.8100% | 0.00% | |
| Fuel price − 20% | 4.58% | 3.41% | 0.08% | 1.88% | 0.00% | −5.37% | 0.00% | |
| Korea | Learning rate + 5% | −3.74% | −2.03% | 0.18% | 0.73% | 0.00% | 2.66% | 0.00% |
| Learning rate − 5% | 3.66% | 2.46% | 0.02% | 0.25% | 0.00% | −2.73% | 0.00% | |
| Discount rate +10% | 3.43% | 4.13% | 0.94% | −0.02% | 0.00% | −5.41% | 0.00% | |
| Discount rate − 10% | −4.65% | −3.33% | −0.50% | 5.37% | 0.00% | −1.41% | 0.00% | |
| All Gamma values + 20% | −0.05% | −0.03% | 0.24% | 0.59% | 0.00% | −0.80% | 0.00% | |
| All Gamma values − 20% | 0.34% | 0.04% | −0.29% | −0.97% | 0.00% | 0.98% | 0.25% | |
| Fuel price + 20% | −8.57% | -10.29% | 4.41% | −1.29% | 0.00% | 6.72% | 0.00% | |
| Fuel price − 20% | 15.22% | 17.92% | 0.02% | −6.25% | 0.00% | −11.48% | 0.00% | |
| Taiwan | Learning rate + 5% | −5.20% | −2.80% | 0.00% | 0.00% | 0.00% | 5.00% | −2.20% |
| Learning rate − 5% | 3.40% | 2.83% | 0.00% | 0.00% | 0.00% | −4.63% | 1.80% | |
| Discount rate + 10% | 1.90% | 0.59% | 0.00% | 0.94% | 0.00% | −1.53% | 0.00% | |
| Discount rate − 10% | −2.54% | −1.34% | 0.00% | 6.28% | 0.00% | −3.97% | 0.00% | |
| All Gamma values + 20% | −1.65% | −0.52% | 0.59% | 0.89% | 0.00% | −1.01% | 0.00% | |
| All Gamma values − 20% | −0.67% | −0.39% | 0.61% | 0.88% | 0.00% | −1.06% | 0.00% | |
| Fuel price + 20% | −4.87% | −5.45% | 0.00% | 0.51% | 0.00% | 4.39% | 0.54% | |
| Fuel price − 20% | 6.07% | 5.72% | 0.00% | −2.93% | 0.00% | −2.46% | −0.33% | |
Note: Each number refers to a percentage change in CO2 emissions or technological shares (share of total fleet). Variations used are considered as realistic uncertainty values. Changes in rates are percentage point changes. Outcome changes on emissions are cumulated to 2050, while for shares the values are in 2050.
References
- IPCC. Mitigation of Climate Change. Contribution of Working Group III to the Fifth Assessment Report of the Intergovernmental Panel on Climate Change; University of Cambridge: Cambridge, UK, 2014. [Google Scholar]
- Matsuhashi, K.; Ariga, T. Estimation of passenger car CO2 emissions with urban population density scenarios for low carbon transportation in Japan. IATSS Res. 2016, 39, 117–120. [Google Scholar] [CrossRef]
- Yan, X.; Crookes, R. Energy demand and emissions from road transportation vehicles in China. Prog. Energy Combust. Sci. 2010, 36, 651–676. [Google Scholar] [CrossRef]
- Kemp, R.; Schot, J.; Hoogma, R. Regime shifts to sustainability through processes of niche formation: The approach of strategic niche management. Technol. Anal. Strateg. Manag. 1998, 10, 175–198. [Google Scholar] [CrossRef]
- Ko, A.; Myung, C.; Park, S.; Kwon, S. Scenario-based CO2 emissions reduction potential and energy use in Republic of Korea’s passenger vehicle fleet. Transp. Res. Part A Policy Pract. 2014, 59, 346–356. [Google Scholar] [CrossRef]
- Paltsev, S.; Chen, Y.; Karplus, V.; Kishimoto, P.; Reilly, J.; Löschel, A.; von Graevenitz, K.; Koesler, S. Reducing CO2 from cars in the European Union. Transportation 2016, 45, 1–23. [Google Scholar] [CrossRef]
- Oshiro, K.; Masui, T. Diffusion of low emission vehicles and their impact on CO2 emission reduction in Japan. Energy Policy 2015, 81, 215–225. [Google Scholar] [CrossRef]
- Wang, H.; Ou, X.; Zhang, X. Mode, technology, energy consumption, and resulting CO2 emissions in China’s transport sector up to 2050. Energy Policy 2017, 109, 719–733. [Google Scholar] [CrossRef]
- Fullerton, D.; Gan, L.; Hattori, M. A model to evaluate vehicle emission incentive policies in Japan. Environ. Econ. Policy Stud. 2015, 17, 79–108. [Google Scholar] [CrossRef][Green Version]
- Mercure, J.; Lam, A. The effectiveness of policy on consumer choices for private road passenger transport emissions reductions in six major economies. Environ. Res. Lett. 2015, 10, 064008. [Google Scholar] [CrossRef]
- Gong, H.; Wang, M.; Wang, H. New energy vehicles in China: Policies, demonstration, and progress. Mitig. Adapt. Strateg. Glob. Chang. 2013, 18, 207–228. [Google Scholar] [CrossRef]
- Kitano, T. Disguised Protectionism? Environmental Policy in the Japanese Car Market; Research Institute of Economy, Trade and Industry: Tokyo, Japan, 2013. [Google Scholar]
- Rutherford, D. Hybrids break into the Japanese market (July 2015 update). The International Council on Clean Transportation (ICCT). Available online: https://www.theicct.org/blog/staff/hybrids-break-japanese-market-july-2015-update (accessed on 28 July 2015).
- Iino, F.; Lim, A. Developing Asia’s Competitive Advantage in Green Products: Learning from the Japanese Experience. Available online: https://www.adb.org/publications/developing-asias-competitive-advantage-green-products-learning-japanese-experience (accessed on 28 July 2015).
- Rogers, E. Diffusion of Innovations; Simon and Schuster: New York, NY, USA, 2010. [Google Scholar]
- Arthur, W. Competing technologies, increasing returns, and lock-in by historical events. Econ. J. 1989, 99, 116–131. [Google Scholar] [CrossRef]
- Liao, F.; Molin, E.; van Wee, B. Consumer preferences for electric vehicles: A literature review. Transp. Rev. 2017, 37, 252–275. [Google Scholar] [CrossRef]
- Chanaron, J. Automobiles: A static technology, a “wait-and-see” industry? Int. J. Technol. Manag. 1998, 16, 595–630. [Google Scholar] [CrossRef]
- Mercure, J. FTT: Power: A global model of the power sector with induced technological change and natural resource depletion. Energy Policy 2012, 48, 799–811. [Google Scholar] [CrossRef]
- Anandarajah, G.; McDowall, W.; Ekins, P. Decarbonising road transport with hydrogen and electricity: Long term global technology learning scenarios. Int. J. Hydrog. Energy 2013, 38, 3419–3432. [Google Scholar] [CrossRef]
- Weiss, M.; Patel, M.; Junginger, M.; Perujo, A.; Bonnel, P.; van Grootveld, G. On the electrification of road transport—Learning rates and price forecasts for hybrid-electric and battery-electric vehicles. Energy Policy 2012, 48, 374–393. [Google Scholar] [CrossRef]
- Sagar, A.; van der Zwaan, B. Technological innovation in the energy sector: R&D, deployment, and learning-by-doing. Energy Policy 2006, 34, 2601–2608. [Google Scholar]
- Pollitt, H.; Mercure, J. The role of money and the financial sector in energy-economy models used for assessing climate and energy policy. Clim. Policy 2018, 18, 184–197. [Google Scholar] [CrossRef]
- Kaldor, N. A model of economic growth. Econ. J. 1957, 67, 591–624. [Google Scholar] [CrossRef]
- Mercure, J.; Pollitt, H.; Bassi, A.; Viñuales, J.; Edwards, N. Modelling complex systems of heterogeneous agents to better design sustainability transitions policy. Glob. Environ. Chang. 2016, 37, 102–115. [Google Scholar] [CrossRef]
- Lee, S.; Chewpreecha, U.; Pollitt, H.; Kojima, S. An economic assessment of carbon tax reform to meet Japan’s NDC target under different nuclear assumptions using the E3ME model. Environ. Econ. Policy Stud. 2018, 20, 411–429. [Google Scholar] [CrossRef]
© 2018 by the authors. Licensee MDPI, Basel, Switzerland. This article is an open access article distributed under the terms and conditions of the Creative Commons Attribution (CC BY) license (http://creativecommons.org/licenses/by/4.0/).