Article

Social Sustainability Assessment of Canadian Egg Production Facilities: Methods, Analysis, and Recommendations

Natural Science and Engineering Research Council of Canada (NSERC)/Egg Farmers of Canada (EFC) Industrial Research Chair in Sustainability, Department of Biology/Faculty of Management, University of British Columbia Okanagan, Kelowna, BC V1V 1V7, Canada
Sustainability 2018, 10(5), 1601; https://doi.org/10.3390/su10051601
Submission received: 19 March 2018 / Revised: 11 May 2018 / Accepted: 14 May 2018 / Published: 16 May 2018
(This article belongs to the Special Issue Environmentally Sustainable Livestock Production)

Abstract

:
A detailed assessment of the “gate-to-gate” social risks and benefits of Canadian egg production facilities was undertaken based on the United Nations Environment Programme/Society of Environmental Toxicology and Chemistry (UNEP/SETAC) Guidelines for Social Life Cycle Assessment. Data were collected via survey from a representative subset of Canadian egg farms, and evaluated against a novel suite of indicators and performance reference points developed for relevance in the Canadian context. The evaluation focused on interactions with four stakeholder groups (Workers; Local Communities; Value Chain Partners; and Society) in eighteen thematic areas. This assessment resulted in a rich and highly nuanced characterization of the potential social risks and benefits attributable to contemporary egg production facilities in Canada. Overall, risks were low and benefits were identified for Local Communities, Value Chain Partners, and Society stakeholder groups, but mixed for the Workers stakeholder group. With respect to the latter, identified areas of higher risk are related, in particular, to a subset of indicators for Working Hours, Equal Opportunities and Fair Salary. As such, the results suggest opportunities and strategies for the Canadian egg industry both to capitalize on its current successes as well as to proactively engage in improving its social sustainability profile. The study also contributes a novel set of social sustainability metrics for use and continued development in the Canadian egg sector as well as other agri-food sectors in Canada and beyond. The inevitable challenge in social life cycle assessment (LCA) of developing non-arbitrary performance reference points for social indicators for which clear norms do not exist, and similarly for establishing non-arbitrary scales and thresholds for differentiating between performance levels, is underscored. A necessary next step with respect to the methods presented herein is for stakeholder groups to carefully consider and refine the performance reference points and characterization thresholds that have been developed, in order to assess their alignment with context-specific social sustainability priorities for this industry, and also to extend the analysis to encompass other value chain stages to enable a full social life cycle assessment.

1. Introduction

Social life cycle assessment (S-LCA) is the least developed of the three, complementary strands of life cycle assessment, which provide analytical frameworks for life cycle-based sustainability measurement and management [1]. In complement to environmental LCA and life cycle costing, S-LCA is intended to improve decision support through understanding and identifying measures to reduce the social impacts associated with product life cycles [2,3,4,5].
The “Guidelines for Social Life Cycle Assessment of Products” [6] provide the first major step towards consensus methodologies for S-LCA. These guidelines provide “a map, a skeleton, and a flashlight” [7] for implementation of S-LCA studies. In this context, “map” refers to the broad nature of the guidelines and their preliminary nature. “Skeleton” reflects that the guidelines provide a foundation on which it is envisaged that stakeholders will engage in fleshing out more specific methodological requirements. “Flashlight” highlights that the guidelines illuminate future research needs [7]. In short, considerable work remains—in particular with respect to developing widely accepted social indicators and impact assessment methods, which may vary by sector/context. Uncertainty with respect to scoring and weighting social sustainability performance for specific indicators remains a widely recognized challenge [8]. Despite current limitations, the Guidelines are nonetheless the most widely employed reference document for S-LCA studies [5,9,10].
Among published studies, researchers have developed and applied disparate indicators and impact assessment methods. Variability in approach to indicator development and usage is reflected in the range of qualitative through semi-quantitative and quantitative indicators that have been employed [11,12,13]. With respect to impact assessment methods, the range of approaches may be in part attributable to alternative paradigmatic bases for approaching S-LCA, as well as the necessity of identifying context-appropriate reference points against which to assess social sustainability performance [8,10,14,15]. The development of “Methodological Sheets of Subcategories of Impact for a Social LCA” [16] has provided a first reference point for improving consistency in current practice.
Research has also varied in terms of bottom-up versus top-down approaches to social life cycle assessment. Some authors have stressed the importance of context and company-specific assessments (for example, see [17,18]), since social impacts may vary widely between companies producing otherwise similar products. Others have emphasized the desirability of full supply chain social life cycle inventory modelling and impact assessment, which is much more feasible when generic social life cycle inventory data are employed [1]. In light of the general lack of detailed, process-level social life cycle inventory databases to support full supply chain models in many contexts, gate-to-gate studies are a common and necessary step to making such data available.
Use of social life cycle assessment in agri-food contexts has been limited to date, hence availability of published case studies (for example, see [5,13,14,15,19]) is also limited. Among these, approaches to indicator development and scoring are also varied—reflecting, in part, the highly diverse nature of such contexts [8,13,15].
Eggs and egg products are an important part of the Canadian diet, and the egg industry makes a significant contribution to national agricultural production in Canada [20]. Activities in this industry have potential social risks and benefits for a wide range of stakeholders. To date, research efforts have not been brought to bear in order to understand these potential risks and benefits in support of improved decision making for social sustainability in this industry, nor have appropriate metrics for assessing risks and benefits been advanced.
The general objective of the current analysis was to use the Guidelines for Social LCA [6] and the Methodological Sheets of Subcategories of Impact for a Social LCA [16] as a basis for developing and applying a suite of context-appropriate indicators and metrics to characterize the social risks and benefits specific to activities at Canadian egg production facilities (i.e., what would be the egg production stage in a full S-LCA of egg production). Taking the work of Reveret et al. [19] as inspiration, the assessment used directly collected data from egg farmers in Canada to characterize social risks and benefits for four stakeholder groups (Workers, Local Communities, Value Chain Partners, and Society). Additional work will be necessary to similarly map social risks and benefits that may exist elsewhere along egg value chains in support of a full social life cycle assessment of this industry.
The results of the study include a novel array of social indicators and performance reference points appropriate to the Canadian egg farm context (but also adaptable for application in egg industries elsewhere as well as other agri-food contexts), which should be further refined by egg industry stakeholders looking forward. The results also include a first set of social science-based benchmarks of the social benefits and risks attributable to Canadian egg production for the base year 2012. As such, these results offer insights as to key leverage points for further improving the social sustainability performance of egg production in Canada.
The format of the manuscript broadly mirrors the International Organization for Standardization (ISO) 14044 norm in terms of the four stages of LCA, and the parallel UNEP/SETAC [6] guidelines for social LCA. Section 2 (Methods) describes the Goal and Scope of the study, including details regarding the collection of life cycle inventory (LCI) data, life cycle impact assessment (LCIA) categories and methods, and objectives regarding the interpretation of the study. Section 3 provides detailed life cycle impact assessment (LCIA) results, and Section 4 presents the interpretation and discussion of results.

2. Materials and Methods

2.1. Goal and Scope of the Study

This analysis was undertaken in order to develop and apply methods to characterize the social risks and benefits for the stakeholder groups Workers, Local Communities, Value Chain Partners, and Society associated with activities at contemporary Canadian egg facilities in 2012 (i.e., a “gate-to-gate analysis”). The goal was to arrive at a nuanced understanding of the current social sustainability profile of egg facilities in Canada, supported by development of an appropriate suite of social sustainability metrics, using data directly collected from industry participants and in correspondence with the Guidelines for Social Life Cycle Assessment [6].
The system boundary for the assessment of Canadian egg production facilities is specific to the activities of the participating facilities (i.e., a “gate-to-gate” analysis) and attendant interactions with their stakeholders in 2012. The activity variable is 1000 egg facility worker hours (worker hours is commonly used for this purpose in S-LCA), which results in 82.6 tonnes of egg production. Worker hours was chosen because this will enable integration of future work examining other supply chain stages, using this same aggregating activity variable, for a full social life cycle assessment. Moreover, this will also allow expressing supply chain sustainability impacts per unit of eggs produced in parallel to results from E-LCA studies. It is important to note here that, due to the focus on gate-to-gate interactions only, it was not necessary to define aspects such as allocation principles, cut-offs, etc., nor to develop a flow diagram.

2.1.1. Life Cycle Inventory Analysis

All data used for this detailed assessment of Canadian egg facilities were collected directly via survey from industry participants. Supplementary Information A (SI A) presents the survey that was used for data collection purposes. The survey was designed based on the stakeholder groups and indicator categories described in the Guidelines for Social Life Cycle Assessment. Efforts were made to ensure a representative sample, taking into account region of production (province-level) and farm size. Surveys were administered by provincial egg boards and their field officers.

2.1.2. Life Cycle Impact Assessment Methods

According to the Guidelines for S-LCA, social life cycle impact assessment (S-LCIA) involves:
(a)
aggregating some inventory data within subcategories and categories; and
(b)
making use of additional information, such as internationally accepted levels of minimum performance, to help understand the magnitude and the significance of the data collected in the Inventory phase.
However, in contrast to environmental life cycle impact assessment, standardized, widely accepted social life cycle impact assessment methods that allow aggregation of different kinds of social risk are not yet available for social life cycle assessment. The Guidelines do, however, refer to Methodological Sheets of Subcategories of Impact for a Social LCA [16], which were consulted in order to identify relevant sub-categories for the current analysis.
The S-LCIA stage of this facility-specific analysis focuses on interpretation and presentation of the social life cycle inventory data that were collected from Canadian egg facilities and associated impact assessment results, with results organized by stakeholder group and social theme following the Guideline recommendations. Four stakeholder groups were considered: Workers; Local Communities; Value Chain Partners; and Society (Consumers were not considered, since the analysis did not extend beyond the egg facility gate). Data and results were further organized within each stakeholder group into subcategories. Table 1 describes the stakeholder groups and subcategory combinations that were evaluated.

Establishing Performance Reference Points

In order to interpret the social sustainability performance of Canadian egg production facilities, it was necessary to identify performance reference points (PRPs) for either ideal or minimum acceptable performance along a spectrum of possible performance levels for the subcategory indicators for each social theme. These reference points were chosen, to the extent possible, relative to relevant international and/or Canadian norms. In many cases, however, clear norms were not identifiable as a basis for assessing performance. In such cases, thresholds for differentiating between performance levels were instead based either on ideal performance (for example, a zero percent incidence rate of an undesirable outcome, or a one hundred percent incidence rate of a desirable outcome) or based on % incidence rate along a continuum from undesirable to desirable outcomes. In some cases, more than one norm was identified as potentially relevant. Here, results are presented for each norm. Supplementary Information B (SI B) provides a series of 17 tables describing impact subcategories and subcategory indicators, and reporting the performance reference points and thresholds used to assess performance for each indicator.
It is important to note here that, where clear norms do not exist, the determination of performance reference points is subjective and somewhat arbitrary. Ideally, these should be defined in stakeholder-specific contexts via deliberative democratic procedures that reflect a shared value structure and objectives. For example, within the egg industry, stakeholders could potentially engage in dialogue and processes aimed at determining thresholds that correspond with shared industry values and objectives regarding social sustainability outcomes. For the purpose of the current analysis, many of the performance reference points were researcher-defined and should hence be viewed as placeholder values only. They might also be viewed, however, as a basis for benchmarking, tracking changes, and goal setting with respect to the sustainability performance of the industry over time relative to the 2012 benchmark results.
To assist in the presentation of performance levels, the S-LCIA results are colour coded so as to indicate the performance levels achieved by the industry in 2012. The system of color codes developed by Reveret et al. [19] to represent performance levels for a social life cycle assessment of the Canadian dairy industry is adopted. This system utilizes a scale spanning four performance levels (Figure 1). These are “risky behaviour,” “compliant behaviour,” “proactive behaviour,” and “committed behaviour”.
A risky behaviour is a practice that may potentially result in a serious, undesirable consequence for stakeholders. This includes illegal behaviours as well as behaviours that, although not illegal, may generally be viewed as negative.
A compliant behaviour is one that meets minimum requirements, norms or expectations. This performance level signifies that the organization is not acting in a risky manner, nor is it making any proactive efforts to achieve a socially desirable outcome.
A proactive behaviour is one that indicates some level of initiative towards achieving a more socially desirable outcome than may be legally required.
A committed behaviour is one that reflects leadership or clear striving to achieve socially desirable outcomes. This level of behaviour goes beyond marginal improvements by demonstrating considerably better outcomes than would be associated with compliant behaviour.
Performance levels were assigned based on specific thresholds for each indicator as described in SI B. A fixed scale for thresholds was not feasible—rather, thresholds deemed appropriate to differentiating performance levels for each indicator were developed. As with the assignment of PRPs in the absence of clear norms, the assignment of threshold levels is inevitably somewhat arbitrary unless defined in stakeholder-specific contexts via deliberative democratic procedures that reflect a shared value structure and objectives. This is a widely recognized challenge in S-LCA [6,16].
The methodology for defining the performance reference points and thresholds for each stakeholder group/social theme/sub-category indicator are schematically described in Figure 2. Detailed descriptions of the category indicator-specific methods and rationales are provided in SI B (Tables S1–S17).
It should also be noted that not all performance levels are relevant for all indicators. For example, if no clear norm for an indicator can be identified, then a “risky” behavior cannot be assessed. Nonetheless, it is still useful (for example, for the purpose of benchmarking or sectoral goal setting) to differentiate between the performance of companies, which may engage in socially desirable behaviours to varying degrees, despite the lack of any clear norm or requirement.
To facilitate an accessible presentation of results in Figure 3, Figure 4, Figure 5, Figure 6 and Figure 7, in some cases, indicator results are aggregated if the same performance score/colour code is assigned for multiple related indicators for a subcategory that can be expressed under a common indicator heading. Aggregation and weighting are not otherwise applied.

2.1.3. Interpretation and Recommendations

The Life Cycle Interpretation phase requires systematically reviewing the results of the Life Cycle Impact Assessment phase with respect to the research questions. Here, the interpretation phase focuses in particular on:
  • elucidating the key social risks and benefits for stakeholders that are specifically associated with activities that occur at Canadian egg production facilities.
  • identifying priority areas for interventions to improve the social license of Canadian egg producers, either via communications regarding the social benefits associated with the egg industry, or commitments to monitor and seek to improve the social sustainability profile of Canadian egg production with respect to specific social risk areas.
  • identifying priority areas for further data collection and research.
  • highlighting weaknesses of the current study and recommending areas for further research and methods development.

3. Results

3.1. Life Cycle Inventory Results

In total, usable surveys were collected from 59 egg facilities together representing 357,286 worker hours in Canada in 2012. The number of part- and full-time workers employed in these facilities was 248, with an average of 1440.7 h worked per worker per year. For detailed social life cycle inventory results for each indicator, see SI C Tables S18–S35, which present the social life cycle inventory data, expressed as worker hour-weighted average results, as well as low and high reported values where relevant.

3.2. Life Cycle Impact Assessment Results

Figure 3, Figure 4, Figure 5, Figure 6 and Figure 7 present summary social life cycle impact assessment results for each stakeholder group, social theme and sub-category indicator. For detailed social life cycle impact assessment results for each sub-category indicator, please see SI D Tables S36–S53.

STAKEHOLDER: WORKERS

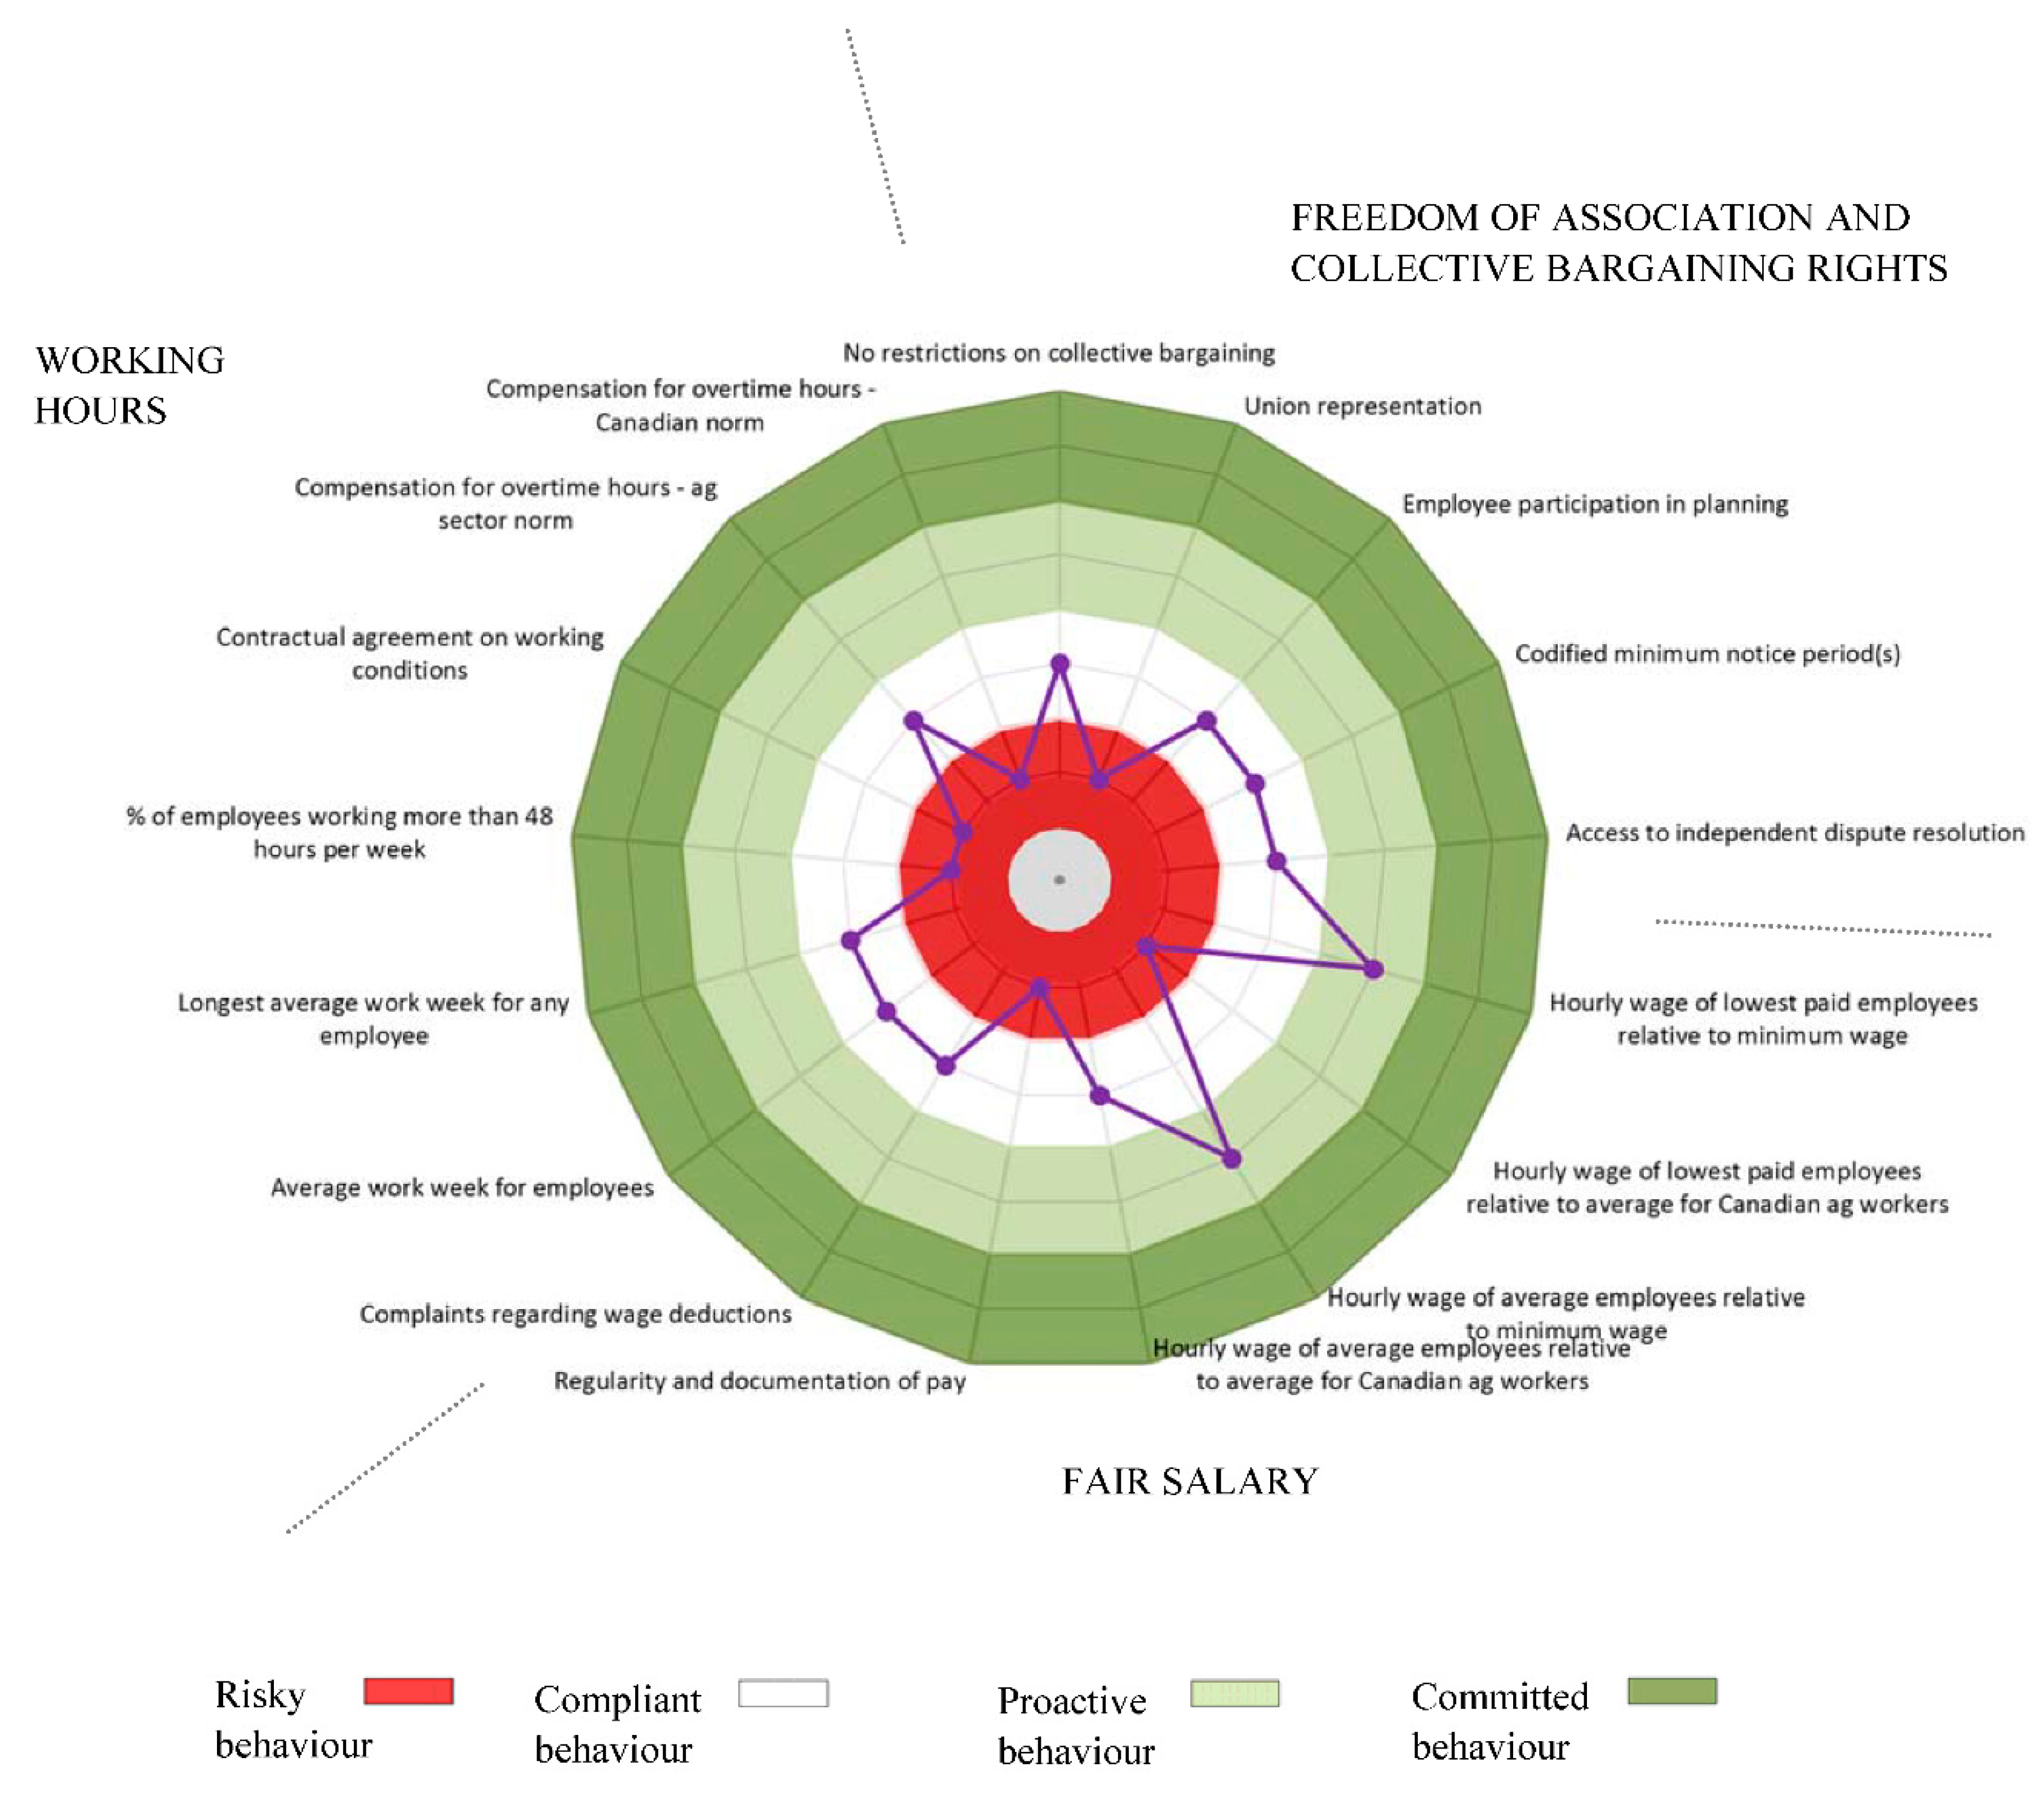
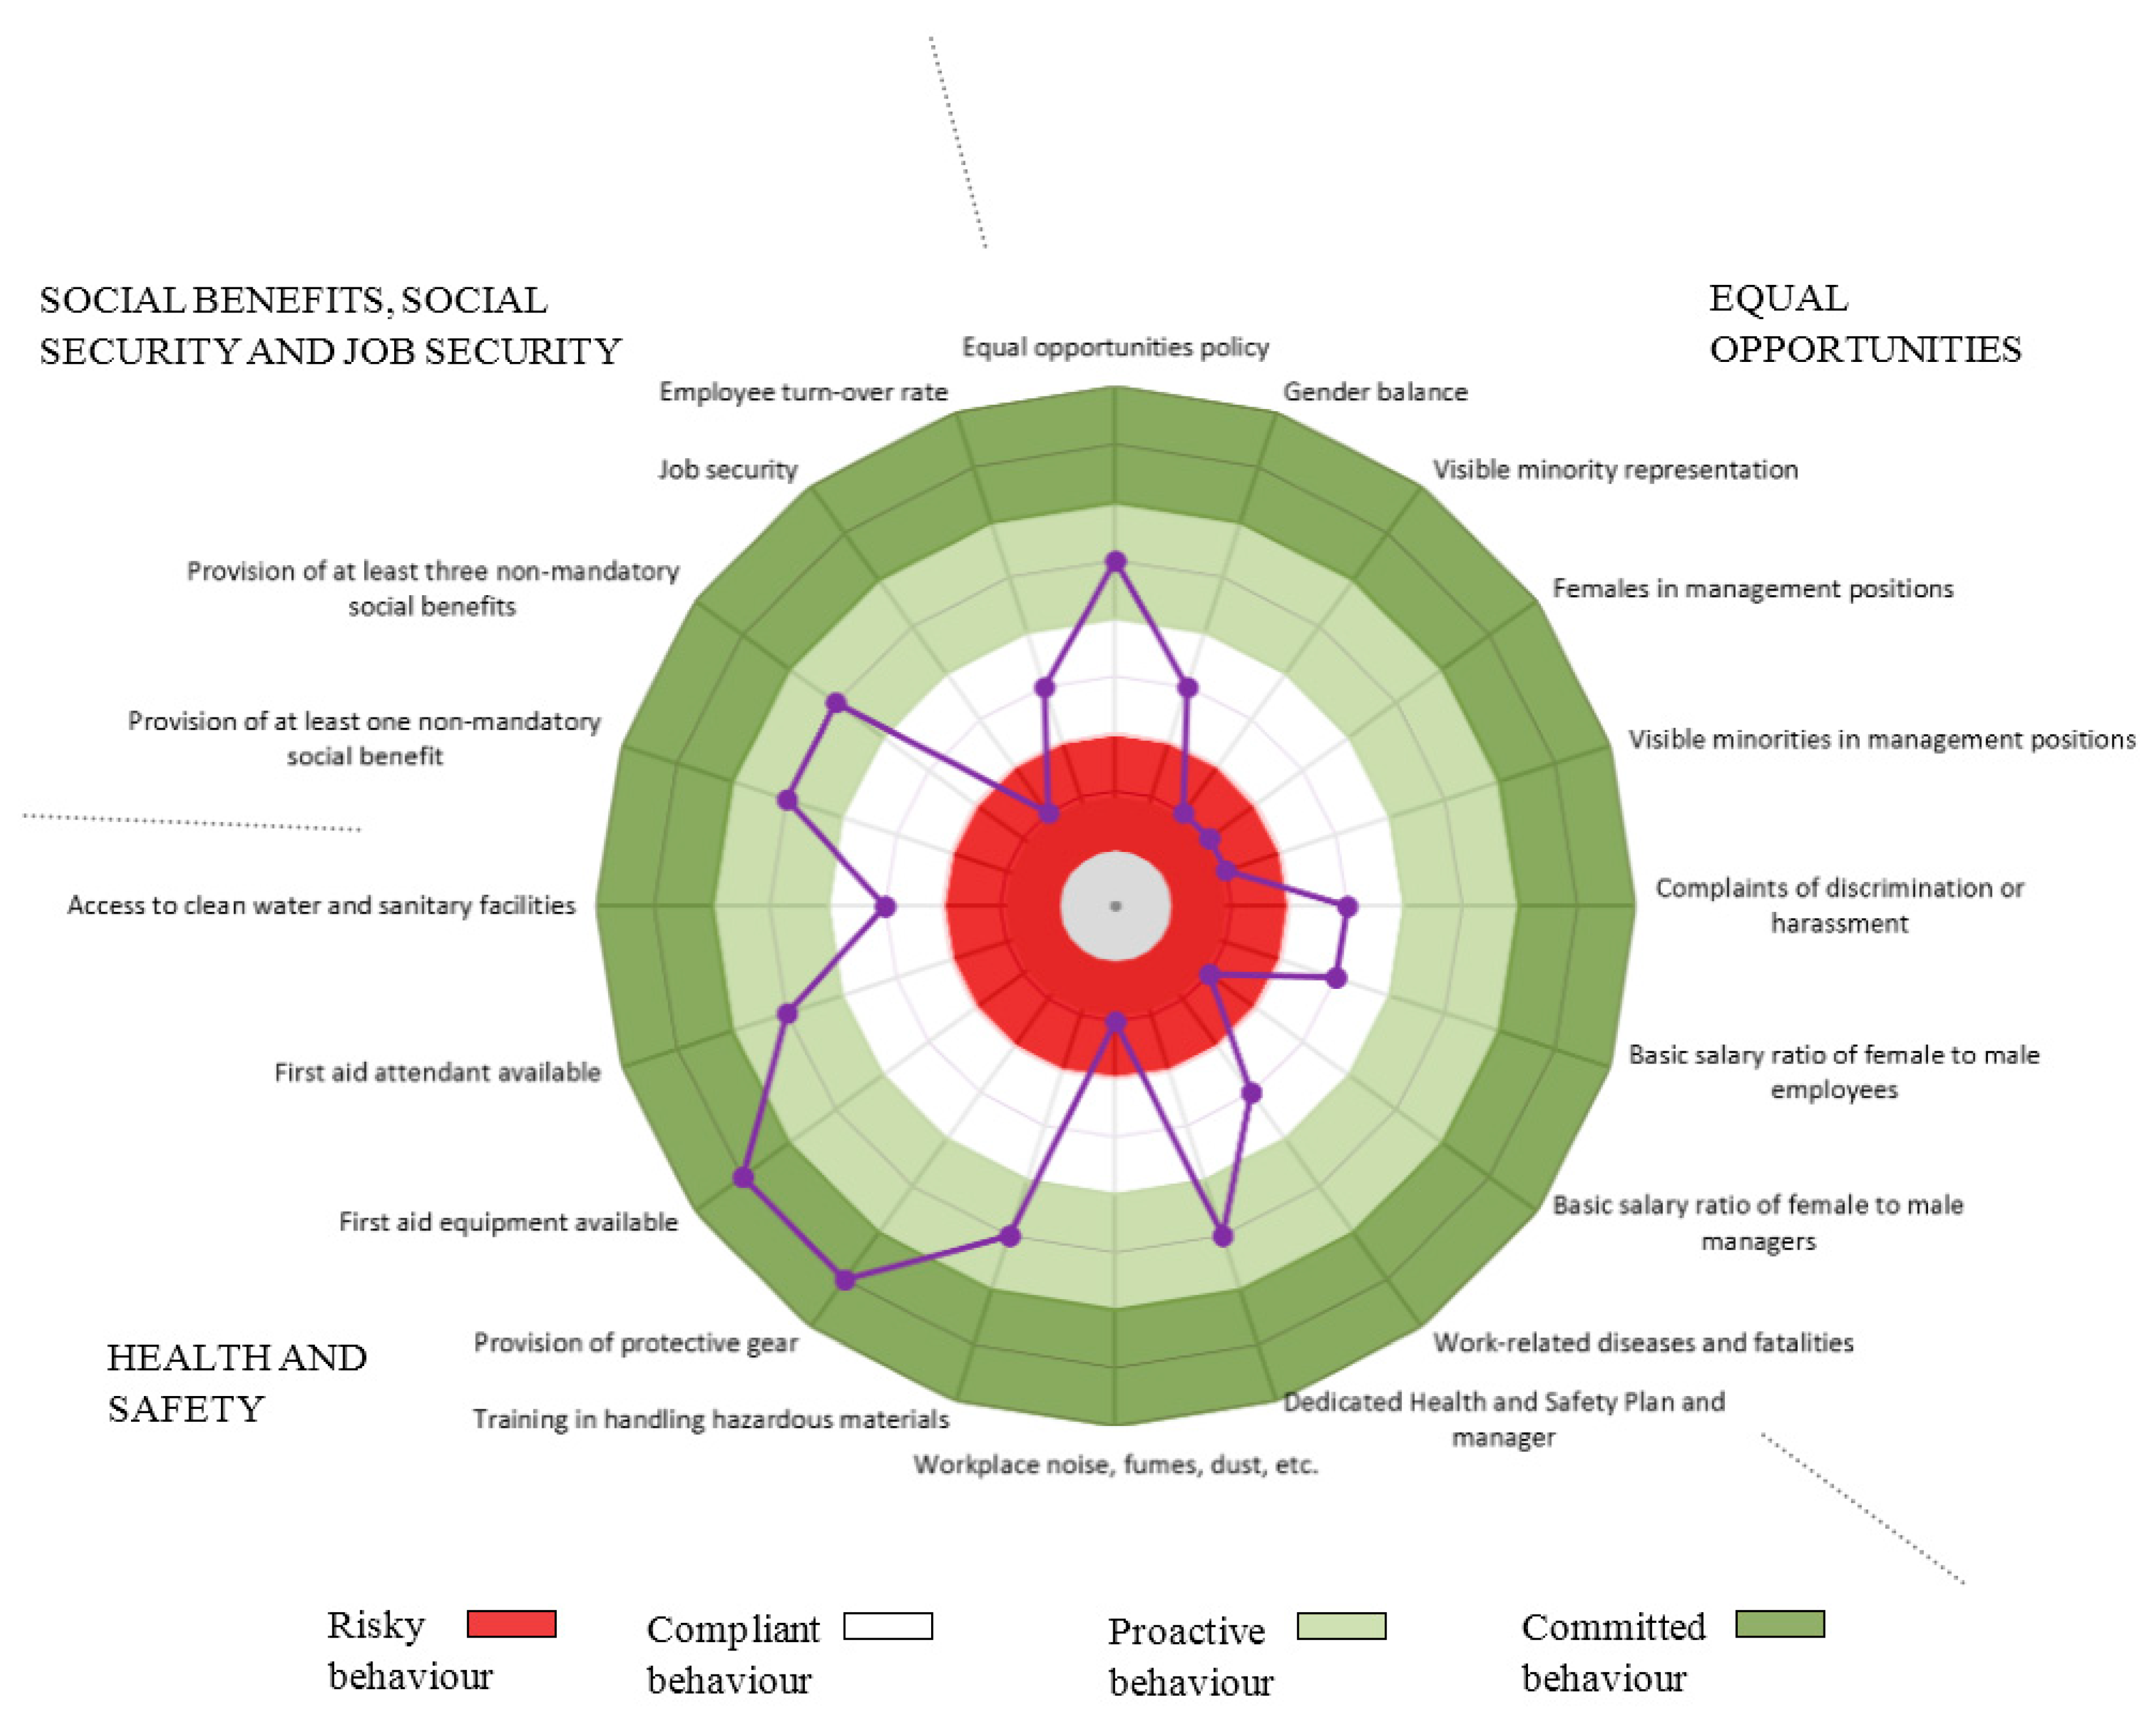
Figure 3 and Figure 4 provide a summary of LCIA results for the Workers stakeholder category.

Freedom of Association and Collective Bargaining Rights

No employers indicated that employment at their facilities is conditioned by any restrictions on the right of employees to collective bargaining (compliant). However, for only 28% of worker hours did respondents indicate that employees are free to join unions of their choice. Moreover, a 0% union representation rate was reported and it would also appear that participation of employees in organizational planning is not currently the industry norm. Only for 10% of worker hours was it indicated that employees have access to neutral, third-party dispute resolution. Based on the current Canadian average rate of union representation a risky behaviour is assessed. In light of current lack of norms but low levels of provision, compliant behaviours are assessed with respect to employee participation, codified minimum notice periods regarding operational changes, and employee access to neutral, binding, and independent dispute resolution procedures. The Canadian egg industry might, however, consider options for improving employee representation and participation (SI D Table S36).

Fair Salary

Minimum wage standards were exceeded across the Canadian egg facilities surveyed for both the lowest paid and average employee, hence, on this basis, a “proactive” score is assigned. The majority (77%) of workers receive at least 10% more than the minimum wage, 41% earn at least 50% more, and 26% earn at least 100% more than the minimum wage. Relative to norms for Canadian agricultural workers, wages for the lowest paid employees at some Canadian egg facilities might be considered risky in that they are below this average. Average employee wages are, however, similar to the average for Canadian agricultural workers and hence a compliant score is assessed for this indicator.
Another area for improvement is with respect to the regularity and documentation of pay. For only 57% of worker hours did respondents indicate that regular documentation of pay was provided. Here, a risky behaviour is assessed. There were no reported complaints regarding deductions on wages, hence a compliant behaviour is assessed for this indicator (SI D Table S37).

Working Hours

The weighted average work week for employees in Canadian egg facilities in 2012 was 38.83 h, which is slightly higher than the Canadian average but much lower than the ILO maximum of 48 h (compliant behaviour). This is, however, likely consistent with working hours elsewhere in the agricultural sector. The longest average work week is 47 h (compliant behaviour). Respondents also indicated, however, that more than 10% of working hours correspond to work weeks in excess of 48 h. Here, a risky behaviour is assessed. There is also a very low incidence of contractual agreements regarding working hours and overtime compensation (risky behavior).
Although some employers report paying their employees a 50% overtime premium, overall, the survey data indicate a low rate of overtime pay (5.8% on average) in Canadian egg facilities. This seemingly corresponds to the norm for the Canadian agriculture sector (compliant behaviour). However, if the norm for Canadian workers as a whole is taken as the reference point, then a risky behaviour is assessed (SI D Table S38).

Equal Opportunities

Based on reported data, employees on Canadian egg farms are largely Caucasian (97%) and male (63%), with an even age class distribution. Twenty-eight percent of respondents reported having a formal equal opportunities policy in place for their facilities (proactive behaviour). In many cases, lack of such a policy may simply reflect that the facilities are small family/owner operated facilities with no other employees. However, if equality of representation of males and females is taken as the performance reference point (compliant behaviour), or a proportionate degree of inclusion of visible minorities (risky behaviour), then there may, indeed, be space for improvement in this regard. This is similarly true for representation of females and visible minorities in management positions (risky behaviour).
Considering salary equality, it would appear that male and female employees receive equal remuneration (compliant behaviour). However, female managers apparently receive lower salaries (85%) relative to male managers (risky behaviour) (SI D Table S39).

Health and Safety

According to Employment and Social Development Canada (ESDC) [21], in Canada “one in every 68 employed workers in 2010 was injured or harmed on the job and received workers compensation as a result”. Although 2.7 works days were lost, on average, due to occupational accidents, injuries or illness in Canadian egg production facilities, only 0.14 WCB claims were filed per facility industry-wide, which is well below the Canadian average. No medically-diagnosed, work-related diseases or fatalities were reported (compliant behaviour).
Respondents indicated that 53% of worker hours occurred in workplaces characterized by high levels of noise, fumes, or dust (risky behaviour). While all employees are provided with appropriate protective gear when required to handle hazardous materials (committed), only half are reportedly trained in handling such materials (proactive).
Employees generally have access to clean water and sanitary facilities (compliant behavior) and, in most cases (82% of worker hours—committed behaviour) first aid equipment is maintained and available to employees. A trained, designated first aid attendant was available for 62% of the reported worker hours (proactive behaviour). A dedicated Health and Safety plan is in place for 45% of the worker hours (proactive behavior), and a dedicated Health and Safety manager for 31% of the worker hours (proactive behaviour).
Overall, it would appear that health and safety incidents were low in 2012, but that the Canadian egg industry would benefit from development and implementation of industry-wide standards with respect to health and safety plans, management, and training. The average surveyed Canadian egg facility invested $1762 in health and safety measures in 2012 (SI D Table S40).

Social Benefits, Social Security, and Job Security

It would appear that the provision of social benefits is not consistent within the Canadian egg industry. Health insurance benefits are provided to less than half of employees, dental and retirement benefits to roughly one third, and child care and/or maternity/paternity benefits to less than one employee in seven. Across these five categories, the average social benefit provision level is 30%. It should be noted here that some employers in Canadian egg facilities do offer full social benefits to their employees, while others offer none.
With respect to employment contracts, only 1/4 of worker hours were subject to formal employment contracts in 2012. Of these, roughly 2/3 were full time contracts, and 1/3 were part time contracts. The majority of reported worker hours were not subject to an employment contract. This indicates a low level of job security. Based on a reference level of a 100% formal contract rate, a risky behavior is assessed.
According to the Conference Board of Canada (CBC) [22], the voluntary employee turn-over rate in Canada in 2012–2013 was 7.3%, and the involuntary turn-over rate was 3.7%. Employee turn-over rates in Canadian egg facilities were comparatively low (4.1% overall). Half of employees who left jobs at Canadian egg facilities in 2012 quit, while one quarter were dismissed. Compared to the Canadian average, a compliant behaviour is assessed (SI D Table S41).

STAKEHOLDER: LOCAL COMMUNITY

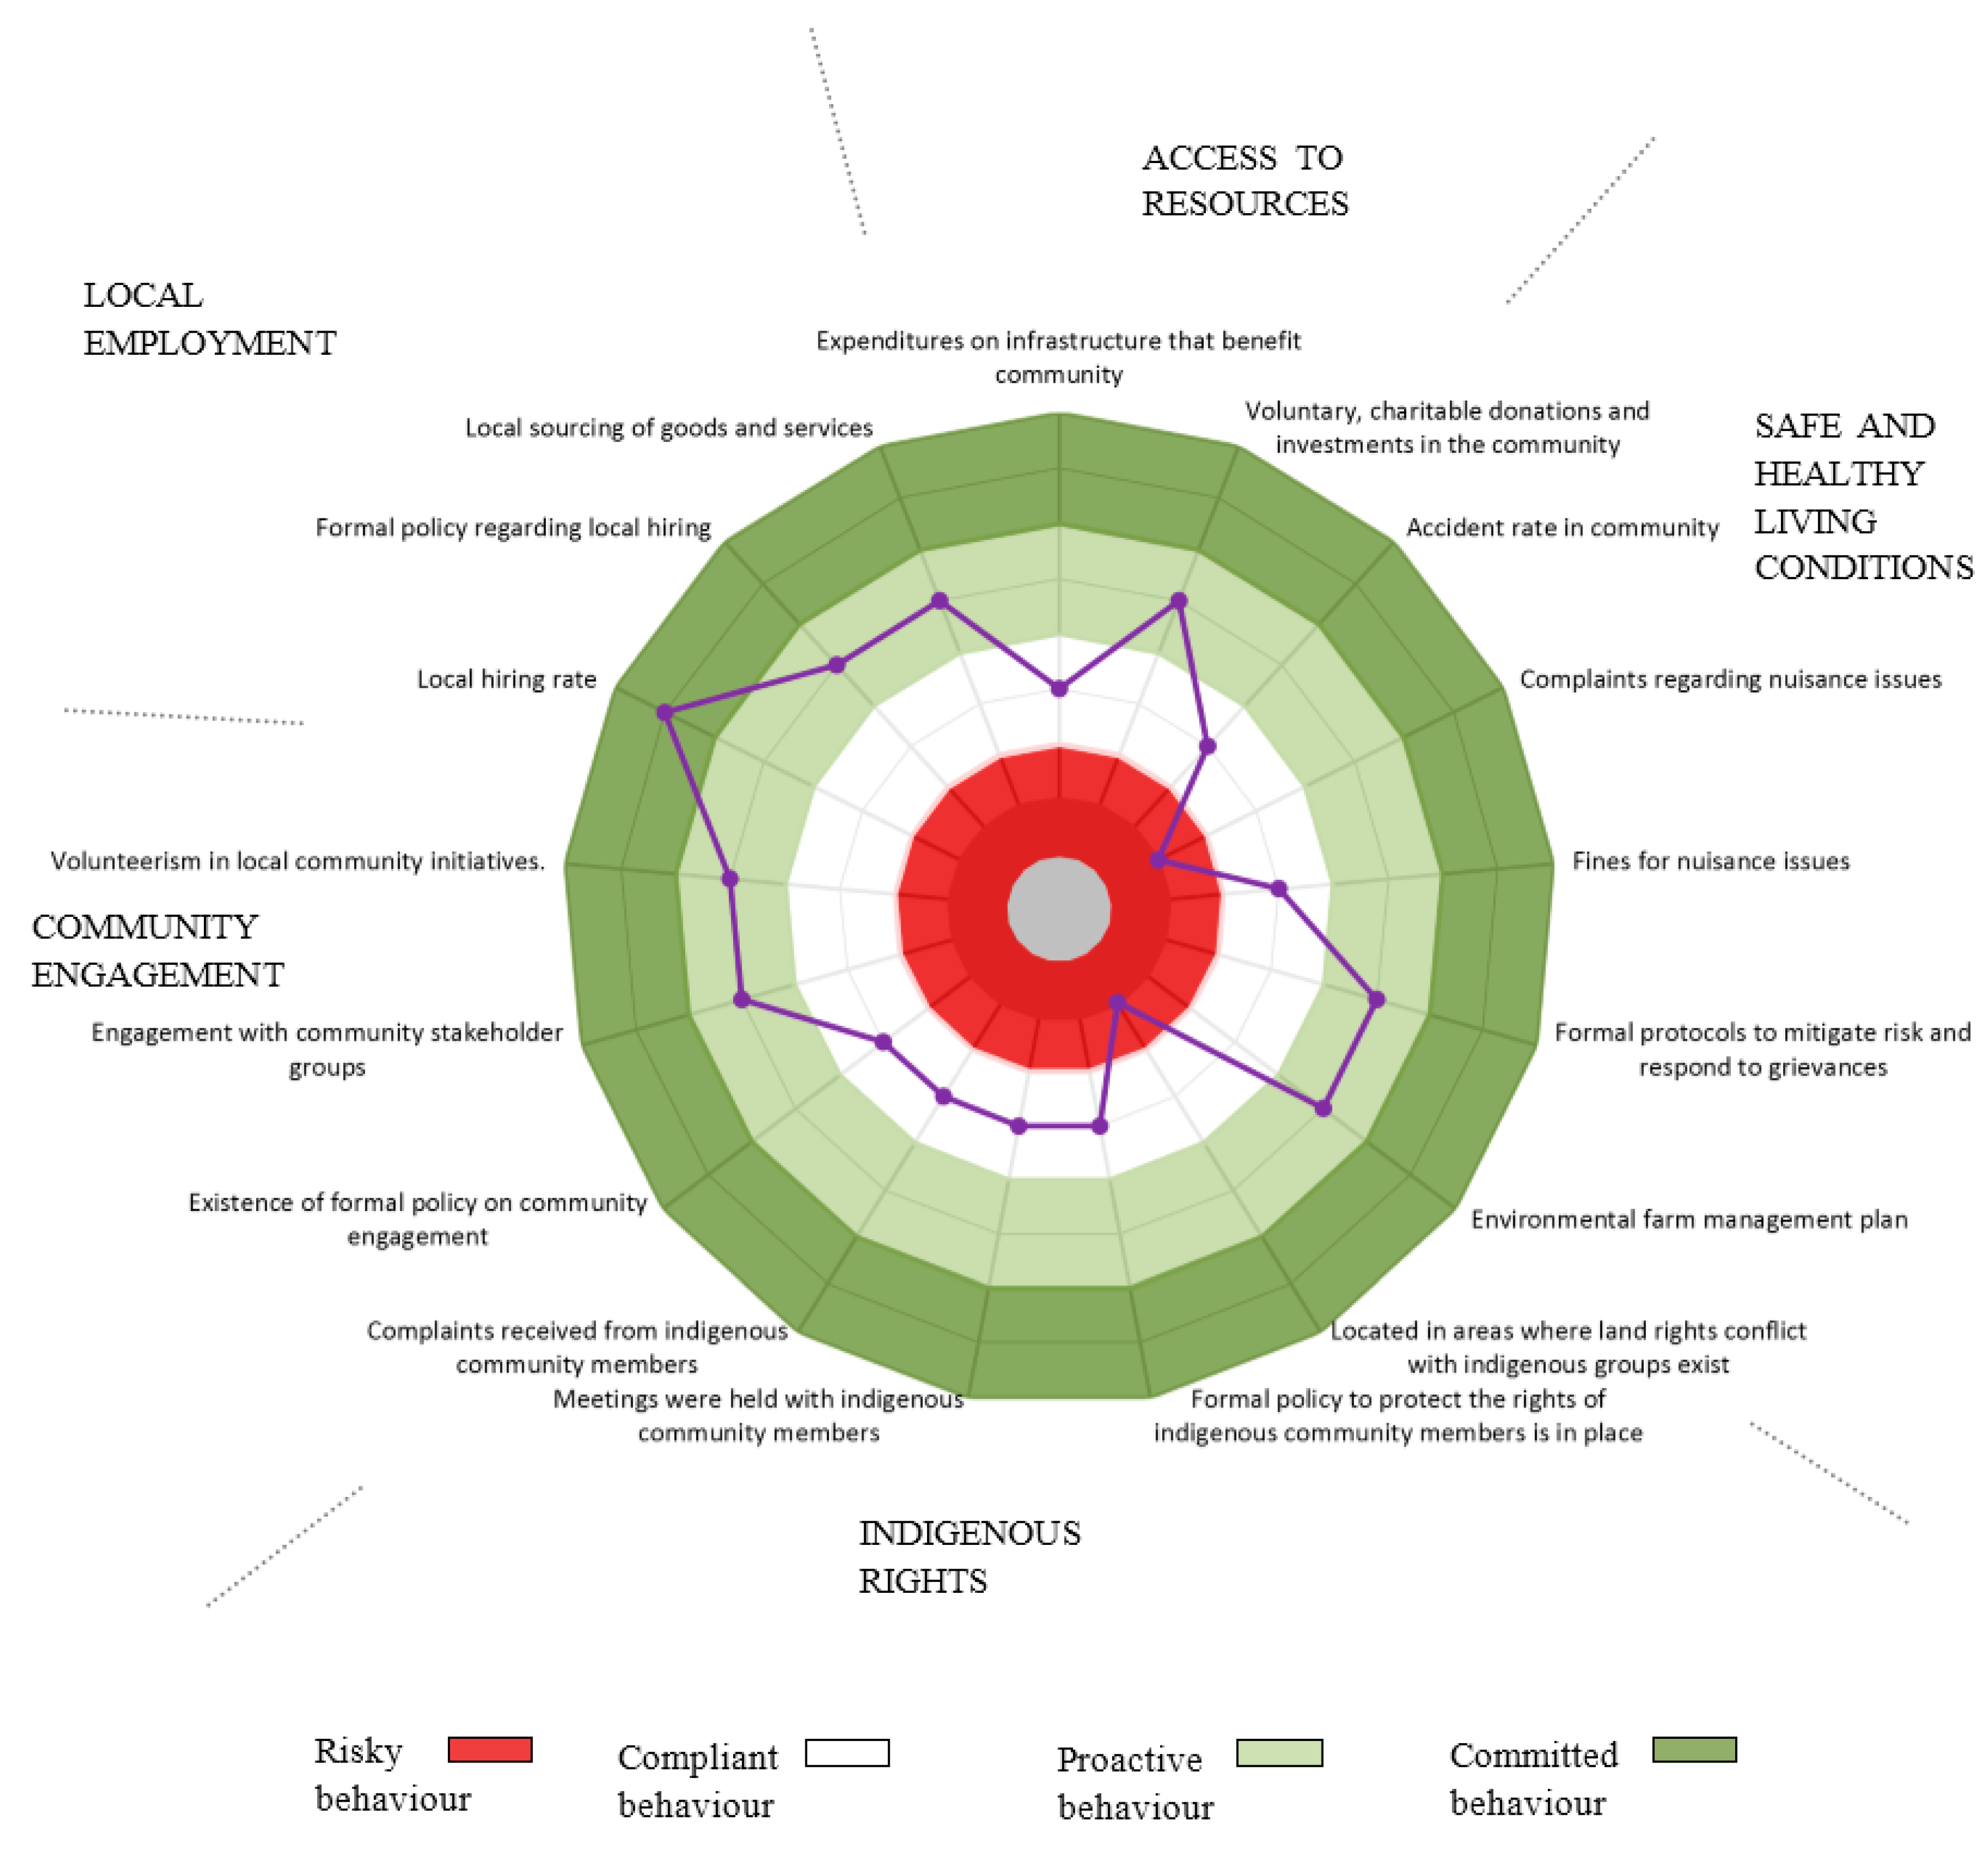
Figure 5 provides a summary of LCIA results for the Local Community stakeholder category.

Access to Resources

The total expenditures of egg facilities on infrastructure with mutual community access and benefit in 2012 were very low (compliant behaviour assessed). However, some survey respondents spent as much as $26,000 on voluntary, charitable donations and investments in their community, with an average of $2205 per facility (proactive behaviour assessed) (SI D Table S42).

Safe and Healthy Living Conditions

Only one accident in a local community was reported across surveyed facilities for 2012, hence the industry average accident rate is very low. This single accident is taken as an outlier, hence a compliant score is assigned. However, while many facilities did not receive any complaints from the local community regarding nuisance issues, some facilities received as many as two complaints. Overall, 0.4 complaints were received per facility in 2012. Relative to an ideal scenario performance reference point of 0 complaints, a risky behaviour is assessed.
In light of the complaint rate, it would seem prudent to having in place formal protocols to maintain living conditions, minimize risk, and respond to grievances in the community. Twenty-seven percent of facilities reported having formal protocols in place to maintain safe and healthy living conditions, while 32% have formal protocols to minimize risk and 17% have formal protocols to respond to grievances (proactive behavior). No fines for infringements at the local level were reported (compliant behavior).
One current approach to ensuring safe and healthy living conditions in local communities and minimizing risk is the implementation of an environmental farm management plan. Two thirds of worker hours occurred at facilities having an environmental farm management plan in 2012. Here, proactive behavior is assessed (SI D Table S43).

Respect for Indigenous Rights

While the survey data indicate that no complaints were received by Canadian egg facilities from First Nations community members in 2012, it is notable that no meetings were held with First Nations members. Also notable is that only 2% of worker hours were reported to occur in areas where land rights conflicts exist (risky behavior), which is unlikely to be accurate, and that only 2% of worker hours occurred in facilities having formal policies in place to protect the rights of indigenous community members. As no norms exist in this regard, compliant behaviors are assessed. It is nonetheless recommended that proactive behavior be encouraged in this domain (SI D Table S44).

Community Engagement

Only 7% percent of worker hours in 2012 occurred in egg facilities having formal policies on community engagement in place (compliant behavior). Reported attendance of meetings with stakeholder groups was variable, with some facilities reporting having attended as many as six meetings. On average, reporting facilities devoted 9 volunteer hours to community initiatives in 2012. Here, proactive behaviours are assessed (SI D Table S45).

Local Employment

Although less than 1/3 of Canadian egg facilities report having a formal policy regarding local hiring (proactive behavior), the local hiring rate was 87% in 2010 (committed behavior). Similarly, the majority share (64%) of goods and services purchased by egg facilities was locally sourced (proactive behavior) (SI D Table S46).

STAKEHOLDER: VALUE CHAIN PARTNERS

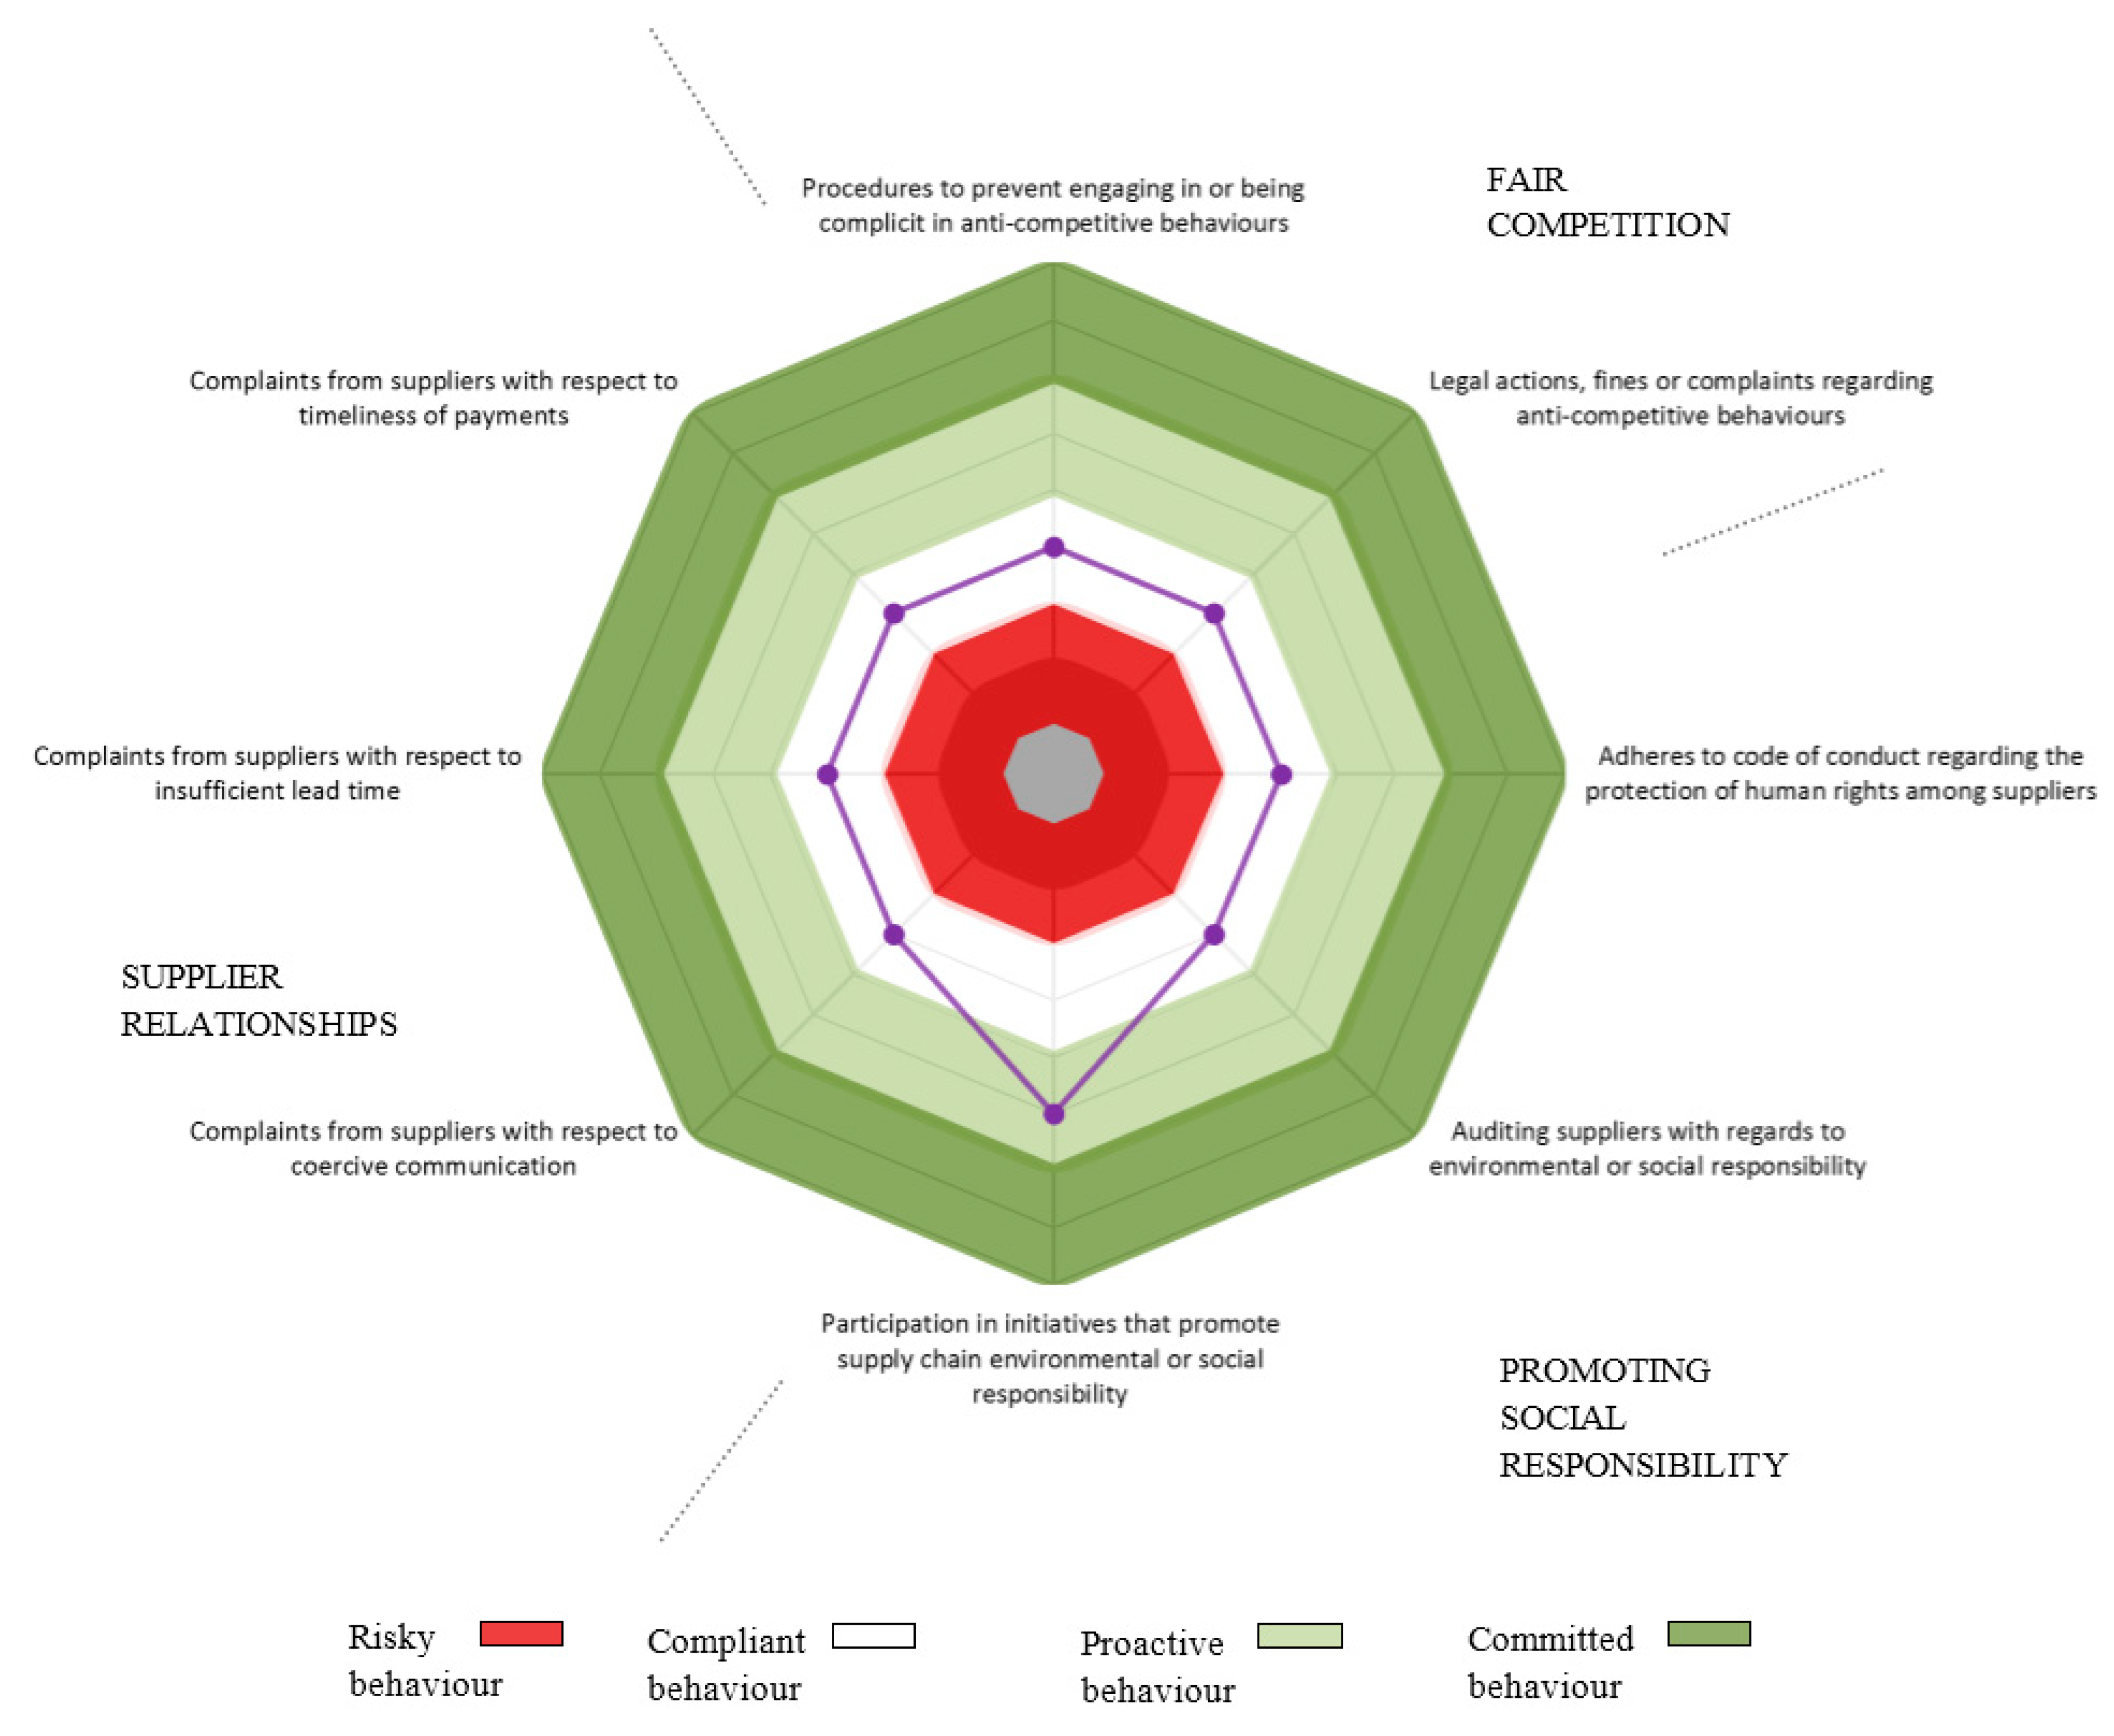
Figure 6 provides a summary of LCIA results for the Value Chain Partners stakeholder category.

Fair Competition

Although no facilities reported having documentation of procedures to prevent engaging in or being complicit in anti-competitive behaviours (compliant), no legal actions, fines or complaints were reported for 2012 (compliant) (SI D Table S47).

Promoting Social Responsibility

Three percent of worker hours occurred in facilities that report adhering to a specific code of conduct regarding the protection of human rights (compliant behavior). No supplier audits for environmental or social responsibility were reported (compliant behavior). Canadian egg facilities surveyed for this study participated in a weighted average of 0.16 initiatives to promote value chain environmental or social responsibility, with a range from 0 to 5 initiatives per facility (proactive behavior). In light of this low activity level, it would seem that there is opportunity here for initiatives to enhance the promotion of social responsibility in the Canadian egg industry (SI D Table S48).

Supplier Relationships

Overall, it appears that Canadian egg facilities maintain good relationships with their value chain partners. No complaints were received from suppliers with respect to coercive communications or insufficient lead time in 2012, and a weighted average of 0.01 complaints were received (representing one facility with two complaints, which is taken as an outlier) with respect to timeliness of payments. On the basis of this very low level, a compliant behavior is assessed for the industry as a whole (SI D Table S49).

STAKEHOLDER: SOCIETY

Figure 7 provides a summary of LCIA results for the Society stakeholder category.

Public Commitment to Sustainability

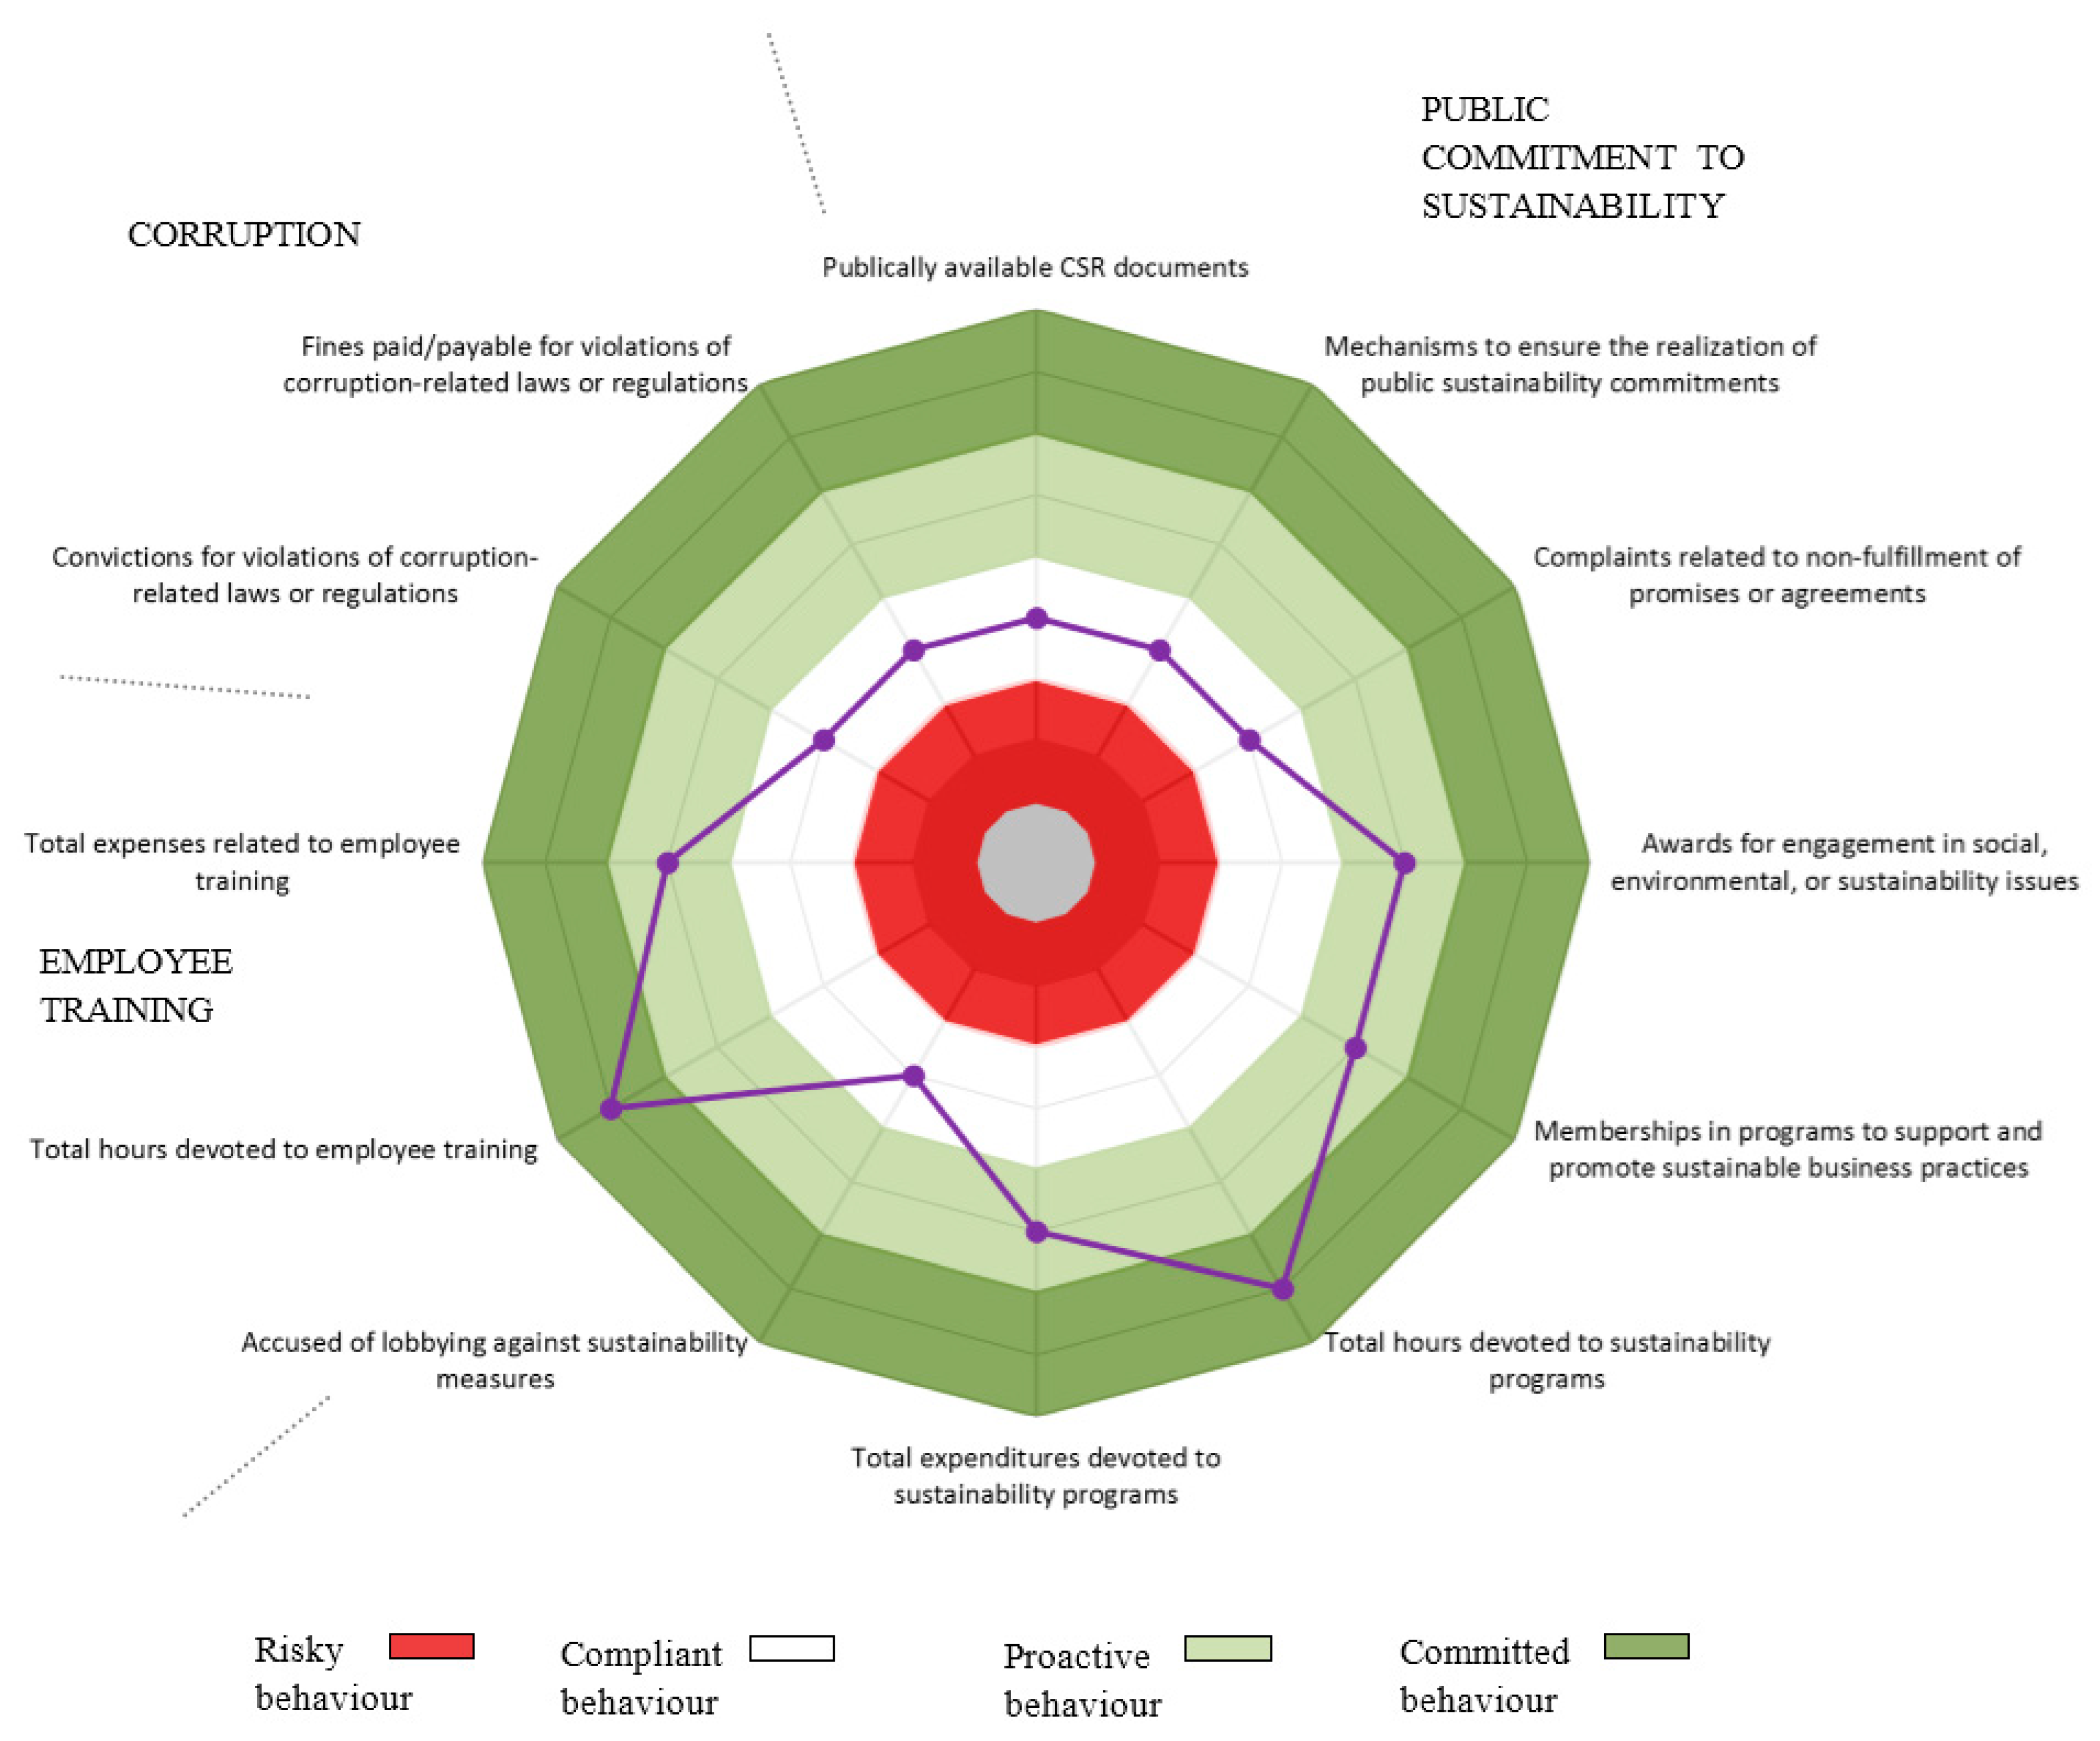
Among those surveyed, only 8% of worker hours occurred in facilities having publicly available CSR or other documents that communicate commitments to sustainability issues (compliant behaviour). For 1%, specific mechanisms are in place to ensure the realization of such commitments (compliant behaviour). On this basis, it would appear that documentation and communication of sustainability commitments is not currently widespread in the Canadian egg industry.
Outside of formal commitments and communications, however, some egg facilities are, indeed, engaging in sustainability initiatives. Facilities report an average of over 10 h devoted to sustainability programs in 2012 (committed behavior). Some facilities were active members in programs to support sustainable business practices (proactive behavior), and others received awards for engagement in sustainability issues (proactive behavior). The average expenditure on sustainability programs was $803 (proactive behavior). No complaints were reported with respect to non-fulfillment of sustainability commitments or activities to undermine sustainability measures (compliant behaviour).
In sum, it would appear that monitoring and communicating with respect to sustainability issues is not currently the norm in the Canadian egg industry, but that some facilities are already actively engaged in this domain. A significant opportunity may hence exist to enhance the social license of Canadian egg facilities through implementation and documentation of formalized sustainability commitments (SI D Table S50).

Contribution to Economic Development

The scale of these contributions varies widely between egg facilities, reflecting the commensurately broad range in size of operations. For example, total revenue ranges from $260,000 to $9,464,000, with an industry average of $2,508,000 among reporting facilities. On average, participating Canadian egg facilities paid $248,000 of wages in 2012, along with $78,000 in taxes and reported an average of $1,758,000 in total expenses (SI D Table S51).

Employee Training

Significant resources were dedicated to employee training in Canadian egg facilities in 2012. On average, workers were provided with 53 h of training in 2012 (committed behaviour), and total expenses related to employee training averaged $529 per facility (proactive behaviour) (SI D Table S52).

Corruption

Two convictions for violations of corruption-related laws or regulations were reported by a single facility, with an accompanying fine of $500. This single facility report is therefore taken as an outlier, as it would appear that such violations are not commonplace within the Canadian egg industry (hence compliant scores are assigned) (SI D Table S53).

4. Discussion

The results of this assessment provide a rich and highly nuanced characterization of the potential social risks and benefits attributable to contemporary egg production facilities in Canada. They provide a series of first benchmarks for the Canadian egg industry. They also highlight where and to what extent stakeholders are currently benefiting from positive social contributions made by the industry—for example, through local job creation, high levels of employee training, provision of protective gear and first aid equipment for employees, and time devoted to sustainability programs (areas where facilities demonstrated “committed” behaviors). These contributions go beyond what is otherwise required by law. The results also point towards areas of potential social risk for some stakeholders (such as the low incidence of formal employment contracts and union representation for workers, low levels of overtime compensation, or sub-optimal workplace diversity and equality). As such, the results suggest opportunities and strategies for the Canadian egg industry both to capitalize on its current successes as well as to proactively engage in improving its social sustainability profile.
For the “Workers” stakeholder category, the directly collected data confirmed the very low level of representation and collective bargaining for employees of egg facilities. The representation rate of 0% was much lower than the Canadian average of 31%, but likely in-line with current norms for the Canadian agricultural sector. Similarly, employee salaries appear to be consistent with Canadian agricultural worker norms, but lower than those of the average Canadian. Most employees are, in fact, remunerated at levels significantly higher than the minimum wage, but a small fraction of employees receive full- or part-time minimum wage salaries. Province-by-province assessments of employee wages relative to regional living wage estimates are recommended in order to ensure that the lowest paid employees are not at risk. Compensation for overtime pay should also be monitored, and industry-wide norms developed. On average, worker hours are within acceptable norms although a small fraction of employees work in access of 48 hours per week. Overall, improvements with respect to formal, contractual agreements for employees regarding working conditions are recommended.
With respect to equal opportunities in the Canadian egg facility workplace, the majority of employees are currently Caucasian males. Visible minorities have a very low level of representation in this workforce. For general employees, salaries are equitable for males and females. However, the data collected for 2012 suggest a disparity in pay for female compared to male managers of roughly 15%. Additional research and possible mitigation strategies may be desirable to increase diversity and ensure equality for employees.
Health and safety conditions for workers in Canadian egg facilities appear to be very good. Although facilities are often characterized by high levels of dust and/or noise, employers report high levels of worker training, use of protective gear, and access to first aid equipment and sanitary facilities. Many facilities report the use of dedicated health and safety plans, as well as designated first aid attendants. No medically-diagnosed, workplace-related diseases or fatalities were reported for 2012.
Provision of social benefits to workers varies widely between egg facilities. Many facilities report providing at least one non-mandatory social benefit and some more than three. Others provide no additional benefits to employees. This suggests opportunities for the development of norms within the Canadian egg industry to promote consistent provision of non-mandatory social benefits in order to improve conditions for employees. Improving job security through the implementation of formal employment contracts is also recommended, as current usage of contractual agreements is low.
For the stakeholder group “Local Community,” it would appear that Canadian egg facilities are often proactively engaged in making meaningful contributions to the communities in which they operate. Egg facilities largely employ local community members, and source a large fraction of inputs from local businesses. Most facilities reported some level of voluntary, charitable donations or investments in their communities, with an average of $2205 spent on local community initiatives per facility in 2012. Participation in community initiatives is also high. In addition, many facilities report implementation of an Environmental Farm Management Plan, which serves to reduce risk of nuisance issues, as well as the existence of formal protocols to mitigate risk for local communities and respond to grievances. The overall accident rate in local communities as a result of egg facility activities was very low. One area of potential social risk relates to interactions with indigenous communities. Although many egg facilities are situated in communities proximate to First Nations communities, only 2% reported operating in areas where land rights conflicts exist, and reported levels of proactive engagement with First Nations communities were low. Formalizing “good neighbour” policies and outreach may be desirable. This could potentially be paired with initiatives to increase workplace diversity.
Management decisions and activities similarly impact on society at large, and may result in either societal risks or benefits. Demonstrating commitment to and actions consistent with contributing positively to society is fundamental to the concept of corporate social responsibility (CSR). CSR reporting, including transparent mechanisms for measuring, monitoring, goal setting and follow-up, is increasingly important to maintaining social license, as well as accessing emerging market opportunities associated with sustainability objectives.
Many Canadian egg facilities are already taking steps to improve and promote the sustainability of their practices. Facilities reported an average of 10 h devoted to sustainability initiatives in 2012, and related expenses of roughly $800 per facility. Development and reporting of formal CSR documents is, however, relatively uncommon. An industry-wide initiative to support operators in developing and implementing CSR strategies is strongly encouraged. Indeed, in light of increased attention by both commodity groups and large retailers to developing and implementing sustainability measurement, reporting and certification requirements, it is strongly recommended that the Canadian egg industry become proactive in this respect. This will require the support and cooperation of both producers and their representative bodies in order to develop and implement industry-wide strategies and initiatives.
Social life cycle assessment is a relatively new field of research, and methodological development is on-going. To date, very few social LCA studies of food products have been reported (for example, see [11,13,14,19,23,24]). Varied approaches have often been employed [11,12] and, given the diversity of agri-food production contexts, the feasibility and desirability of consistency between studies is debatable.
The current analysis represents only a partial (i.e., gate-to-gate) evaluation of the potential social risks and benefits attributable to the Canadian egg industry. Future work should expand the analysis to encompass value chain stages and stakeholder interactions both upstream and downstream of Canadian egg facilities. While considerable efforts were invested to ensure appropriate representation across regions of production (provinces) and farm size, the sample nonetheless represents a relatively small subset of egg production facilities in Canada. In this respect, “scaling up” results is challenging, and collecting larger data samples wherever feasible in such analyses is clearly desirable. The survey questions (and related indicators that can be assessed) should also be periodically revisited so as to ensure that all relevant social sustainability issues are taken into consideration—in particular given that conditions may change over time, and the suite of social sustainability issues deemed appropriate for inclusion in such analyses will likely continue to evolve. Moreover, while the impact assessment methods that were developed here provide a valuable example of how social risks and benefits might be assessed in egg production or for other food production activities, it is important to note that defining performance reference points for social life cycle impact assessment where clear norms do not exist is challenging and inevitably somewhat arbitrary. This is similarly true with respect to identifying appropriate thresholds for distinguishing between levels of “sustainability performance” for each indicator considered, even where norms do exist. Multiple, competing bases are possible. For this reason, it is essential that methods and data are transparently presented so as to enable identification of potential real or perceived bias. Moreover, it may be preferable to present results at the indicator level (as in the current study) rather than aggregating results across indicators, since such aggregation requires weighting (introducing an additional level of uncertainty and potential bias) and may also bias interpretation if numerous “easy to achieve” norms outweigh a limited number of more important social sustainability performance indicators.
Clearly, a desirable next step, in the extension of this methods development and analysis exercise, is for the Canadian egg industry to engage in a multi-stakeholder dialogue in order to define mutually agreed upon, clear thresholds for performance levels as well as goals for social sustainability performance in this industry [13]. The novel set of social sustainability metrics developed here can therefore provide a useful starting point for continued development and application in the Canadian egg sector and may be usefully adapted for application in other agri-food sectors in Canada and beyond.

Supplementary Materials

The following are available online at https://www.mdpi.com/2071-1050/10/5/1601/s1, SI A—Social Life Cycle Inventory Survey, SI B—Social Life Cycle Impact Assessment Indicators and Performance Reference Points, SI C—Detailed Social Life Cycle Inventory Results, and SI D—Detailed Social Life Cycle Impact Assessment Results.

Funding

This research was funded by Egg Farmers of Canada. Publication was supported through the NSERC/Egg Farmers of Canada Industrial Research Chair in Sustainability.

Conflicts of Interest

The author declares no conflict of interest. The funding sponsors had no role in the design of the study; in the collection, analyses, or interpretation of data; in the writing of the manuscript, and in the decision to publish the results.

References

  1. Pelletier, N.; Sala, S.; Ostaglu, E.; Rosenbaum, E.; Vasta, A.; Benoit-Norris, C.; Norris, G. Social sustainability in trade and development policy. Int. J. Life Cycle Assess. 2018, 23, 629–639. [Google Scholar] [CrossRef]
  2. Jorgensen, A.; Le Bocq, A.; Nazarkina, L.; Hauschild, M. Methodologies for social life cycle assessment. Int. J. Life Cycle Assess. 2008, 13, 96–103. [Google Scholar] [CrossRef]
  3. Jorgensen, A.; Lai, L.; Hauschild, M. Assessing the validity of impact pathways for child labour and wellbeing in social life cycle assessment. Int. J. Life Cycle Assess. 2010, 15, 5–16. [Google Scholar] [CrossRef]
  4. Jorgensen, A. Social LCA—A way ahead? Int. J. Life Cycle Assess. 2013, 18, 296–299. [Google Scholar] [CrossRef] [Green Version]
  5. Zamagni, A.; Feschet, P.; De Luca, A.; Iofrida, N.; Buttol, P. Social Life Cycle Assessment: Methodologies and Practice. In Sustainability Assessment of Renewables-Based Products: Methods and Case Studies; Dewulf, J., De Meester, S., Rodrigo, A., Eds.; Wiley: New York, NY, USA, 2015; Available online: http://ca.wiley.com/WileyCDA/WileyTitle/productCd-111893394X.html# (accessed on 5 January 2017).
  6. UNEP/SETAC. Guidelines for Social Life Cycle Assessment of Products. In The UNEP/SETAC Life Cycle Initiative; UNEP/SETAC: Paris, France, 2009. [Google Scholar]
  7. Benoit-Norris, C.; Norris, G.; Valdivia, S.; Ciroth, A.; Moberg, A.; Bos, U.; Prakash, S.; Ugaya, C.; Beck, T. The guidelines for social life cycle assessment of products: Just in time! Int. J. Life Cycle Assess. 2010, 15, 156–163. [Google Scholar] [CrossRef]
  8. Do Carmo, B.; Margni, M.; Baptiste, P. Addressing uncertain scoring and weighting factors in social life cycle assessment. Int. J. Life Cycle Assess. 2017, 22, 1609–1617. [Google Scholar] [CrossRef]
  9. Wu, R.; Yang, D.; Chen, J. Social life cycle assessment revisited. Sustainability 2014, 6, 4200–4226. [Google Scholar] [CrossRef]
  10. Iofrida, N.; De Luca, A.; Strano, A.; Gulisano, G. Can social research paradigms justify the diversity of approaches to social life cycle assessment? Int. J. Life Cycle Assess. 2018, 23, 464–480. [Google Scholar] [CrossRef]
  11. Paragahawewa, U.; Blackett, P.; Small, B. Social Life Cycle Analysis (S-LCA): Some Methodological Issues and Potential Application to Cheese Production in New Zealand; AgResearch Ltd.: Palmerston North, New Zealand, 2009. [Google Scholar]
  12. Smith, J.; Barling, D. Social impact and life cycle assessment: Proposals for methodological development for SMEs in the European food and drink sector. Int. J. Life Cycle Assess. 2014, 19, 944–949. [Google Scholar] [CrossRef]
  13. De Luca, A.; Iofrida, N.; Strano, A.; Falcone, G. Social life cycle assessment and participatory approaches: A methodological proposal applied to citrus farming in Southern Italy. Integr. Environ. Assess. 2015, 11, 383–396. [Google Scholar] [CrossRef] [PubMed]
  14. Chen, W.; Holden, N. Social life cycle assessment of average Irish dairy farm. Int. J. Life Cycle Assess. 2017, 22, 1459–1472. [Google Scholar] [CrossRef]
  15. Petti, L.; Ramirex, P.; Traverso, M.; Ugaya, C. An Italian tomato “Cuore di Bue” case study: Challenges and benefits of using subcategory assessment method for social life cycle assessment. Int. J. Life Cycle Assess. 2018, 23, 569–580. [Google Scholar] [CrossRef]
  16. Benoît-Norris, C.; Vickery-Niederman, G.; Valdivia, S.; Franze, J.; Traverso, M.; Ciroth, A.; Mazijn, B. Introducing the UNEP/SETAC methodological sheets for subcategories of social LCA. Int. J. Life Cycle Assess. 2011, 16, 682–690. [Google Scholar] [CrossRef]
  17. Spillemaecker, S.; Vanhoutte, G.; Traverniers, L.; Lavrysen, L.; van Braeckel, D.; Mazijin, B.; Rivera, J. Integrated Product Assessment: The Development of the Label ‘Sustainable Development’ For Products, Ecological, Social, and Economical Aspects of Integrated Product Policy; Belgian Science Policy: Brussels, Belgium, 2004. [Google Scholar]
  18. Dreyer, L.; Hauschild, M.; Schierbeck, J. Characterisation of social impacts in LCA. Int. J. Life Cycle Assess. 2010, 15, 247–259. [Google Scholar] [CrossRef]
  19. Reveret, J.P.; Couture, J.M.; Parent, P. Socio-economic LCA of milk production in Canada. In Social Life Cycle Assessment; Muthu, S., Ed.; Springer Science + Business Media: Singapore, 2015. [Google Scholar] [CrossRef]
  20. AAFC. Canada’s Poultry and Egg Industry Profile at a Glance; Agriculture and Agri-Food Canada: Ottawa, ON, Canada, 2013.
  21. ESDC. Work—Work-Related Injuries. Indicators of Well-Being in Canada; Employment and Social Development Canada: Toronto, Canada, 2015. Available online: http://www4.hrsdc.gc.ca/[email protected]?iid=20 (accessed on 10 June 2016).
  22. CBC. What Are the Overall Voluntary and Involuntary Turnover Rates for Canadian Organizations? HR Questions and Answers; Conference Board of Canada: Ottawa, ON, Canada, 2015; Available online: http://www.conferenceboard.ca/topics/humanresource/questions.aspx#Q1 (accessed on 10 June 2016).
  23. Kruse, S.; Flysjo, A.; Kasperczyk, N.; Scholz, A. Socioeconomic indicators as a complement to life cycle assessment—An application to salmon production systems. Int. J. Life Cycle Assess. 2009, 14, 8–18. [Google Scholar] [CrossRef]
  24. Manik, Y.; Leahy, J.; Halog, A. Social life cycle assessment of palm oil biodiesel: A case study in Jambi Province of Indonesia. Int. J. Life Cycle Assess. 2013, 18, 1386–1392. [Google Scholar] [CrossRef]
Figure 1. Colour codes employed to characterize performance levels relative to performance reference points.
Sustainability 10 01601 g001
Figure 2. Schematic representation of the relationships between performance reference points/thresholds for each stakeholder group/social theme/sub-category indicator combination utilized in the social life cycle impact assessment.
Sustainability 10 01601 g002
Figure 3. Social life cycle impact assessment scores for Canadian egg facilities in 2012 with respect to the stakeholder group “Employees” (freedom of association and collective bargaining rights, fair salary, working hours).
Sustainability 10 01601 g003
Figure 4. Social life cycle impact assessment scores for Canadian egg facilities in 2012 with respect to the stakeholder group “Employees” (equal opportunities, health and safety, social benefits, social security and job security).
Sustainability 10 01601 g004
Figure 5. Social life cycle impact assessment scores for Canadian egg facilities in 2012 with respect to the stakeholder group “Local Community”.
Sustainability 10 01601 g005
Figure 6. Social life cycle impact assessment scores for Canadian egg facilities in 2012 with respect to the stakeholder group “value chain partners”.
Sustainability 10 01601 g006
Figure 7. Social life cycle impact assessment scores for Canadian egg facilities in 2012 with respect to the stakeholder group “Society”.
Sustainability 10 01601 g007
Table 1. Stakeholder groups, social themes considered in the social life cycle assessment of Canadian egg facilities.
STAKEHOLDER: WORKERS
Freedom of association and collective bargaining rights
Fair salary
Working hours
Equal opportunities
Health and safety
Social benefits, social security, and job security
STAKEHOLDER: LOCAL COMMUNITY
Access to resources
Safe and healthy living conditions
Respect for indigenous rights
Community engagement
Local employment
STAKEHOLDER: SOCIETY
Public commitment to sustainability issues
Contribution to economic development
Employee training
Corruption
STAKEHOLDER: VALUE CHAIN PARTNERS
Fair competition
Promoting social responsibility
Supplier relationships