Consumers’ Willingness to Pay for Net-Zero Energy Apartment in South Korea


Abstract
1. Introduction
2. Methodology
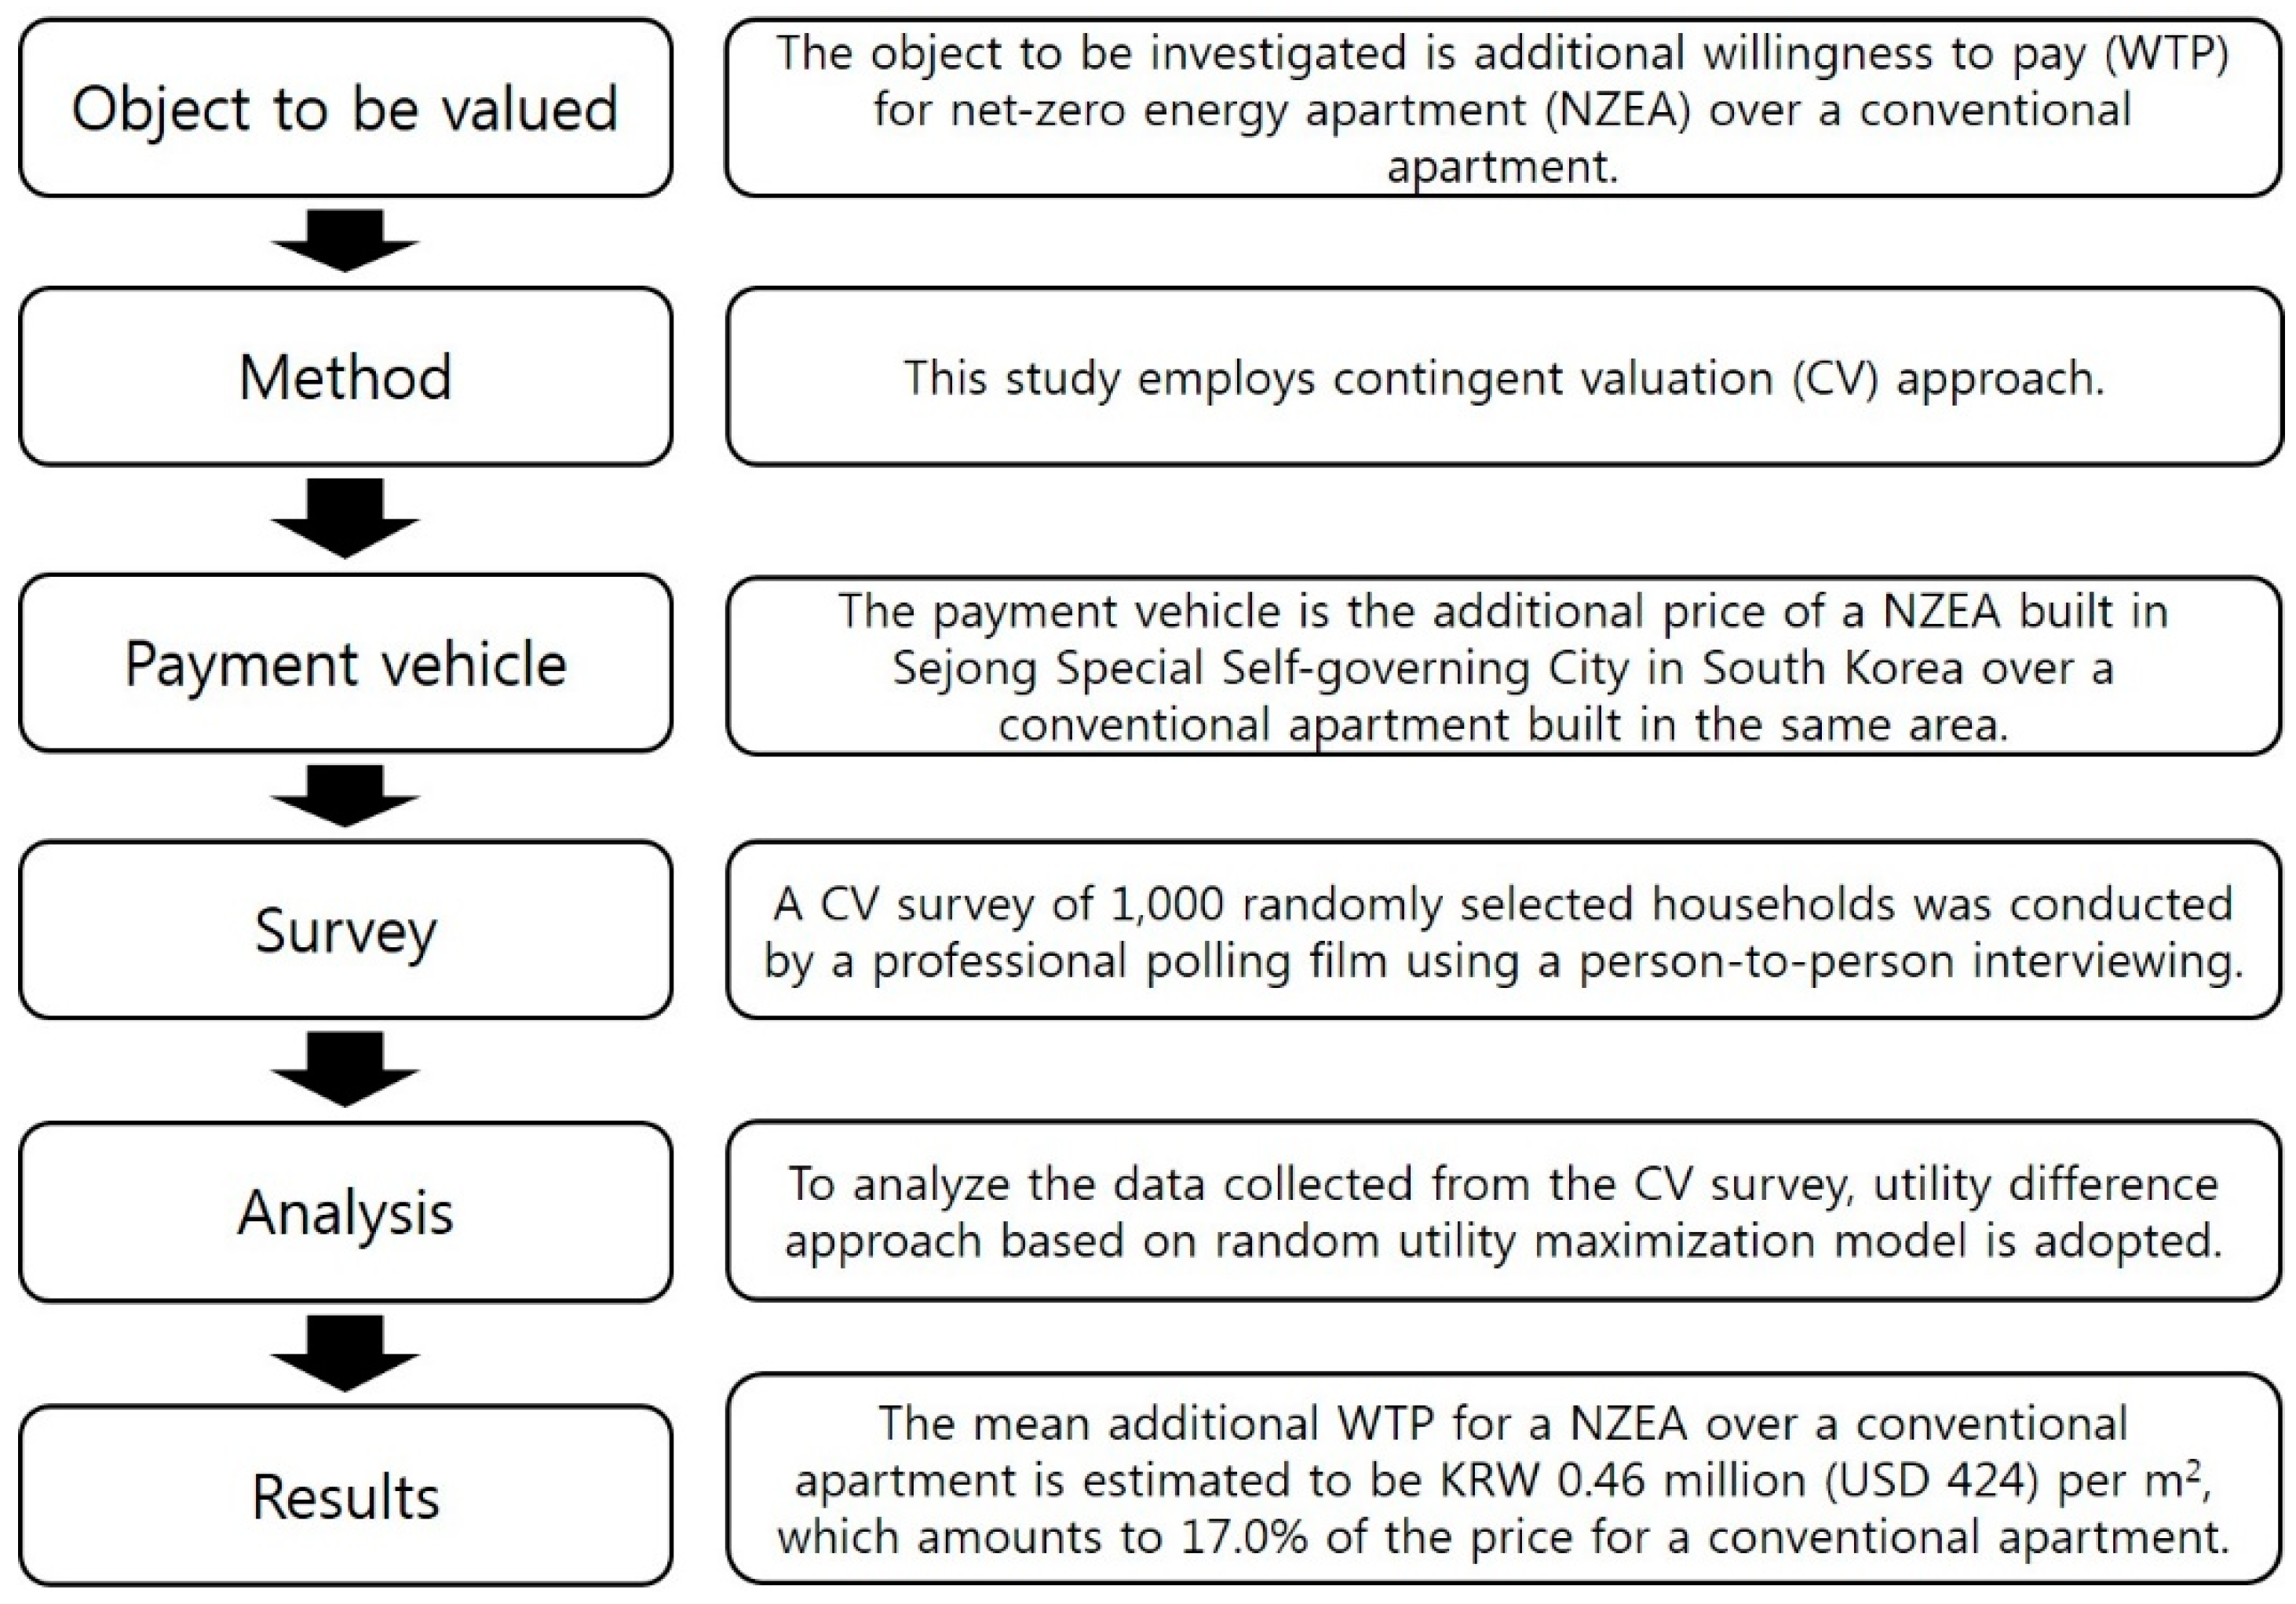
2.1. Object to Be Evaluated
2.2. Method: CV
2.3. Sampling and Survey Instrument
2.4. Elicitation of WTP
3. WTP Model
3.1. OOHB DC Model
3.2. Combination of the OOHB DC Question and Spike Model
- -
- “yes-yes” (),
- -
- “yes-no” (),
- -
- “no-yes” (),
- -
- “no-no” (),
- -
- “yes” (),
- -
- “no-yes” (),
- -
- “no-no-yes” (), and
- -
- “no-no-no” ().
4. Results and Discussion
4.1. Data
4.2. Estimation Results of the Model
4.3. Reflection of Covariates
4.4. Discussion of the Results
5. Conclusions
Author Contributions
Acknowledgments
Conflicts of Interest
References
- Intergovernmental Panel on Climate Change. Climate Change 2014: Synthesis Report; IPCC: Geneva, Switzerland, 2014; p. 151. [Google Scholar]
- OECD. OECD Environmental Performance Review: Korea 2017; OECD Publishing: Paris, France, 2017. [Google Scholar]
- MOLIT. Policy Report: To Cope with Climate Change Zero Energy Building Promotion Plan. 2016. Available online: http://www.molit.go.kr (accessed on 5 March 2018). (In Korean)
- International Energy Agency. World Energy Outlook; OECD/IEA: Paris, France, 2016. Available online: www.iea.org (accessed on 5 March 2018).
- AbuGrain, M.Y.; Alibaba, H.Z. Optimizing existing multistory building designs towards net-zero energy. Sustainability 2017, 9, 399. [Google Scholar] [CrossRef]
- Bühler, D.; Schuetze, T.; Junge, R. Towards development of a label for zero emission buildings: A tool to evaluate potential zero emission buildings. Sustainability 2015, 7, 5071–5093. [Google Scholar] [CrossRef]
- Koller, C.; Talmon-Gros, M.J.; Junge, R.; Schuetze, T. Energy toolbox-framework for the development of a tool for the primary design of zero emission buildings in European and Asian cities. Sustainability 2017, 9, 2244. [Google Scholar] [CrossRef]
- Marszal, A.J.; Heiselberg, P.; Bourrelle, J.S.; Musall, E.; Voss, K.; Sartori, I.; Napolitano, A. Zero Energy Building–A review of definitions and calculation methodologies. Energy Build. 2011, 43, 971–979. [Google Scholar] [CrossRef]
- Wang, L.; Gwilliam, J.; Jones, P. Case study of zero energy house design in UK. Energy Build. 2009, 41, 1215–1222. [Google Scholar] [CrossRef]
- Li, H.X.; Patel, D.; Al-Hussein, M.; Yu, H.; Gül, M. Stakeholder studies and the social networks of NetZero energy homes (NZEHs). Sustain. Cities Soc. 2018, 38, 9–17. [Google Scholar] [CrossRef]
- Min, S.H.; Lim, S.Y.; Yoo, S.H. Consumer’s willingness to pay a premium for eco-labeled LED TVs in Korea: A contingent valuation study. Sustainability 2017, 9, 814. [Google Scholar] [CrossRef]
- Park, S.Y.; Lim, S.Y.; Yoo, S.H. The economic value of the national meteorological service in the Korean household sector: A contingent valuation study. Sustainability 2016, 8, 834. [Google Scholar] [CrossRef]
- Lim, S.Y.; Kim, H.Y.; Yoo, S.H. Public willingness to pay for transforming Jogyesa Buddhist temple in Seoul, Korea into a cultural tourism resource. Sustainability 2016, 8, 900. [Google Scholar] [CrossRef]
- Kim, H.Y.; Park, S.Y.; Yoo, S.H. Public acceptability of introducing a biogas mandate in Korea: A contingent valuation study. Sustainability 2016, 8, 1087. [Google Scholar] [CrossRef]
- Wang, J.; Ge, J.; Ma, Y. Urban Chinese consumers’ willingness to pay for pork with certified labels: A discrete choice experiment. Sustainability 2018, 10, 603. [Google Scholar] [CrossRef]
- Yang, H.J.; Lim, S.Y.; Yoo, S.H. The environmental costs of photovoltaic power plants in South Korea: A choice experiment study. Sustainability 2017, 9, 1773. [Google Scholar] [CrossRef]
- Vanstockem, J.; Vranken, L.; Bleys, B.; Somers, B.; Hermy, M. Do looks matter? A case study on extensive green roofs using discrete choice experiments. Sustainability 2018, 10, 309. [Google Scholar] [CrossRef]
- Abdullah, S.; Jeanty, P.W. Willingness to pay for renewable energy: Evidence from a contingent valuation survey in Kenya. Renew. Sustain. Energy Rev. 2011, 15, 2974–2983. [Google Scholar] [CrossRef]
- Guo, X.; Liu, H.; Mao, X.; Jin, J.; Chen, D.; Cheng, S. Willingness to pay for renewable electricity: A contingent valuation study in Beijing, China. Energy Policy 2014, 68, 340–347. [Google Scholar] [CrossRef]
- Lim, K.M.; Lim, S.Y.; Yoo, S.H. Estimating the economic value of residential electricity use in the Republic of Korea using contingent valuation. Energy 2014, 64, 601–606. [Google Scholar] [CrossRef]
- Champ, P.A.; Boyle, K.J.; Brown, T.C.A. Primer on Nonmarket Valuation; Kluwer Academic Publisher: Dordrecht, The Netherlands, 2004. [Google Scholar]
- Cooper, J.C.; Hanemann, W.M.; Signorello, G. One and one-half bound dichotomous choice contingent valuation. Rev. Econ. Stat. 2002, 84, 742–750. [Google Scholar] [CrossRef]
- Kriström, B. Spike model in contingent valuation. Am. J. Agric. Econ. 1997, 79, 1013–1023. [Google Scholar] [CrossRef]
- Statistics Korea. Available online: http://kosis.kr (accessed on 2 March 2018).
- Hanemann, W.M. Welfare evaluations in contingent valuation experiments with discrete responses. Am. J. Agric. Econ. 1984, 66, 332–341. [Google Scholar] [CrossRef]
- Hanemann, W.M.; Loomis, J.; Kanninen, B.J. Statistical efficiency of double-bounded dichotomous choice contingent valuation. Am. J. Agric. Econ. 1991, 73, 1255–1263. [Google Scholar] [CrossRef]
- Johnston, R.J.; Boyle, K.J.; Adamowicz, W.; Bennett, J.; Brouwer, R.; Cameron, T.A.; Hanemann, W.M.; Hanley, N.; Ryan, M.; Scarpa, R.; et al. Contemporary guidance for stated preference studies. J. Assoc. Environ. Resour. Econ. 2017, 4, 319–405. [Google Scholar] [CrossRef]
- Krinsky, I.; Robb, A.L. On approximating the statistical properties of elasticities. Rev. Econ. Stat. 1986, 68, 715–719. [Google Scholar] [CrossRef]


| Bid Amount a | Lower Bid Is Offered at First (%) b | Upper Bid Is Offered at First (%) b | Sample Size | |||||||
|---|---|---|---|---|---|---|---|---|---|---|
| “Yes-Yes” | “Yes-No” | “No-Yes” | “No-No” | “Yes” | “No-Yes” | “No-No-Yes” | “No-No-No” | |||
| 250 | 350 | 4 (2.8) | 10 (7.0) | 16 (11.2) | 42 (29.4) | 10 (7.0) | 3 (2.1) | 16 (11.2) | 42 (29.4) | 143 (100.0) |
| 300 | 400 | 6 (4.2) | 12 (8.4) | 17 (11.9) | 36 (25.2) | 4 (2.8) | 5 (3.5) | 14 (9.8) | 49 (34.3) | 143 (100.0) |
| 350 | 450 | 6 (4.2) | 10 (7.0) | 12 (8.4) | 43 (30.1) | 10 (7.0) | 2 (1.4) | 18 (12.6) | 42 (29.4) | 143 (100.0) |
| 450 | 550 | 3 (2.1) | 4 (2.8) | 21 (14.7) | 44 (30.8) | 7 (4.9) | 5 (3.5) | 20 (14.0) | 39 (27.3) | 143 (100.0) |
| 550 | 650 | 4 (2.8) | 6 (4.2) | 17 (12.0) | 44 (31.0) | 13 (9.2) | 6 (4.2) | 19 (13.4) | 33 (23.2) | 142 (100.0) |
| 650 | 750 | 4 (2.8) | 1 (0.7) | 18 (12.7) | 48 (33.8) | 5 (3.5) | 1 (0.7) | 18 (12.7) | 47 (33.1) | 142 (100.0) |
| 800 | 900 | 2 (1.4) | 2 (1.4) | 25 (17.4) | 43 (29.9) | 3 (2.1) | 2 (1.4) | 24 (16.7) | 43 (29.9) | 144 (100.0) |
| Totals | 29 (2.9) | 45 (4.5) | 126 (12.6) | 300 (30.0) | 52 (5.2) | 24 (2.4) | 129 (12.9) | 295 (29.5) | 1000 (100.0) | |
| Variables | Estimates d |
|---|---|
| Constant | −0.379 (−5.90) # |
| Bid amount a | −3.411 (−19.07) # |
| Spike | 0.594 (38.27) # |
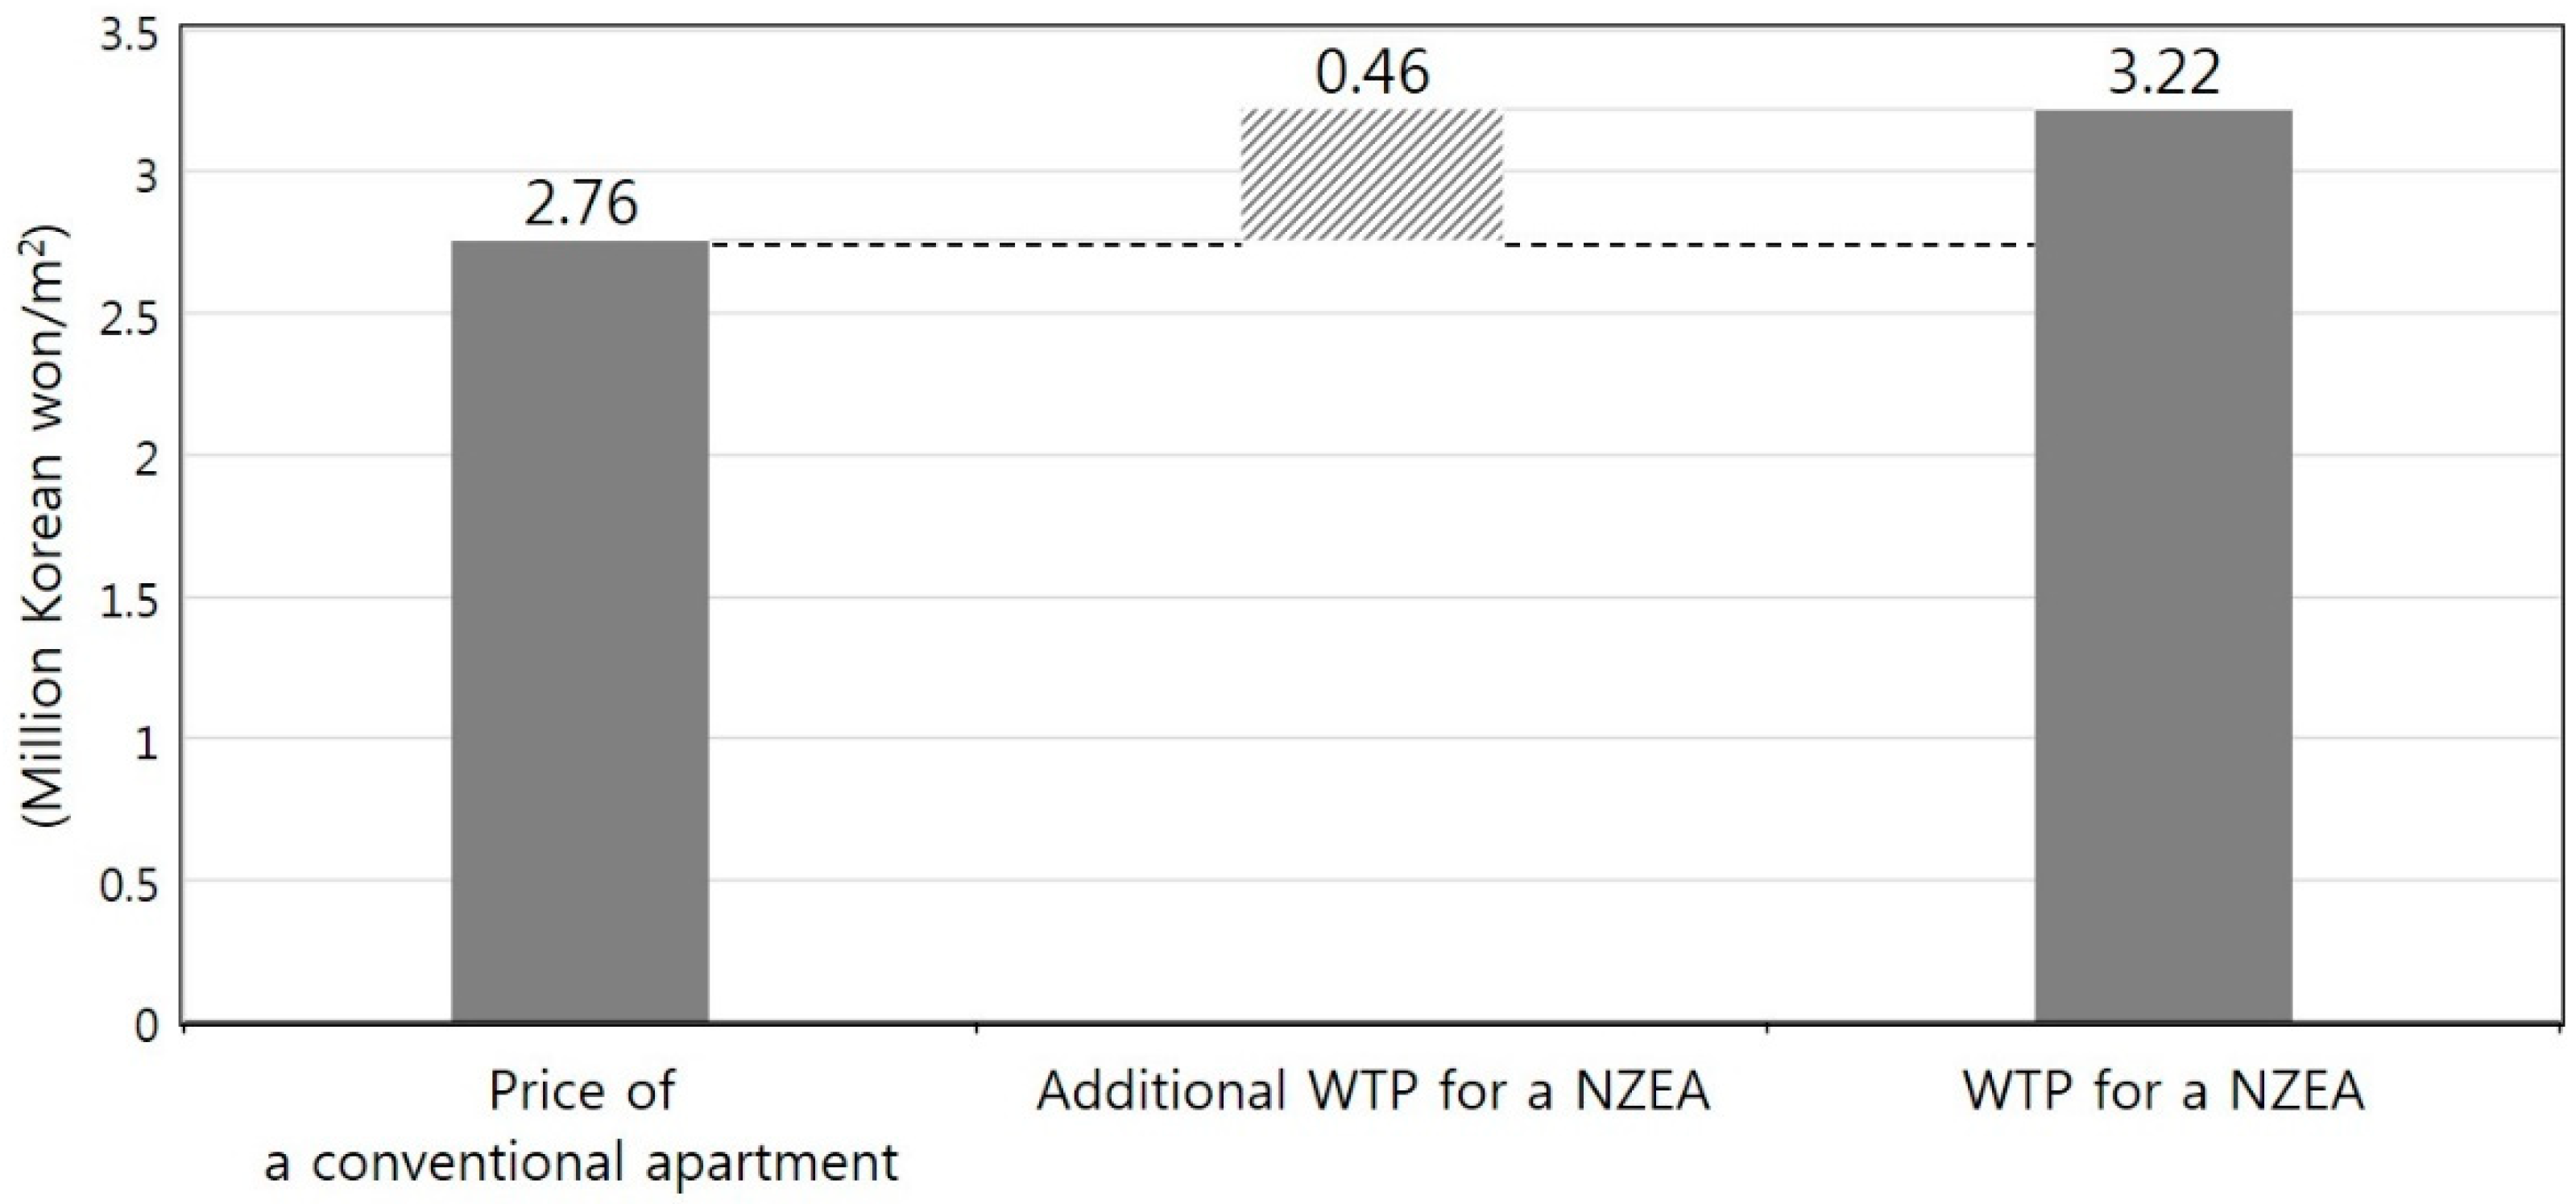
| Mean additional WTP per m2 | KRW 0.46 million (USD 424) |
| t-value | 15.73 # |
| 95% confidence interval b | KRW 0.41 to 0.53 million (USD 364 to 455) |
| 99% confidence interval b | KRW 0.40 to 0.55 million (USD 364 to 485) |
| Sample size | 1000 |
| Log-likelihood | −1057.30 |
| Wald statistic (p-value) c | 247.41 (0.000) |
| Variables | Definitions | Mean | Standard Deviation |
|---|---|---|---|
| Education | The respondent’s educational level in years | 14.04 | 2.27 |
| Income | The respondent’s household’s monthly income before tax deduction (unit: million Korean won) | 4.80 | 5.99 |
| Head | Whether the respondent is the head of household (1 = head; 0 = otherwise) | 0.55 | 0.50 |
| Gender | The respondent’s gender (0 = male; 1 = female) | 0.50 | 0.50 |
| Variables a | Estimates | t-Values |
|---|---|---|
| Constant | −2.6080 | −6.21 * |
| Bid amount b | −3.5066 | −19.12 * |
| Education | 0.1424 | 4.75 * |
| Income | 0.0581 | 2.05 * |
| Head | 0.5515 | 1.80 * |
| Gender | −0.7127 | −2.32 * |
| Spike | 0.4679 | 29.47 * |
| Mean additional WTP per m2 | KRW 0.45 million (USD 394) | |
| t-value | 15.63 ** | |
| 95% confidence interval c | KRW 0.40 to 0.51 million (USD 364 to 455) | |
| 99% confidence interval c | KRW 0.38 to 0.53 million (USD 333 to 464) | |
| Wald statistic (p-value) d | 491.94 (0.000) | |
| Log-likelihood | −1036.54 | |
| Number of observations | 1000 | |
© 2018 by the authors. Licensee MDPI, Basel, Switzerland. This article is an open access article distributed under the terms and conditions of the Creative Commons Attribution (CC BY) license (http://creativecommons.org/licenses/by/4.0/).
Share and Cite
Kim, J.-H.; Kim, H.-J.; Yoo, S.-H. Consumers’ Willingness to Pay for Net-Zero Energy Apartment in South Korea. Sustainability 2018, 10, 1564. https://doi.org/10.3390/su10051564
Kim J-H, Kim H-J, Yoo S-H. Consumers’ Willingness to Pay for Net-Zero Energy Apartment in South Korea. Sustainability. 2018; 10(5):1564. https://doi.org/10.3390/su10051564
Chicago/Turabian StyleKim, Ju-Hee, Hyo-Jin Kim, and Seung-Hoon Yoo. 2018. "Consumers’ Willingness to Pay for Net-Zero Energy Apartment in South Korea" Sustainability 10, no. 5: 1564. https://doi.org/10.3390/su10051564
APA StyleKim, J.-H., Kim, H.-J., & Yoo, S.-H. (2018). Consumers’ Willingness to Pay for Net-Zero Energy Apartment in South Korea. Sustainability, 10(5), 1564. https://doi.org/10.3390/su10051564