Factors Affecting Green Residential Building Development: Social Network Analysis


Abstract
1. Introduction
2. Literature Review
2.1. Factors Influencing GRBD
2.2. The Application of SNA in GRBD
3. Research Method
3.1. Identification of Factors Influencing GRBD
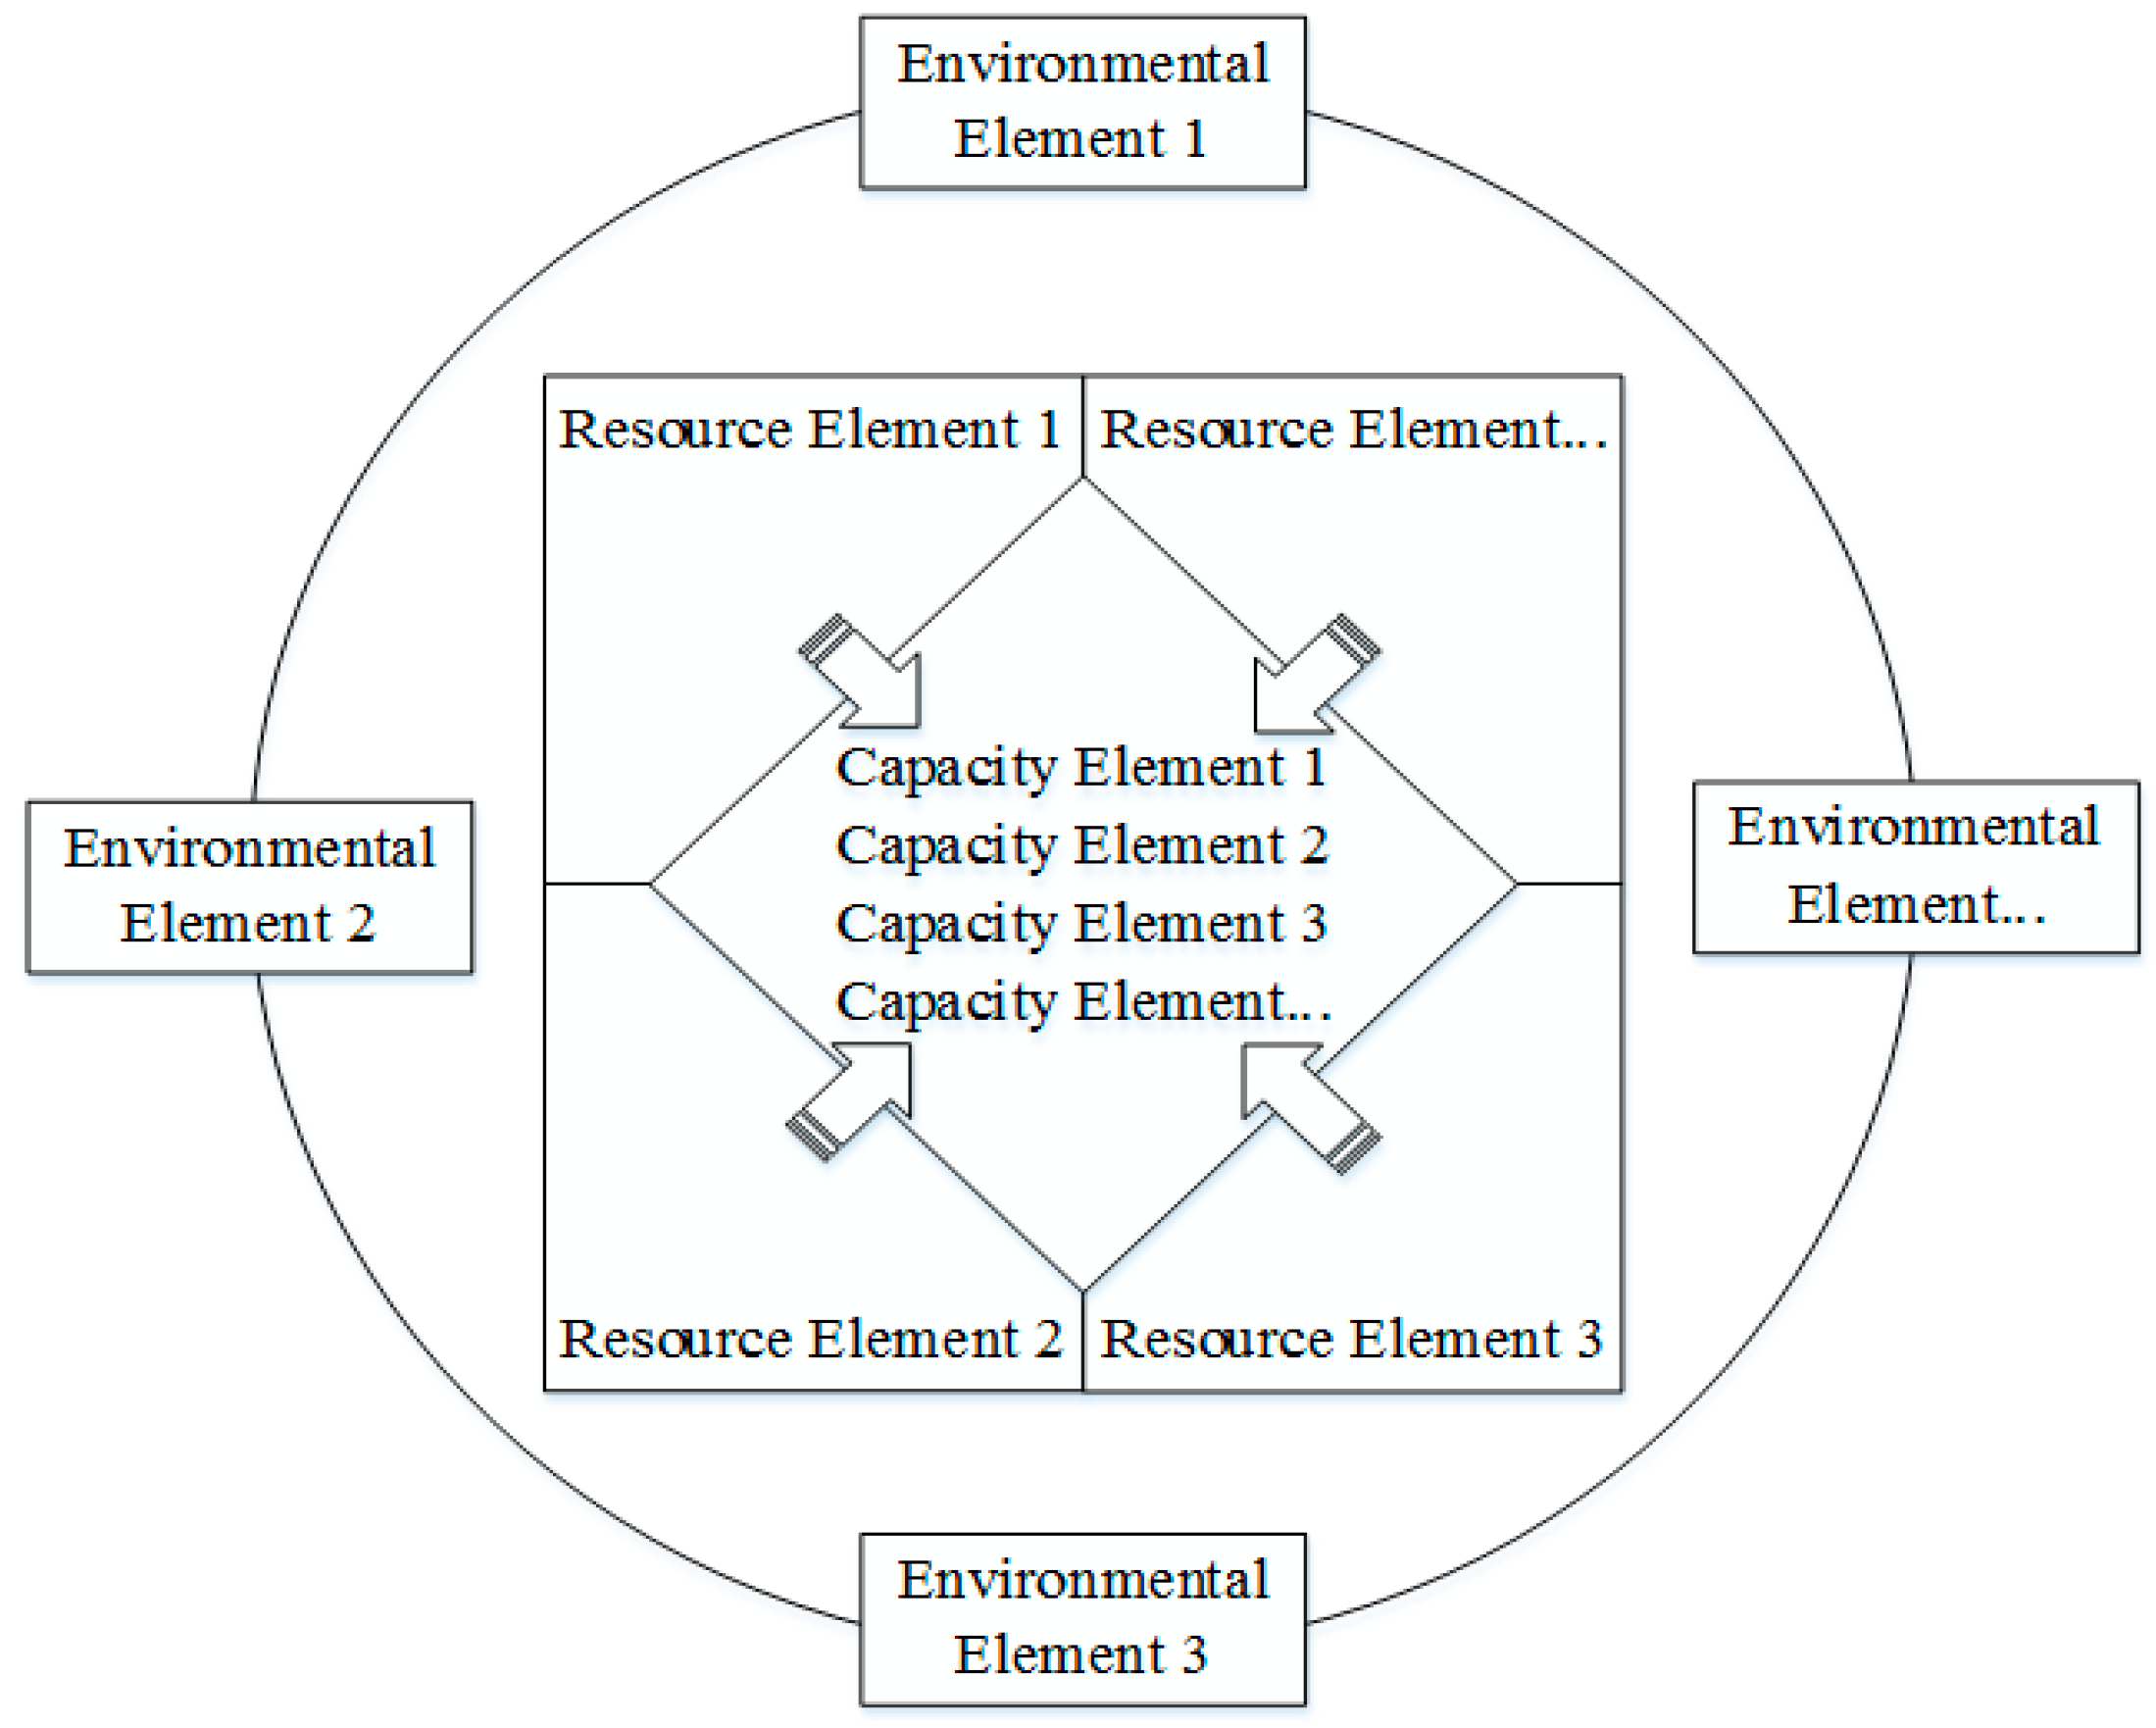
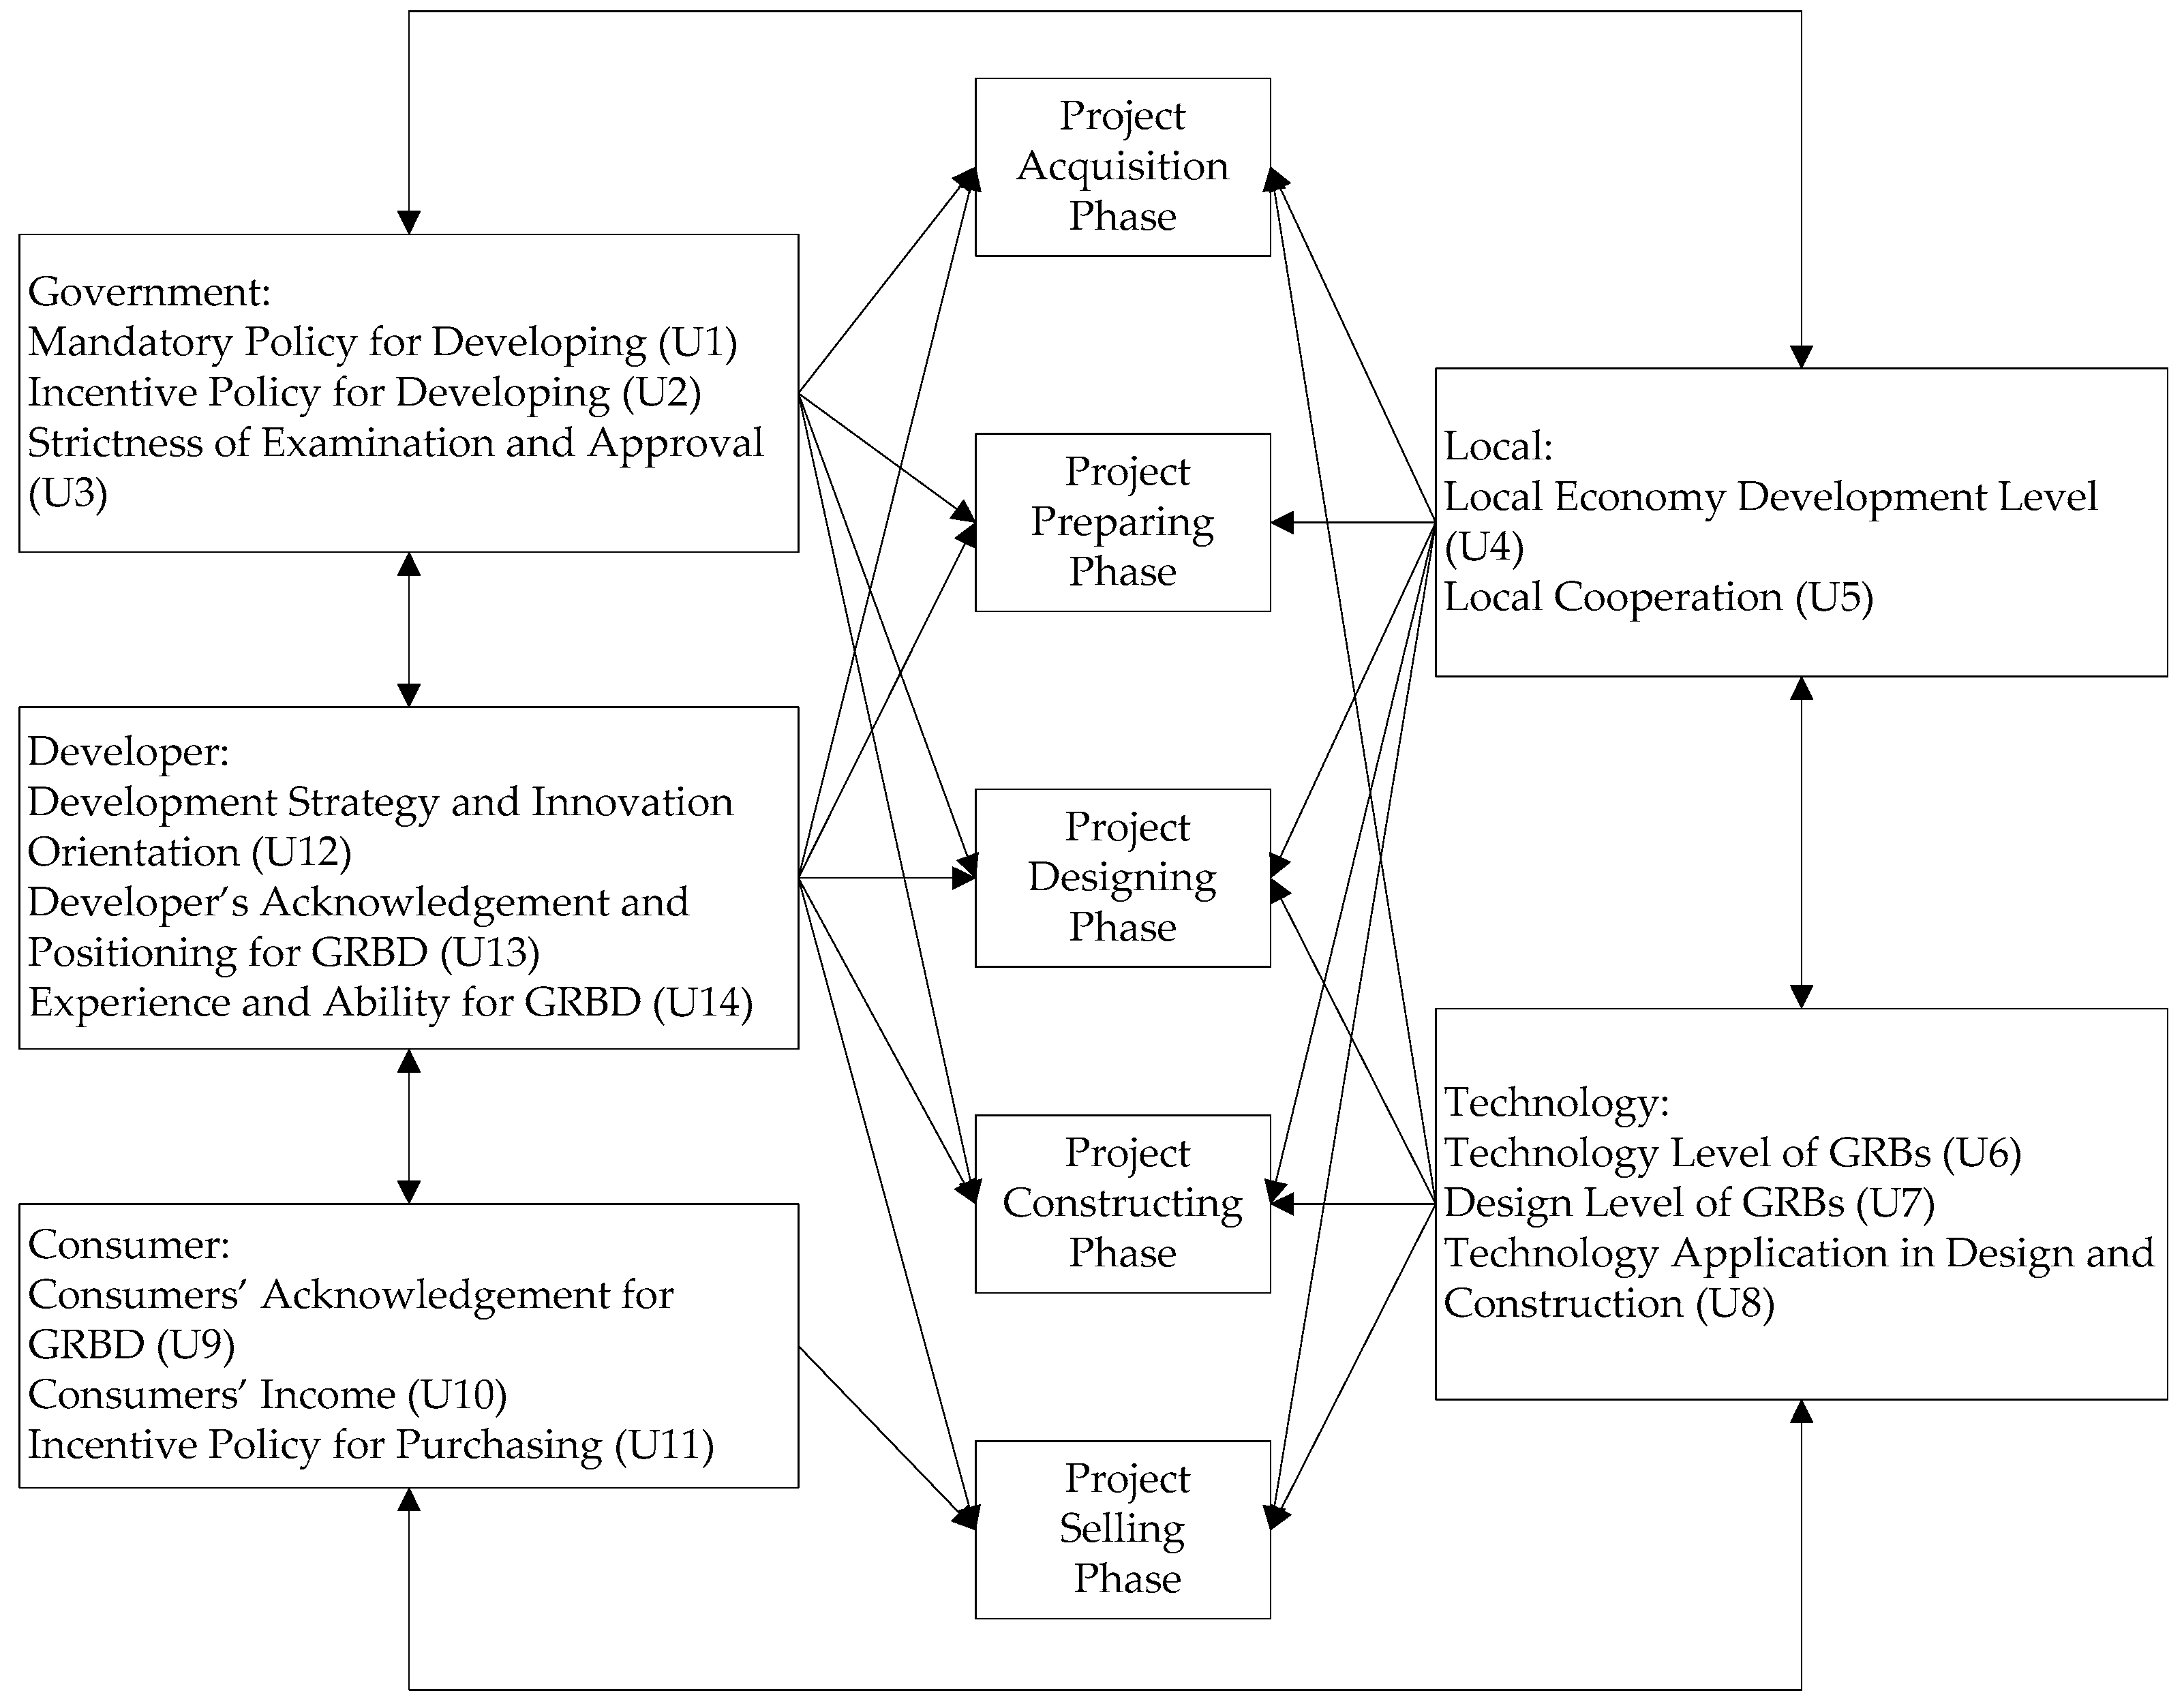
3.2. A Framework of Influential Factors for GRBD
3.3. Social Network of Influential Factors
3.3.1. Correlation Analysis of Influential Factors for GRBD
- Vij: The impact degree of Ui to Uj;
- Xi1 (Xj1): The impact degree of Ui (Uj) in the acquiring phase in the relation matrix;
- Xi2 (Xj2): The impact degree of Ui (Uj) in the preparing phase in the relation matrix;
- Xi3 (Xj3): The impact degree of Ui (Uj) in the designing phase in the relation matrix;
- Xi4(Xj4): The impact degree of Ui (Uj) in the constructing phase in the relation matrix;
- Xi5 (Xj5): The impact degree of Ui (Uj) in the selling phase in the relation matrix.
3.3.2. Centrality of Influential Factors for GRBD
4. Results
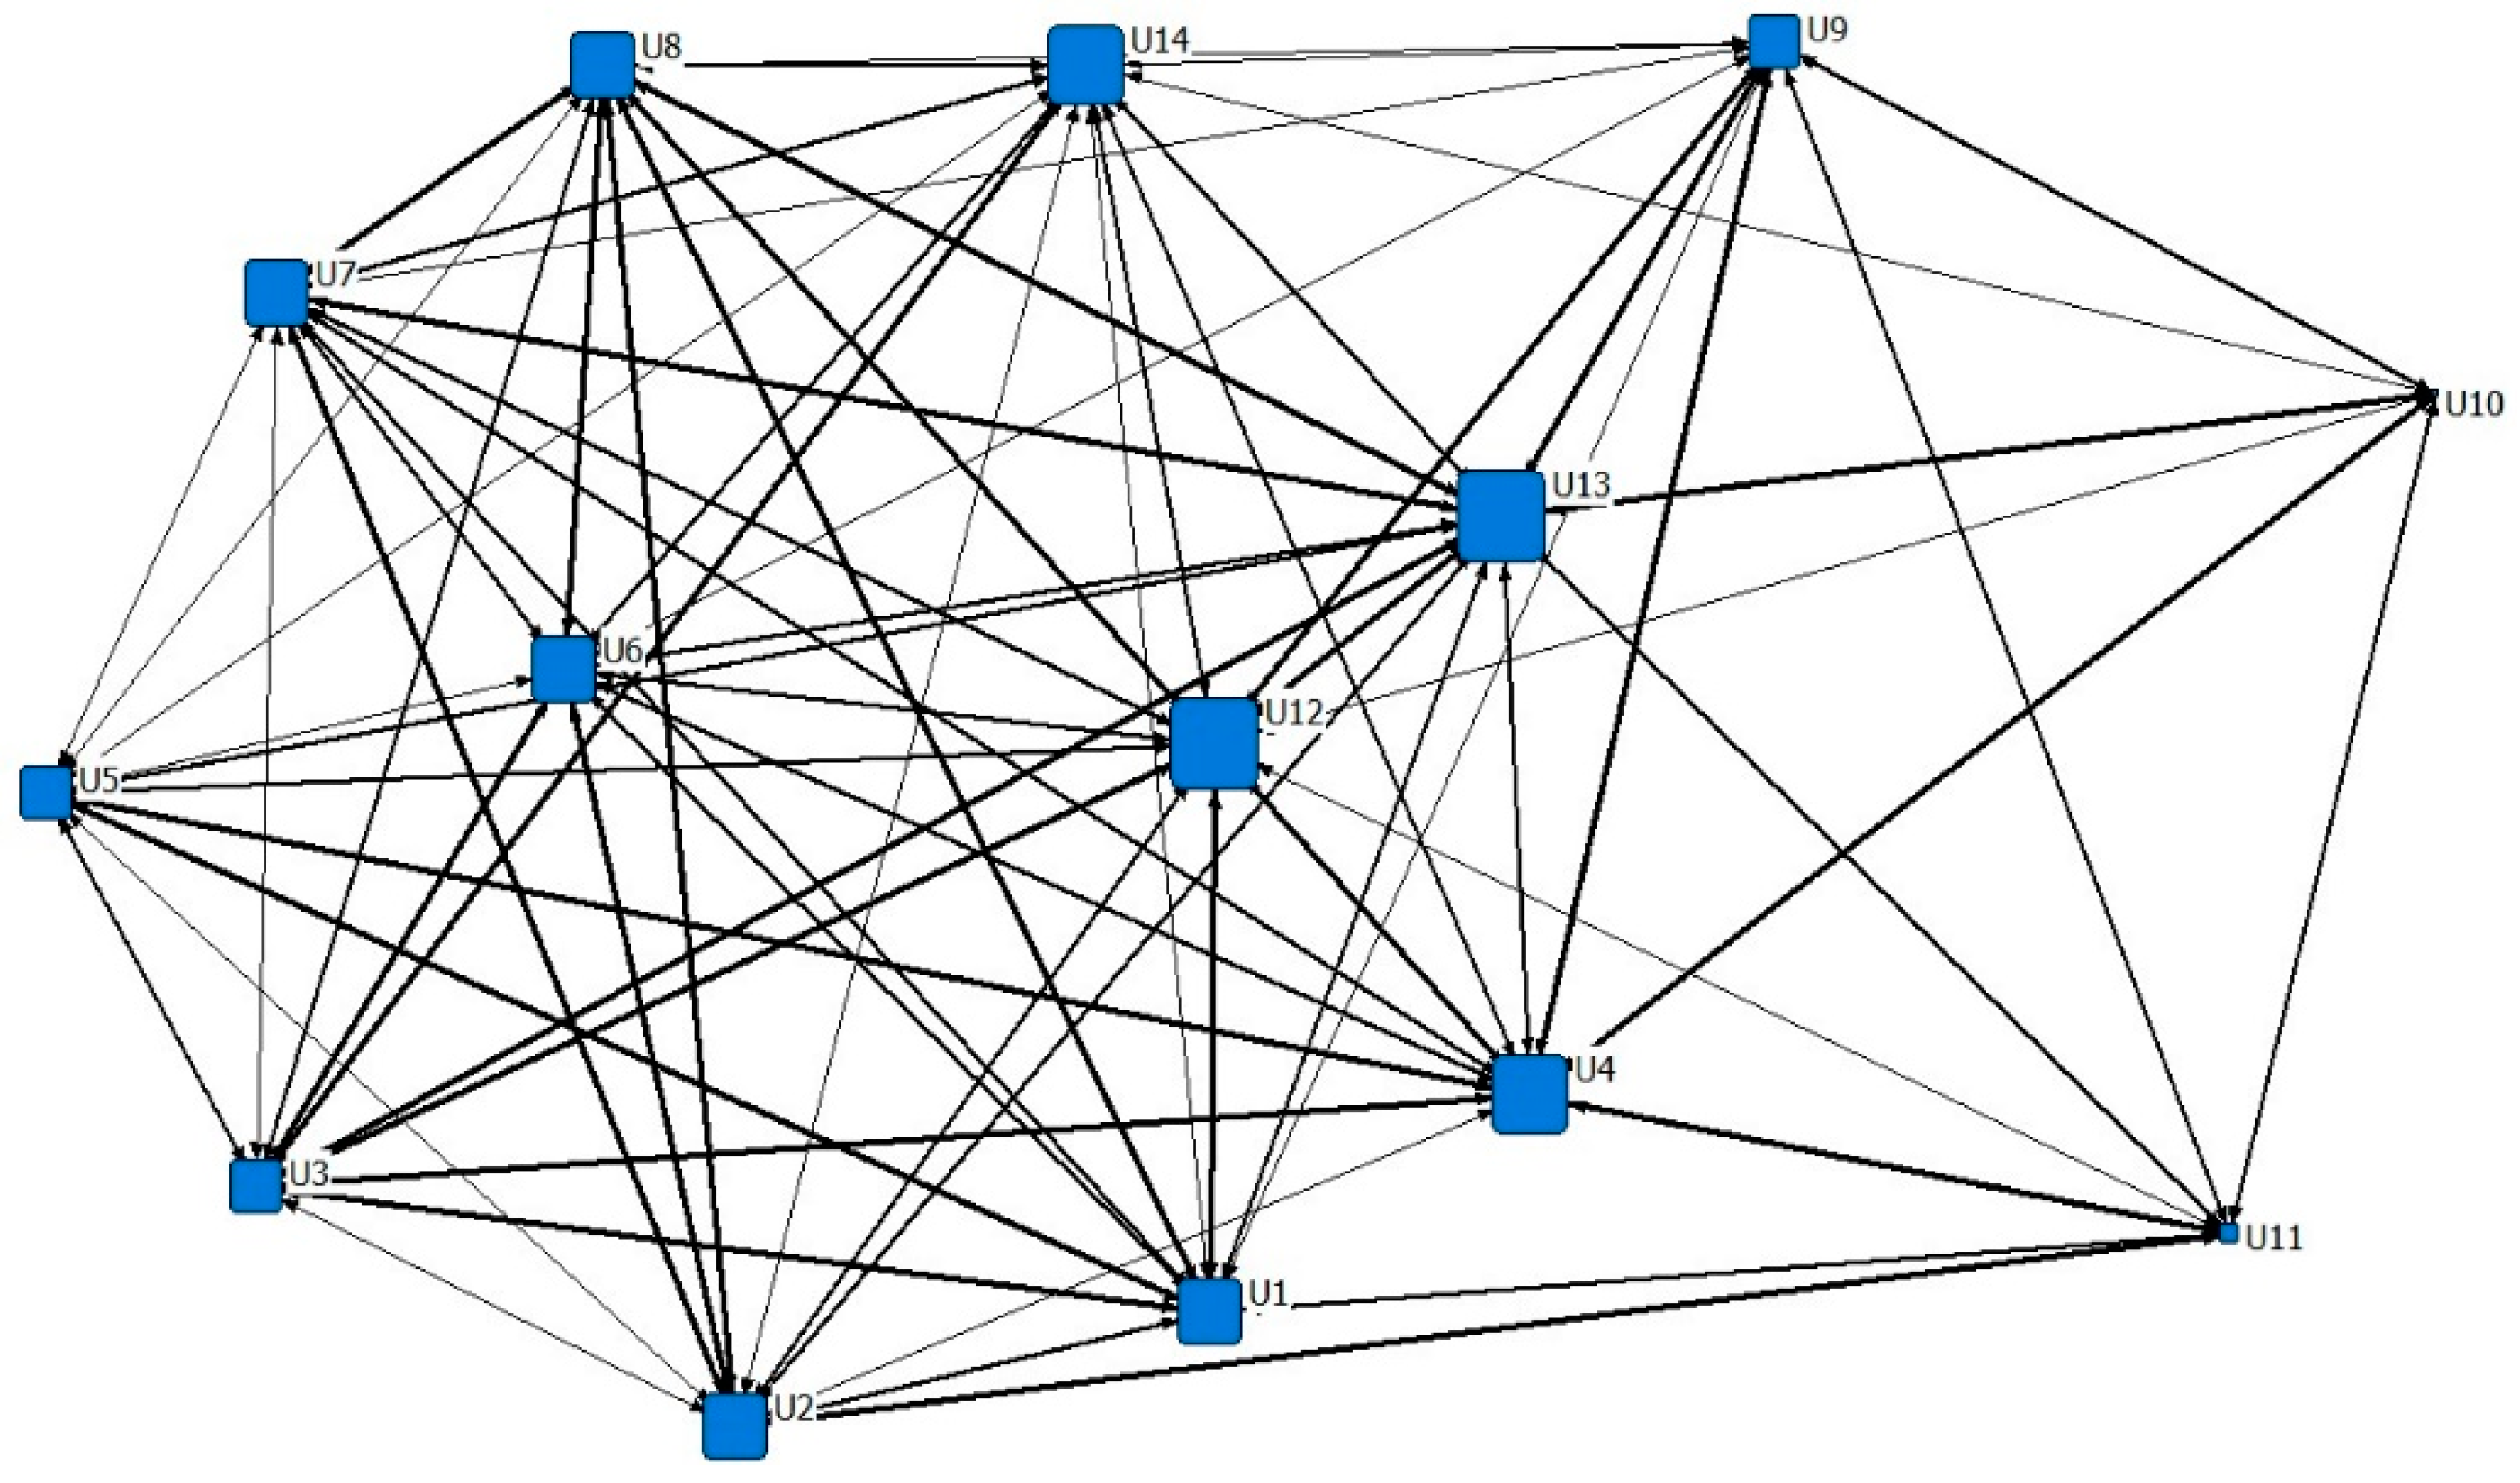
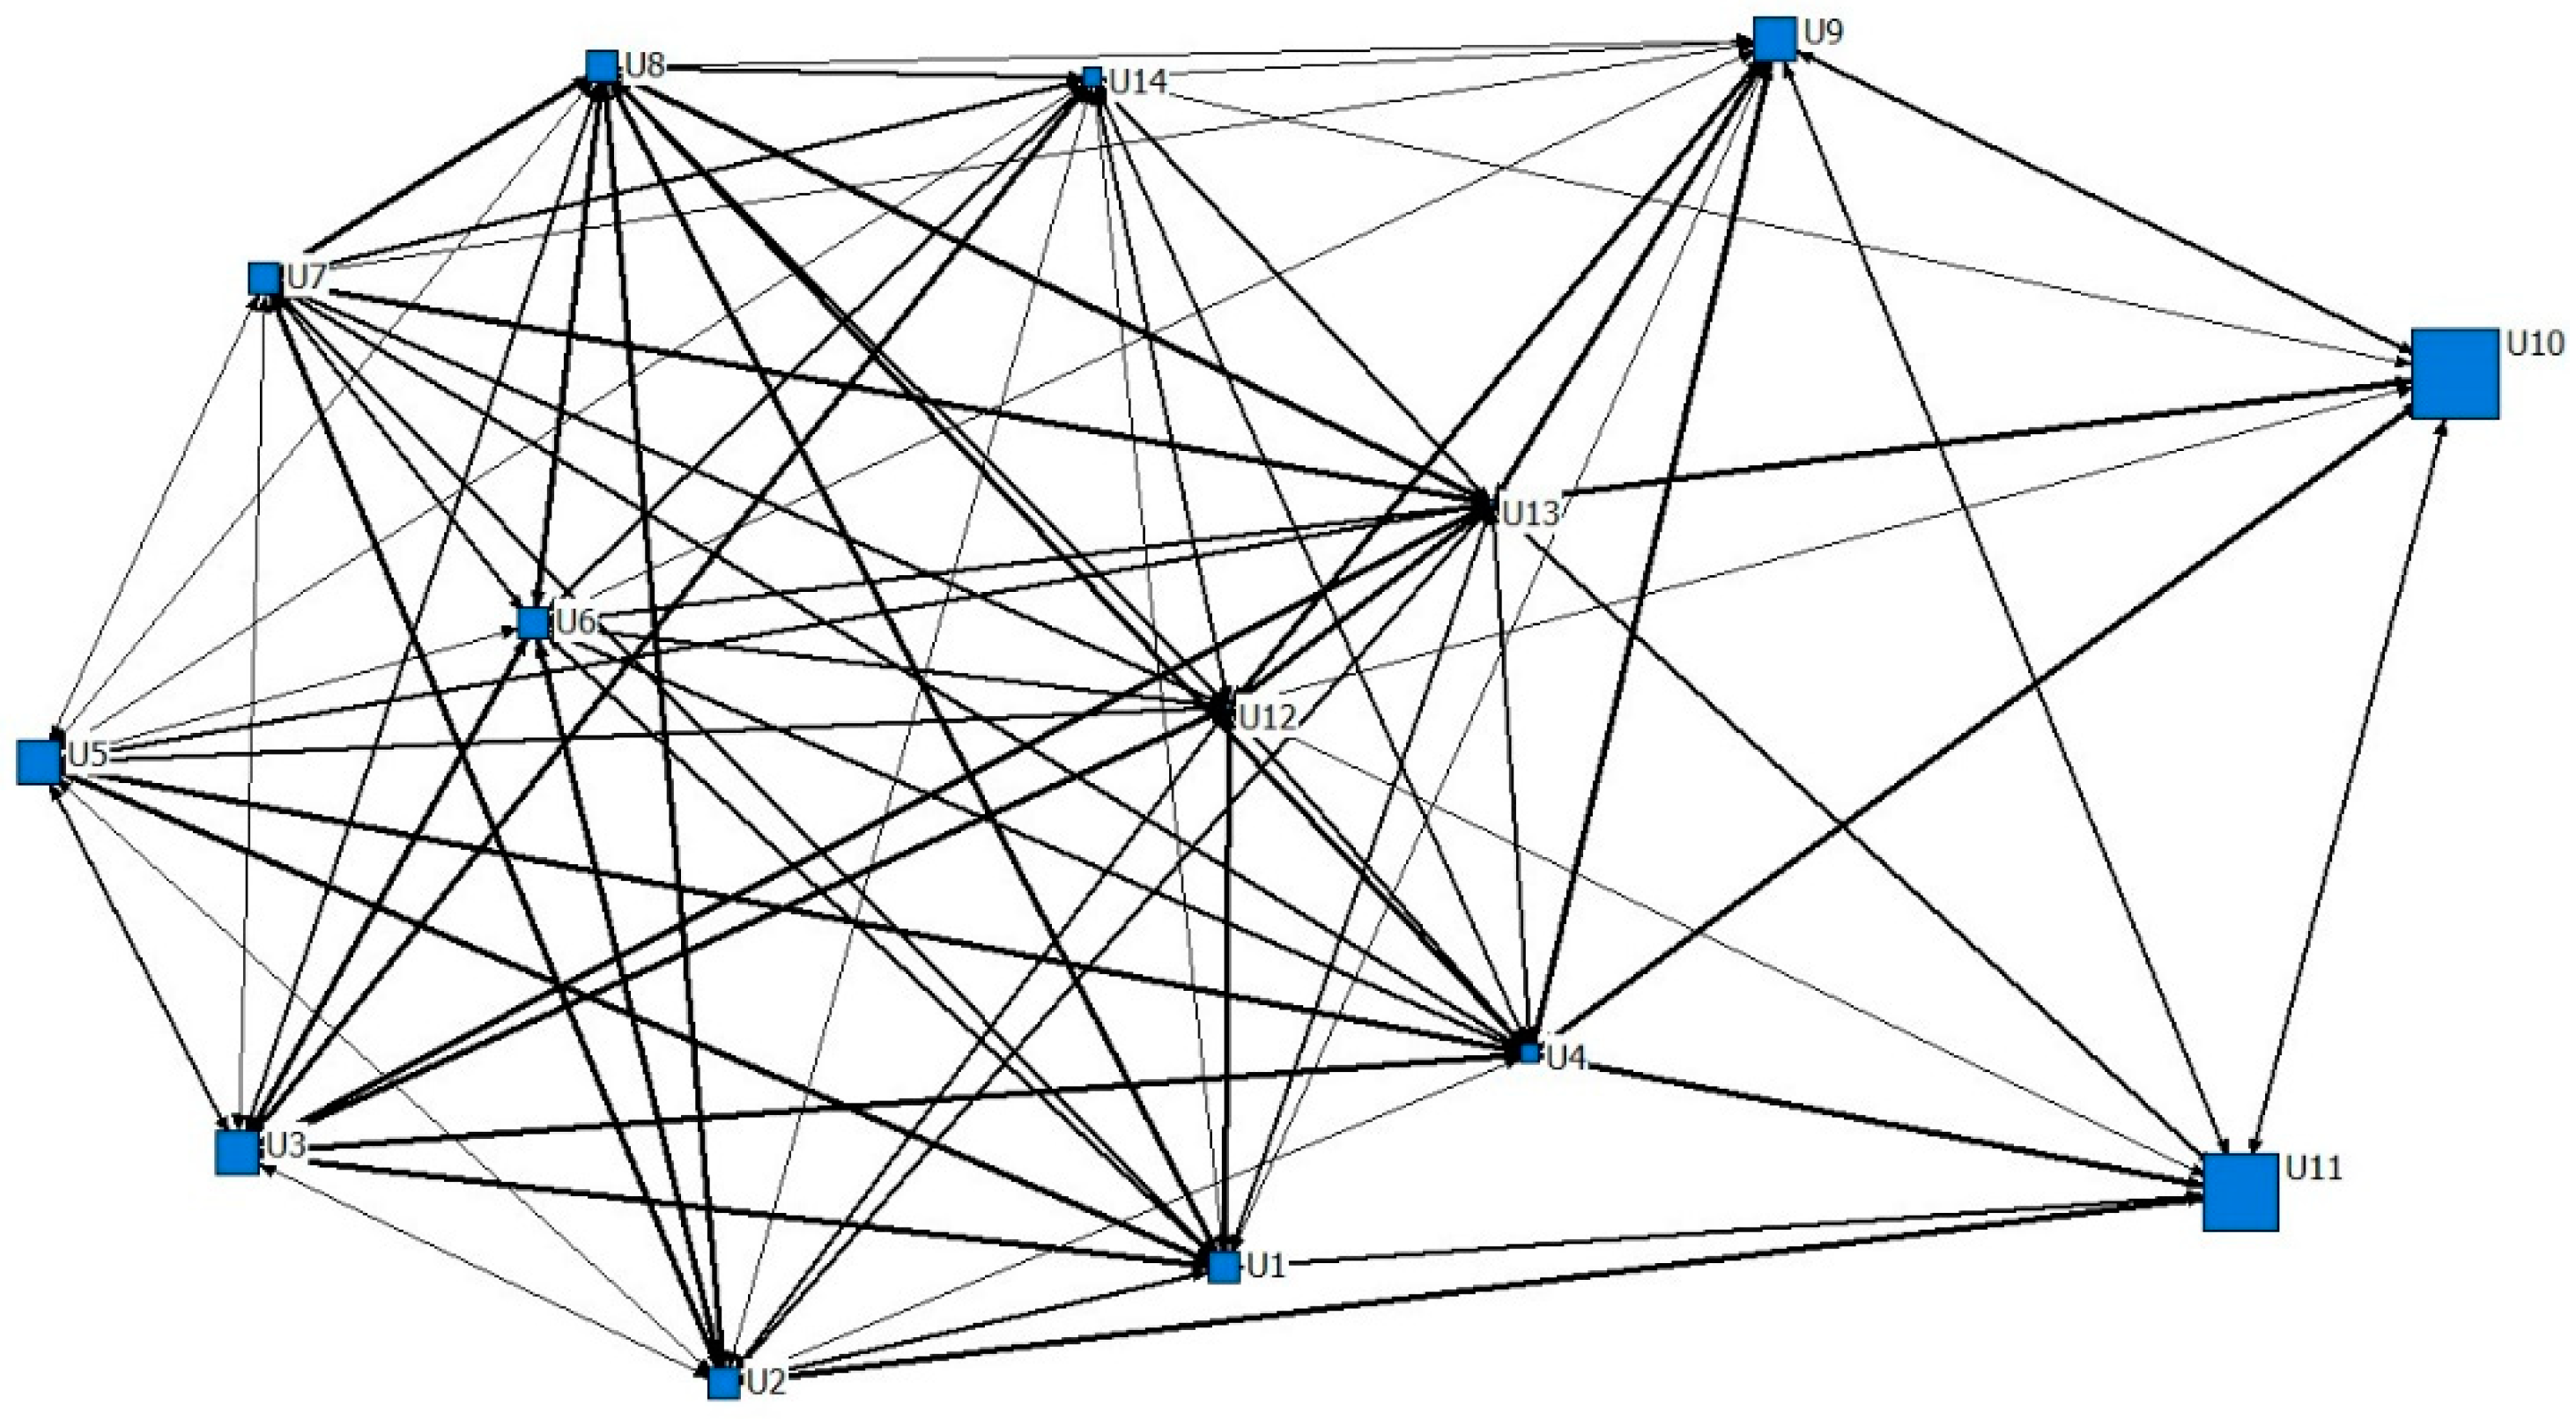
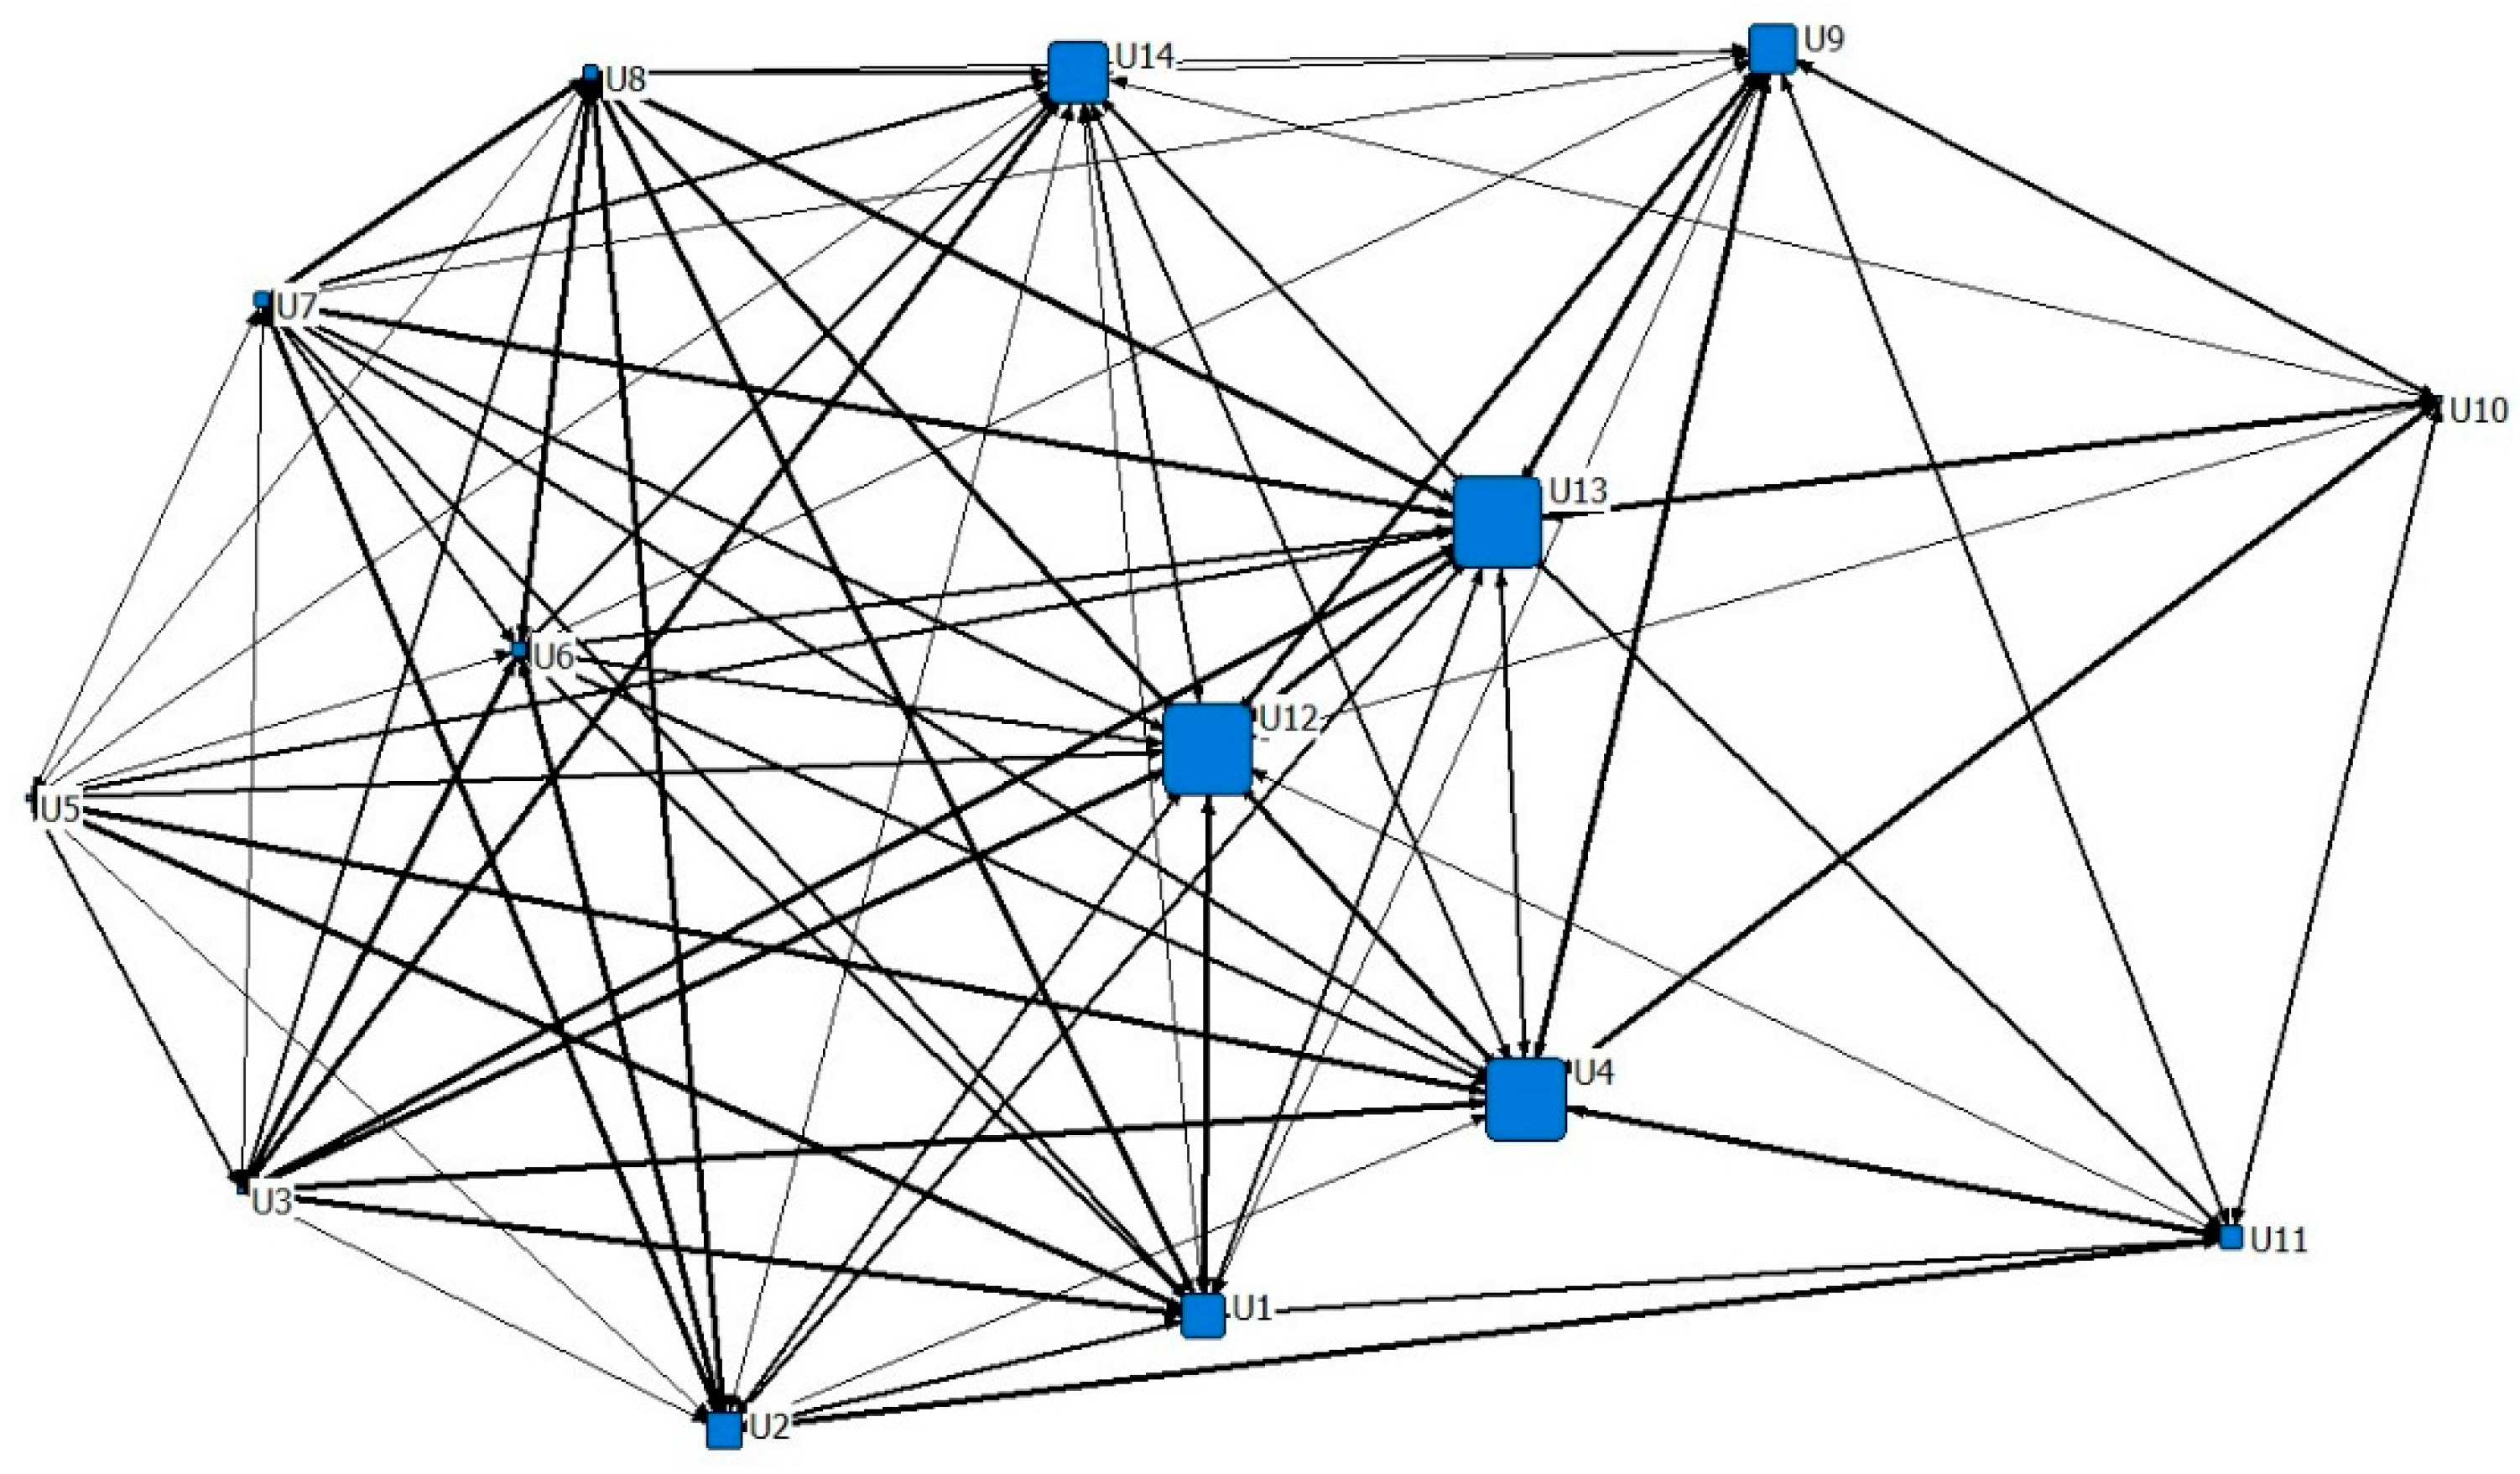
4.1. Sociogram of Factors Influencing GRBD
4.2. Critical Factors for GRBD
5. Discussion
6. Conclusions and Recommendation
Author Contributions
Funding
Acknowledgments
Conflicts of Interest
Appendix A

| Primary Indexes | Secondary Indexes | Preliminary Factors | Sources |
|---|---|---|---|
| Environmental Elements | Political Environment | Mandatory Policy for Developing (I1) | [46,48,55,87] |
| Incentive Policy for Developing (I2) | [41,48,56,64] | ||
| Industrial Policy (I3) | [64,87] | ||
| Industrial Standard (I4) | [40,53,55,87] | ||
| Monetary Policy (I5) | [47,61,88] | ||
| Tax Policy (I6) | [47,50] | ||
| Economic Environment | Local Economy Development Level (I7) | [53,64] | |
| Supply and Demand in Market of GRBs (I8) | [40,61] | ||
| Supply and Demand in Market of GRBs (I9) | [49,61] | ||
| Inflation (I10) | [18,89] | ||
| Social Environment | City Planning (I11) | [40,53] | |
| Social Acknowledgement of GRBs (I12) | [55,90] | ||
| Juristic Environment | Law Health (I13) | [48,64] | |
| Enforcement Strictness (I14) | [48] | ||
| Land System and Policy (I15) | [53,64] | ||
| Natural Environment | Geological Condition (I16) | [32,53] | |
| Climate Condition (I17) | [21,62] | ||
| Acquisition of Natural Resource (I18) | [32,53] | ||
| Technical Environment | Technology Level of GRBs (I19) | [32,47,54,88] | |
| Popularization and Application of Green Technology (I20) | [32,53] | ||
| Resource Elements | Government | Strictness of Examination and Approval (I21) | [55,64,87] |
| Reliability of Quality Control (I22) | [18,64,87] | ||
| Marketing Agency | Acknowledgement of GRBs (I23) | [90] | |
| Judgement Ability of GRBs (I24) | [55,88] | ||
| Marketing Ability of GRBs (I25) | [88] | ||
| Bank | Credit Policies for Developing (I26) | [18,47,48,88] | |
| Credit Policies for Purchasing (I27) | [18,48,88] | ||
| Research Institute | Driving Force of Economy (I28) | [40,44] | |
| Research Ability of GRBs (I29) | [40,87] | ||
| Resource Elements | Designer | Driving Force of Economy (I30) | [40,55] |
| Reconnaissance of Construction Site (I31) | [91,92] | ||
| Design Level of GRBs (I32) | [40,62,69] | ||
| Technology and Material Application (I33) | [21,55,87,88] | ||
| Social Responsibility (I34) | [21,87] | ||
| Builder | Acknowledgement of Green Construction (I35) | [44,91] | |
| Management Ability of Green Construction (I36) | [21,57,87] | ||
| Technology Application in Design and Construction (I37) | [21,87] | ||
| Biding Price (I38) | [55,62] | ||
| Coordination with Designer (I39) | [91] | ||
| Appointed Subcontractors (I40) | [21,55] | ||
| Supervisor | Acknowledgement of Green Construction (I41) | [44,47] | |
| Regulation Ability of Green Construction (I42) | [87] | ||
| Regulation Experience of Green Construction (I43) | [21,55,87] | ||
| Professional Ethic (I44) | [87] | ||
| Supplier | Prices of Building Material and Facilities (I45) | [87,93] | |
| Quality of Building Material and Facilities (I46) | [21,54,87] | ||
| Certificate Authority | Evaluation Ability of GRBs (I47) | [44,87] | |
| Professional Ethic (I48) | [87] | ||
| Consumer | Acknowledgement for GRBD (I49) | [42,44,90] | |
| Environmental Conscious (I50) | [33,53,55] | ||
| Family Income (I51) | [58,94] | ||
| Incentive Policy for Purchasing (I52) | [41,47,48] | ||
| Information Acquisition of GRBs (I53) | [18,44,88] | ||
| Living Habit (I54) | [40,49] | ||
| Education Level (I55) | [40,58] | ||
| Personality Characteristics (I56) | [40,58] | ||
| Local Society | Location and Strategy of Local Development (I57) | [47,48,49,64] | |
| Local Cooperation (I58) | [47,49,64,87] | ||
| Capacity Elements | Developer | Driving Force of Economy (I59) | [37,44,55] |
| Development Strategy and Innovation Orientation (I60) | [53,54,55,62] | ||
| Acknowledgement and Positioning for GRBD (I61) | [47,55,90] | ||
| Experience and Ability for GRBD (I62) | [21,44,90] | ||
| Financing of the Project (I63) | [44,62] | ||
| Management for GRBD (I64) | [21,44,90] |
Appendix B. Questionnaire on Factors Affecting GRBD
| Elements | Category | No. | Preliminary Factors | 1 | 2 | 3 | 4 | 5 |
|---|---|---|---|---|---|---|---|---|
| Environmental Elements | Political Environment | 1 | Mandatory Policy for Developing | □ | □ | □ | □ | □ |
| 2 | Incentive Policy for Developing | □ | □ | □ | □ | □ | ||
| 3 | Industrial Policy | □ | □ | □ | □ | □ | ||
| 4 | Industrial Standard | □ | □ | □ | □ | □ | ||
| 5 | Monetary Policy | □ | □ | □ | □ | □ | ||
| 6 | Tax Policy | □ | □ | □ | □ | □ | ||
| Economic Environment | 7 | Local Economy Development Level | □ | □ | □ | □ | □ | |
| 8 | Supply and Demand in Market of GRBs | □ | □ | □ | □ | □ | ||
| 9 | Supply and Demand in Market of GRBs | □ | □ | □ | □ | □ | ||
| 10 | Inflation | □ | □ | □ | □ | □ | ||
| Social Environment | 11 | City Planning | □ | □ | □ | □ | □ | |
| 12 | Social Acknowledgement of GRBs | □ | □ | □ | □ | □ | ||
| Juristic Environment | 13 | Law Health | □ | □ | □ | □ | □ | |
| 14 | Enforcement Strictness | □ | □ | □ | □ | □ | ||
| 15 | Land System and Policy | □ | □ | □ | □ | □ | ||
| Natural Environment | 16 | Geological Condition | □ | □ | □ | □ | □ | |
| 17 | Climate Condition | □ | □ | □ | □ | □ | ||
| 18 | Acquisition of Natural Resource | □ | □ | □ | □ | □ | ||
| Technical Environment | 19 | Technology Level of GRBs | □ | □ | □ | □ | □ | |
| 20 | Popularization and Application of Green Technology | □ | □ | □ | □ | □ | ||
| Resource Elements | Government | 21 | Strictness of Examination and Approval | □ | □ | □ | □ | □ |
| 22 | Reliability of Quality Control | □ | □ | □ | □ | □ | ||
| Marketing Agency | 23 | Acknowledgement of GRBs | □ | □ | □ | □ | □ | |
| 24 | Judgement Ability of GRBs | □ | □ | □ | □ | □ | ||
| 25 | Marketing Ability of GRBs | □ | □ | □ | □ | □ | ||
| Bank | 26 | Credit Policies for Developing | □ | □ | □ | □ | □ | |
| 27 | Credit Policies for Purchasing | □ | □ | □ | □ | □ | ||
| Research Institute | 28 | Driving Force of Economy | □ | □ | □ | □ | □ | |
| 29 | Research Ability of GRBs | □ | □ | □ | □ | □ | ||
| Designer | 30 | Driving Force of Economy | □ | □ | □ | □ | □ | |
| 31 | Reconnaissance of Construction Site | □ | □ | □ | □ | □ | ||
| 32 | Design Level of GRBs | □ | □ | □ | □ | □ | ||
| 33 | Technology and Material Application | □ | □ | □ | □ | □ | ||
| 34 | Social Responsibility | □ | □ | □ | □ | □ | ||
| Builder | 35 | Acknowledgement of Green Construction | □ | □ | □ | □ | □ | |
| 36 | Management Ability of Green Construction | □ | □ | □ | □ | □ | ||
| 37 | Technology Application in Design and Construction | □ | □ | □ | □ | □ | ||
| 38 | Biding Price | □ | □ | □ | □ | □ | ||
| 39 | Coordination with Designer | □ | □ | □ | □ | □ | ||
| 40 | Appointed Subcontractors | □ | □ | □ | □ | □ | ||
| Supervisor | 41 | Acknowledgement of Green Construction | □ | □ | □ | □ | □ | |
| 42 | Regulation Ability of Green Construction | □ | □ | □ | □ | □ | ||
| 43 | Regulation Experience of Green Construction | □ | □ | □ | □ | □ | ||
| 44 | Professional Ethic | □ | □ | □ | □ | □ | ||
| Supplier | 45 | Prices of Building Material and Facilities | □ | □ | □ | □ | □ | |
| 46 | Quality of Building Material and Facilities | □ | □ | □ | □ | □ | ||
| Certificate Authority | 47 | Evaluation Ability of GRBs | □ | □ | □ | □ | □ | |
| 48 | Professional Ethic | □ | □ | □ | □ | □ | ||
| Consumer | 49 | Acknowledgement for GRBD | □ | □ | □ | □ | □ | |
| 50 | Environmental Conscious | □ | □ | □ | □ | □ | ||
| 51 | Family Income | □ | □ | □ | □ | □ | ||
| 52 | Incentive Policy for Purchasing | □ | □ | □ | □ | □ | ||
| 53 | Information Acquisition of GRBs | □ | □ | □ | □ | □ | ||
| 54 | Living Habit | □ | □ | □ | □ | □ | ||
| 55 | Education Level | □ | □ | □ | □ | □ | ||
| 56 | Personality Characteristics | □ | □ | □ | □ | □ | ||
| Local Society | 57 | Location and Strategy of Local Development | □ | □ | □ | □ | □ | |
| 58 | Local Cooperation | □ | □ | □ | □ | □ | ||
| Capacity Elements | Developer | 59 | Driving Force of Economy | □ | □ | □ | □ | □ |
| 60 | Development Strategy and Innovation Orientation | □ | □ | □ | □ | □ | ||
| 61 | Acknowledgement and Positioning for GRBD | □ | □ | □ | □ | □ | ||
| 62 | Experience and Ability for GRBD | □ | □ | □ | □ | □ | ||
| 63 | Financing of the Project | □ | □ | □ | □ | □ | ||
| 64 | Management for GRBD | □ | □ | □ | □ | □ |
References
- China Association of Building Energy Efficiency (CABEE). Research Report on Building Energy Consumption in China; China Association of Building Energy Efficiency (CABEE): Beijing, China, 2017. [Google Scholar]
- Mills, E. Building commissioning: A golden opportunity for reducing energy costs and greenhouse gas emissions in the United States. Energy Effic. 2011, 4, 145–173. [Google Scholar] [CrossRef]
- Zhao, H.X.; Magoulès, F. A review on the prediction of building energy consumption. Renew. Sustain. Energy Rev. 2012, 16, 3586–3592. [Google Scholar] [CrossRef]
- Cho, S.W.; Kim, J.J. Zero energy potential of high-rise residential buildings. J. Asian Archit. Build. Eng. 2015, 14, 641–648. [Google Scholar] [CrossRef]
- Ye, L.; Cheng, Z.; Wang, Q.; Lin, H.; Lin, C.; Liu, B. Developments of green building standards in China. Renew. Energy 2015, 73, 115–122. [Google Scholar] [CrossRef]
- Collinge, W.O.; Thiel, C.L.; Campion, N.A.; Al-Ghamdi, S.G.; Woloschin, C.L.; Soratana, K. Integrating life cycle assessment with green building and product rating systems: North American perspective. Procedia Eng. 2015, 118, 662–669. [Google Scholar] [CrossRef]
- Xie, X.; Lu, Y.; Gou, Z. Green building pro-environment behaviors: Are green users also green buyers? Sustainability 2017, 9, 1703. [Google Scholar] [CrossRef]
- Zuo, J.; Pullen, S.; Rameezdeen, R.; Bennetts, H.; Wang, Y.; Mao, G. Green building evaluation from a life-cycle perspective in Australia: A critical review. Renew. Sustain. Energy Rev. 2017, 70, 358–368. [Google Scholar] [CrossRef]
- Zhai, X.Q.; Wang, R.Z.; Dai, Y.J.; Wu, J.Y.; Ma, Q. Experience on integration of solar thermal technologies with green buildings. Renew. Energy 2008, 33, 1904–1910. [Google Scholar] [CrossRef]
- Bayraktar, M.E.; Arif, F. Venture capital opportunities in green building technologies: A strategic analysis for emerging entrepreneurial companies in South Florida and Latin America. J. Manag. Eng. 2013, 29, 79–85. [Google Scholar] [CrossRef]
- Chan, A.P.C.; Darko, A.; Effah, E.A. Strategies for promoting green building technologies adoption in the construction industry—An international study. Sustainability 2017, 9, 969. [Google Scholar] [CrossRef]
- Cheng, T.C.; Cheng, C.H.; Huang, Z.Z.; Liao, G.C. Development of an energy-saving module via combination of solar cells and thermoelectric coolers for green building applications. Energy 2011, 36, 133–140. [Google Scholar] [CrossRef]
- Shazmin, S.A.A.; Sipan, I.; Sapri, M.; Ali, H.M.; Raji, F. Property tax assessment incentive for green building: Energy saving based-model. Energy 2017, 122, 329–339. [Google Scholar] [CrossRef]
- Zhang, Y.; Kang, J.; Jin, H.; Sciubba, E. A review of green building development in China from the perspective of energy saving. Energies 2018, 11, 334. [Google Scholar] [CrossRef]
- Hwang, B.G.; Zhao, X.B.; See, Y.L.; Zhong, Y. Addressing risks in green retrofit projects: The case of Singapore. Proj. Manag. J. 2015, 46, 76–89. [Google Scholar] [CrossRef]
- Zhao, X.B.; Hwang, B.G.; Gao, Y. A fuzzy synthetic evaluation approach for risk assessment: A case of Singapore’s green projects. J. Clean. Prod. 2016, 115, 203–213. [Google Scholar] [CrossRef]
- Yang, R.J.; Zou, P.X.W.; Wang, J. Modelling stakeholder-associated risk networks in green building projects. Int. J. Proj. Manag. 2016, 34, 66–81. [Google Scholar] [CrossRef]
- Hwang, B.G.; Shan, M.; Supa’at, N.N.B. Green commercial building projects in Singapore: Critical risk factors and mitigation measures. Sustain. Cities Soc. 2017, 30, 237–247. [Google Scholar] [CrossRef]
- Hsieh, T.T.; Lai, K.P.; Chiang, C.M.; Ho, M.C. Eco-efficiency model for green building material in a subtropical climate. Environ. Eng. Sci. 2013, 30, 555–572. [Google Scholar] [CrossRef]
- Suh, S.; Tomar, S.; Leighton, M.; Kneifel, J. Environmental performance of green building code and certification systems. Environ. Sci. Technol. 2014, 48, 2551–2560. [Google Scholar] [CrossRef] [PubMed]
- Hwang, B.G.; Zhao, X.B.; Tan, L.L.G. Green building projects: Schedule performance, influential factors and solutions. Eng. Constr. Archit. Manag. 2015, 22, 327–346. [Google Scholar] [CrossRef]
- Choi, E. Green on buildings: The effects of municipal policy on green building designations in America’s central cities. J. Sustain. Real Estate 2010, 2, 1–21. [Google Scholar]
- Eichholtz, P.; Quigley, J.M. Green building finance and investments: Practice, policy and research. Eur. Econ. Rev. 2012, 56, 903–904. [Google Scholar] [CrossRef]
- Kuo, C.F.J.; Lin, C.H.; Hsu, M.W. Analysis of intelligent green building policy and developing status in Taiwan. Energy Policy 2016, 95, 291–303. [Google Scholar] [CrossRef]
- Robert, R.; Melissa, M.B.; Nuri, M.G.; Kim, L.N. The economic benefits of green buildings: A comprehensive case study. Eng. Econ. 2006, 51, 259–295. [Google Scholar]
- Sweitzer, G.E. Green building acoustics: Scoring user performance factors. J. Acoust. Soc. Am. 2009, 125, 2504. [Google Scholar] [CrossRef]
- Gabay, H.; Meir, I.A.; Schwartz, M.; Werzberger, E. Cost-benefit analysis of green buildings: An Israeli office buildings case study. Energy Build. 2014, 76, 558–564. [Google Scholar] [CrossRef]
- Anand, S.; Vrat, P.; Dahiya, R.P. Application of a system dynamics approach for assessment and mitigation of CO2 emissions from the cement industry. J. Environ. Manag. 2006, 79, 383–398. [Google Scholar] [CrossRef] [PubMed]
- Li, D.; Cui, P.; Lu, Y. Development of an automated estimator of life-cycle carbon emissions for residential buildings: A case study in Nanjing, China. Habitat Int. 2016, 57, 154–163. [Google Scholar] [CrossRef]
- Huang, Z.; Yuan, H.; Shen, L. Contribution of promoting the green residence assessment scheme to energy saving. Energy Policy 2012, 51, 374–381. [Google Scholar] [CrossRef]
- Ning, Y.; Li, Y.; Yang, S.; Ju, C. Exploring socio-technical features of green interior design of residential buildings: Indicators, interdependence and embeddedness. Sustainability 2016, 9, 33. [Google Scholar] [CrossRef]
- Ye, L.; Cheng, Z.; Wang, Q.; Lin, W.; Ren, F. Overview on green building label in China. Renew. Energy 2013, 53, 220–229. [Google Scholar] [CrossRef]
- Wang, X.; Altan, H.; Kang, J. Parametric study on the performance of green residential buildings in China. Front. Archit. Res. 2015, 4, 56–67. [Google Scholar] [CrossRef]
- Deng, Y.; Wu, J. Economic returns to residential green building investment: The developers’ perspective. Reg. Sci. Urban Econ. 2013, 47, 35–44. [Google Scholar] [CrossRef]
- Gou, Z.; Prasad, D.; Lau, S.Y. Are green buildings more satisfactory and comfortable? Habitat Int. 2013, 39, 156–161. [Google Scholar] [CrossRef]
- Shi, Q.; Lai, X.; Xie, X.; Zuo, J. Assessment of green building policies—A fuzzy impact matrix approach. Renew. Sustain. Energy Rev. 2014, 36, 203–211. [Google Scholar] [CrossRef]
- Zhou, N.; Mcneil, M.; Levine, M. Assessment of building energy-saving policies and programs in China during the 11th five-year plan. Energy Effic. 2012, 5, 51–64. [Google Scholar] [CrossRef][Green Version]
- Ouyang, J.; Gao, L.; Yan, Y.; Hokao, K.; Ge, J. Effects of improved consumer behavior on energy conservation in the urban residential sector of Hangzhou, China. J. Asian Archit. Build. Eng. 2009, 8, 243–249. [Google Scholar] [CrossRef]
- Qian, Q.K.; Chan, E.H.W.; Visscher, H.; Lehmann, S. Modeling the green building (GB) investment decisions of developers and end-users with transaction costs (TCS) considerations. J. Clean. Prod. 2015, 109, 315–325. [Google Scholar] [CrossRef]
- Tinker, A.; Kreuter, U.; Burt, R.; Bame, S. Green construction: Contractor motivation and trends in Austin, Texas. J. Green Build. 2006, 1, 118–134. [Google Scholar] [CrossRef]
- Circo, C.J. Using mandates and incentives to promote sustainable construction and green building projects in the private sector: A call for more state land use policy initiatives. Penn State Law Rev. 2007, 112, 731. [Google Scholar]
- Glavinich, T.E. Contractor’s Guide to Green Building Construction; John Wiley & Sons: Hoboken, NJ, USA, 2008. [Google Scholar]
- Zuo, J.; Zhao, Z.Y. Green building research-current status and future agenda: A review. Renew. Sustain. Energy Rev. 2014, 30, 271–281. [Google Scholar] [CrossRef]
- Li, Y.Y.; Chen, P.H.; Chew, D.A.S.; Teo, C.C.; Ding, R.G. Critical project management factors of AEC firms for delivering green building projects in Singapore. J. Constr. Eng. Manag. 2011, 137, 1153–1163. [Google Scholar] [CrossRef]
- Hwang, B.G.; Tan, J.S. Green building project management: Obstacles and solutions for sustainable development. Sustain. Dev. 2012, 20, 335–349. [Google Scholar] [CrossRef]
- Williams, K.; Dair, C. What is stopping sustainable building in England? Barriers experienced by stakeholders in delivering sustainable developments. Sustain. Dev. 2007, 15, 135–147. [Google Scholar] [CrossRef]
- Shi, Q.; Zuo, J.; Huang, R.; Huang, J.; Pullen, S. Identifying the critical factors for green construction—An empirical study in China. Habitat Int. 2013, 40, 1–8. [Google Scholar] [CrossRef]
- Zhang, Y.; Wang, J.; Hu, F.; Wang, Y. Comparison of evaluation standards for green building in China, Britain, United States. Renew. Sustain. Energy Rev. 2017, 68, 262–271. [Google Scholar] [CrossRef]
- Shen, L.; Zhang, Z.; Zhang, X. Key factors affecting green procurement in real estate development: A China study. J. Clean. Prod. 2017, 153, 372–383. [Google Scholar] [CrossRef]
- Vyas, G.S.; Jha, K.N. Identification of green building attributes for the development of an assessment tool: A case study in India. Civ. Eng. Environ. Syst. 2016, 33, 313–334. [Google Scholar] [CrossRef]
- Ofori, G.; Kien, H.L. Translating Singapore architects’ environmental awareness into decision making. Build. Res. Inf. 2004, 32, 27–37. [Google Scholar] [CrossRef]
- Shen, L.Y.; Tam, V.W.Y.; Tam, L.; Ji, Y.B. Project feasibility study: The key to successful implementation of sustainable and socially responsible construction management practice. J. Clean. Prod. 2010, 18, 254–259. [Google Scholar] [CrossRef]
- Illankoon, I.M.C.S.; Tam, V.W.Y.; Le, K.N.; Shen, L. Key credit criteria among international green building rating tools. J. Clean. Prod. 2017, 164, 209–220. [Google Scholar] [CrossRef]
- Lam, P.T.; Chan, E.H.; Poon, C.; Chau, C.; Chun, K. Factors affecting the implementation of green specifications in construction. J. Environ. Manag. 2010, 91, 654–661. [Google Scholar] [CrossRef] [PubMed]
- Wong, J.K.W.; Chan, J.K.S.; Wadu, M.J. Facilitating effective green procurement in construction projects: An empirical study of the enablers. J. Clean. Prod. 2016, 135, 859–871. [Google Scholar] [CrossRef]
- Yang, W.F.; Zhang, Y.L. Research on factors of green purchasing practices of Chinese. J. Bus. Manag. Econ. 2012, 3, 222–231. [Google Scholar]
- Elrazek, M.E.A.; Bassioni, H.A.; Mobarak, A.M. Causes of delay in building construction projects in Egypt. J. Constr. Eng. Manag. 2008, 134, 831–841. [Google Scholar]
- Mi, J.K.; Oh, M.W.; Kim, J.T. A method for evaluating the performance of green buildings with a focus on user experience. Energy Build. 2013, 66, 203–210. [Google Scholar]
- Liu, Y.; Hong, Z.; Zhu, J.; Yan, J.; Qi, J.; Liu, P. Promoting green residential buildings: Residents’ environmental attitude, subjective knowledge, and social trust matter. Energy Policy 2018, 112, 152–161. [Google Scholar] [CrossRef]
- Korkmaz, S.; Riley, D.; Horman, M. Piloting evaluation metrics for sustainable, high performance building project delivery. J. Constr. Eng. Manag. 2010, 19, 877–885. [Google Scholar] [CrossRef]
- Marker, A.W.; Mason, S.G.; Morrow, P. Change factors influencing the diffusion and adoption of green building practices. Perfom. Improv. Quart. 2014, 26, 5–24. [Google Scholar] [CrossRef]
- Hwang, B.G.; Zhu, L.; Ming, J.T.T. Factors affecting productivity in green building construction projects: The case of Singapore. J. Manag. Eng. 2016, 33, 04016052. [Google Scholar] [CrossRef]
- Li, Y.Y.; Chen, P.H.; Chew, D.A.S.; Teo, C.C. Exploration of critical resources and capabilities of design firms for delivering green building projects: Empirical studies in Singapore. Habitat Int. 2014, 41, 229–235. [Google Scholar] [CrossRef]
- Shen, W.; Tang, W.; Siripanan, A.; Lei, Z.; Duffield, C.F.; Wilson, D. Critical success factors in Thailand’s green building industry. J. Asian Archit. Build. Eng. 2017, 16, 317–324. [Google Scholar] [CrossRef]
- Lin, N. Social Resources and Instrumental Action on Social Structure and Network Analysis; Lin Sage Publications: London, UK, 1982. [Google Scholar]
- Knoke, D.; Yang, S. Social Network Analysis (Quantitative Applications in the Social Sciences); Sage: Los Angeles, CA, USA, 2008. [Google Scholar]
- Ernstson, H.; Sverker, S.; Elmqvist, T. Social movements and ecosystem services-the role of social network structure in protecting and managing urban green areas in Stockholm. Ecol. Soc. 2008, 13, 3545–3549. [Google Scholar] [CrossRef]
- Dickinson, J.L.; Crain, R.L.; Reeve, H.K.; Schuldt, J.P. Can evolutionary design of social networks make it easier to be ‘green’? Trends Ecol. Evol. 2013, 28, 561–569. [Google Scholar] [CrossRef] [PubMed]
- Yang, R.J.; Zou, P. Stakeholder-associated risks and their interactions in complex green building projects: A social network model. Build. Environ. 2014, 73, 208–222. [Google Scholar] [CrossRef]
- Yu, T.; Shen, G.Q.P.; Shi, Q.; Lai, X.D.; Li, C.Z.D.; Xu, K.X. Managing social risks at the housing demolition stage of urban redevelopment projects: A stakeholder-oriented study using social network analysis. Int. J. Proj. Manag. 2017, 35, 925–941. [Google Scholar] [CrossRef]
- El-Diraby, T.; Krijnen, T.; Papagelis, M. Bim-based collaborative design and socio-technical analytics of green buildings. Automat. Constr. 2017, 82, 59–74. [Google Scholar] [CrossRef]
- Mok, K.Y.; Shen, G.Q.; Yang, R.J.; Li, C.Z. Investigating key challenges in major public engineering projects by a network-theory based analysis of stakeholder concerns: A case study. Int. J. Proj. Manag. 2017, 35, 78–94. [Google Scholar] [CrossRef]
- Zhao, X.B.; Hwang, B.G.; Hong, N.L. Identifying critical leadership styles of project managers for green building projects. Int. J. Constr. Manag. 2016, 16, 150–160. [Google Scholar] [CrossRef]
- Wu, P.; Song, Y.; Wang, J.; Wang, X.; Zhao, X.B.; He, Q. Regional variations of credits obtained by LEED 2009 certified green buildings—A country level analysis. Sustainability 2017, 10, 20. [Google Scholar] [CrossRef]
- Hwang, B.G.; Shan, M.; Looi, K.Y. Key constraints and mitigation strategies for prefabricated prefinished volumetric construction. J. Clean. Prod. 2018, 183, 183–193. [Google Scholar] [CrossRef]
- Ming, S.; Chan, A.P.C.; Yun, L.; Yi, H. Investigating the effectiveness of response strategies for vulnerabilities to corruption in the Chinese public construction sector. Sci. Eng. Ethics 2015, 21, 683–705. [Google Scholar]
- Zhao, X.; Chang, T.; Hwang, B.G.; Deng, X. Critical factors influencing business model innovation for sustainable buildings. Sustainability 2017, 10, 33. [Google Scholar] [CrossRef]
- Hwang, B.G.; Shan, M.; Phua, H.; Chi, S. An exploratory analysis of risks in green residential building construction projects: The case of Singapore. Sustainability 2017, 9, 1116. [Google Scholar] [CrossRef]
- De Vaus, D. Analyzing Social Science Data; SAGE Publications: London, UK, 2002. [Google Scholar]
- Kaiser, H.F. A second generation little jiffy. Psychometrika 1970, 35, 401–415. [Google Scholar] [CrossRef]
- Landherr, D.M.O.A.; Friedl, D.M.B.; Heidemann, J. A critical review of centrality measures in social networks. Bus. Inform. Syst. Eng. 2010, 2, 371–385. [Google Scholar] [CrossRef]
- Freeman, L.C. Centrality in social networks conceptual clarification. Soc. Netw. 1978, 1, 215–239. [Google Scholar] [CrossRef]
- Freeman, L.C.; Roeder, D.; Mulholland, R.R. Centrality in social networks: II. Experimental results. Soc. Netw. 1979, 2, 119–141. [Google Scholar] [CrossRef]
- Okamoto, K.; Chen, W.; Li, X.Y. Ranking of Closeness Centrality for Large-Scale Social Networks; Springer: Berlin/Heidelberg, Germany, 2008. [Google Scholar]
- Freeman, L.C. A set of measures of centrality based on betweenness. Sociometry 1977, 40, 35–41. [Google Scholar] [CrossRef]
- Rousseau, R.; Zhang, L. Betweenness centrality and q-measures in directed valued networks. Scientometrics 2008, 75, 575–590. [Google Scholar] [CrossRef]
- GB/T 50378-2014. Assessment Standard for Green Building; Ministry of Housing and Urban-Rural Development of the People’s Republic of China (MOHURD): Beijing, China, 2014.
- Richardson, G.R.A.; Lynes, J.K. Institutional motivations and barriers to the construction of green buildings on campus: A case study of the University of Waterloo, Ontario. Int. J. Sustain. High. Educ. 2007, 8, 339–354. [Google Scholar] [CrossRef]
- Zhao, X.B.; Hwang, B.G.; Yu, G.S. Identifying the critical risks in underground rail international construction joint ventures: Case study of Singapore. Int. J. Proj. Manag. 2013, 31, 554–566. [Google Scholar] [CrossRef]
- Jamison, A. Turning Engineering Green: Sustainable Development and Engineering Education. Engineering, Development and Philosophy; Springer: Dordrecht, The Netherlands, 2012. [Google Scholar]
- GreenBiz Group. Green Building Technique: A Two-Minute Briefing on Key Business Environmental Issues; GreenBiz Group Inc.: Oakland, CA, USA, 2005. [Google Scholar]
- Kats, G.; Alevantis, L.; Berman, A.; Mills, E.; Perlman, J. The Costs and Financial Benefits of Green Buildings; Massachusetts Technology Collaborative: Westborough, MA, USA, 2003. [Google Scholar]
- Bromilow, F.; Pawsey, M. Life cycle cost of university buildings. Constr. Manag. Econ. 1987, 5, 3–22. [Google Scholar] [CrossRef]
- Dochinger, L.S. Interception of airborne particles by tree plantings. J. Environ. Qual. 1980, 9, 265–268. [Google Scholar] [CrossRef]


| Element | Cronbach’s Alpha | Category | Number of Questions | Cronbach’s Alpha |
|---|---|---|---|---|
| Environmental Elements | 0.707 | Political Environment | 6 | 0.771 |
| Economic Environment | 4 | 0.946 | ||
| Social Environment | 2 | 0.770 | ||
| Juristic Environment | 3 | 0.842 | ||
| Natural Environment | 3 | 0.887 | ||
| Technical Environment | 2 | 0.745 | ||
| Resource Elements | 0.705 | Government | 2 | 0.738 |
| Marketing Agency | 3 | 0.847 | ||
| Bank | 2 | 0.789 | ||
| Research Institute | 2 | 0.917 | ||
| Designer | 5 | 0.744 | ||
| Builder | 6 | 0.773 | ||
| Supervisor | 4 | 0.974 | ||
| Supplier | 2 | 0.786 | ||
| Certificate Authority | 2 | 0.846 | ||
| Consumer | 8 | 0.814 | ||
| Local Society | 2 | 0.816 | ||
| Capacity Elements | 0.770 | Developer | 6 | 0.770 |
| Component | |||||
|---|---|---|---|---|---|
| 1 | 2 | 3 | 4 | 5 | |
| I1 | 0.866 | 0.204 | 0.089 | 0.254 | 0.080 |
| I2 | 0.842 | 0.229 | −0.036 | 0.217 | 0.246 |
| I7 | 0.073 | 0.124 | 0.140 | 0.151 | 0.903 |
| I19 | 0.221 | 0.906 | 0.103 | 0.083 | 0.134 |
| I21 | 0.830 | 0.219 | 0.214 | 0.177 | −0.099 |
| I32 | 0.221 | 0.710 | −0.001 | 0.179 | 0.086 |
| I37 | 0.132 | 0.909 | −0.087 | 0.007 | 0.107 |
| I49 | 0.095 | −0.084 | 0.136 | 0.870 | −0.120 |
| I51 | 0.252 | 0.214 | 0.080 | 0.857 | 0.091 |
| I52 | 0.283 | 0.193 | 0.069 | 0.729 | 0.129 |
| I58 | 0.075 | 0.155 | 0.189 | −0.098 | 0.889 |
| I60 | 0.103 | 0.096 | 0.810 | 0.047 | 0.242 |
| I61 | -0.040 | −0.068 | 0.883 | 0.108 | 0.102 |
| I62 | 0.163 | −0.015 | 0.858 | 0.106 | 0.023 |
| Primary Indexes | Secondary Indexes |
|---|---|
| Government | Mandatory Policy for Developing (U1) |
| Incentive Policy for Developing (U2) | |
| Strictness of Examination and Approval (U3) | |
| Local | Local Economy Development Level (U4) |
| Local Cooperation (U5) | |
| Technology | Technology Level of GRBs (U6) |
| Design Level of GRBs (U7) | |
| Technology Application in Design and Construction (U8) | |
| Consumer | Consumers’ Acknowledgement for GRBD (U9) |
| Consumers’ Income (U10) | |
| Incentive Policy for Purchasing (U11) | |
| Developer | Development Strategy and Innovation Orientation (U12) |
| Developer’s Acknowledgement and Positioning for GRBD (U13) | |
| Experience and Ability for GRBD (U14) |
| 0: No Relation, 1: Weak Relation, 2: Moderate Relation, 3: Strong Relation | Project Acquiring Phase | Project Preparing Phase | Project Designing Phase | Project Constructing Phase | Project Selling Phase |
|---|---|---|---|---|---|
| Mandatory Policy for Developing (U1) | 2.56 | 1.89 | 2.11 | 1.67 | 1.00 |
| Incentive Policy for Developing (U2) | 1.89 | 1.67 | 1.59 | 1.15 | 1.30 |
| Strictness of Examination and Approval (U3) | 2.48 | 2.22 | 2.22 | 1.89 | 1.30 |
| Local Economy Development Level (U4) | 2.26 | 1.74 | 1.70 | 1.41 | 1.70 |
| Local Cooperation (U5) | 1.89 | 1.78 | 1.63 | 1.48 | 1.44 |
| Technology Level of GRBs (U6) | 1.56 | 1.33 | 2.37 | 2.00 | 1.15 |
| Design Level of GRBs (U7) | 1.37 | 1.33 | 2.56 | 1.78 | 1.11 |
| Technology Application in Design and Construction (U8) | 1.26 | 1.15 | 2.26 | 2.41 | 1.26 |
| Consumers’ Acknowledgement for GRBD (U9) | 1.22 | 1.00 | 1.44 | 1.11 | 2.11 |
| Consumers’ Income (U10) | 1.04 | 0.89 | 0.85 | 0.78 | 2.52 |
| Incentive Policy for Purchasing (U11) | 1.37 | 0.89 | 0.93 | 0.67 | 2.19 |
| Development Strategy and Innovation Orientation (U12) | 2.19 | 1.78 | 1.93 | 1.59 | 1.48 |
| Developer’s Acknowledgement and Positioning for GRBD (U13) | 2.19 | 1.74 | 1.93 | 1.26 | 1.63 |
| Experience and Ability for GRBD (U14) | 1.78 | 1.89 | 1.93 | 1.70 | 1.59 |
| U1 | U2 | U3 | U4 | U5 | U6 | U7 | U8 | U9 | U10 | U11 | U12 | U13 | U14 | |
|---|---|---|---|---|---|---|---|---|---|---|---|---|---|---|
| U1 | - | 14.57 | 19.69 | 16.72 | 15.55 | 16.00 | 15.51 | 15.45 | 12.02 | 9.96 | 10.46 | 17.18 | 16.70 | 16.63 |
| U2 | 14.57 | - | 15.79 | 13.71 | 12.71 | 12.73 | 12.37 | 12.30 | 10.28 | 8.98 | 9.17 | 13.93 | 13.68 | 13.61 |
| U3 | 19.69 | 15.79 | - | 18.12 | 16.93 | 17.36 | 16.84 | 16.89 | 13.28 | 11.19 | 11.55 | 18.60 | 18.08 | 18.17 |
| U4 | 16.72 | 13.71 | 18.12 | - | 14.67 | 14.64 | 14.16 | 14.23 | 12.10 | 10.73 | 10.89 | 16.09 | 15.81 | 15.69 |
| U5 | 15.55 | 12.71 | 16.93 | 14.67 | - | 13.79 | 13.36 | 13.49 | 11.11 | 9.72 | 9.83 | 14.94 | 14.59 | 14.68 |
| U6 | 16.00 | 12.73 | 17.36 | 14.64 | 13.79 | - | 14.81 | 15.12 | 11.29 | 9.28 | 9.38 | 15.24 | 14.70 | 15.09 |
| U7 | 15.51 | 12.37 | 16.84 | 14.16 | 13.36 | 14.81 | - | 14.73 | 11.01 | 8.97 | 9.06 | 14.78 | 14.31 | 14.68 |
| U8 | 15.45 | 12.30 | 16.89 | 14.23 | 13.49 | 15.12 | 14.73 | - | 11.28 | 9.31 | 9.23 | 14.86 | 14.21 | 14.88 |
| U9 | 12.02 | 10.28 | 13.28 | 12.10 | 11.11 | 11.29 | 11.01 | 11.28 | - | 9.57 | 9.27 | 12.12 | 12.03 | 12.08 |
| U10 | 9.96 | 8.98 | 11.19 | 10.73 | 9.72 | 9.28 | 8.97 | 9.31 | 9.57 | - | 9.05 | 10.47 | 10.56 | 10.51 |
| U11 | 10.46 | 9.17 | 11.55 | 10.89 | 9.83 | 9.38 | 9.06 | 9.23 | 9.27 | 9.05 | - | 10.69 | 10.76 | 10.54 |
| U12 | 17.18 | 13.93 | 18.60 | 16.09 | 14.94 | 15.24 | 14.78 | 14.86 | 12.12 | 10.47 | 10.69 | - | 16.03 | 16.04 |
| U13 | 16.70 | 13.68 | 18.08 | 15.81 | 14.59 | 14.70 | 14.31 | 14.21 | 12.03 | 10.56 | 10.76 | 16.03 | - | 15.65 |
| U14 | 16.63 | 13.61 | 18.17 | 15.69 | 14.68 | 15.09 | 14.68 | 14.88 | 12.08 | 10.51 | 10.54 | 16.04 | 15.65 | - |
| FREEMAN’S DEGREE CENTRALITY MEASURES | ||||
| Degree | NrmDegree | Share | ||
| U12 | Development Strategy and Innovation Orientation | 13.000 | 100.00 | 0.088 |
| U13 | Developer’s Acknowledgement and Positioning for GRBD | 13.000 | 100.00 | 0.088 |
| U4 | Local Economy Development Level | 12.000 | 92.308 | 0.081 |
| U14 | Experience and Ability for GRBD | 12.000 | 92.308 | 0.081 |
| U2 | Incentive Policy for Developing | 11.000 | 84.615 | 0.074 |
| U1 | Mandatory Policy for Developing | 11.000 | 84.615 | 0.074 |
| U8 | Technology Application in Design and Construction | 11.000 | 84.615 | 0.074 |
| U6 | Technology Level of GRBs | 11.000 | 84.615 | 0.074 |
| U7 | Design Level of GRBs | 11.000 | 84.615 | 0.074 |
| U3 | Strictness of Examination and Approval | 10.000 | 76.923 | 0.068 |
| U5 | Local Cooperation | 10.000 | 76.923 | 0.068 |
| U9 | Consumers’ Acknowledgement for GRBD | 10.000 | 76.923 | 0.068 |
| U11 | Incentive Policy for Purchasing | 7.000 | 53.846 | 0.047 |
| U10 | Consumers’ Income | 6.000 | 46.154 | 0.041 |
| DESCRIPTIVE STATISTICS | ||||
| Degree | NrmDegree | Share | ||
| 1 | Mean | 10.571 | 81.319 | 0.071 |
| 2 | StdDev | 1.917 | 14.743 | 0.013 |
| 3 | Sum | 148.000 | 1138.462 | 1.000 |
| 4 | Variance | 3.673 | 217.365 | 0.000 |
| 5 | SSQ | 1616.000 | 95,621.305 | 0.074 |
| 6 | MCSSQ | 51.429 | 3043.111 | 0.002 |
| 7 | Euc Norm | 40.200 | 309.227 | 0.272 |
| 8 | Minimum | 6.000 | 46.154 | 0.041 |
| 9 | Maximum | 13.000 | 100.000 | 0.088 |
| Network Centralization = 21.79% | ||||
| CLOSENESS CENTRALITY | |||
| Farness | nCloseness | ||
| U12 | Development Strategy and Innovation Orientation | 13.000 | 100.000 |
| U13 | Developer’s Acknowledgement and Positioning for GRBD | 13.000 | 100.000 |
| U4 | Local Economy Development Level | 14.000 | 92.857 |
| U14 | Experience and Ability for GRBD | 14.000 | 92.857 |
| U1 | Mandatory Policy for Developing | 15.000 | 86.667 |
| U2 | Incentive Policy for Developing | 15.000 | 86.667 |
| U6 | Technology Level of GRBs | 15.000 | 86.667 |
| U7 | Design Level of GRBs | 15.000 | 86.667 |
| U8 | Technology Application in Design and Construction | 15.000 | 86.667 |
| U3 | Strictness of Examination and Approval | 16.000 | 81.250 |
| U5 | Local Cooperation | 16.000 | 81.250 |
| U9 | Consumers’ Acknowledgement for GRBD | 16.000 | 81.250 |
| U11 | Incentive Policy for Purchasing | 19.000 | 68.421 |
| U10 | Consumers’ Income | 20.000 | 65.000 |
| DESCRIPTIVE STATISTICS | |||
| Farness | nCloseness | ||
| 1 | Mean | 15.429 | 85.444 |
| 2 | StdDev | 1.917 | 9.642 |
| 3 | Sum | 216.000 | 1196.219 |
| 4 | Variance | 3.673 | 92.975 |
| 5 | SSQ | 3384.000 | 103,511.578 |
| 6 | MCSSQ | 51.429 | 1301.645 |
| 7 | Euc Norm | 58.172 | 321.732 |
| 8 | Minimum | 13.000 | 65.000 |
| 9 | Maximum | 20.000 | 100.000 |
| Network Centralization = 32.66% | |||
| BETWEENNESS CENTRALITY | |||
| Betweenness | nBetweenness | ||
| U12 | Development Strategy and Innovation Orientation | 2.995 | 3.840 |
| U13 | Developer’s Acknowledgement and Positioning for GRBD | 2.995 | 3.840 |
| U4 | Local Economy Development Level | 2.704 | 3.467 |
| U14 | Experience and Ability for GRBD | 1.952 | 2.503 |
| U9 | Consumers’ Acknowledgement for GRBD | 1.534 | 1.966 |
| U1 | Mandatory Policy for Developing | 1.404 | 1.800 |
| U2 | Incentive Policy for Developing | 1.134 | 1.454 |
| U11 | Incentive Policy for Purchasing | 0.602 | 0.772 |
| U6 | Technology Level of GRBs | 0.452 | 0.580 |
| U7 | Design Level of GRBs | 0.452 | 0.580 |
| U8 | Technology Application in Design and Construction | 0.452 | 0.580 |
| U10 | Consumers’ Income | 0.143 | 0.183 |
| U3 | Strictness of Examination and Approval | 0.091 | 0.117 |
| U5 | Local Cooperation | 0.091 | 0.117 |
| DESCRIPTIVE STATISTICS | |||
| Betweenness | nBetweenness | ||
| 1 | Mean | 1.214 | 1.557 |
| 2 | StdDev | 1.036 | 1.329 |
| 3 | Sum | 17.000 | 21.795 |
| 4 | Variance | 1.074 | 1.766 |
| 5 | SSQ | 35.682 | 58.648 |
| 6 | MCSSQ | 15.039 | 24.719 |
| 7 | Euc Norm | 5.973 | 7.658 |
| 8 | Minimum | 0.091 | 0.117 |
| 9 | Maximum | 2.995 | 3.840 |
| Network Centralization Index = 2.46% | |||
© 2018 by the authors. Licensee MDPI, Basel, Switzerland. This article is an open access article distributed under the terms and conditions of the Creative Commons Attribution (CC BY) license (http://creativecommons.org/licenses/by/4.0/).
Share and Cite
Yang, X.; Zhang, J.; Zhao, X. Factors Affecting Green Residential Building Development: Social Network Analysis. Sustainability 2018, 10, 1389. https://doi.org/10.3390/su10051389
Yang X, Zhang J, Zhao X. Factors Affecting Green Residential Building Development: Social Network Analysis. Sustainability. 2018; 10(5):1389. https://doi.org/10.3390/su10051389
Chicago/Turabian StyleYang, Xiaodong, Jiayu Zhang, and Xianbo Zhao. 2018. "Factors Affecting Green Residential Building Development: Social Network Analysis" Sustainability 10, no. 5: 1389. https://doi.org/10.3390/su10051389
APA StyleYang, X., Zhang, J., & Zhao, X. (2018). Factors Affecting Green Residential Building Development: Social Network Analysis. Sustainability, 10(5), 1389. https://doi.org/10.3390/su10051389