Article

The Carbon Impact of International Tourists to an Island Country

1
Program of Landscape and Recreation, National Chung Hsing University, 145 Xingda Rd., Taichung 402, Taiwan
2
Department of Architecture, National Cheng Kung University, 1 University Rd., Tainan 701, Taiwan
3
Department of Leisure and Recreation, National Formosa University, 64 Wunhua Rd., Yunlin 632, Taiwan
*
Author to whom correspondence should be addressed.
Sustainability 2018, 10(5), 1386; https://doi.org/10.3390/su10051386
Submission received: 30 March 2018 / Revised: 22 April 2018 / Accepted: 28 April 2018 / Published: 1 May 2018

Abstract

:
Taiwan, located in the East Asia, is an island country with limited natural resources. To increase economic growth and reduce CO2 emission levels, the Taiwanese government is promoting a sustainable low-carbon tourism industry. This study investigated the CO2 emission coefficient of tourist activities and identified the CO2 emissions (CE) patterns of international visitors to Taiwan. The total CO2 emission per visitor without considering international transportation was estimated using a questionnaire. The total CO2 emission comprises the CO2 emission of transportation, the CO2 emission of accommodation, and the CO2 emission of tourist activities. The results suggest that more convenient public transportation might help to reduce the total CO2 emission. Without considering CO2 emission from international air travel, in contrast to many non-island countries where CO2 emission of transportation is the main contributor to total CO2 emission, the CO2 emission of accommodation was the main contributor to total CO2 emission in Taiwan. To reduce the CO2 emission of accommodation, the Taiwanese government should improve the energy-use efficiency of devices in tourist hotels and promote bed-and-breakfast accommodations with low CO2 emission coefficients. Visitors enjoyed culinary journeys and shopping, both of which are activities that contribute highly to the CO2 emission of tourist activities because of their high CO2 emission coefficients.

1. Introduction

Tourism brings economic benefits, but also consumes resources and contributes to emissions of various greenhouse gases, including CO2 [1]. Global tourism is becoming increasingly less sustainable [2]. In other words, much greater consideration and dissemination of these issues is required to inform future tourism development and travel decisions [3,4]. Tourism development increases energy demand within various sectors, such as transportation, accommodation, water supply, and the management of tourist attractions [5]. Two methods, namely top-down and bottom-up, have been commonly adopted to estimate the quantity of CO2 emissions being produced (CE) [6]. The top-down method approximates the percentage of CE from tourism in the entire system, while the bottom-up approach analyzes data from tourists arriving at destinations [7]. Tourism CO2 emissions have mainly been divided it into three sections: transportation, accommodation, and activities [8]. Lots of researchers have used a bottom-up approach to explore the influences of the three sections on the total CO2 emission [9]. It has previously been shown that the tourism industry accounts for approximately 3.2% of the world’s total amount of energy consumption [10], and tourism directly accounts for approximately 4.4% of CE [11]. Tourism CE can be direct (e.g., use of fossil fuels) or indirect (e.g., electricity consumption) energy use. Forty percent of CE is conservatively attributed to tourist air travel [12]. Consequently, studies have investigated the relationships between tourism development, energy demand, environmental degradation, and CE using the environmental Kuznets curve framework and have proposed policy recommendations and dynamical system models to ensure improvements in environmental protection and economic growth [13,14,15].
The CE calculation takes into account tourism-related items and the corresponding CE coefficients (CECs) [16]. The CE level was found to have a significant correlation with the energy consumption per unit guestroom in Nigeria [17]. Previous studies have indicated that tourism CE is dominated by tourism transport-induced CE [18], with the CEs from road and air transport being the largest and second largest contributors, respectively, to passenger transport CE since 1998 [19]. However, the monthly CE of tourism-associated transportation differed significantly [20]. An increase in tourism activities also increases the energy demand of transportation and accommodation [5,8]. Previous studies have also reported differences in the tourism characteristics of international and domestic travel, such as choice of destination, travel distance, travel motivation, adventure tourism trend, public policies, and climatic conditions [21,22,23,24,25]. For example, young domestic and international tourists exhibit different patterns of tourism behavior because of differences in physical, cultural, and perceptual components [26]. Overall, different countries generate different tourism CEs because of differences in tourism resources and accommodation and transportation conditions; moreover, domestic and international tourists differ in their tourism behaviors.
Taiwan, located in East Asia, is an island country with limited natural resources. Taiwan largely depends on imported energy [27] and the resulting CEs affect Taiwan’s environmental sustainability. Therefore, the Taiwanese government is devoted to actively developing a low-carbon tourism industry, given its abundant tourism resources. However, the limited information available on the CE of international visitors has hindered the government’s ability to propose a strategy for developing low-carbon tourism. Hence, the objective of this study was to identify the CE patterns of international visitors and to provide the government adequate data to develop a low-carbon tourism industry by (1) calculating the CEC of tourist activities by analyzing the energy consumption of common tourist activities in Taiwan; (2) investigating the travel journeys of international visitors by administering interview questionnaires; and (3) estimating the CE. Furthermore, this study proposes strategies to implement low-carbon tourism on the basis of the identified patterns.
In the following paragraphs, firstly, the study site and investigation method for carbon emission are summarized, and then the estimation and mathematical model of carbon emission per person is described in detail. Finally, the calculated results, including the total CE of each international tourist (TolCO2), transportation CE of each international tourist (TCO2), accommodation of each international tourist (RCO2), and tourist activity (ACO2), are illustrated. In addition, CE patterns for different visiting periods and purposes are analyzed, and then some tourism policies for international tourists are suggested.

2. Methodology

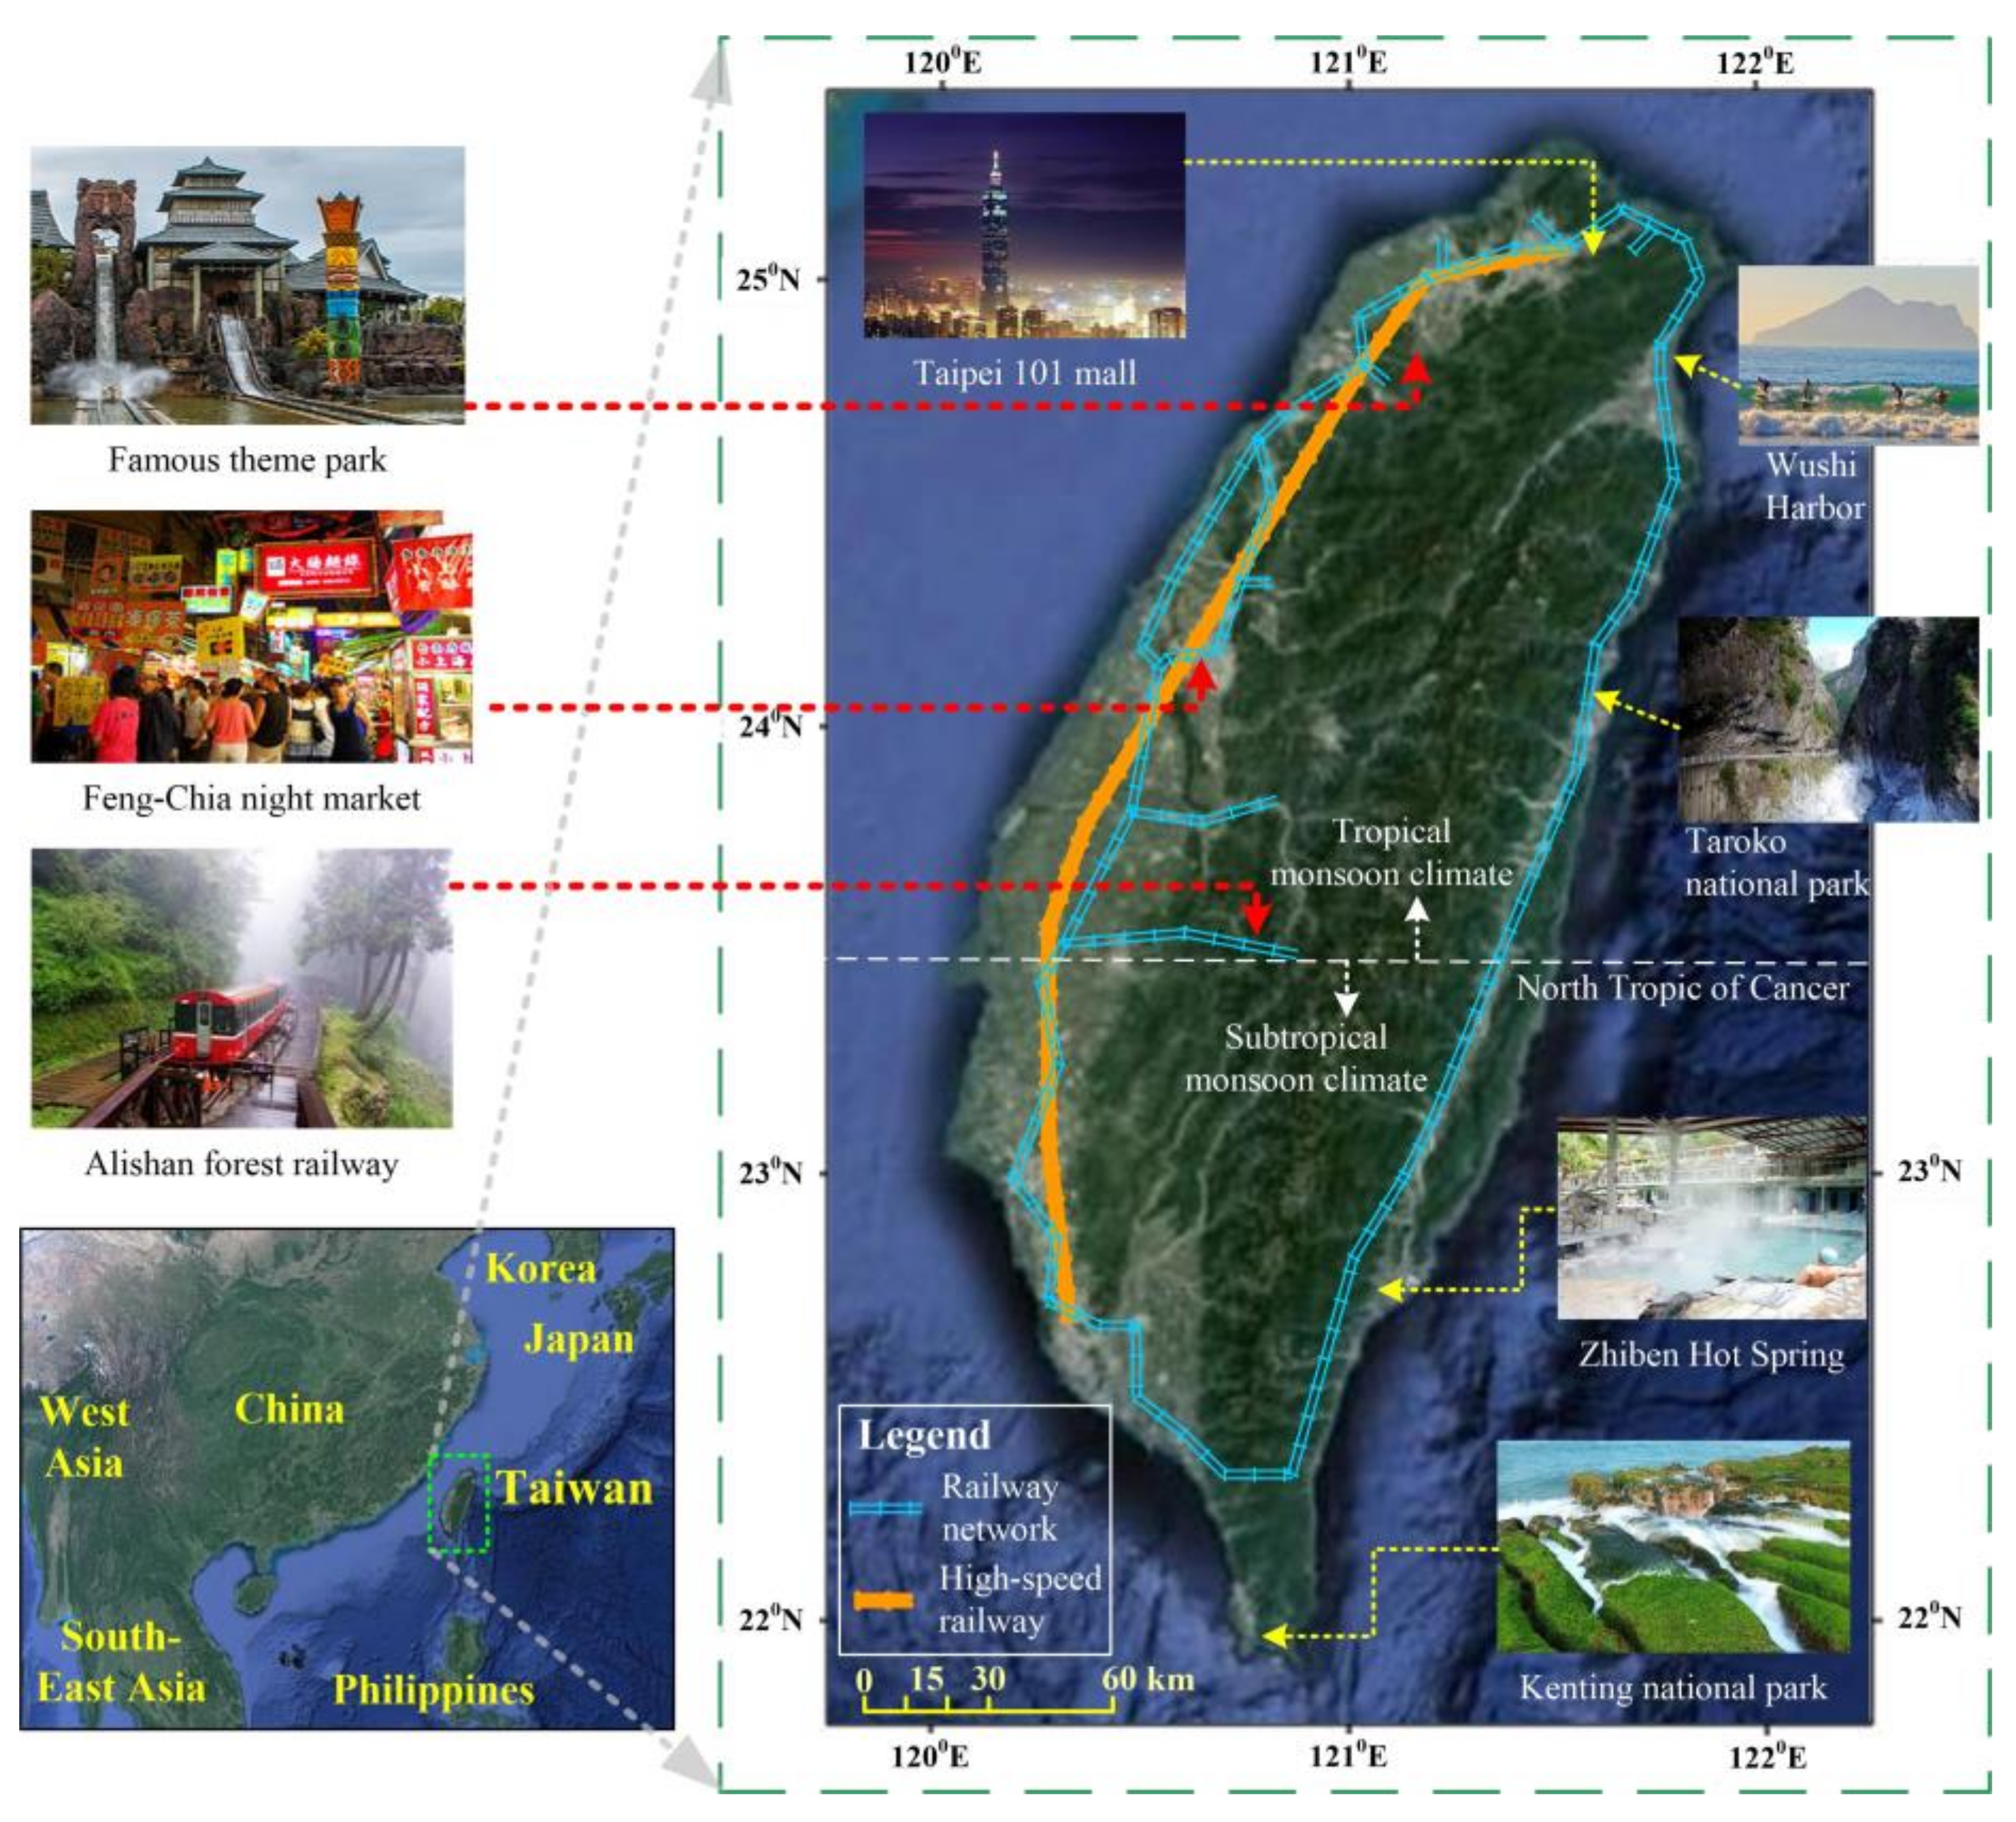
2.1. Tourism in Taiwan and Interview Questionnaire

Taiwan’s topography is narrow at both ends, and the land area is approximately 36,000 km2 (Figure 1). Taiwan is located in tropical and subtropical zones and experiences four seasons; it has abundant natural tourist attractions, some of which include numerous mountains with peaks rising over 3000 m and nine national parks. Taiwan is also among the world’s top 15 hot springs sites. Moreover, Taiwan is known for its unique delicacies, and its night markets are popular tourist attractions. A convenient island railway network offer easy access to various tourists locations; moreover, the unique mountain railway line, Alishan Forest Railway, is itself a tourist activity. In addition, Taiwan has many large shopping centers, such as the Taipei 101 mall that offer various food, leisure, and entertainment services. Given the abundance of tourist activities, approximately 10.4 million international tourists visited Taiwan in 2015.
This study adopted the bottom-up approach based on the Revised Guidelines for National Greenhouse Gas Inventories [28] to estimate the CE associated with tourism transport in Taiwan. The total CE level of tourism depends on the travel journey and is the sum of the CE of the associated transportation, accommodation, and tourist activities [29]. In this study, international tourists were administered a questionnaire in common tourist locations, such as popular attractions, airports, and high-speed rail (HSR) stations. Travel dates, main transportation modes and itineraries, departure points and accommodation types were recorded (Table 1, Table 2 and Table 3). According to a previous classification of tourist activities [30], 14 common activities in Taiwan (p = 14) were included in this study (Table 3). The sites where the tourists engaged in the activities (e.g., Zhiben Hot Spring, Taipei-101, Wushi Harbor, and Feng-Chia Night Market) are indicated in Figure 1. In addition, travel purposes were recorded to explore the pattern of international travel to Taiwan. In total, 187 questionnaires were analyzed, and the CEs of transportation, accommodation, and tourist activities were estimated.

2.2. Estimation of Carbon Emission per Person

Based on the bottom-up approach of CE estimation, the TolCO2, (kg CO2/person) is the sum of the TCO2 (kg CO2/person), RCO, (kg CO2/person), and ACO2 (kg CO2/person), as expressed in Equations (1)–(4). Furthermore, the annual CE of international visitors (ACEIV) was estimated using Equation (5).
T o l C O 2 = T C O 2 + R C O 2 + A C O 2
T C O 2 = i = 1 m M i D i i
R C O 2 = j = 1 n R j S j
A C O 2 = k = 1 p A k T k
A C E I V = i = 1 q N l E l
The CECs of the six transportation modes (m = 6) and five types of accommodation (n = 5) are listed in Table 1 and Table 2, respectively. Here, Mi is the average CEC of the ith transportation mode (kg CO2/km), Di is the average distance travelled by an international visitor using the ith transportation mode (km), Rj is the average CEC of the jth accommodation type (kg CO2/person-night). International tourist hotels offer highly energy-consuming facilities and services, such as swimming pools and spas and hence, have higher CEC values. Sj is the number of nights an international visitor stayed in jth hotel (night). Ak is the average CEC of the kth tourist activity and is defined as CE per activity (kg CO2), and Tk is the number of visitors engaging in the kth tourist activity. Rj and Sj have been described in and were adopted from previous studies [7,9]. Nl is the number of international visitors from lth continent, and Sl is the average CE of international visitors from lth continent. The estimated CECs of the 14 investigated tourist activities are listed in Table 3 [31]. The energy of each tourist activity per annum and the annual number of people engaging in a particular activity were determined from questionnaire responses; subsequently, the average CEC for activities was estimated [31].

3. Results and Discussion

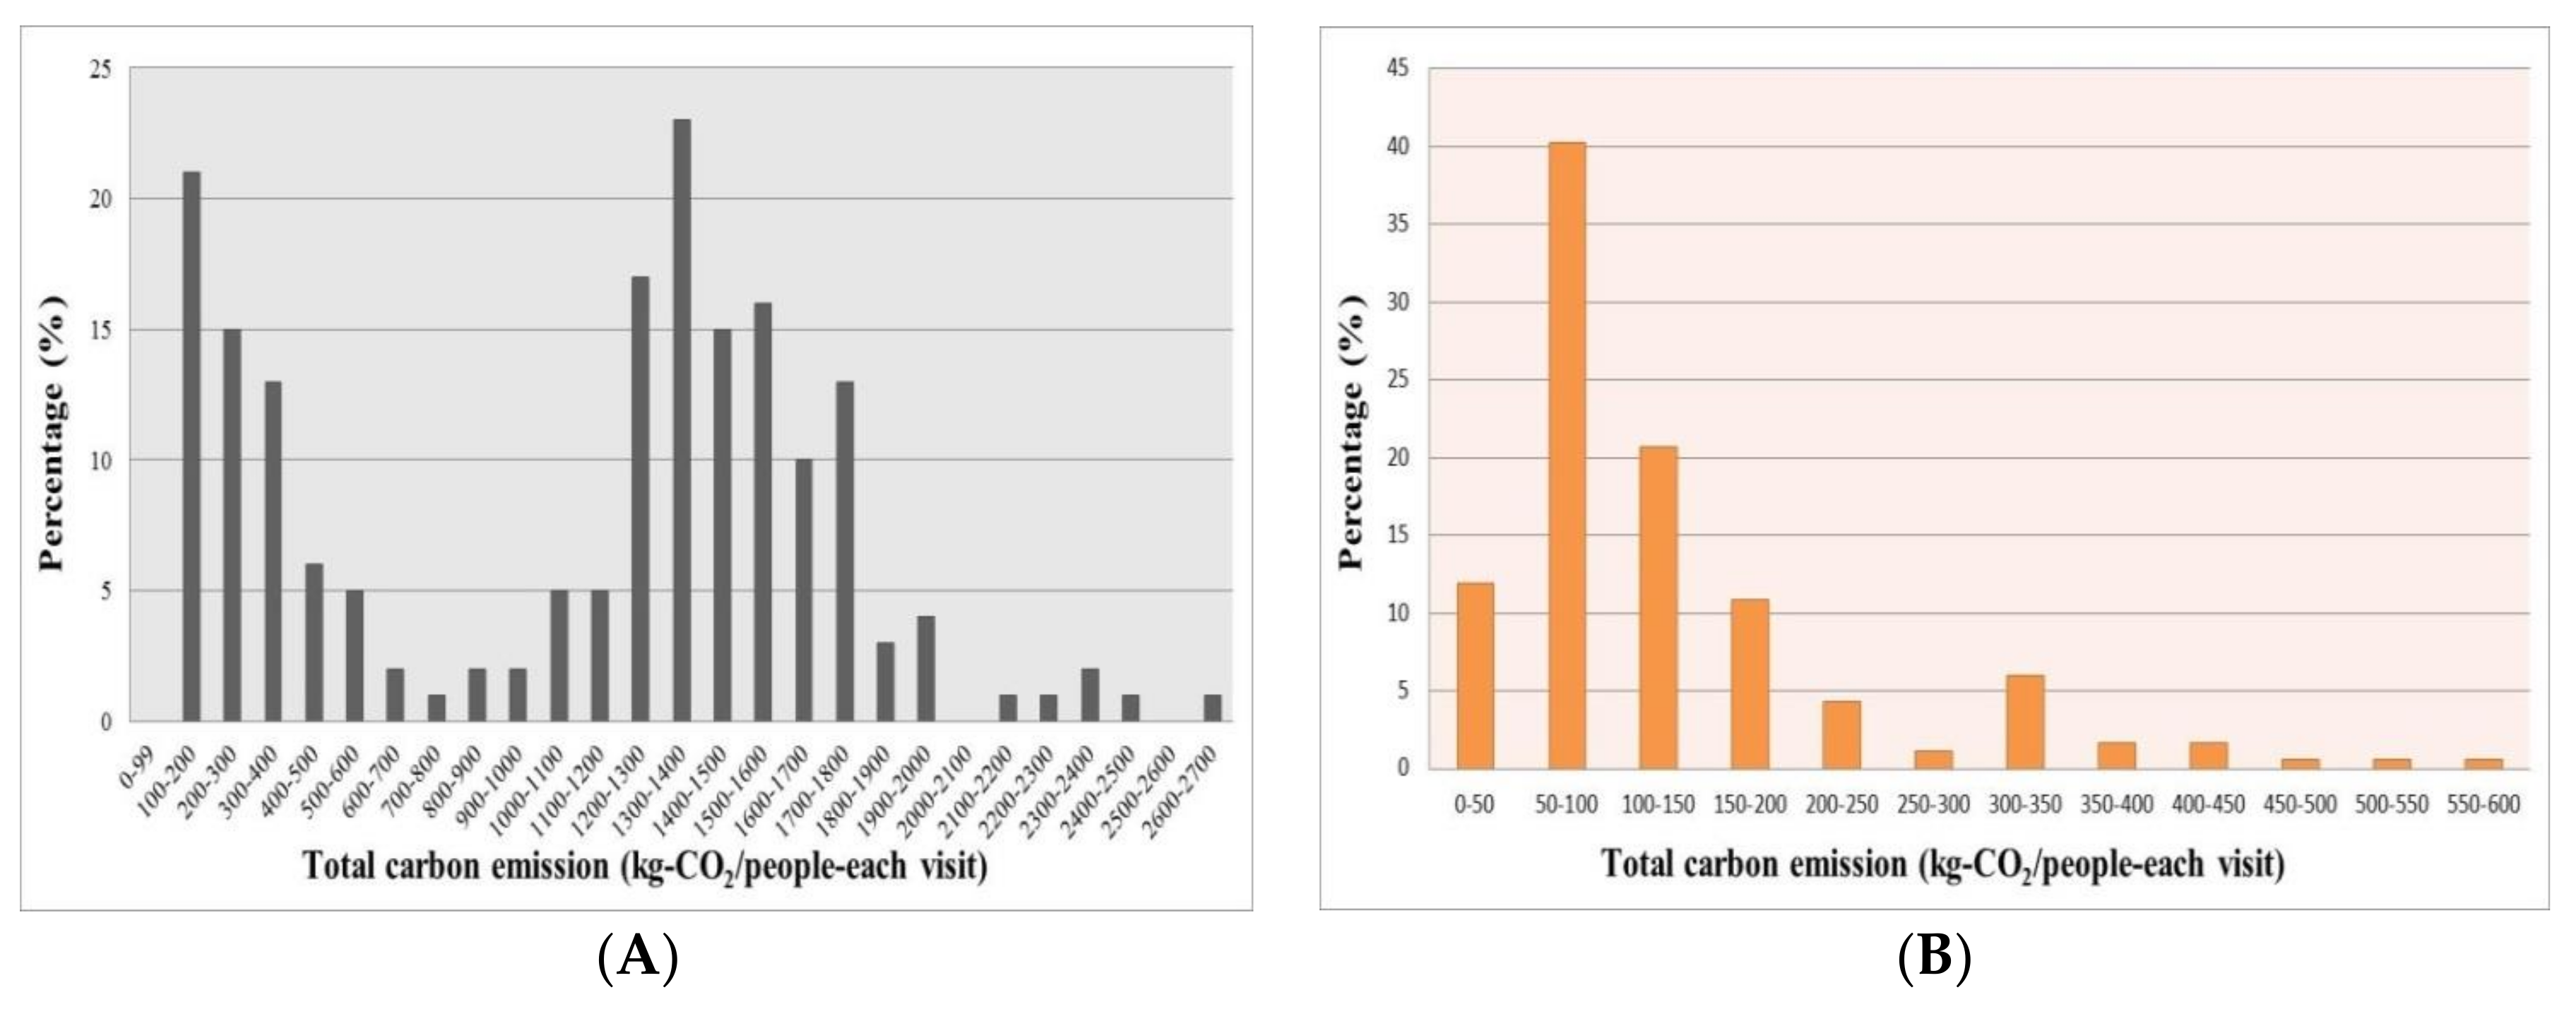
3.1. Total Carbon Emission with and without Considering International Transportation

The estimated TolCO2 patterns identified from the CECs and the questionnaire responses are shown in Figure 2. Air transport generates the largest CE [9], as it is nearly unavoidable during international travel. Assigning jurisdictions for cross-border CEs are difficult [32]. Therefore, in this study, TolCO2 is reported with (Figure 2A) and without (Figure 2B) considering international transportation. When international transportation was included, TolCO2 ranged from 126.0 to 2077 kg CO2/person (Figure 2A) and was greater than that without international transportation (Figure 2B). No TolCO2 was less than 100 kg CO2/person, indicating that the lowest TolCO2 from international transportation was larger than 100 kg CO2/person. The visitor with the lowest TolCO2 was from Hong Kong and stayed in Taiwan for two days (Figure 2A), whereas the visitor with the largest TolCO2 was from Canada and stayed in Taiwan for 20 days. TolCO2 of 100–600 kg CO2/person was attributed to international travel with a flight time of less than 3 h; such visitors were mainly from neighboring countries, such as China and Japan. By contrast, longer international flights had larger contributions to TolCO2 (1200–1800 kg CO2/person); such visitors were mainly from Europe and the Americas.
To explore which factors contributed the most to the TolCO2 of international visitors to Taiwan, we excluded the CE of international transportation from the TolCO2 analysis. The TolCO2 without CE of international transportation ranged from 7.9 to 591.1 kg CO2/person (Figure 2B). In this case, the visitor with the lowest TolCO2 (7.9 kg-CO2/person) was from Singapore and engaged in camping, which has a low RCO2 and ACO2. The highest TolCO2 (591.1 kg CO2/person) was generated by a visitor who stayed in Taiwan for 60 days and engaged in numerous tourist activities. The TolCO2 often ranged from 50–100 kgCO2/person for a visit. As expected, visitors who stayed in Taiwan for longer periods of time (14–45 days) engaged in several tourist activities and generated larger TolCO2 (250–600 kg CO2/person). Figure 3A shows the contributions of TCO2, RCO2, and ACO2 to TolCO2. Because Taiwan has relatively few hinterland areas and short transportation distances, TCO2 contributed only 13.4% to TolCO2; this is in contrast to non-island countries, such as China, where TCO2 is the main contributor [33,34]. RCO2 contributed 71.6% to TolCO2, and each visitor generated an average of 92.5 kg CO2 through accommodation activities. These results suggest that devoting resources to the reduction of RCO2 can considerably increase TolCO2 reduction. Such results were consistent with the idea that a reduction of CE from tourism should not only improve energy changes on the supply side, but also promote tourists to make environmentally protective decisions in regard to their choice of accommodation [34].

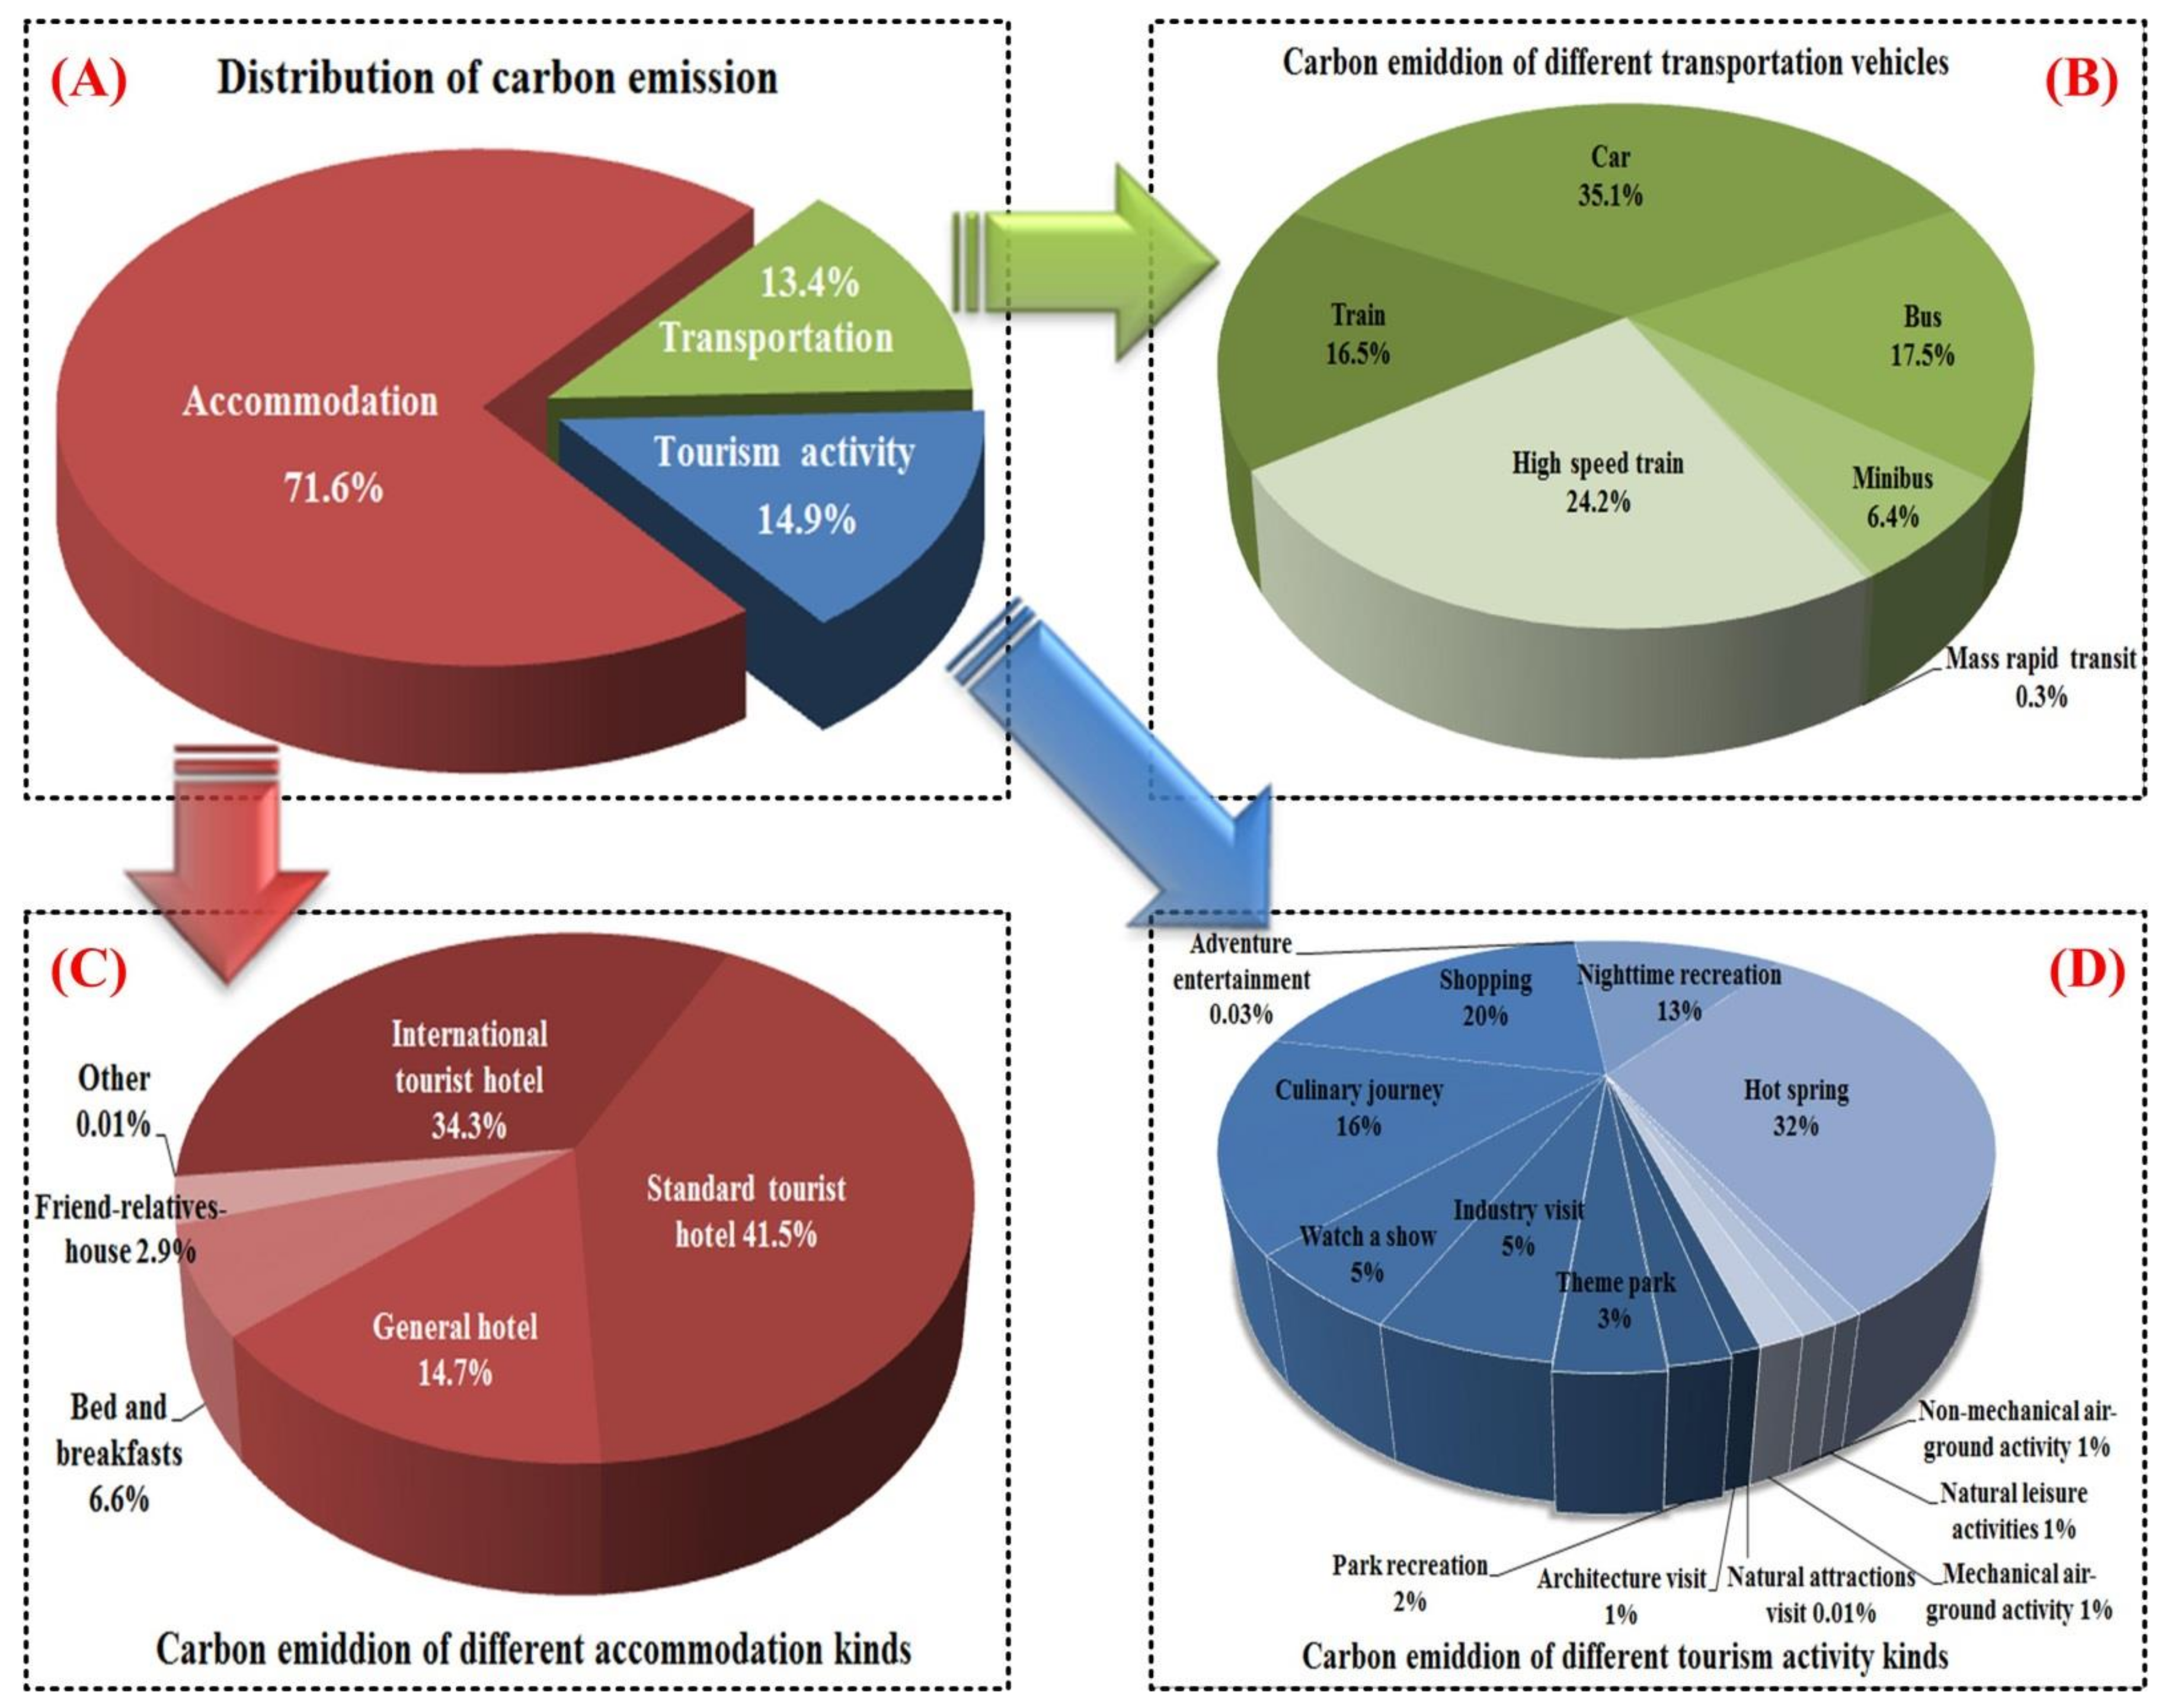
3.2. Transportation Carbon Emission of International Visitors

Table 1 shows the average transportation distance and the probability of an international visitor using each type of transportation mode. Travel by car, which had the highest CEC in this study, also had the highest probability (approximately 30%) of being selected as the transportation mode, and was used to travel, on average, 173.9 km. This suggests that a more convenient public transportation network could help to reduce TCO2. However, convenience may influence the choice of transportation mode, which may ultimately hinder the use of public transportation [35,36]. Train, bus, minibus, and HSR had an approximately 20% probability of use as the transportation mode. The HSR was used for longer transportation distances than cars, indicating that HSR was the primary choice for long-distance travel. The use of trains for longer transportation distances indicated that the comprehensive island railway network in Taiwan helps to promote low-carbon tourism, because trains have low CEC values. Mass rapid transit (MRT) was the least used transportation mode, despite it having the lowest CEC. This may be because of the limited availability of MRT (in the two metropolises of Taipei City and Kaohsiung City only). Some MRT networks under construction, such as that in Taichung, may help to promote low-carbon tourism in the future.
Next, we calculated the ratio of TCO2 emitted by the different transportation modes (Figure 3B). As expected, cars had the largest contribution to TCO2 (35.1%) because of their larger CEC and their high probability of use. This further supports the need for a comprehensive and convenient public transport system to replace or reduce the use of cars. While promoting public transport as an alternative mode, the government should consider tourist motivations, social marketing strategies, and tourist behaviors [37]. The HSR was the second largest contributor to TCO2 (24.2%) because of its large CEC and long travel distances. However, reducing the contribution of HSR to TCO2 might not be possible because of the high rate of utilization of HSR and its unique function of high-speed travel within Taiwan. Transportation by train or bus both contributed only 17% to TCO2 despite their long travel distances. Because MRT was the mode least likely to be used and given its low CEC and short travel distances, the CE from MRT had the lowest contribution (0.3%) to TCO2.

3.3. Accommodation Carbon Emission of an International Visitor

International visitors were most likely (31.1%) to stay in a standard tourist hotel and were next most likely (24.6%) to stay in an international tourist hotel (Table 2). However, these two types of accommodation have high CECs due to their energy-intensive facilities and thus higher RCO2 values (41.5% and 34.3%, respectively; Figure 3C). Bed-and-breakfast (B&B) establishments were used by 14.3% of international visitors and a further 13.1% stayed with a friend or a relative; both of these types of accommodation had low CEC values (6.6% and 2.9% RCO2, respectively; Figure 3C). Some international visitors stayed in other types of accommodation, such as tents (0.6%). These findings suggest that the government should consider devoting resources to improve the energy-use efficiency of devices in tourist hotels and endorsing the use of alternative accommodations with lower RCO2, such as by featuring or recommending B&Bs, to promote low-carbon tourism industry in Taiwan.

3.4. Tourist Activity Carbon Emission of an International Visitor

Table 3 shows the probability of an international visitor engaging in the 14 most common tourist activities and the CECs of these activities. International visitors were most likely (22.5%) to engage in a culinary journey, followed by shopping (19.1%), visiting famous architectural sites (14.1%), and nighttime recreation (10.2%). Because Taiwan lacks international large-scale amusement parks, such as Disneyland, international visitors were least likely (0.9%) to engage in non-mechanical air–ground activities. Moreover, the questionnaire responses revealed that international visitors engaged in tourist activities 1.3 times per day, on average; however, this varied widely (ranged from 0.05–4.71 times/day), possibly because of differences in travel purpose. For example, an international visitor who visited Taiwan for business only engaged in tourist activities approximately 0.4 times per day, but visitors whose primary travel purposes were tourism and convention engaged in tourist activities approximately 1.5 and 1.1 times per day, respectively. The latter result indicates that Taiwan’s rich tourism resources drive international visitors to engage in tourist activities, even when the primary purpose of their stay is not tourism.
The highest CEC of tourist activities was generated by hot springs (on average, 9.99 kg CO2/person), followed by theme parks (on average, 3.46 kg CO2/person). Activities related to natural attractions, such as visiting a geological landscape, had the lowest CEC (0.007 kg CO2/person), whereas tourist activities classified as man-made, such as watching a show, mechanical air–ground activity, industry visits, nighttime recreation, and shopping, had higher CECs. Approximately 80% of international visitors who engaged in nighttime recreation (such as visiting a nightclub) were from non-Asian countries and generated up to 1.85 kg CO2/person. There was an approximately 1000-fold difference in CEC between the largest and smallest CEC-generating tourist activities. Of all of the tourist activities, engaging in hot spring activities had the largest contribution to ACO2 (Figure 3D), despite this activity having only a 5% probability of being engaged in. In other words, if the Taiwanese government promotes hot spring activities to tourists, this will increase the volume of CE. The Taiwanese government should therefore propose strategies to reduce the CEC of hot springs, because hot springs are often promoted as the main tourist activity to partake in during winter. International visitors who engaged in culinary journeys and shopping had the second largest contribution to ACO2 because of their high CEC combined with the high probability of these activities being engaged in. One effective method for promoting alternative tourist activities is to issue pamphlets that provide information about tourist activities and destinations in hotel receptions [22].

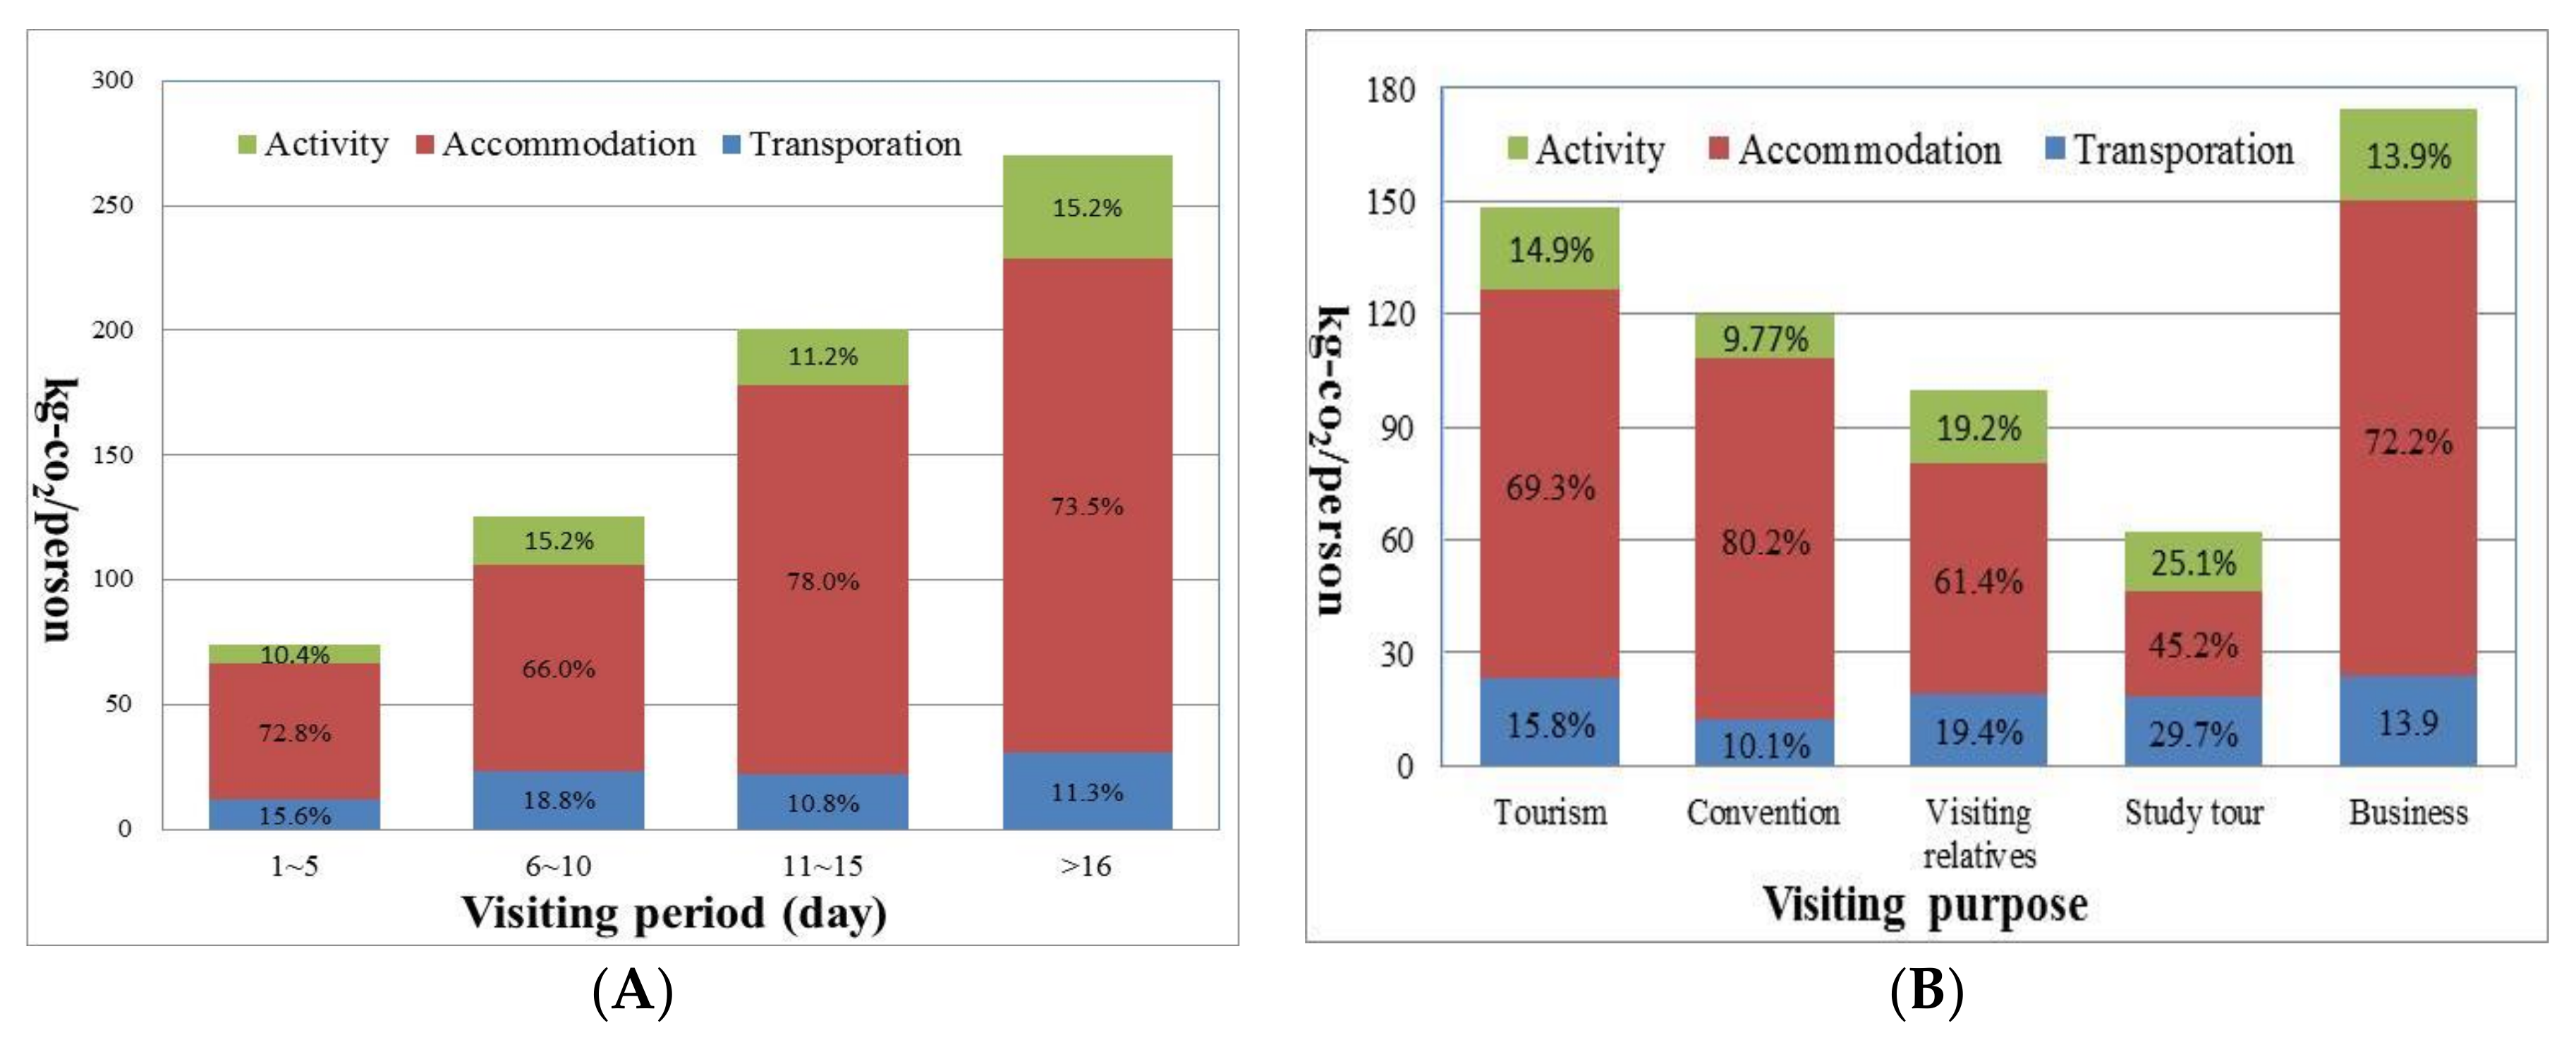
3.5. Carbon Emission Patterns for Different Visiting Periods and Purposes

The findings of this study show that the majority of international visitors (40.6%) stayed in Taiwan for 6–10 days; on average, international visitors stayed in Taiwan for 9 days for short-term trips (<60 days). Visitors to Taiwan for 1–5 days (38.0%) were mostly from East and Southeast Asia. The TolCO2 pattern for the different visiting periods and purposes is illustrated in Figure 4. The TolCO2 increased with visiting time (Figure 4A), but TCO2 did not markedly increase, mainly because of the non-tourist nature of such trips and because such visitors engaged in few activities. In contrast, visitors who stayed for shorter periods (<10 days) engaged in many tourist activities and spent more time traveling, thus generating a higher rate of TCO2. Such intensive tourist activities would possibly lead to lower tourism quality and higher TolCO2; thus, if the Taiwanese government recommends appropriate itineraries based on visiting periods, the tourism quality and TolCO2 could potentially be improved.
RCO2 contributed more than 70% to TolCO2, except when the visiting period was 6–10 days. This is due to a higher probability of such visitors staying in their friends’ or relatives’ house and engaging in more activities with higher TCO2 values. Most visitors travelled to Taiwan for tourism (50.5%), convention (26.9%), visiting relatives (12.6%), study (5.5%), and business (4.4%). Figure 4B shows the average TolCO2 for different visit purposes; visitors who travelled for business had the largest TolCO2 values (174.2 kg CO2/person), mainly because these visitors often stayed in international tourist hotels, which have the highest accommodation CEC. In contrast, visitors who travelled for study often stayed with their friends or relatives, which has a low accommodation CEC and thus generates the lowest RCO2 and TolCO2 (62.2 kg CO2/person). Similarly, visitors who travelled to visit relatives usually stayed in their relatives’ house, resulting in low RCO2 and TolCO2 values. Visitors who travelled for tourism and convention had similar RCO2 but different TCO2 and ACO2, mainly because these visitors engaged in many tourist activities.

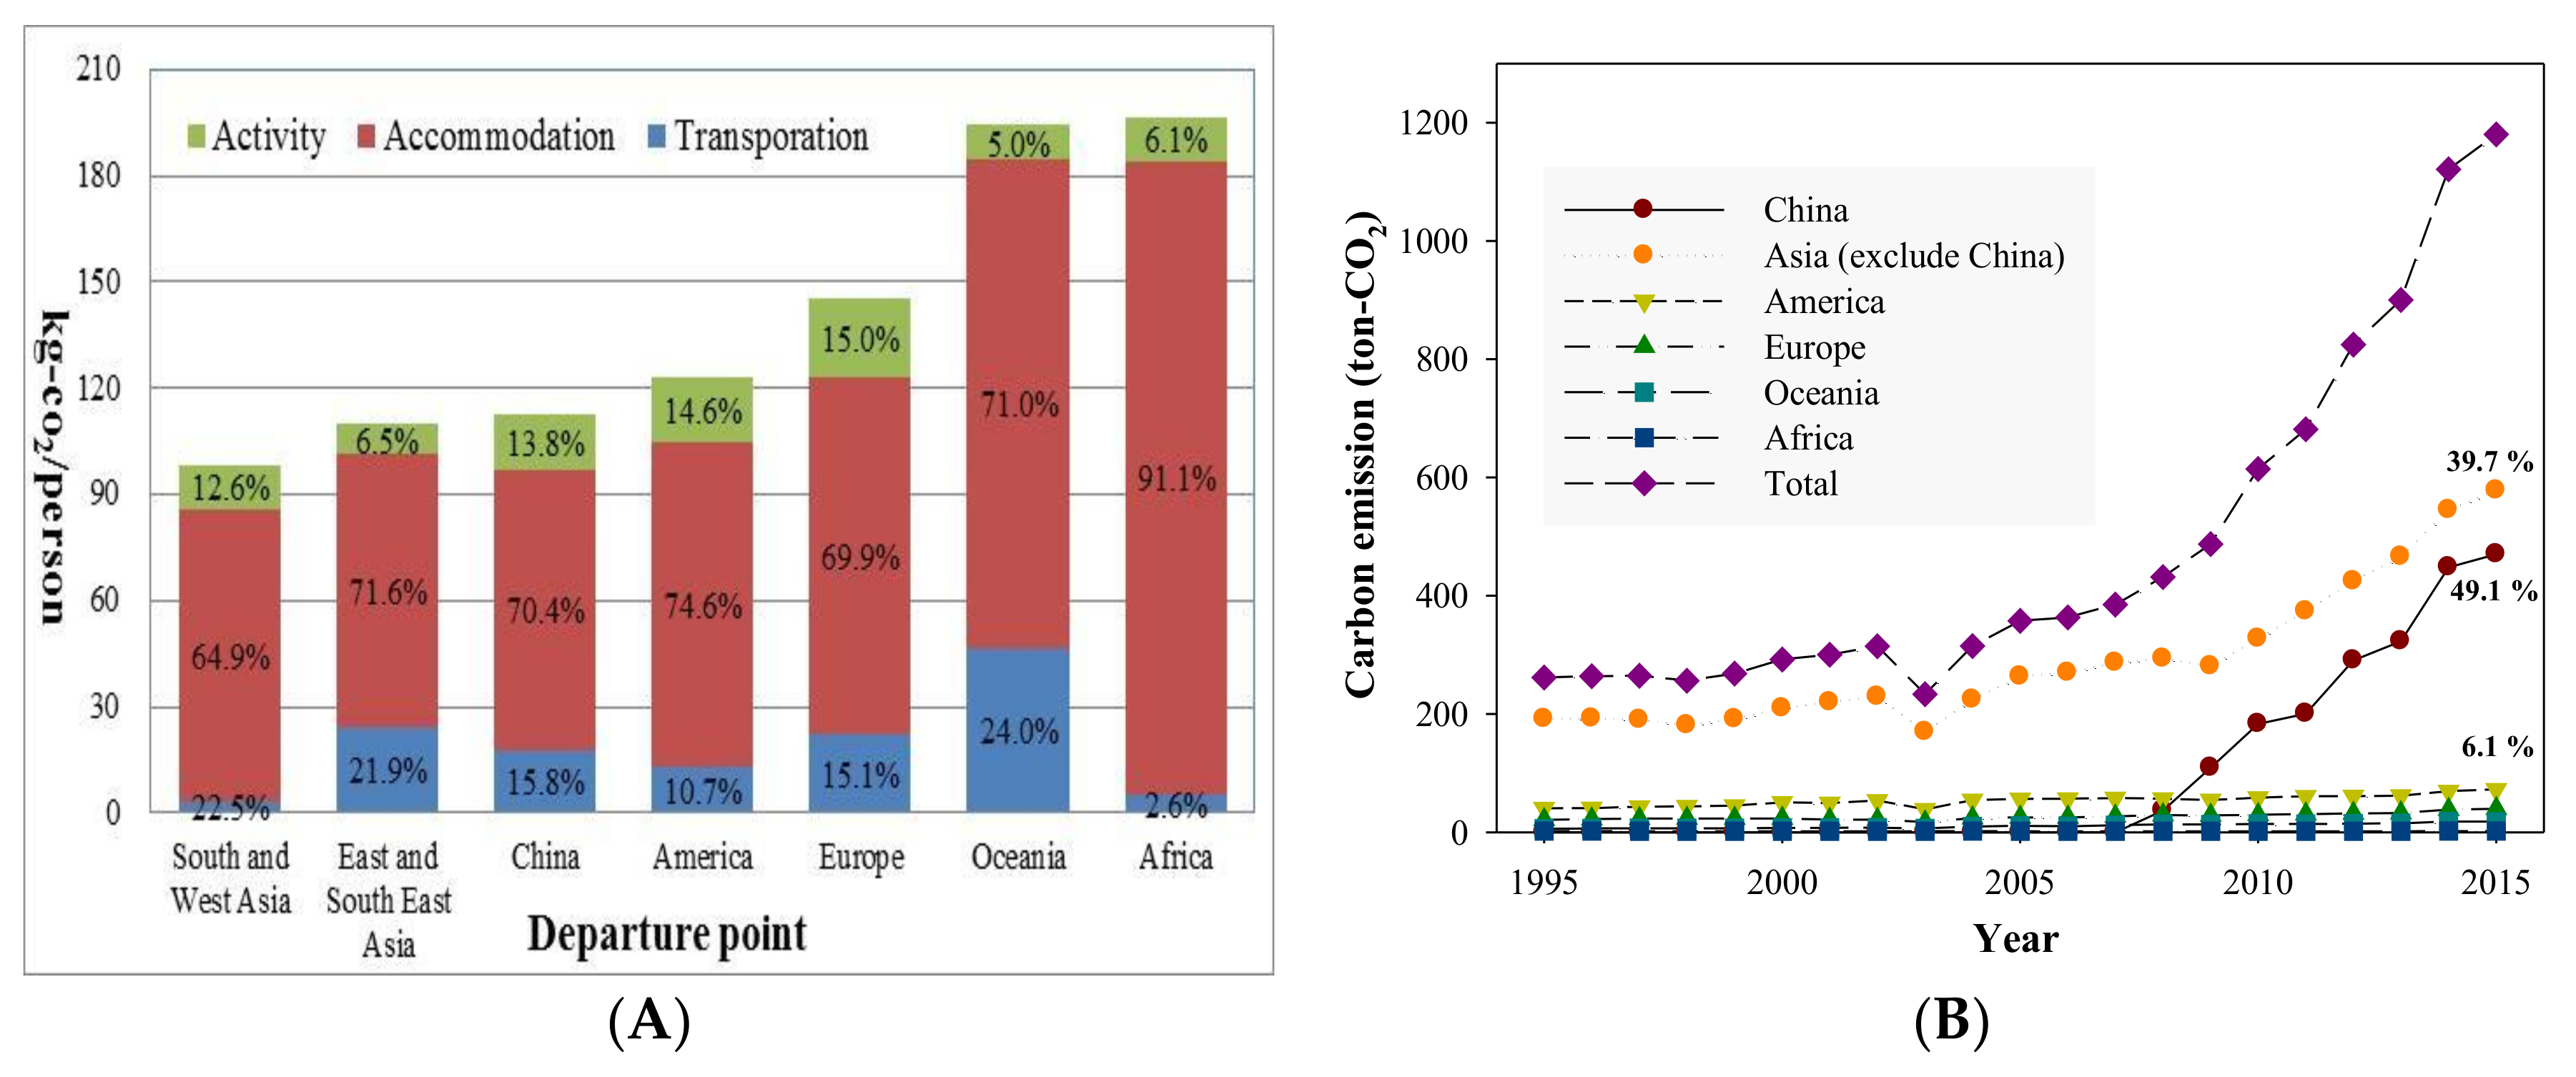
3.6. Carbon Emission Patterns for Visitors’ Departure Points, and Annual Carbon Emission of International Visitors

Visitors who participated in this study were from Europe (39.2%), China (22.2%), the Americas (18.5%), East and Southeast Asia (12.7%), South and West Asia (2.6%), Oceania (2.6%), and Africa (2.1%). Figure 5A shows the average TolCO2 generated by the visitors with different departure points; visitors from Africa and Oceania generated the highest TolCO2 values. Furthermore, visitors from Africa often stayed in international tourist hotels, possibly because of language barriers. However, they generated low TCO2 and ACO2 because they visited Taiwan for business and engaged in few tourist activities. In comparison, because visitors from Oceania visited Taiwan for a longer period (on average, 11.4 days) and had a higher probability of using a car as their transportation mode than other visitors, they generated the highest TCO2. Visitors from Europe generated a high TCO2 because of their longer visiting period and engagement in several tourist activities. Overall, these results suggest that the government should vigorously advocate low-carbon accommodation for visitors from Oceania, Africa, and Europe; for example, promoting B&Bs to these visitors and improving the communication skills of the owners of these establishments to promote low-carbon tourism for international visitors. In addition, visitors from East and Southeast Asia and China who visit Taiwan for shorter periods (approximately 6.8 days) would generate similar TolCO2 values. Visitors from South and West Asia also visited Taiwan for shorter periods (approximately 7.0 days) and often stayed in a single city for conventions; thus, they had shorter transportation distances and the lowest TCO2 values, despite their preference to travel by car. In other words, the Taiwanese government should promote the policy of attracting tourists from South and West Asia. This policy would reduce the tourism carbon footprint of international tourists but also obtain economic benefit.
Figure 5B shows the ACEIV and the estimated annual CE generated by international visitors traveling to Taiwan during 1995–2015 (without considering international transportation), derived from our results and data from the Taiwan Tourism Bureau. The annual CE generated by visitors from Asia was analyzed separately for visitors from China and the rest of Asia. The number of international visitors increased 4.6-fold and the annual CE approximately 4.5-fold during 2005–2015. For example, the annual CE in 2015 was 1180.1 ton CO2/year and was mainly derived from visitors from China (49.1%) and the rest of Asia (39.7%); this was because the number of visitors from China and the rest of Asia increased significantly despite visitors from these countries having a lower CE per person than those from other continents. The increase of visitors from China is because the China and Taiwanese governments allowed regular China tourists to visit Taiwan in 2008 [38]. In addition, the Taiwanese government actively promoted tourism in Asia after its rapid economic development, which could have resulted in the large increase in the number of visitors from these countries.

4. Conclusions

To develop the tourism industry, in addition to the attracting international tourists, promoting low-carbon tourism was deemed vital by the Taiwanese government. This study identified the CE patterns of international visitors to Taiwan with the objective of providing the Taiwanese government with comprehensive data to determine their approach towards promoting a low-carbon tourism industry. Further, this study evaluated TolCO2 with and without international transportation as well as the contribution of TCO2, RCO2, and ACO2 to TolCO2.
Travel by car, which has the highest CEC among all transportation modes, had the highest probability of use over short distances. Although cars are preferred because of convenience and tourist behavior, the results nevertheless suggest that construction of more convenient public transportation might help to reduce TCO2. Furthermore, TCO2 contributed to only 13.4% of TolCO2, probably due to the presence of few hinterland regions and the shorter transportation distances in Taiwan. Visitors who travelled for conventions also engaged in tourist activities, indicating that Taiwan has rich tourism resources from which the tourism industry can be developed and that low TCO2 would be conducive to promoting low-carbon tourism. ACO2 was the main contributor to TolCO2 in Taiwan, whereas TCO2 is the main contributor in many other countries.
Visitors from Africa often stayed in international tourist hotels (possibly because of language barriers), which have the highest accommodation CEC and consequently generate higher TolCO2 than do visitors from other continents. This suggests that the Taiwanese government should devote resources to improve the energy-use efficiency of devices in accommodations and promote unique B&Bs with lower CECs.
International visitors enjoy culinary journeys and shopping, which contributes highly to ACO2 because of the high CEC values of these activities. Hot spring activity had the highest CEC among all tourist activities and contributed the most to ACO2, despite few international visitors engaging in it. The government should therefore develop strategies to reduce the CEC of hot spring activity as it is often promoted as the main tourist activity during winter. We believe that our results provide the Taiwanese government a reference for promoting a low-carbon tourism industry. Apart from TolCO2, environmental pollution resulting from tourism development should be considered in the future.

Author Contributions

K.-T. Tsai established the framework and analysis methodology, performed the statistical analysis, created tables and graphs, and wrote the manuscript. T.-P. Lin and Y.-H. Lin determined the research rationales and objectives, synthesized the results of the data analysis. C.-H. Tung determined the article structure and outline, wrote the manuscript, and acted as the corresponding author. Y.-T. Chiu performed the field surveys and collected data. All authors critically revised and approved the final manuscript.

Acknowledgments

The authors would like to thank the National Science Council of Taiwan for the partial financial support of this research under Project NSC104-2221-E-005-077 and NSC106-2410-H-005-046. The authors would also thank Wen-Ying Wang and Szu-chia Kao for collecting data and providing many helpful comments for this study. Felix Sebastian is appreciated for his editorial assistance.

Conflicts of Interest

The authors declare no conflict of interest.

References

  1. Gössling, S.; Peeters, P. Assessing tourism’s global environmental impact 1900–2050. J. Sustain. Tour. 2015, 23, 639–659. [Google Scholar] [CrossRef]
  2. Buckley, R. Sustainable tourism: Research and reality. Ann. Tour. Res. 2012, 39, 528–546. [Google Scholar] [CrossRef]
  3. Sharpley, R. Tourism Development and the Environment: Beyond Sustainability? Earthscan: London, UK, 2009. [Google Scholar]
  4. Scott, D.; Peeters, P.; Gössling, S. Can tourism deliver its “aspirational” greenhouse gas emission reduction targets? J. Sustain. Tour. 2010, 18, 393–408. [Google Scholar] [CrossRef]
  5. Gössling, S. Global environmental consequences of tourism. Glob. Environ. Chang. 2002, 12, 283–302. [Google Scholar] [CrossRef]
  6. Roibás, L.; Loiseau, E.; Hospido, A. Determination of the carbon footprint of all Galician production and consumption activities: Lessons learnt and guidelines for policymakers. J. Environ. Manag. 2017, 198 Pt 1, 289–299. [Google Scholar] [CrossRef] [PubMed]
  7. Lin, T.-P. Carbon dioxide emissions from transport in Taiwan’s national parks. Tour. Manag. 2010, 31, 285–290. [Google Scholar] [CrossRef]
  8. Becken, S.; Simmons, D.G.; Frampton, C. Energy use associated with different travel choices. Tour. Manag. 2003, 24, 267–277. [Google Scholar] [CrossRef]
  9. Tsai, K.-T.; Lin, T.-P.; Hwang, R.-L.; Huang, Y.-J. Carbon dioxide emissions generated by energy consumption of hotels and homestay facilities in Taiwan. Tour. Manag. 2014, 42, 13–21. [Google Scholar] [CrossRef]
  10. Huang, Z.; Cao, F.; Jin, C.; Yu, Z.; Huang, R. Carbon emission flow from self-driving tours and its spatial relationship with scenic spots—A traffic-related big data method. J. Clean. Prod. 2017, 142, 946–955. [Google Scholar] [CrossRef]
  11. Peeters, P.; Dubois, G. Tourism travel under climate change mitigation constraints. J. Transp. Geogr. 2010, 18, 447–457. [Google Scholar] [CrossRef]
  12. Gössling, S. Carbon neutral destinations: A conceptual analysis. J. Sustain. Tour. 2009, 17, 17–37. [Google Scholar] [CrossRef]
  13. De Vita, G.; Katircioglu, S.; Altinay, L.; Fethi, S.; Mercan, M. Revisiting the environmental Kuznets curve hypothesis in a tourism development context. Environ. Sci. Pollut. Res. 2015, 22, 16652–16663. [Google Scholar] [CrossRef] [PubMed]
  14. Ozturk, I.; Al-Mulali, U.; Saboori, B. Investigating the environmental Kuznets curve hypothesis: The role of tourism and ecological footprint. Environ. Sci. Pollut. Res. 2016, 23, 1916–1928. [Google Scholar] [CrossRef] [PubMed]
  15. López-Menéndez, A.J.; Pérez, R.; Moreno, B. Environmental costs and renewable energy: Re-visiting the Environmental Kuznets Curve. J. Environ. Manag. 2014, 145 (Suppl. C), 368–373. [Google Scholar] [CrossRef] [PubMed]
  16. Becken, S.; Patterson, M. Measuring national carbon dioxide emissions from tourism as a key step towards achieving sustainable tourism. J. Sustain. Tour. 2006, 14, 323–338. [Google Scholar] [CrossRef]
  17. Oluseyi, P.; Babatunde, O.; Babatunde, O. Assessment of energy consumption and carbon footprint from the hotel sector within Lagos, Nigeria. Energy Build. 2016, 118, 106–113. [Google Scholar] [CrossRef]
  18. Filimonau, V.; Dickinson, J.; Robbins, D. The carbon impact of short-haul tourism: A case study of UK travel to Southern France using life cycle analysis. J. Clean. Prod. 2014, 64, 628–638. [Google Scholar] [CrossRef]
  19. Loo, B.P.Y.; Li, L. Carbon dioxide emissions from passenger transport in China since 1949: Implications for developing sustainable transport. Energy Policy 2012, 50, 464–476. [Google Scholar] [CrossRef]
  20. Tang, C.; Zhong, L.; Fan, W.; Cheng, S. Energy consumption and carbon emission for tourism transport in World Heritage Sites: A case of the Wulingyuan area in China. Nat. Resour. Forum 2015, 39, 134–150. [Google Scholar] [CrossRef]
  21. Hoxter, A.L.; Lester, D. Tourist behavior and personality. Personal. Individ. Differ. 1988, 9, 177–178. [Google Scholar] [CrossRef]
  22. Ortega, E.; Rodríguez, B. Information at tourism destinations. Importance and cross-cultural differences between international and domestic tourists. J. Bus. Res. 2007, 60, 146–152. [Google Scholar] [CrossRef]
  23. Jones, T.E.; Yamamoto, K. Segment-based monitoring of domestic and international climbers at Mount Fuji: Targeted risk reduction strategies for existing and emerging visitor segments. J. Outdoor Recreat. Tour. 2016, 13, 10–17. [Google Scholar] [CrossRef]
  24. Rutty, M.; Scott, D. Comparison of climate preferences for domestic and international beach holidays: A case study of Canadian travelers. Atmosphere 2016, 7, 30. [Google Scholar] [CrossRef]
  25. Kozak, M. Comparative analysis of tourist motivations by nationality and destinations. Tour. Manag. 2002, 23, 221–232. [Google Scholar] [CrossRef]
  26. Carr, N. A comparative analysis of the behaviour of domestic and international young tourists. Tour. Manag. 2002, 23, 321–325. [Google Scholar] [CrossRef]
  27. Yang, M.-D.; Chen, Y.-P.; Lin, Y.-H.; Ho, Y.-F.; Lin, J.-Y. Multiobjective optimization using nondominated sorting genetic algorithm-II for allocation of energy conservation and renewable energy facilities in a campus. Energy Build. 2016, 122, 120–130. [Google Scholar] [CrossRef]
  28. UNEp, O.; IEA, I. Revised IPCC Guidelines for National Greenhouse Gas Inventories; IPCC: Bracknell, UK, 1996. [Google Scholar]
  29. Collier, A. Principles of Tourism; Pitman Publishing: London, UK, 1989. [Google Scholar]
  30. Becken, S. Energy Consumption of Tourist Attractions and Activities in New Zealand: Summary Report of a Survey; Lincoln University: Lincoln, UK, 2001. [Google Scholar]
  31. Chiu, Y.-T. Carbon Emissions and Ecological Footprint of Foreign Tourists in Taiwan; National Formosa University: Yunlin, Taiwan, 2012. [Google Scholar]
  32. Sun, Y.-Y. A framework to account for the tourism carbon footprint at island destinations. Tour. Manag. 2014, 45, 16–27. [Google Scholar] [CrossRef]
  33. Tang, Z.; Shang, J.; Shi, C.; Liu, Z.; Bi, K. Decoupling indicators of CO2 emissions from the tourism industry in China: 1990–2012. Ecol. Indic. 2014, 46, 390–397. [Google Scholar] [CrossRef]
  34. Robaina-Alves, M.; Moutinho, V.; Costa, R. Change in energy-related CO2 (carbon dioxide) emissions in Portuguese tourism: A decomposition analysis from 2000 to 2008. J. Clean. Prod. 2016, 111, 520–528. [Google Scholar] [CrossRef]
  35. Lew, A.; McKercher, B. Modeling Tourist Movements: A Local Destination Analysis. Ann. Tour. Res. 2006, 33, 403–423. [Google Scholar] [CrossRef]
  36. Kelly, J.; Haider, W.; Williams, P.W. A behavioral assessment of tourism transportation options for reducing energy consumption and greenhouse gases. J. Travel Res. 2007, 45, 297–309. [Google Scholar] [CrossRef]
  37. Le-Klähn, D.-T.; Hall, C.M. Tourist use of public transport at destinations—A review. Curr. Issues Tour. 2015, 18, 785–803. [Google Scholar] [CrossRef]
  38. Sun, Y.-Y.; Pratt, S. The economic, carbon emission, and water impacts of Chinese visitors to Taiwan: Eco-efficiency and impact evaluation. J. Travel Res. 2014, 53, 733–746. [Google Scholar] [CrossRef]
Figure 1. Geographical features of and tourism attractions in Taiwan.
Sustainability 10 01386 g001
Figure 2. Bimodal distribution of international visitor carbon emission (A) with and (B) without considering international transportation.
Sustainability 10 01386 g002
Figure 3. (A) Carbon emission (CE) without considering international flights and contributions to CE stratified by (B) transportation modes; (C) accommodation types; and (D) tourist activities.
Sustainability 10 01386 g003
Figure 4. Average carbon emission generated by visitors for different visiting (A) periods and (B) purposes.
Sustainability 10 01386 g004
Figure 5. (A) Average carbon emission generated by visitors from different departure points and (B) the estimated annual carbon emission generated by international visitors to Taiwan during 1995–2015.
Sustainability 10 01386 g005
Table 1. Average transportation distance, the probability of international visitors using each transportation mode, and the carbon emission coefficient of each mode.
Transportation ModeSelected Probability (%) aDistance (km/Person) aCarbon Emission Coefficient (kg CO2/km) b
AverageDeviation
Car29.5173.9214.40.096
Bus22.2404.6320.70.028
High speed rail20.2258.3144.70.070
Train19.4361.3274.20.034
Minibus4.4402.0376.00.052
Mass rapid transit4.431.90.00.034
Total100---
a When an international visitor needs to use a vehicle for transportation; b [7].
Table 2. Accommodation type, the probability of international visitors using each accommodation type, and the carbon emission coefficient of each accommodation.
Accommodation TypeSelected Probability (%/Person-Night) aCarbon Emission Coefficient (kg CO2/Person-Night) b
Standard tourist hotel31.119.2
International tourist hotel24.620.15
Friend/relative’s house13.13.00
General hotels16.312.47
Bed-and-breakfast14.36.32
Other (such as tent)0.60.0
Total100-
a When an international visitor needs to have an accommodation; b [9].
Table 3. Tourism activities, the probability of international visitors engaging in each activity, and the carbon emission coefficient of each activity.
ActivitySelected Probability (%/Person-Night) aCarbon Emission Coefficient [Ak (kg CO2/Person)] b
KindExample
Hot springGoing to hot springs5.09.99
Theme parkTheme park tour1.43.46
Watch a showAboriginal cultural experience3.12.57
Mechanical air-ground activityYacht tourism0.92.42
Industry visitVisit orchard4.31.85
Nighttime recreationNightclub10.21.85
ShoppingShopping19.11.62
Culinary journeyTaste famous food in night markets22.51.10
Nonmechanical air-ground activitySurf2.20.85
Park recreationPicnic6.00.47
Natural leisure activitiesCycling5.60.28
Architecture visitVisit special buildings14.10.1
Adventure entertainmentClimbing mount3.30.02
Natural attractions activityGeological landscape2.30.007
Total100
a When an international visitor want to engage in an activity; b [31].

