1. Introduction
The extensive exploitation of solar irradiation in urban zones has become an essential and practical strategy for fostering sustainable development. The buildings induce different shading patterns on one another. Thus, advanced methods for studying solar penetration into different urban textures are needed. Previous and current tools used for monitoring solar penetration in urban landscapes are mainly aimed toward preserving the direct solar irradiation of buildings.
Planners currently face many challenges, such as increased levels of energy demand, ongoing global warming impacts, environmental degradation, and drastic changes in the pattern of the power generation and distribution within the city. Sustainable development mainly focuses on fostering global solar irradiation and global illuminance reaching the building envelopes (e.g., facades and roofs) in order to accurately quantify the zoning potential for maximized photovoltaic (PV) electricity production. Shading from green and grey infrastructures in cities play contradictory roles in sustainable development. Shading provides thermally comfortable outdoor environments at a pedestrian level during the summer but reduces the level of solar irradiance received by the PV solar panel systems. Thus, PV energy systems should be utilized and integrated into power systems which can be simulated under shading conditions to avoid such contradictions.
Photovoltaic systems are one of the RE resources that have brought numerous advantages. Photovoltaic systems are characterized by static, quiet, and movement-free features. Thus, considered as preferred systems to incorporate into residential microgrids. The price of PV modules was drastically reduced from
$30/W to
$3/W in 1980 [
1], thus leading to the significant growth of the use of PV systems. The implementation of building-integrated PV systems has significantly evolved because of this reason. Yet, the low energy conversion efficiency of PV systems is a major drawback despite significant improvements in PV systems, such as cost reduction, cell efficiency increment, and enhancement in the structural integration of buildings. Moreover, the surrounding environment, which includes solar irradiance and ambient temperature, affects the amount of energy generated by PV systems. Therefore, a control unit associated with maximum power point tracking (MPPT) should provide an appropriate duty cycle so that DC–DC converters can obtain the maximum level of energy from PV arrays.
Photovoltaic systems comprise several PV modules connected in parallel or in a series to achieve the required output voltage and current supply capability. The efficiency of the output can be negatively affected when these modules are subject to non-uniform irradiances, such as in the case of partial shading (PS) of the PV system. The extent of the case depends on system architecture, the implemented shading scheme, or the number of bypass diodes integrated to the PV modules. PS is often unavoidable due to the occlusion of the sun by objects, such as buildings, trees, clouds, and other items, and has been widely discussed in the literature [
2]. Under PS conditions, a PV module can receive different levels of solar irradiance compared with others in the array, resulting in a complex and multipeak P–V output characteristic curve. The conventional MPPT methods based on hill climbing lead to the reduced capability to accurately detect the global maximum power point (GMPP) due to the existence of multiple peaks on the output characteristic curve.
Given that current tools provide an inaccurate measurement of the GMPP when subjected to PS, the MPPT techniques and methods should be improved to deal with the consequences of PS. A few studies have focused on tracking the GMPP subjected to non-uniform shading [
3,
4,
5] and included adaptations of conventional methods (e.g., incremental conductance [
6] and P&O [
7]), artificial intelligence (AI)-based techniques (e.g., fuzzy logic- and neural network-based approaches), and methods that combine conventional methods with AI. A few of these studies have used fuzzy-logic controller (FLC) to increase the efficiency and reliability of maximum power point (MPP) tracking controller under normal conditions. For instance, authors in [
8], used FLC to increase the efficiency and speed of the hill climbing (HC) method during tracking process. In this study, FLC was used to scan and store the MPP region in the first stage, and then HC is used to track the actual MPP in the second stage. In another study, a combination of FLC and artificial neural networks (ANN) was proposed to track the global maximum power point (GMPP) of a PV system using the cell temperature and irradiance level in the ANN training process [
9]. These studies used varied approaches to achieve a satisfactory performance in determining GMPP under normal and severe PS conditions.
However, most of these introduced methods either result in highly complicated and system-dependent methods or ones that cannot track the GMPP under all PS conditions [
7,
10]. Artificial intelligence approaches employ soft computing techniques, such as genetic algorithm, differential evolution, ant colony optimization, and particle swarm optimization (PSO), and have been popularly applied to address PS in the MPPT [
11,
12]. The metaheuristic nature of these methods, particularly of PSO, means that the approaches are independent of the output characteristics of the PV system [
13]. These methods are limited because they remain largely affected by random coefficients, thus resulting in an unsatisfactory performance. Hybrid approaches that combine either multiple soft computing approaches or soft computing methods with conventional methods can achieve accurate and reliable results [
14]. However, a few drawbacks are observed with these hybrid approaches due to the slow processing time and high computational cost.
Recently, several evolution-based techniques, such as differential evolution (DE), genetic algorithm (GA), simulated annealing (SA), firework algorithm (FWA), have been used to identify the GMPP among several local maximum power points (LMPPs) at the output of partially shaded PV system [
15,
16,
17,
18,
19,
20]. Hybrid PSO methods are among the few techniques that are most popular in the literature [
15,
16,
20] because of their capabilities in targeting stochastic functions. However, like the standard format of PSO method and some of the recently developed hybrid methods, still have high dependency on random coefficients and also have high computational cost of the microcontrollers which are used to track the particle movements [
21,
22,
23]. Several studies have attempted to address these issues by employing the new AI based MPPT methods. However, the main drawback of these methods is long tracking time due to low convergence speed and the frequent power fluctuation at the output of PV systems. In several studies, this issue has been addressed by removing random coefficients that result to decrease the metaheuristic aspect of evolutionary algorithms [
24].
As an alternate the present study addresses the challenges of PS conditions by introducing a new MPPT method for mitigating the adverse effect of PS conditions on the GMPP tracking. The bio-inspired optimization method called bat algorithm (BA), which is based on the echolocation behavior of microbats, is used. Unlike existing methods, BA can track the MPP regardless of the shape of the output characteristic curve. Recently, this method has been recently used in several researches in combination with other methods in MPPT application. However, these methods have not used BA method as their core method in MPPT application, and they have only used BA to improve the performance of a conventional MPPT methods. In addition, majority of this method have been only tested for PV system under normal conditions, however currently the main challenge in MPPT application in PS problem. For instance, authors in [
25,
26] used the BA algorithm used to increase the tracking response of a proportional-integral based MPPT controller for PV systems to power switched reluctance motor with high efficiency under normal weather conditions.
In another study authors used BA method in order to improve the performance of conventional perturb and observe (P&O) based MPPT techniques [
27]. The presented method has been tested under partial shading conditions, however similar to other hybrid techniques they are presented in the literature, the P&O method adds further complexity to MPPT application, which contributes to the increase of computational cost. In this study, however the BA method is proposed as the core technique in MPPT controller unit which significantly reduces the complexity and computational cost of the system. BA is simple and less dependent on random coefficients and initial conditions. It is highly efficient, and the rate at which the optimization algorithm converges is faster than other soft computing methods. Hence, BA results in less fluctuation in the output voltage, which is a significant issue in the MPPT for PV systems. Only few other research groups across the world have addressed the highlighted research of this study to apply BA to PV applications [
25,
26,
27] addressing the problem of identifying the MPPT under PS condition. This study comprehensively evaluates the speed, efficiency, and reliability of the proposed BA for a PV system that is subjected to three different PS conditions.
The rest of the paper is organized as follows.
Section 2 briefly explains the characteristics of PV systems and the effects of PS condition on the performance of the PV system.
Section 3 describes the theory of BA and discusses the mathematical model of the BA implemented in this technique, which addresses the MPPT issues of the PV system.
Section 4 presents the performance results of the proposed the BA-based MPPT technique under various PS conditions.
Section 5 concludes the study and elaborates on future research directions.
2. Characteristics of Photovoltaic Systems
The generated energy from a PV system is largely dependent on the surrounding climatic parameters, particularly ambient temperature and solar irradiance. Changes in the values of these parameters alter the overall generated energy of the solar system and shift the location of the GMPP to other parts of the search space.
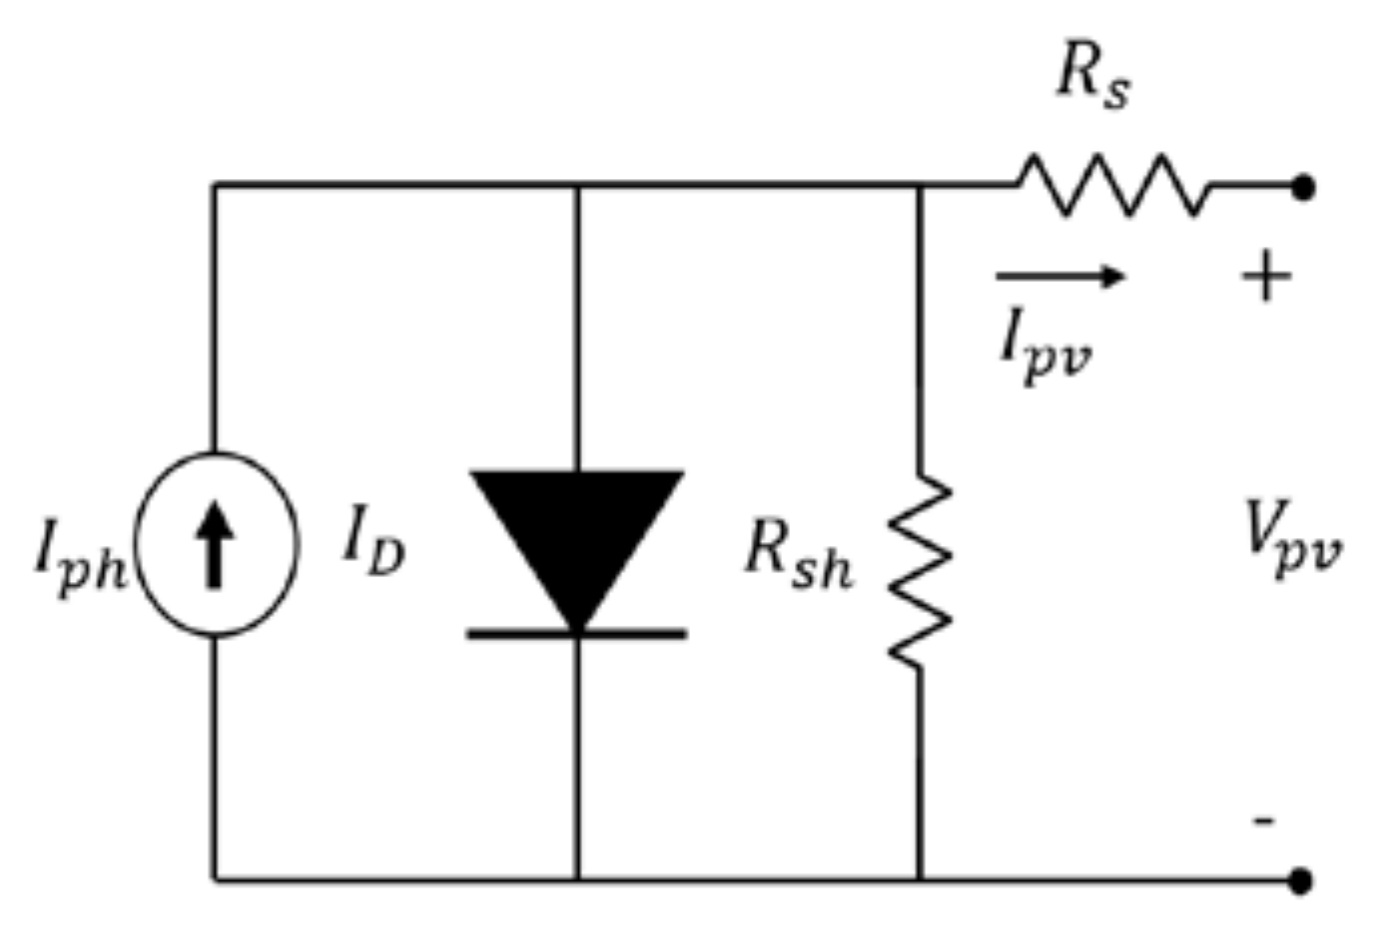
Figure 1 presents a single-diode circuitry of a PV cell. Apart from the temperature and solar irradiance values, the mathematical characteristics of the PV system are also affected by short circuit current and open circuit voltage, which are represented by
and
, respectively. These values, are generally obtained from the datasheet of the PV system given by the manufacturer. The output current of the PV system (
) can be derived using Kirchhoff’s law on the common node of the current source as illustrated in Equation (1). In which,
is the output current of the PV system where the load is connected.
represents the diode current and the
refers to the solar-generated current, which is influenced by the solar irradiance and the temperature.
The output energy generated from a single solar cell is insufficient to provide the energy required by any real-world application. Therefore, solar cells are typically connected in a series and in a parallel configuration to provide the required voltage and current at the output of the PV system. Given that
is the number of cells in the PV module, output current
can be calculated by substituting for
as shown in Equations (1) and (2). Equation (3) illustrates the output current. Furthermore, the output characteristics of the PV cell can be deduced by solving the following implicit form equation as given in Equation (4).
where
Io is the diode saturation current,
Tk is the operating temperature at 25 °C (a standard value),
q is the electron charge constant that possesses a constant value of 1.602 × 10
−19 °C, and
A and
K are the ideality factor and Boltzmann constant, respectively. In addition,
Vpv and
Ipv are the PV voltage and current, respectively, and the solar-generated current (
Iph) is determined by Equation (5). Contrary to a series resistor (
Rs), the parallel resistor (
Rsh) is ignored in the modeling process in some cases because it typically possesses high values that exert an insignificant effect on the output current. Where
Ki is the temperature coefficient and
Tdif =
Tk −
Tr is the deviation of the operating temperature.
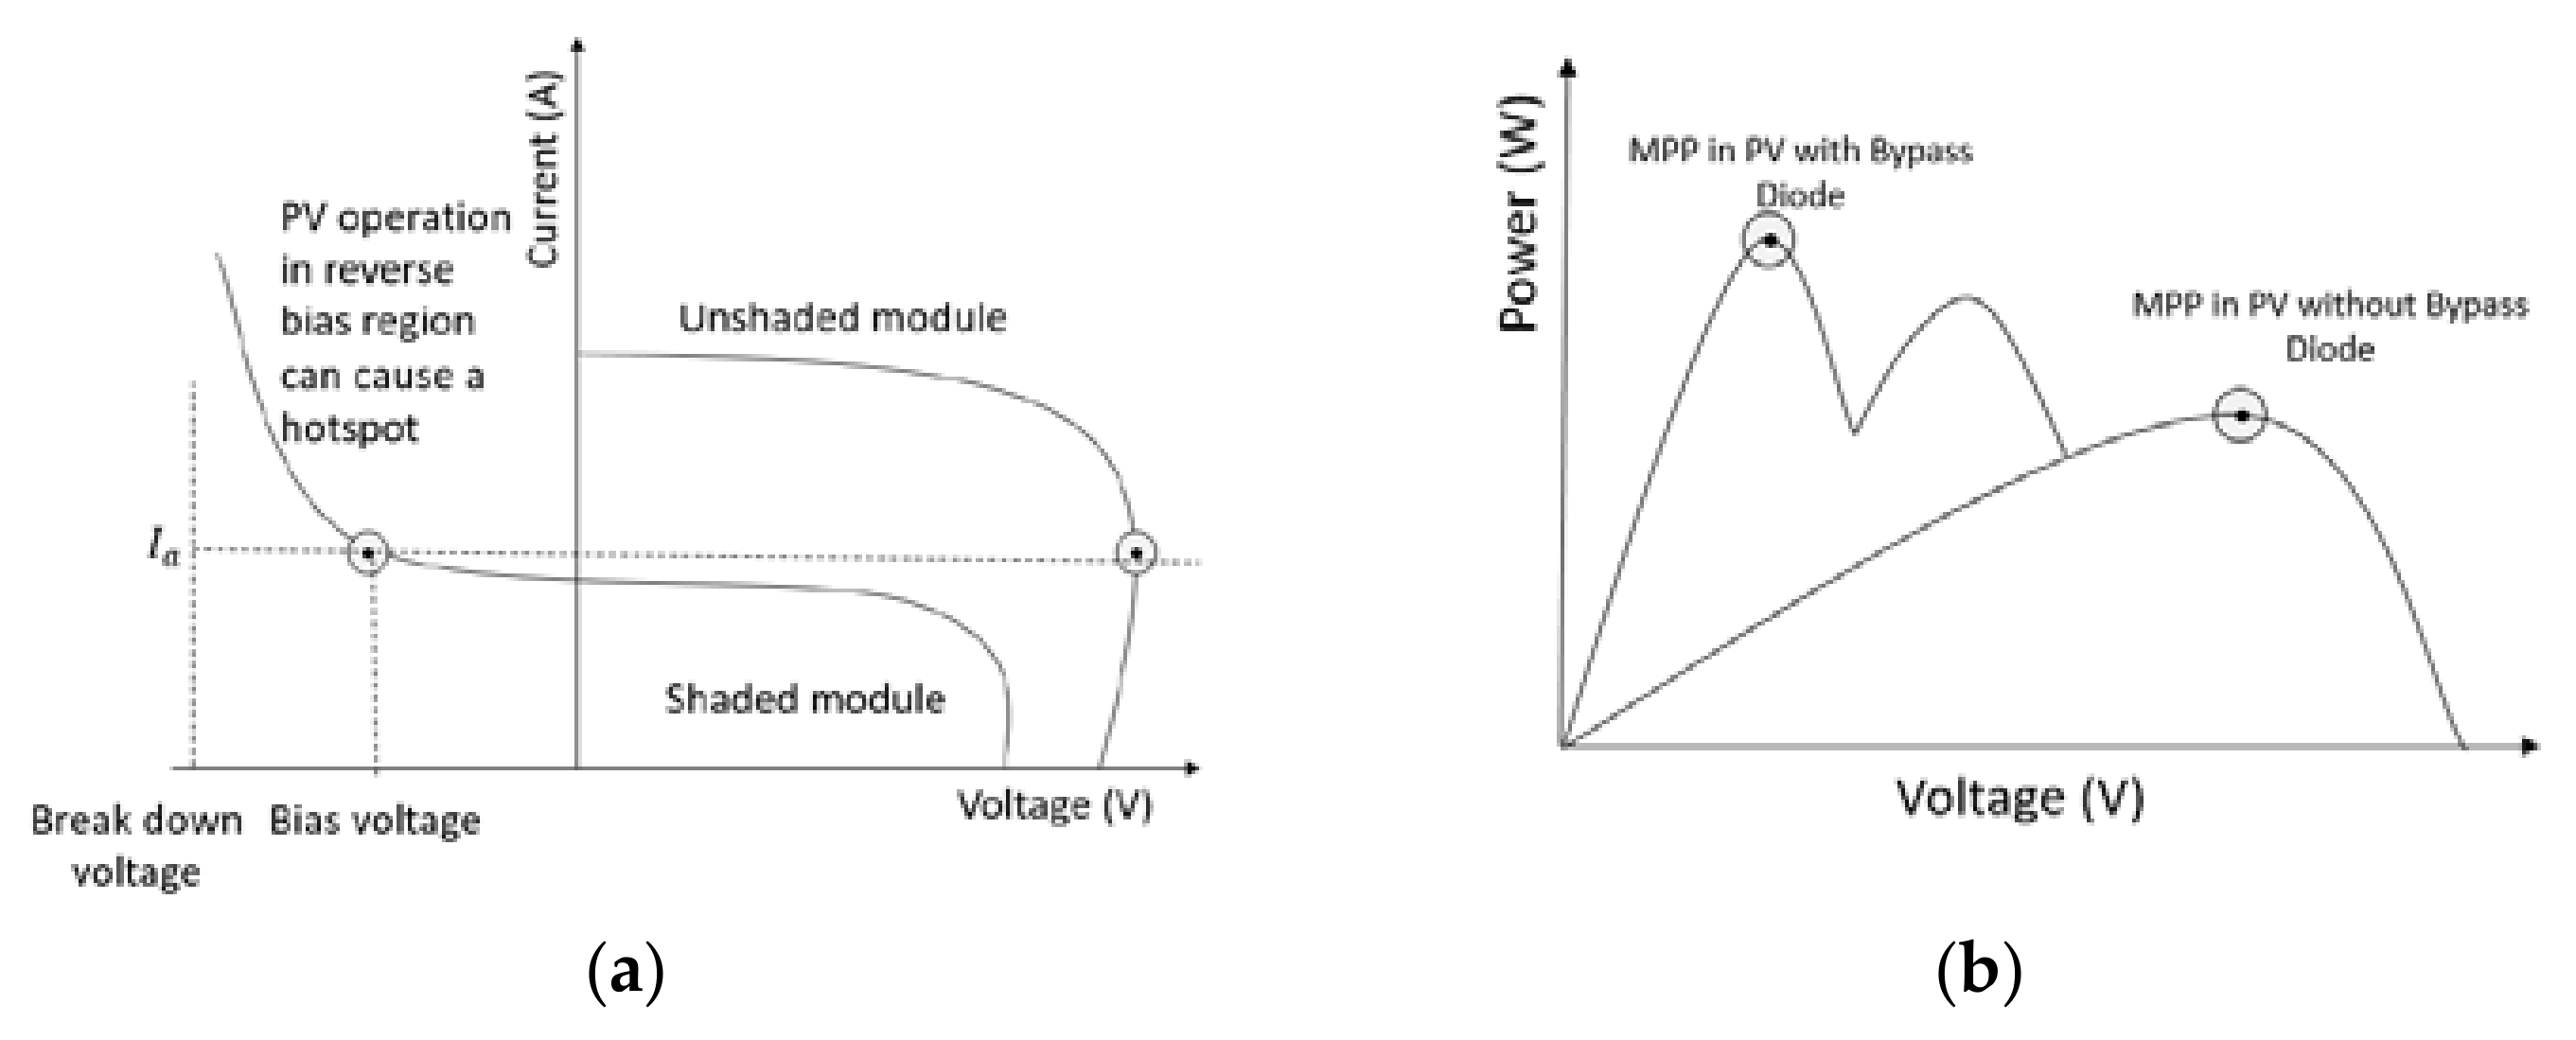
The abovementioned characteristics are related to a PV system that receives uniform solar irradiance levels. PV systems receive non-uniform irradiance levels due to mismatching conditions. The most common mismatching conditions are PS conditions, wherein the system is shadowed owing to the surrounding buildings or trees, moving clouds, or flying birds. Under these circumstances, the PV system receives several irradiance levels, which may cause irreversible damage to the PV module output. As shown in
Figure 2a, the non-uniformly distributed irradiance level, or PS condition, forces unshaded modules or sub-modules to operate in the reverse bias region to provide the same current as unshaded cells, because of the constant current flow through every module in a series configuration. Operation of a PV cell in the reverse bias region can cause a hotspot in a solar system, which damages the exposed cells in the reverse bias region and can ultimately cause an open circuit condition for the entire PV system. In order to protect the PV system and avoid damaging the shaded cells, a bypass diode is connected parallel to the entire or a section of PV module [
13,
28]. During the PS condition, the current flows through the bypass diode instead of the PV module to protect the latter. Despite the significant benefits of adding bypass diodes to PV modules, they increase the complexity of extracting maximum power from the system. The characteristics of PV systems with and without bypass diodes are different. The P–V curve in
Figure 2b shows that the PV array may present more than one peak during the PS condition. The conventional MPPT method may have difficulty in tracking the GMPP [
13].
DC-DC converter is one of the important component of the MPPT controller of PV systems, this creates a bridge between the load applied to the PV system and the PV array. Impedance matching technique is one of the most widely used approach in DC-DC converters to move the perturbed operating point of the PV arrays towards the GMPP. In general, DC-DC converters are categorized into two types namely, the isolated and non-isolated converters. The isolated converters have a major drawback in relation to the non-isolated converters in terms of the complicated structure which contributes to the higher preference of non-isolated converters over the isolated converter used for MPPT tracking of PV systems.
In the proposed system, evaluation of the bat algorithm is done using a non-isolated DC-DC converter. Various types of non-isolated converters like buck, boost, buck-boost, Ćuk and single-ended primary-inductor converter (SEPIC) converters exist and the operating region of the converter is dependent on the voltage and current equations governing the converter. A comparison of the VI relationship is made which helps in selection of the better suited controller for performing the MPPT tracking of PV systems. The impedance equation of the controllers is expressed by dividing the voltage and the current equations. The impedance associated with the PV array is the considered as the converter’s input impedance and the impedance given by the load applied to the system is considered as the output impedance of the PV system [
28]. The input impedance,
should match the maximum power point impedance,
to make sure that the PV array is operating at its MPP which is achieved by varying the duty cycle of the load in between 0 to 1. Whereas, the output impedance
remains a constant. The MPP impedance in expressed
.
Table 1 summarizes the relationship of the voltage, current and impedance equations of different DC-DC converters.
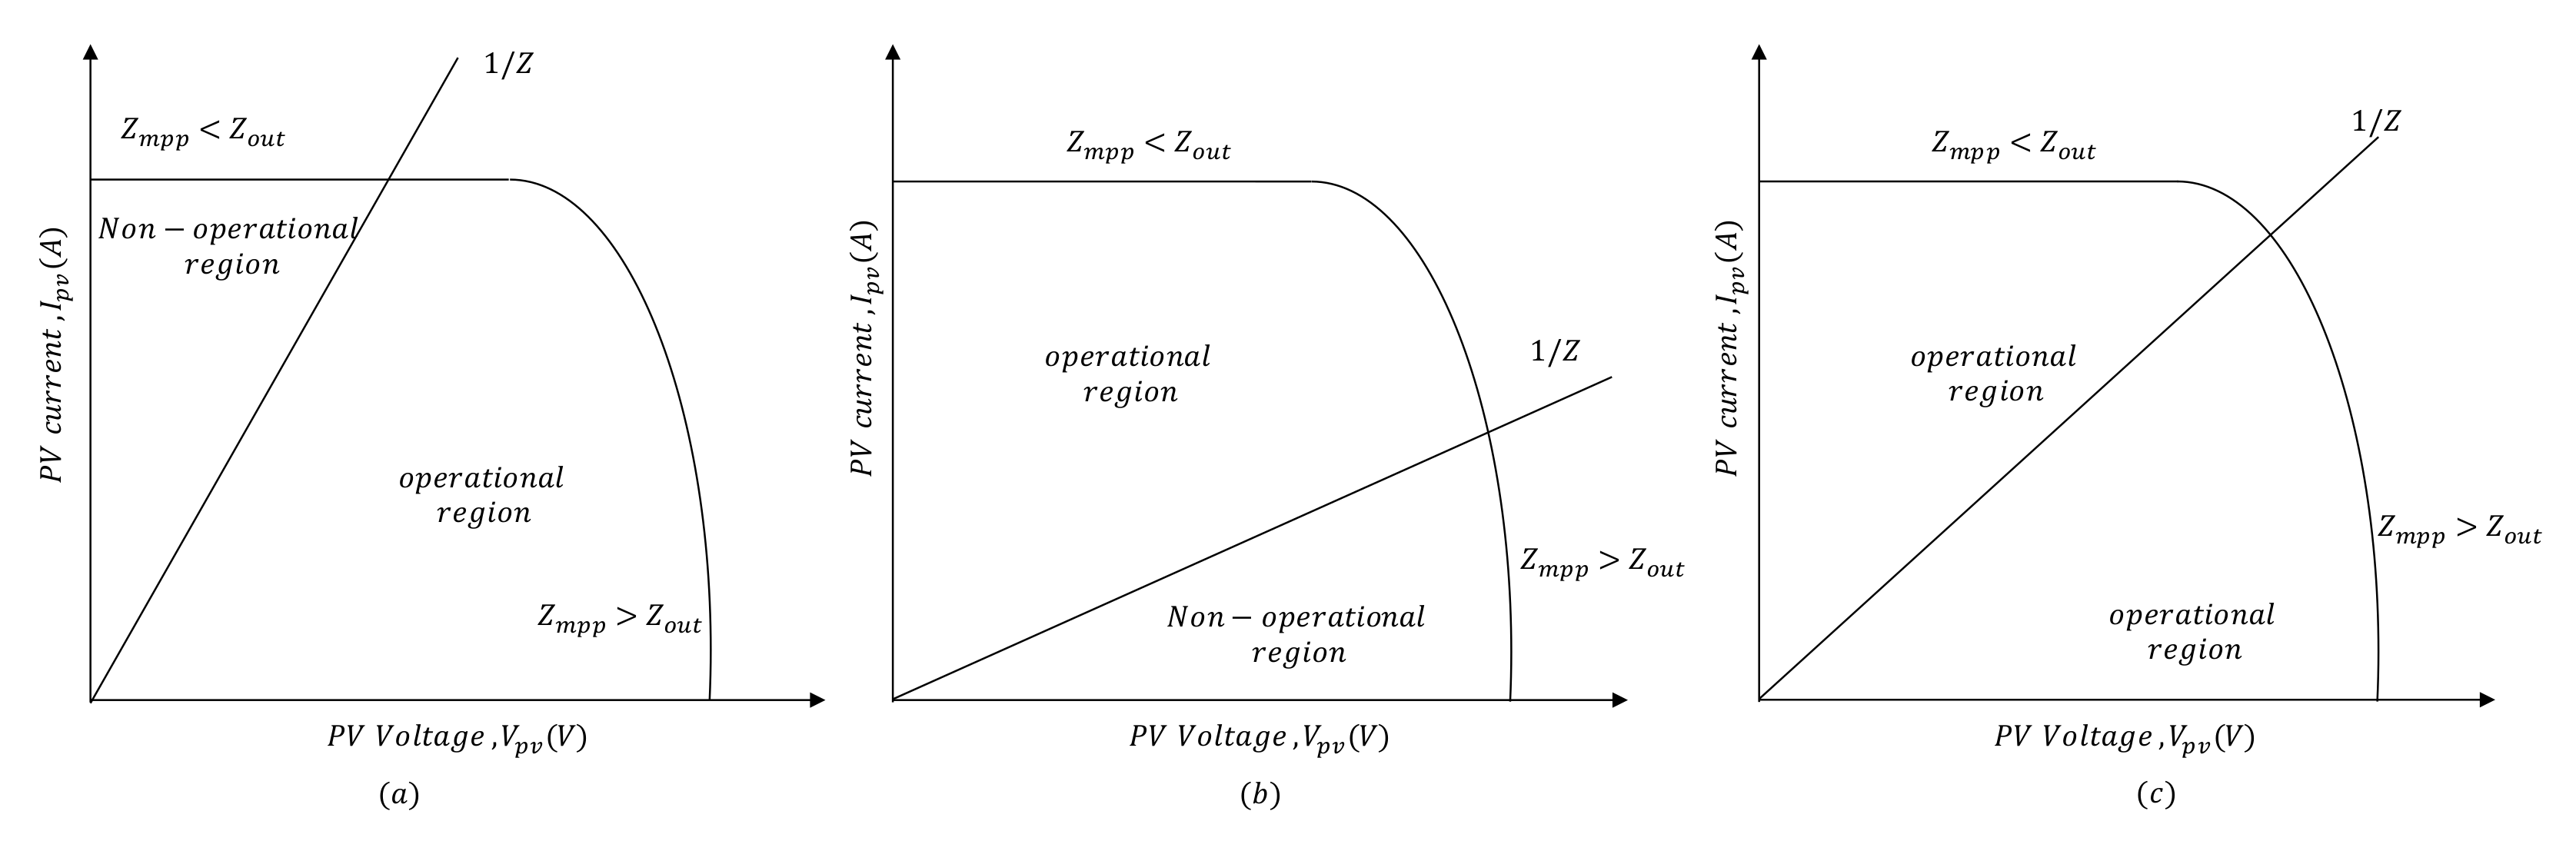
If the MPP impedance (
) is greater than the output impedance (
) for buck converters (
) and smaller for boost converters (
) it is not possible to operate at MPP. Considering this, a system that can step-up and step-down is preferred most, the buck-boost, Ćuk and the SEPIC converters fall in place under this category as illustrated in the VI curve shown in the
Figure 3. But there exists another issue with the buck-boost and the Ćuk converters as the output voltage is inverted and this may affect the output connection and the common ground for the PV system. Considering all these criteria’s single-ended primary-inductor converter (SEPIC) with no non-operational region and identical polarity is used as the DC-DC converter in the proposed system.
3. Proposed Methodology
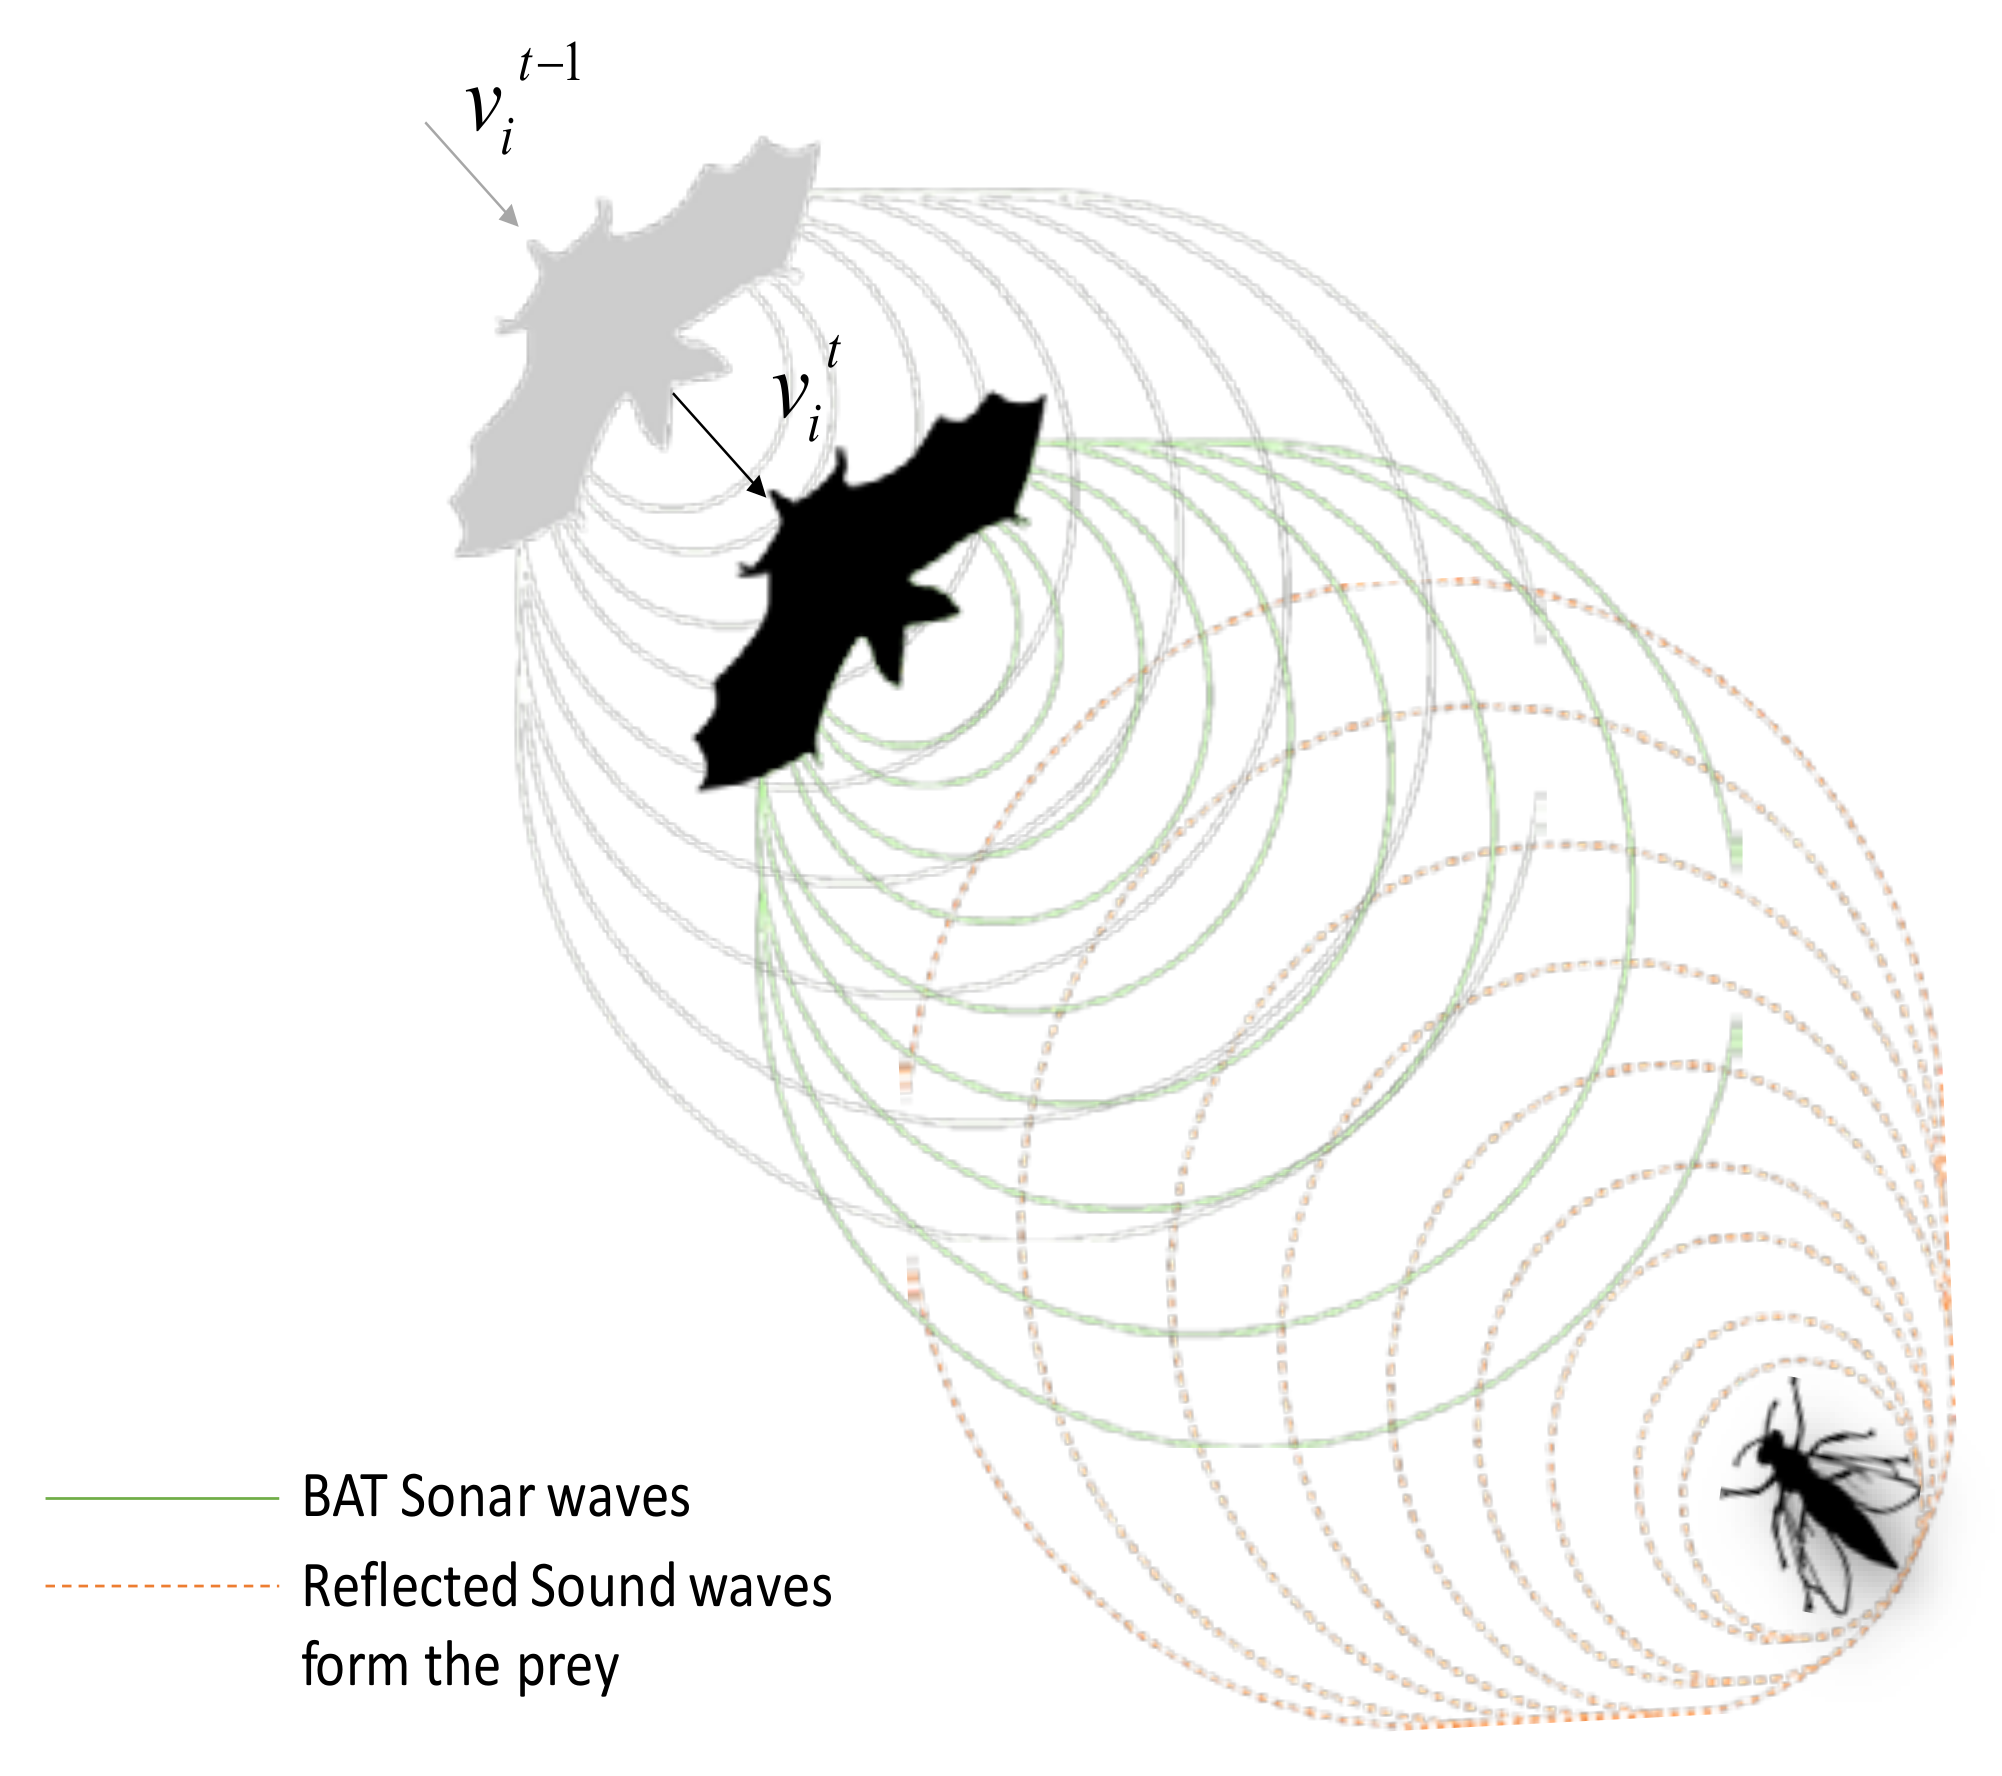
The PV system is exposed to different shading patterns because of the clouds, trees, and high-rise buildings in the urban landscape. This results in the nonuniform insolation of the solar irradiance, which, in turn, decreases the output efficiency of the PV system. The bat algorithm is one of the metaheuristic algorithms that is used to address the issues of MPPT of the PV system under PS conditions. The BA is formulated based on the studies made on the biological behaviors of bats, from which the fascinating concept of echolocation in the form of a sonar system is identified. The bats use this technique to move around, find preys, detect objects, and locate their crevices in the dark [
29,
30,
31]. In the process of echolocation, bats create pulses that vary depending on their hunting strategies and the species. These pulses are generated within a high-frequency range of 25–100 kHz, and the pulses can be differentiated from the other sounds in the ambient environment. Where, each pulse last’s up to 10 ms and each ultrasonic burst may last for 5–20 ms, and bats emit approximately 10–20 of such sound bursts every second [
29,
30,
31]. The pulse emission rate increases depending on how close the bats are to the prey. These emitted pulses are in the ultrasonic spectrum and can vary from the loudest range (up to 110 dB and occurs when they are seeking for a prey) to the quietest range (occurs when they are homing toward the prey). This procedure shows the great communication and signal processing of the bats in their prey searching behavior [
29,
30,
31,
32].
Figure 4 illustrates the principle of the Echolocation behavior in bats, where the green pulses represent the sonar waves that are sent by the bat and where the red lines indicate the reflected signal that is sent back from the prey or the obstacle. This significant behavior used by the bats is mathematically modeled as an optimizing algorithm called the BA, which is explained in the following section. The deployment of the BA that addresses the issue of the MPPT in PV systems under different PS conditions is explained in this work.
3.1. Bat Algorithm
On the basis of the abovementioned behavior of bats, Xin-She Yang developed a new metaheuristic optimization algorithm in 2010 [
33]. Microbats use echolocation to navigate environments, detect prey, and locate crevices for roosting in the dark [
33,
34,
35]. The echolocation process involves emitting a loud sound pulse and then listening to it as it bounces back from objects. Metaheuristic algorithms employ a trade-off between local searching and randomization. Randomization provides a valuable method for avoiding a local searching process for different locations within the search space. Nearly all metaheuristic algorithms are used for global optimization. A detailed explanation of BA can be found in references [
33,
34,
35,
36], and a summary of the theory and operation of the algorithm is presented in the subsequent section.
The bat algorithm is based on the microbats’ idealized characteristics listed below.
Bats use echolocation to determine distance and can differentiate obstacles from their prey effectively.
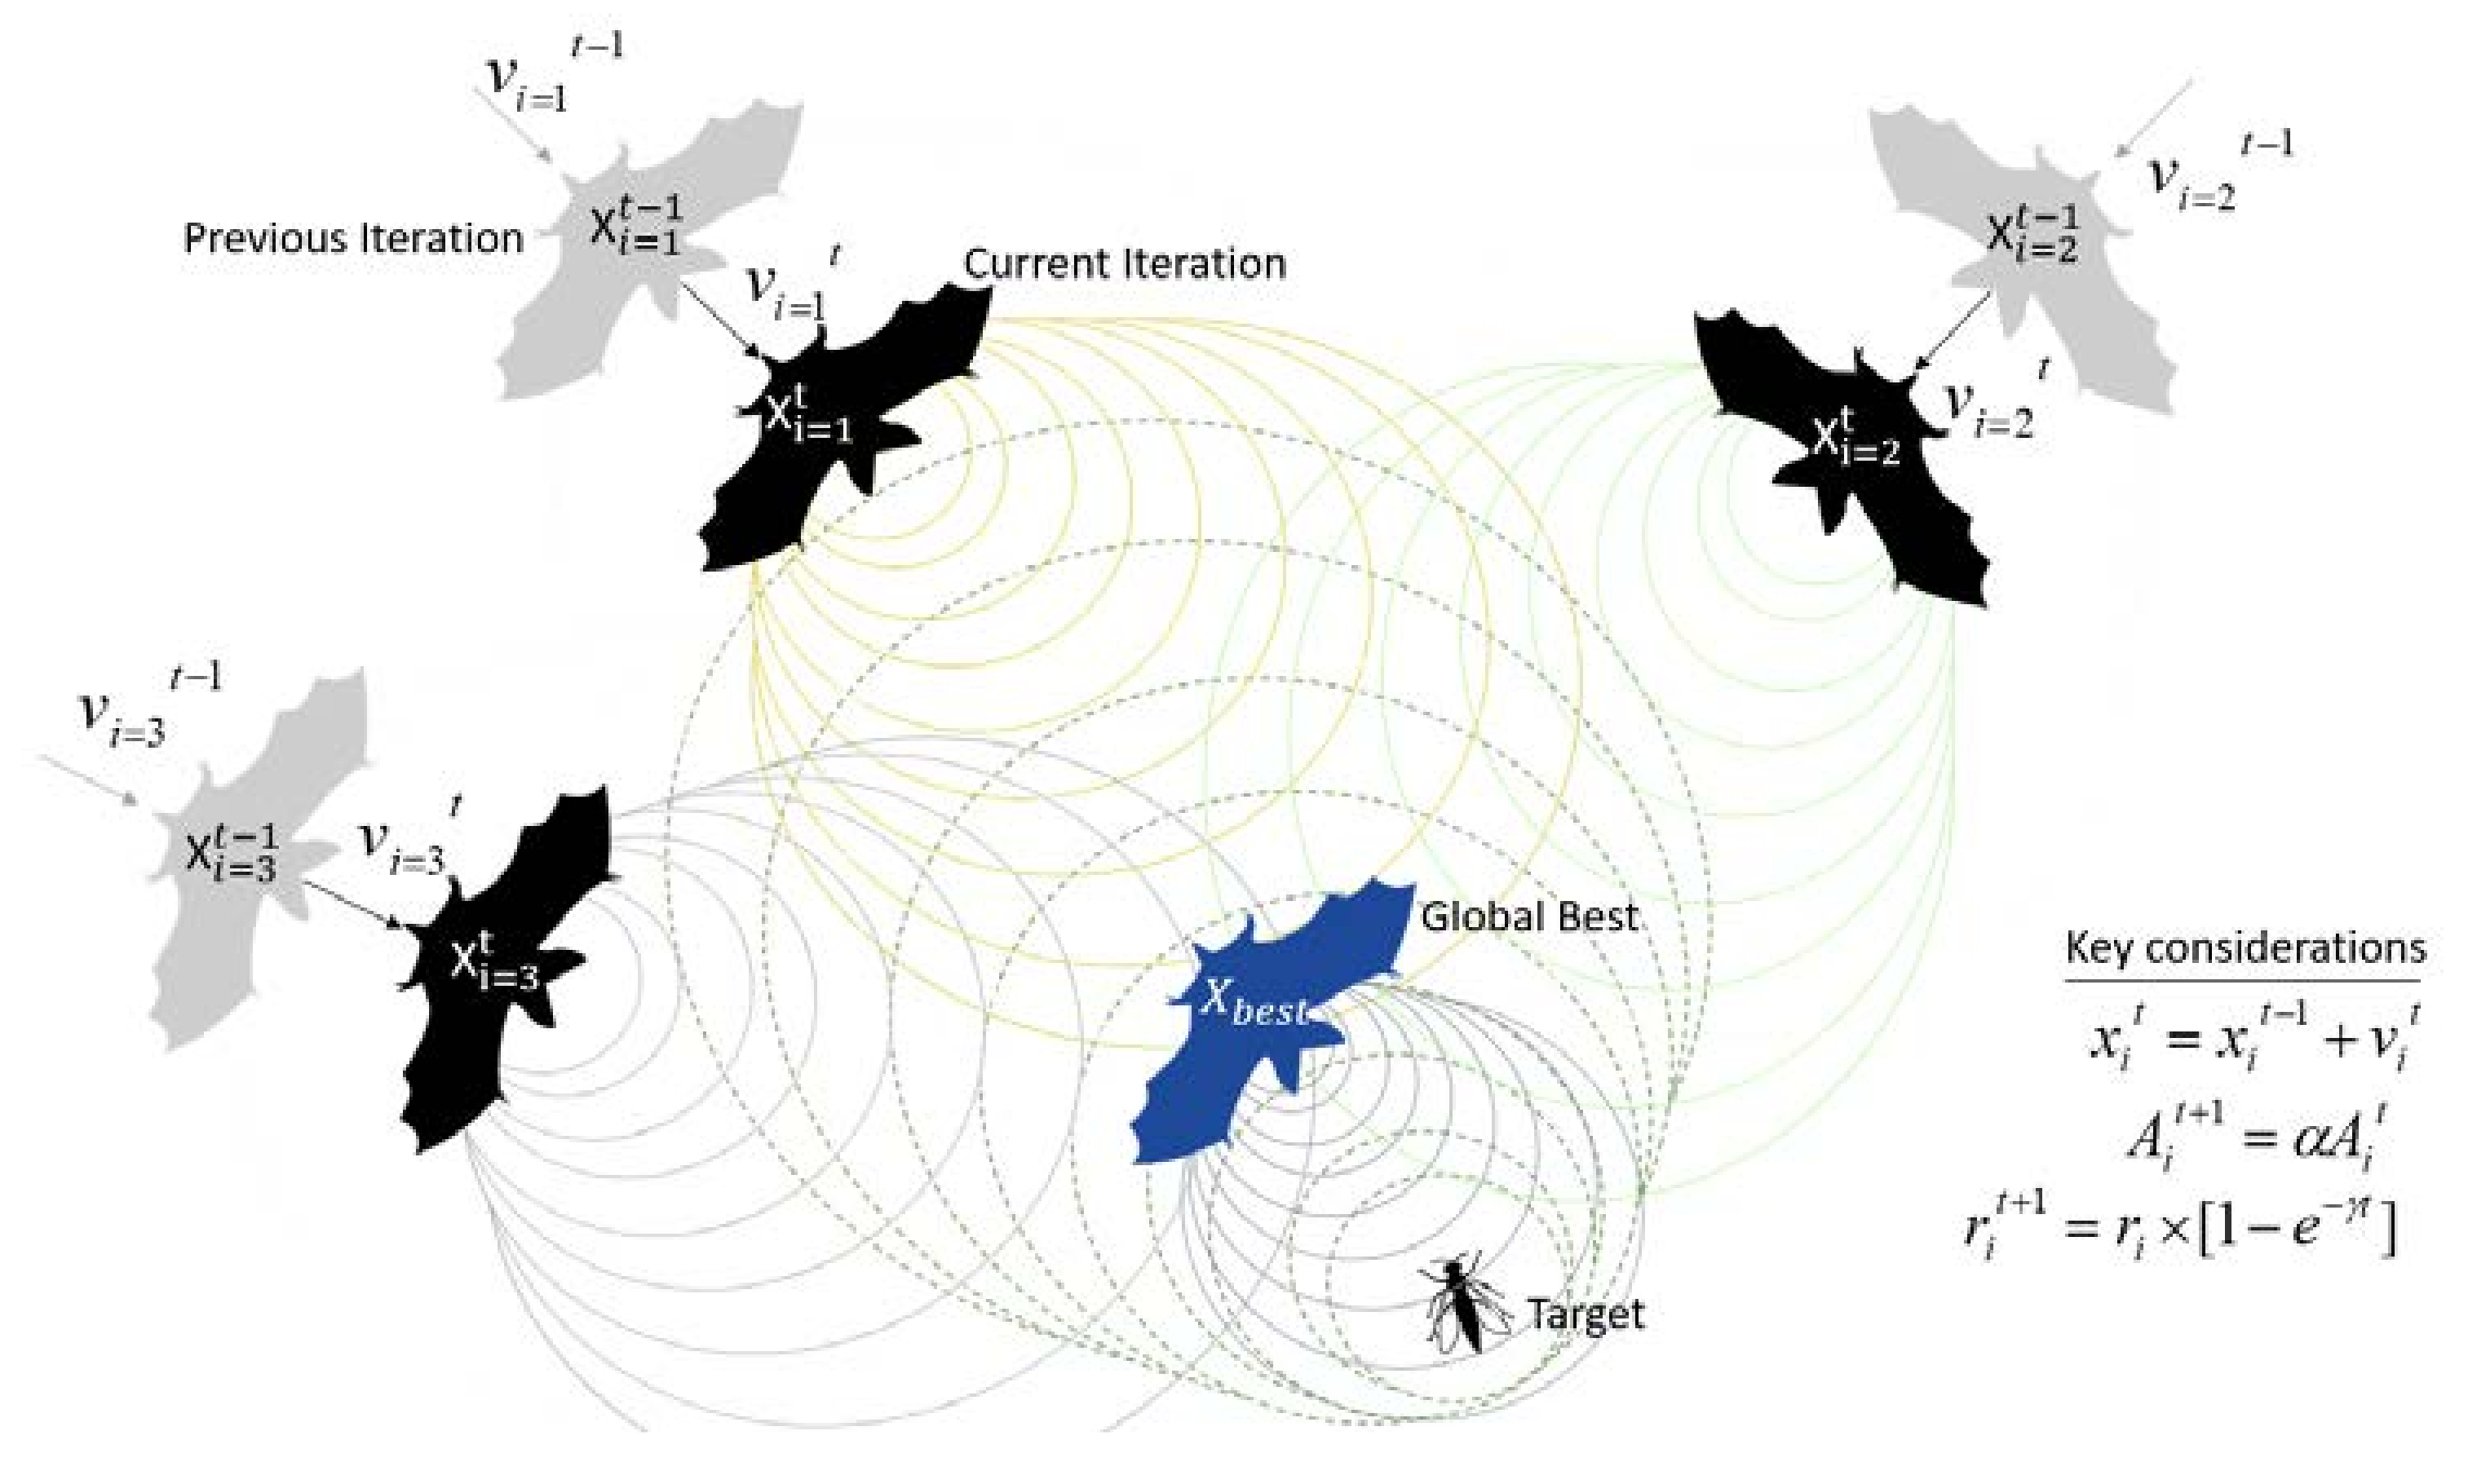
Bats fly in random directions at a velocity of vi from position xi to search for prey using the echolocation of a fixed frequency fmin with varying wavelength λ and loudness of A. Bats automatically adjust the wavelength (or frequency) of the emitted pulses and the rate of pulse emission r ∈ [0, 1] based on the proximity to the targeted prey/food.
Loudness varies from a large positive value of A to a minimum constant value Amin. The initial population, that is, the number of virtual bats is randomly generated, and ranges from 5 to 30. After determining the initial fitness of the population for the defined objective function, the fitness values are updated based on the movement, pulse rate, and loudness of the bat and then modified based on the global optimum position.
In the initial step of the algorithm, we declare the total number of bats considered for this optimization problem, and the pulse frequency is defined along with the loudness and the number of iterations represented by
t <
Tmax. New solutions generate every iteration by modifying the pulse frequency and assuming that the wavelength maintains a constant value. For each individual bat in the search space, the velocity
vi and the location
xi are updated based on several rules, which also contribute to the bats’ rate of convergence to an optimized global position. These rules are given by
where
β ∈ [0.1] is the random vector derived from the uniform distribution. The virtual bats in the search space have their current global best solution at
x.
After selecting one item from the current best solutions, a new one is generated locally for each bat by using random walk approach as illustrated in Equation (9).
where
ε ∈ [−1, 1] is a random number. The rate of pulse emission
ri and loudness
Ai are updated accordingly as the iterations progress. As the global optimum position approaches the prey/food, the loudness decreases and the rate of pulse emission increases.
As the number of iterations increases loudness
Ai, the rate of emission
ri is updated based on the following expressions. As the bats become closer to the global optimum, the pulses’ rate of emission increases and the loudness
A decreases. These relationships are mathematically expressed as Equations (10) and (11).
where
α and
γ are constants for any 0 <
α,
γ < 1. In this study
α =
γ = 0.9. In addition, the initial values for loudness
Ai, the rate of emission
ri are 0.7 and 0.5 respectively.
Meanwhile, in the Equation (12) the initial value of the loudness A is within the range [1, 2], whereas the initial emission rate
ri is within the range [0, 1].
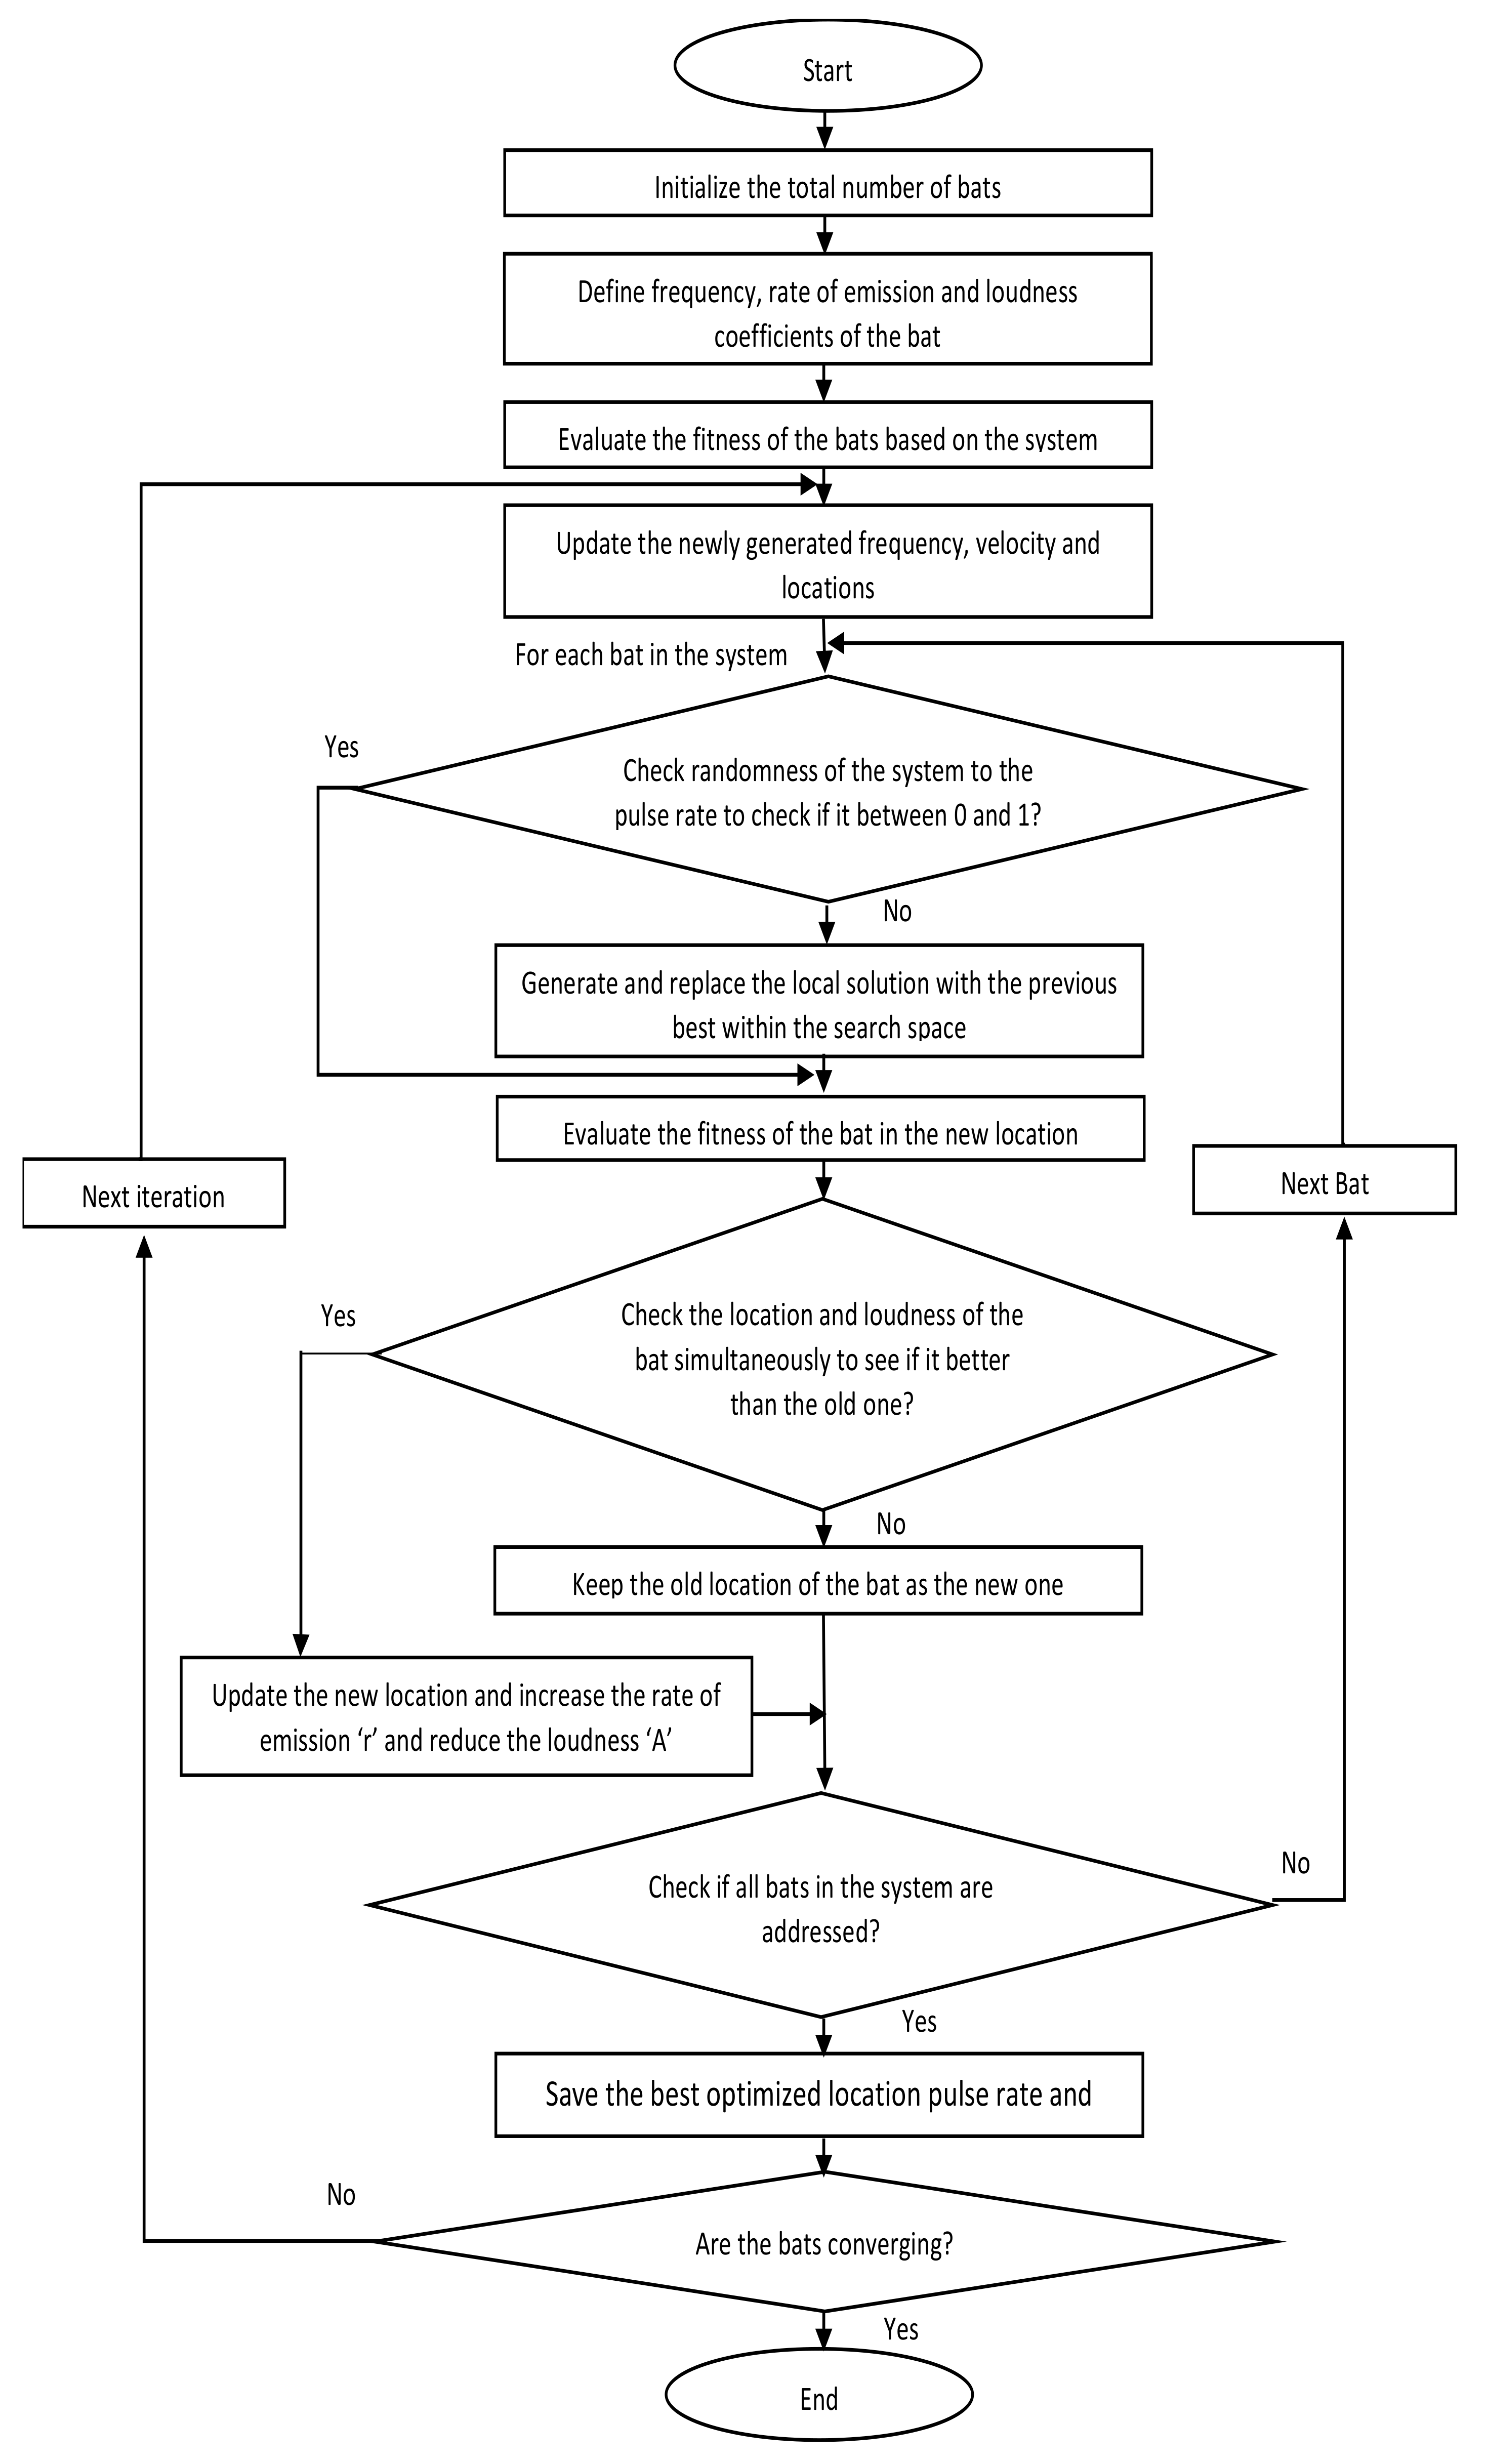
Figure 5 illustrates the visual representation of the process of bat echolocation system for finding the global optimum position [
37] and the process of obtaining the modified position and velocity vectors using the BAT algorithm. Followed by this the flowchart explaining the flow of the optimization process using the bio-inspired BA is shown in
Figure 6. This section presents the detailed explanation of the mathematical concept of BA. The deployment of the BA in finding the MPPT of the PV system under three different PS conditions is explained in the following section.
3.2. Implementation of the Bat Algorithm in the Maximum Power Point Tracking
The optimization search space in the BA-based MPPT refers to the PV output power vector related to the converter duty cycle. The bats in the BA refer to a duty cycle in Equation (13), which can be a potential solution for the MPPT optimization. Here, Bn refers to the number of bats that participate in the optimization, and the objective function is the PV output power measured for each duty cycle signal. An appropriate stopping condition is required for the algorithm to end the tracking process and finalize an appropriate duty cycle for a steady-state operation. A predefined algorithm iteration is considered in many studies for the stopping conditions of optimization. In this study, the stopping condition occurs when the fitness difference of all participating bats is less than a small predefined error or when the iteration count crosses the predefined iteration count which could be configured when running the simulation results. This is the place where the optimization algorithm converges.
In practice, sudden changes occur in the output voltage that is generated due to the different shading patterns or irradiance levels. Therefore, the position of the GMPP in the output characteristics of the PV system changes depending on the different shading profiles exposed by the PV system. A reliable technique for estimating the GMPP must abruptly detect these conditions and provide the appropriate duty cycle for the converter. This duty cycle represents the GMPP tracking at the output of the PV system under the latest condition. In the proposed MPPT approach, these variations are detected if the condition presented in Equation (14) is satisfied during the tracking period.
where
J(
Xi) represents the PV output power for the
ith particle in the search space, and ∆ denotes the minimum variation that reinitializes the algorithm to find the new GMPP.
4. Results and Discussion
Partial shading presents a stochastic nature and an unpredictable pattern like any other environmental condition. Therefore, no limit exists for the number of PS conditions that may occur in the real world. This study uses three shading patterns in evaluating the performance of the proposed BA-MPPT technique, and each pattern represents the different levels of PS conditions, from minor to critical shading impact. In the first condition, which is a minor partial condition, the GMPP is located within the initial part of the duty cycle search space and is the first peak on the output P–V curve of the system. Whereas, in the second PS condition, which refers to a moderate condition, the GMPP is the last peak in the multiple peak characteristics at the output of the affected PV system. In the third condition, the GMPP is among the multiple local maxima. This condition refers to a critical shading condition, because the tracking unit must explore the entire search space within a short period to detect the GMPP at the middle of several local maxima.
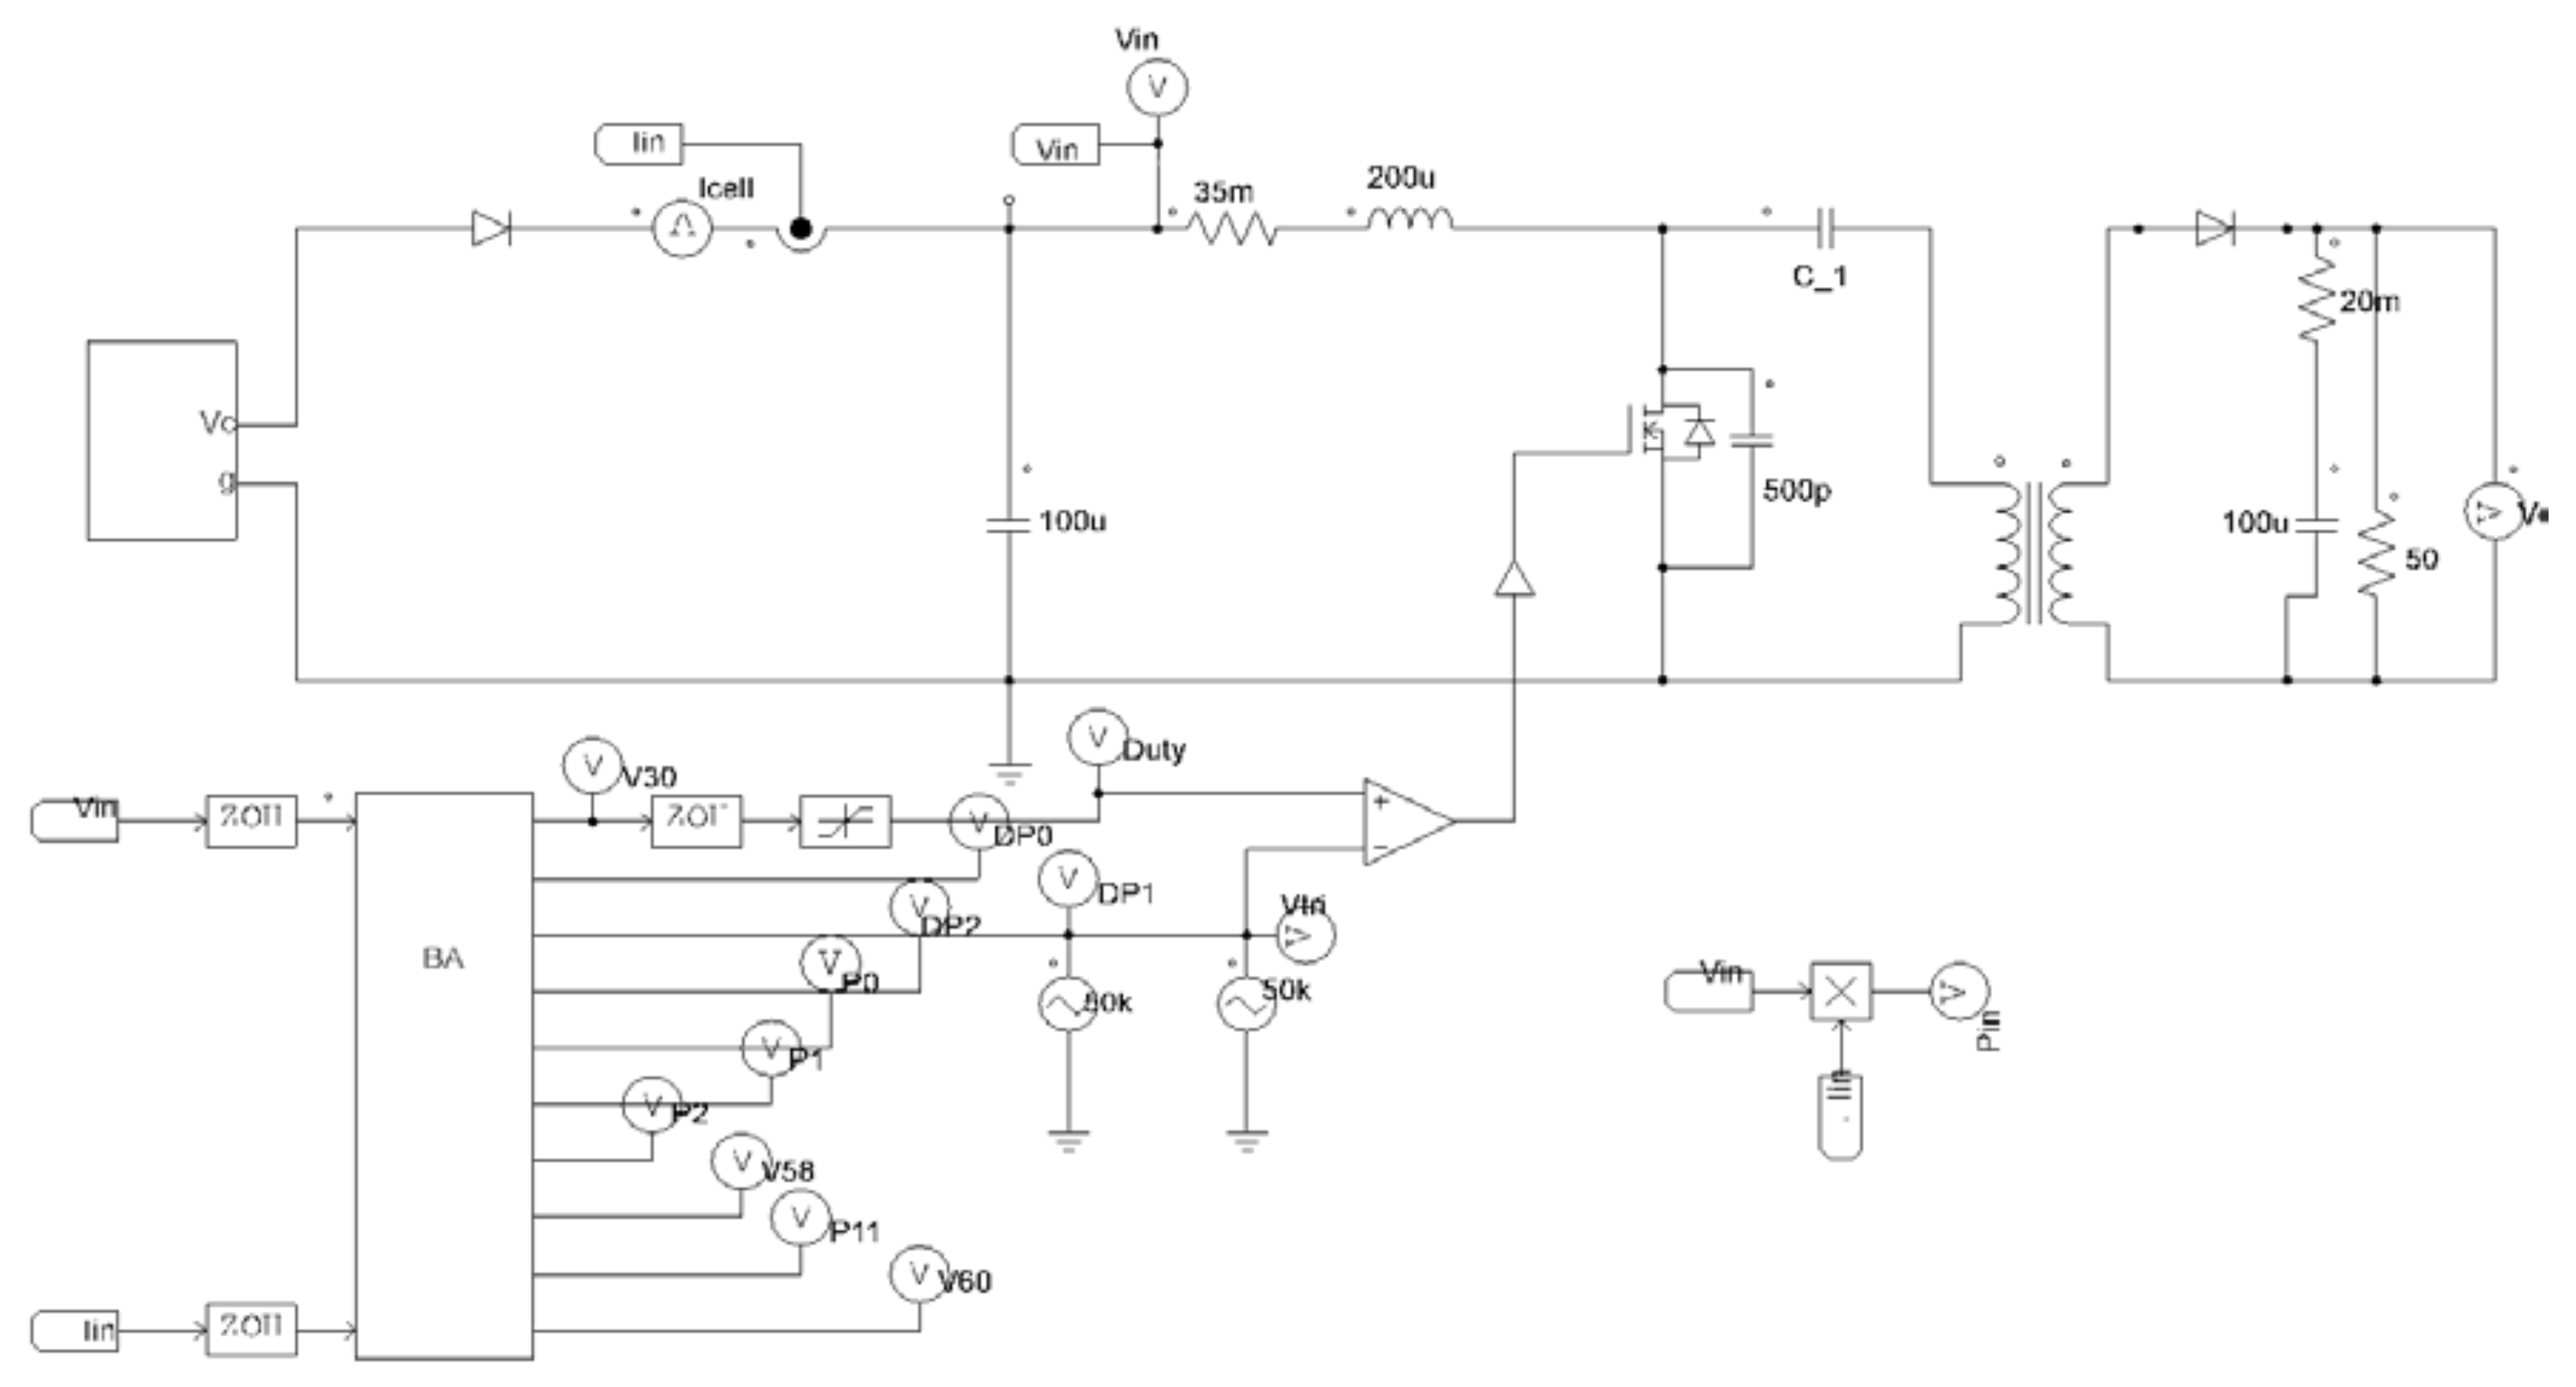
The three conditions are chosen on the assumption that they cover a large proportion of PS conditions and can provide a solid foundation for evaluating the proposed MPPT technique. The simulation of the proposed algorithm is carried out in PSIM (Powersim Inc., Rockville, MD, USA). The PSIM (Powersim Inc.) model of the proposed system is shown in
Figure 7. An isolated SEPIC is used as the DC–DC converter in the proposed PV system that is simulated to test the tracking of maximum power output under partial shading conditions. SEPIC converters can step up or down the input voltage similar to buck-boost converters as explained in the
Section 2. The operational region of the selected DC-DC converter in a continuous conduction mode makes it an ideal selection over the other non-isolated converters. The wide range of the region and the independence of irradiation, temperature, and output load are considered the main reasons for selecting the SEPIC converter for the above setup. The values of the SEPIC converter components that is used for the simulation are
Cin =
Cout = 100 μF,
Cs = 50 μF,
L = 200 μH, and
Rload = 50 ohm.
The PV module used in the simulation is the Mitsubishi PV-AE125MF5N (Mitsubishi Electric, Chiyoda, Japan), and the rating of the PV module is stated in
Table 2. The sampling time of the MPPT controller is set to 0.05 s, which follows the settling time required by SEPIC. The switching frequency of the converter is 50 kHz. The PV system in this study consists of 10 PV modules connected in a series, and each possesses 1 bypass diode. The first PS condition involves four modules that receive 200 W/m
2, two that receive 300 W/m
2, one that receives 400 W/m
2, one that receives 600 W/m
2, and two that receive 1000 W/m
2 levels of solar irradiance.
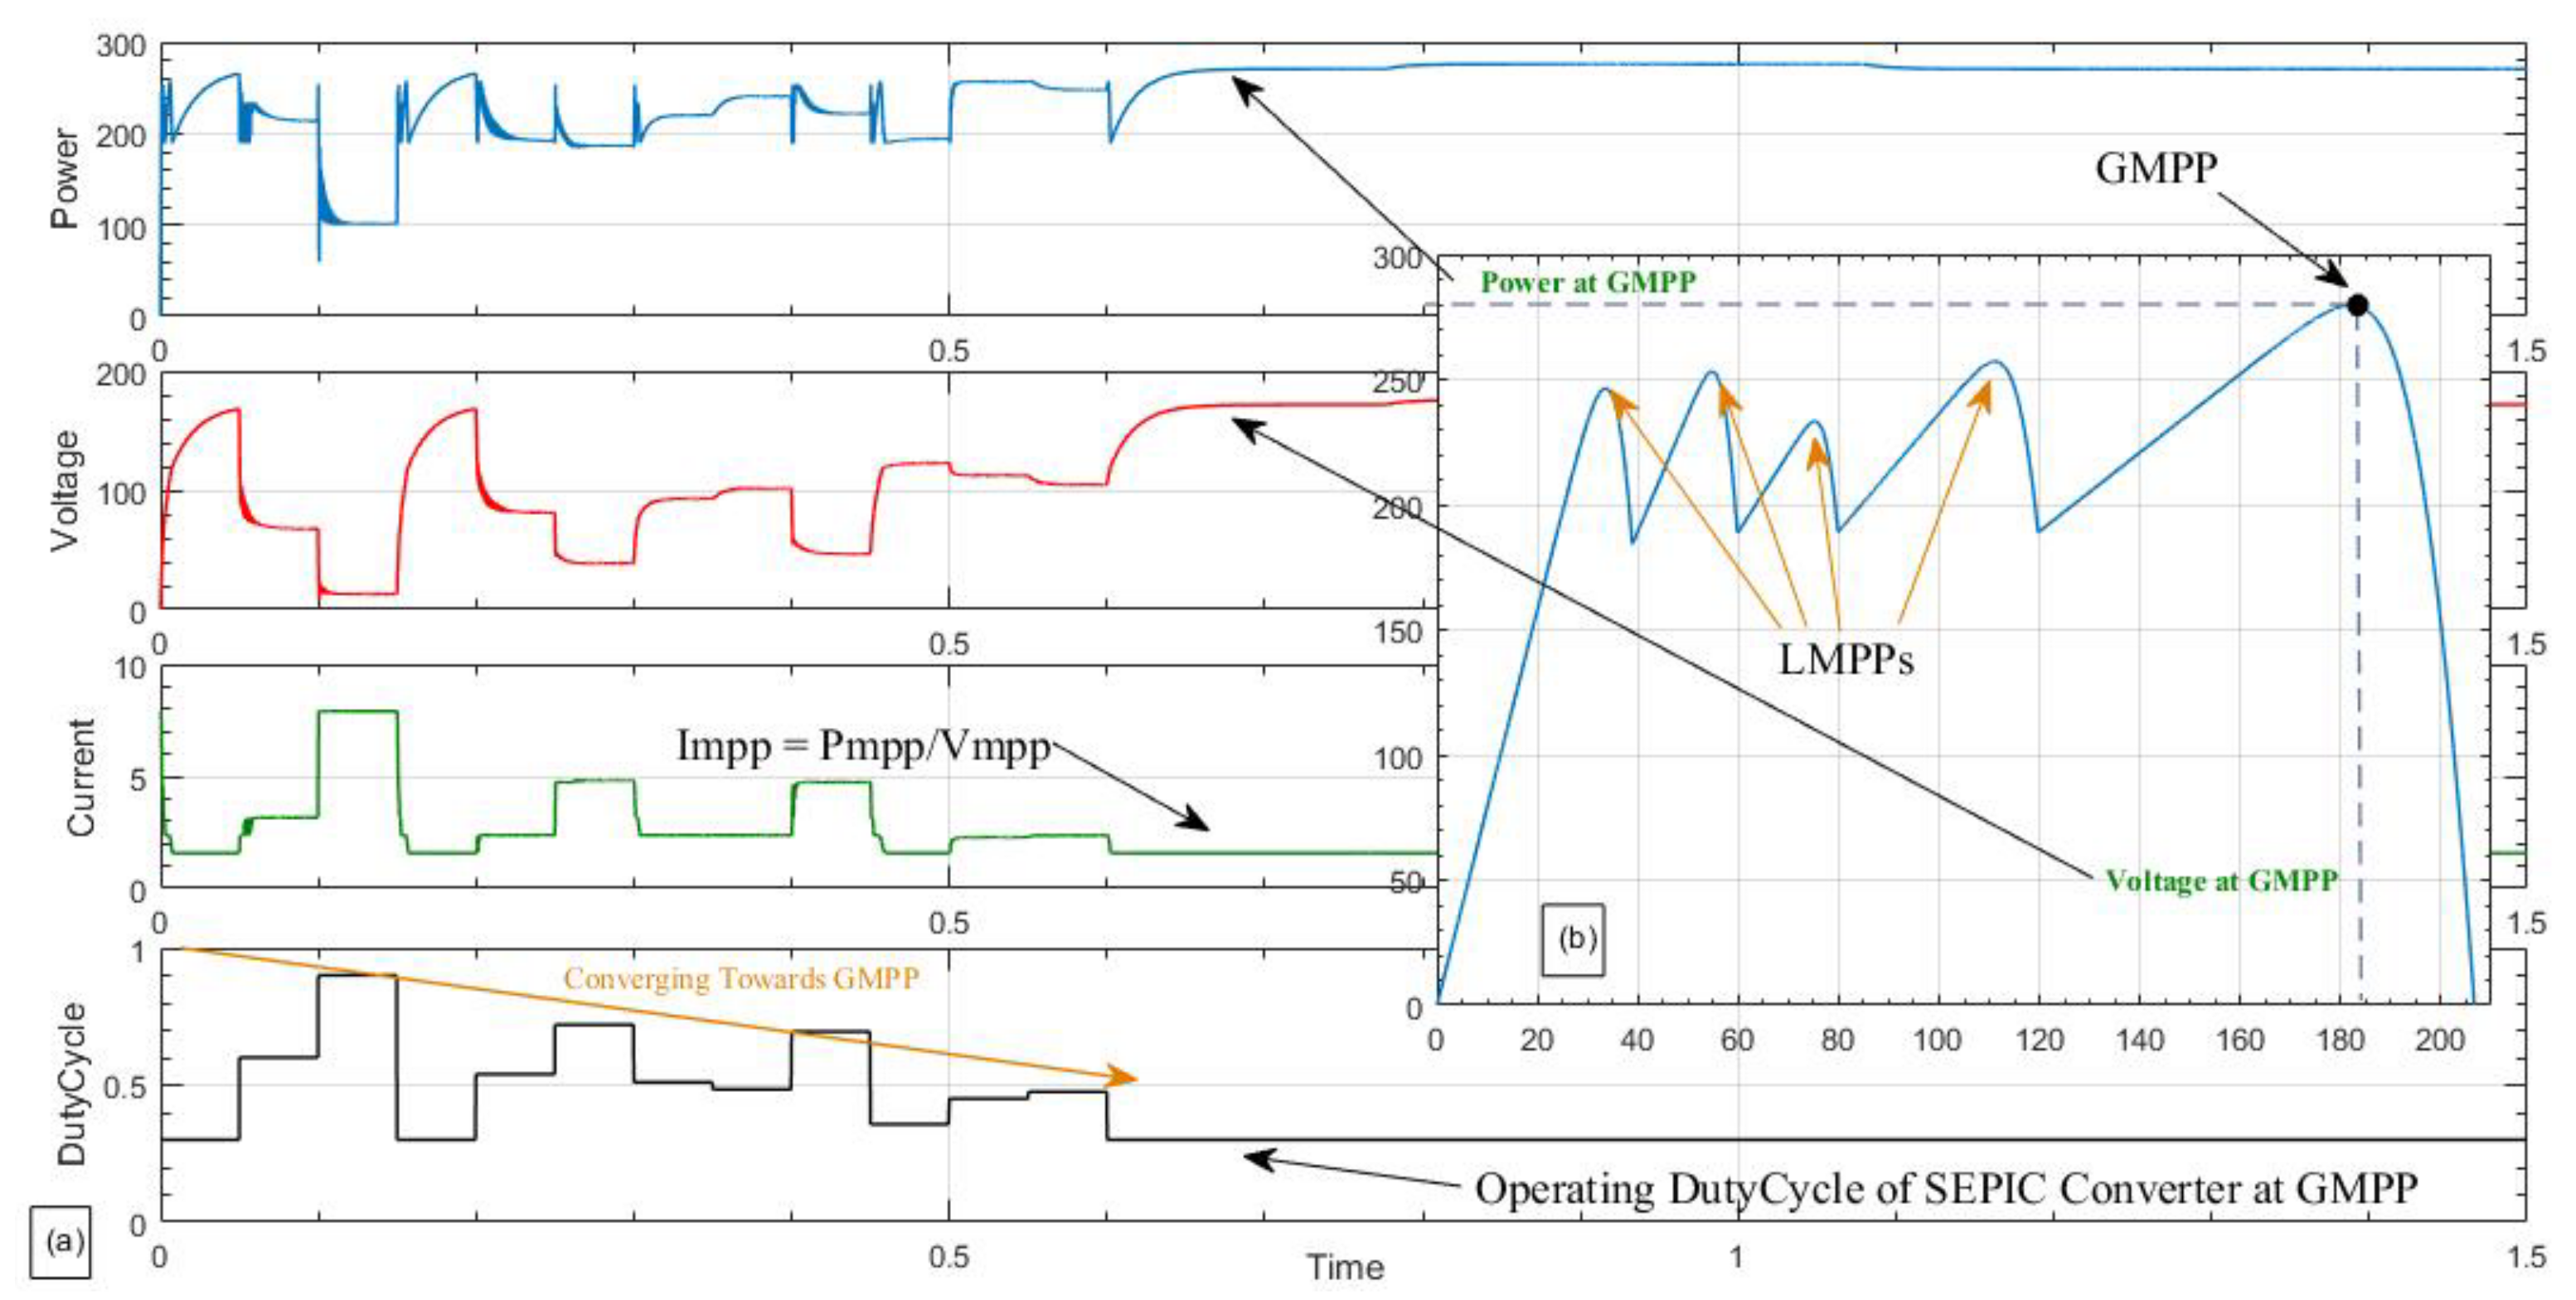
Figure 8a shows the P–V curve for this condition. Under this condition, the GMPP occurs in the initial part of the duty cycle search space.
Figure 8b shows that the proposed MPPT technique tracks the GMPP by approximately t = 0.7 s. Several conventional methods based on the hill climbing approach cannot track the GMPP under this condition.
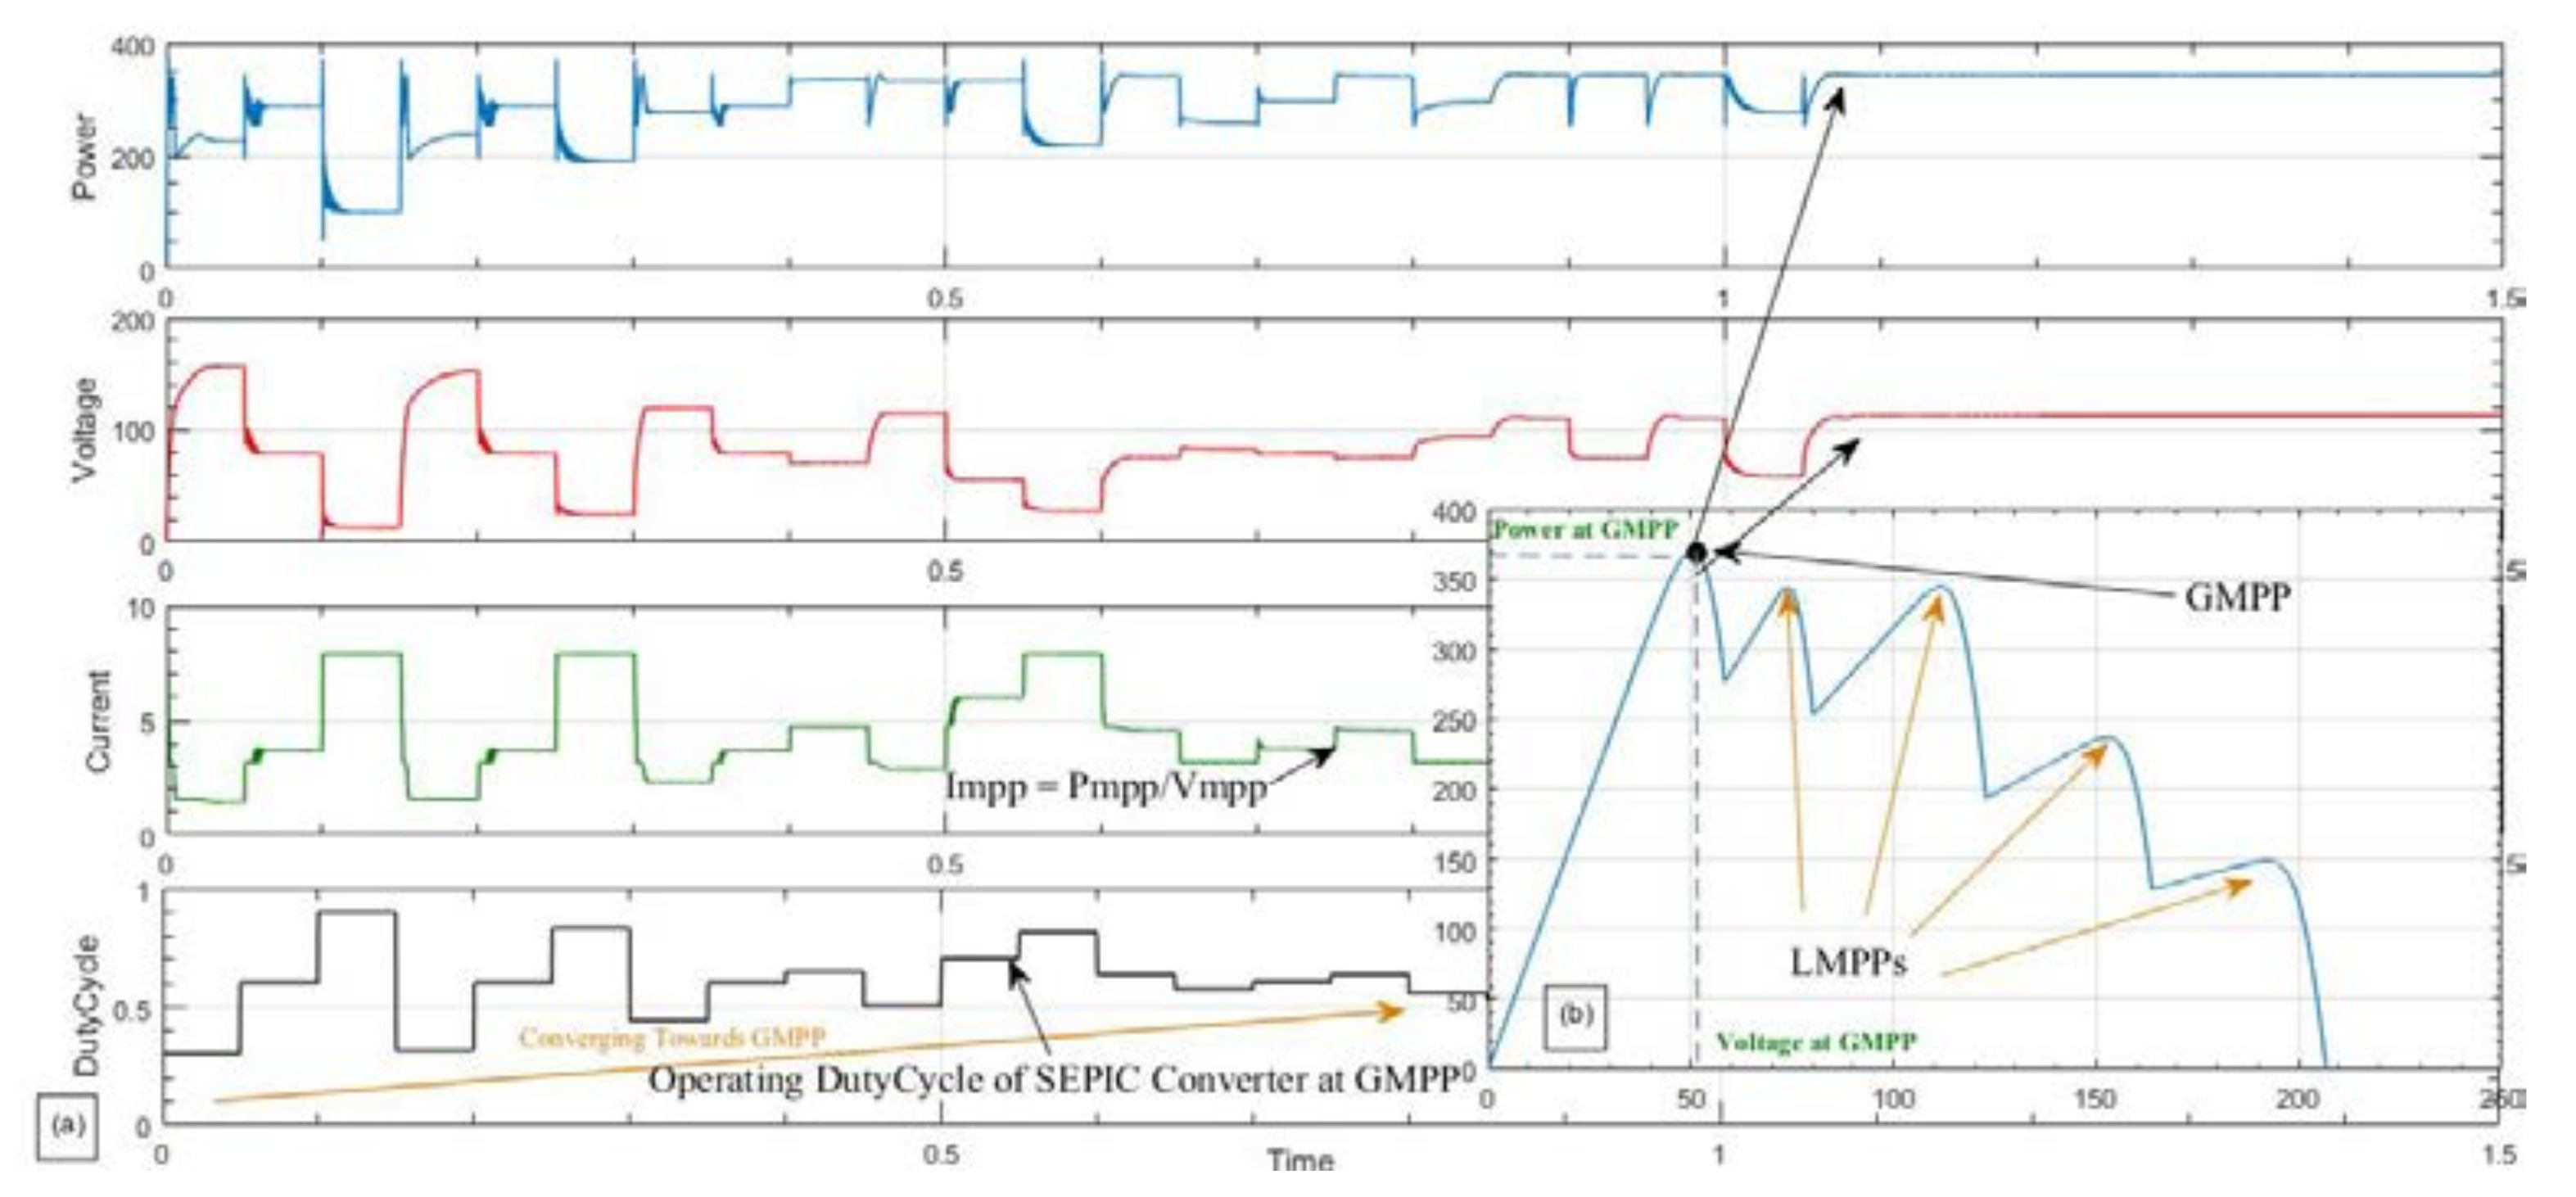
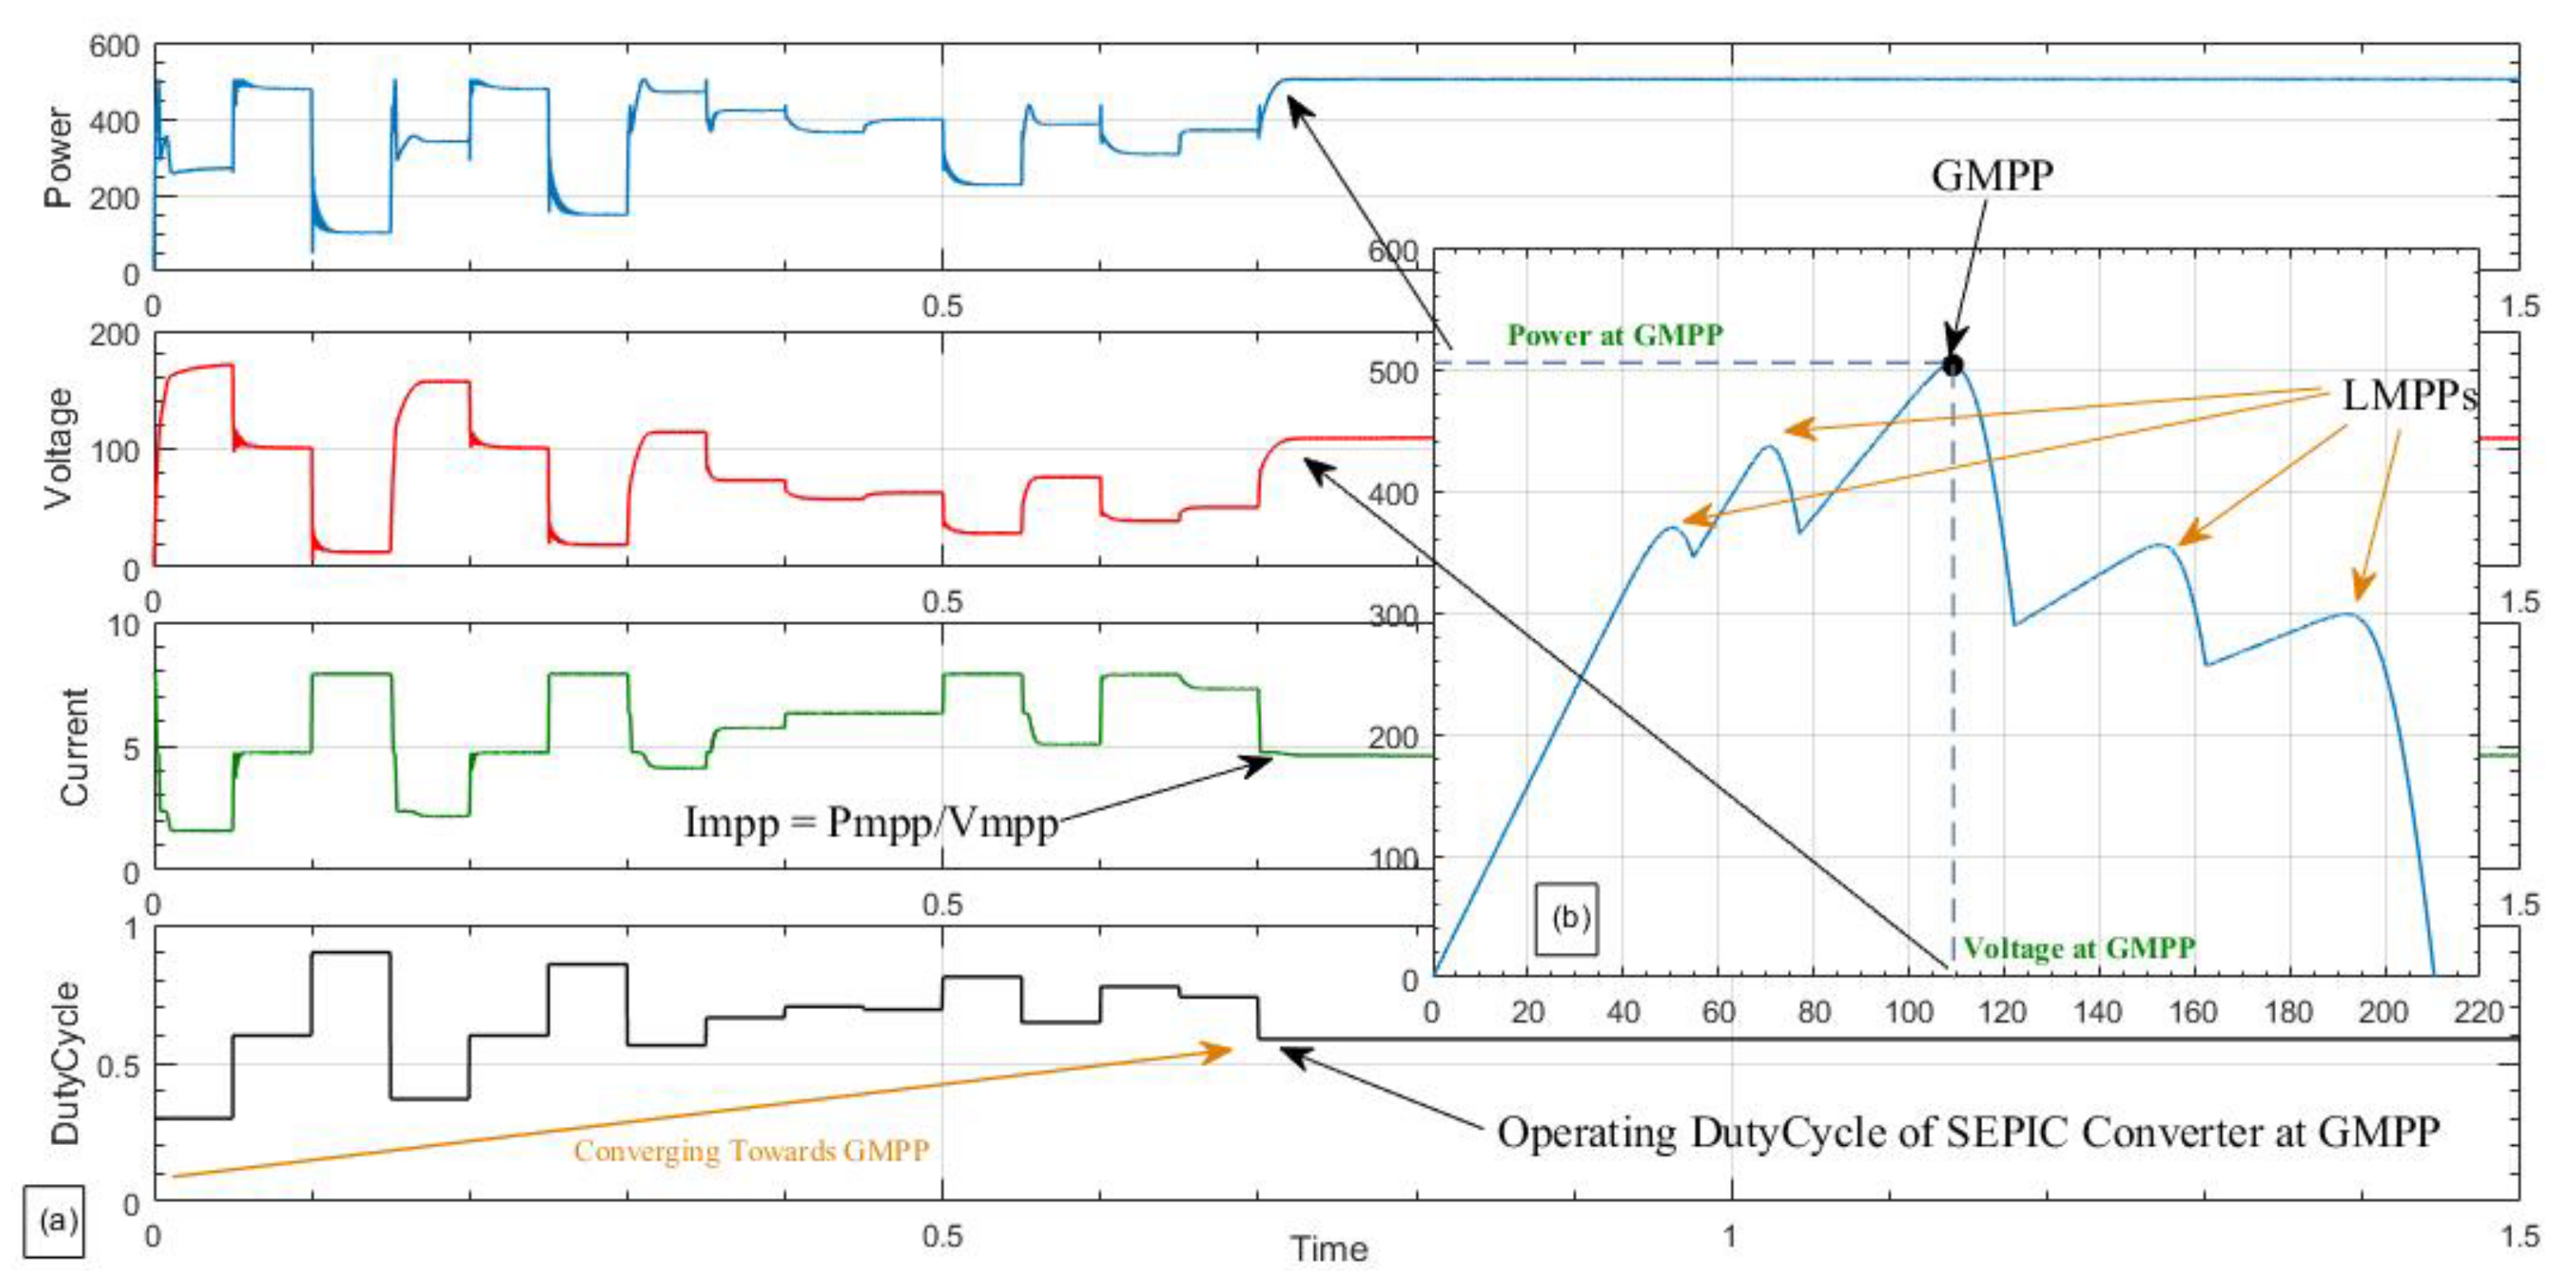
The third PS pattern is simulated when the GMPP is located between two MPPs for further evaluation of the proposed method. In this condition, 10 PV modules receive various solar irradiance levels. Of these modules, two receive 300 W/m
2, two receive 200 W/m
2, two receive 600 W/m
2, one receives 800 W/m
2, and three receive 1000 W/m
2.
Figure 10a presents the resulting P–V characteristic, while
Figure 10b shows the performance of the proposed method. The fast convergence and accuracy of the proposed method are thus demonstrated as the GMPP, which is accurately tracked in less than 1 s.
The simulation of the proposed algorithm is carried out in PSIM (Powersim Inc.) in a one-off matter which is similar to MATLAB-Simulink (The MathWorks, Inc., Natick, MA, USA) approach. Therefore, the global fitness value is given when the algorithm operation is entirely completed. To ensure about the high reliability of the proposed method, a double conditional stopping criterion has been designed for the simulation tests undertaken in this study. The stopping condition occurs when the fitness difference of all participating bats is less than a small predefined error or when the iteration count crosses the predefined iteration count which could be configured when running the simulation results.
In addition, the proposed system was evaluated several times, that is, 15 times in this study, to demonstrate its precision and system independence under various conditions.
Table 3 shows the summary of the average results obtained from the 15 trail runs on each scenarios of PS condition. PM refers to the arithmetic mean value of the maximum (
PMmax) and (
PMmin) is the minimum measured power values among all 15 tests. The tracking power efficiency (
PEE), which is used to evaluate the results, is a part of the arithmetic mean value and actual global maximum power value tracked by the proposed algorithm under partial shading conditions (
PEE = (
PM/
PA) × 100).
The proposed algorithm was tested under three different shading patterns as illustrated above. The proposed algorithm has the capability to tack the GMPP to accurately track the GMPP under acute weather conditions within in a shorter time with high tracking power accuracy (PEE%) of 99.8%. Thus, the proposed system performs with better accuracy when tracking the GMPP under different partial shading conditions, varied load and stochastic weather condition. To compare the performance of the proposed algorithm for tracking GMPP with the existing approaches, a comparison study was carried out on evaluating the parameters of simplicity, efficiency, tracking capability, speed, dependency, reliability and response to load variation parameters associated with the different approaches. The traditional algorithms like Incremental conductance have a greater advantage in terms of the simplicity of the method but the efficiency and the accuracy of the approach is not as effective as the proposed BA. The proposed algorithm tracks the GMPP of the PV system under PS conditions more effectively than the dividing rectangles (DIRECT) algorithm, which uses the dividing process to select the exploration range or searching area. The proposed bat algorithm completely scans the tracking space before estimating the GMPP of the system whereas the DIRECT method eliminates a part of the search space to make it faster.
The proposed algorithm has higher tracking speed when compared to the DIRECT method even though the search process does not eliminate any region. These above-mentioned perceptions contribute over the preference of BA over any traditional DIRECT approaches. But when comparing it with the Inc cond. Approach, BA is slow but there exists a drawback with consistency for the Inc cond. Moreover, the experimental results show that the proposed method can track the GMPP under 1.5 s and there is no oscillation after it has been tracked which indicates the performance of the proposed approach. Also, the proposed algorithm does not have dependence over the initial locations which makes it easier for tuning when compared to the other soft computing algorithms like PSO, P&O. The proposed approach when compared to the evolutionary algorithms like differential evolution (DE), differential evolution and particle swarm optimization (DEPSO) outperforms most of the approaches in terms of converging speed of the tracking.
Table 4 shows a detail comparison of the proposed BA with the conventional approaches used. Which clearly indicates that the proposed BA is more reliable, accurate and fast. This makes the proposed algorithm a better fit in terms of identifying the GMPP of the PV system under partial shading condition.


 ,
, 


