Article

Spatial–Temporal Analysis of the Relationships between Agricultural Production and Use of Agrochemicals in Eastern China and Related Environmental and Political Implications (Based on Decoupling Approach and LMDI Decomposition Analysis)

1
School of Public Affairs, Zhejiang University, Hangzhou 310058, China
2
Laboratory of Rural-Urban Construction Land Economical and Intensive Use, Ministry of Land and Resources, Beijing 100812, China
3
China Institute of Regulation Research, Zhejiang University of Finance & Economics, Hangzhou 310018, China
*
Author to whom correspondence should be addressed.
Sustainability 2018, 10(4), 917; https://doi.org/10.3390/su10040917
Submission received: 30 January 2018 / Revised: 16 March 2018 / Accepted: 17 March 2018 / Published: 22 March 2018
(This article belongs to the Section Sustainable Agriculture)

Abstract

:
Agrochemical inputs such as chemical fertilizers and pesticides have been recognized as sources of agricultural non-point source pollution and are controlled in order to prevent further deterioration of water pollution. In consideration of the available and effective measures to improve agricultural output value in a long-term, the key to the adoption of reduction control on agrochemical inputs is to ensure the decoupling relationship of agrochemical inputs to agricultural economic growth and to find out the endogenous growth of agrochemical inputs. This paper analyzed the relationship of agrochemical input consumption and agricultural output value in Eastern China by the Topia decoupling model. Interestingly, the transformation of expansive negative decoupling—expansive coupling—weak decoupling—strong decoupling was exposed, which can be used as a theoretical support to the source reduction control on agricultural non-point source pollution. The source reduction can be influenced of three factors: area factor, agricultural productivity factor and efficiency factor, which were decomposed by applying a log-mean Divisia index (LMDI) method, and the efficiency factor can promote the slowing down of the increase of agrochemical input consumption, while the agricultural productivity factor was the main factor to increase agrochemical input consumption; the area factor was not obvious. In addition to that, the formulation and implementation of source reduction control policies was affected by the differences of the spatial framework in Eastern China, where the source reduction control in different regions would be used to move ahead (or to delay).

Graphical Abstract

1. Introduction

In recent years, economic growth has been at a huge cost of water pollution. The water quality deterioration of rivers and lakes is especially serious in developing countries [1]. In comparison with the point source pollution caused by industrial activities, non-point source pollution by agricultural activities is a much bigger matter of concern. Nitrogen (N) loss and phosphorus (P) loss into the water environment in agricultural activities are the two main causes of non-point source pollution [2,3,4]. Previous literature showed that the proportion of non-point source pollution in Taihu Base of Eastern China, caused by nitrogen (N) and phosphorus (P) lost from agricultural activities, were 58% and 40% respectively [5].
Since the year 1981 (1980 is the beginning of the 6th five-year plan on national economics and society development), the use of chemical fertilizers and techniques to promote fertilization as well as fertilizer structures, under consideration of their lower cost and being easier to operate than irrigation, electrification and mechanization, have been vigorously popularized by the Chinese government. Agrochemical inputs were, back then, believed to be the panacea to boost agricultural growth for developing countries such as China, where the small-scale peasant economy formed the backbone of the agricultural economy. Until 2014, the use of chemical fertilizers has been 4.49 times the amount of that in 1980 [6]. However, along with economic progress have come various environmental problems, among which the conflict between the widely used agrochemicals and non-point source pollution is more and more revealed [7]. The deep involvement of agricultural chemistry in agricultural development has had a significant impact on the geographical system of the “human–land relationship”. For example, as an external compensation for agricultural production, chemical fertilizers play a significant role in promoting the insufficient agricultural output yield and value caused by the shortage of farmland resource endowments. Due to its universality and easy operation, fertilizers have been rapidly popularized [8]. Domestic and foreign scholars have done a great deal of research on the impact of fertilizers on agricultural economic development and have proved that the contribution of fertilizer to agricultural production is as high as 40% [7].
Efforts have been made in many places to control non-point source pollution through source reduction. The Chinese government, in its 13th five-year plan (ranging from 2016 to 2020), has clearly stated a zero-growth objective in chemical fertilizer and pesticides. Though beneficial for sustainable development, it will be difficult to put these strategies of pollution control into effect, as agricultural growth in China has relied largely on agrochemical inputs for a long time. Alongside the stream of research on the trade-off between economic growth and environment protection, we will explore the relationship between agrochemical inputs and agricultural economic growth in this passage.
The environmental Kuznets curve (EKC) initially depicted an inverted-U shaped relationship between environmental pollution and economic growth [9] and was then confirmed by empirical data of industrial and urban pollution [10,11]. Afterwards, the inverted-U shape was observed in the relationship between agricultural economic growth and pesticide pollution [12], advancing EKC into the agricultural non-point source pollution research. EKC assumption was further verified in the process of land utilization, and the relationship between per capita GDP and public water pollution by land-based pollutants also exhibited an inverted-U shape [13]. However, EKC fails to open the black box of how economic growth and environmental pollution interact and forecast the trends which provide a direction for further research on the relationship between agricultural non-point source pollution and agricultural economic growth.
Previous literature employed various theoretical models to examine the relationship between environmental pollution and economic growth, in many instances using the endogenous growth (or reduction) theory of environmental pollution. Philipp and Howitt [14] applied Schumpeter theory to analyze the effect of pollution limits on sustainable development. Stokey [15] adopted the extension AK model to explore the relationship between the externality of environment pollution and sustainable economic growth. OECD (2002) put forward the decoupling theory, defining the situation in which energy consumption growth is slower than economic growth as relative decoupling, and in which energy consumption growth is zero or below plus positive economic growth as absolute decoupling [16]. Based on OECD’s work, Tapio [17] advanced the elastic decoupling theory, solving the problem of large calculation errors and detailing the indicator measuring the decoupling relationship between environmental pollution and economic growth. Since then, the elastic decoupling theory has been widely employed in research to examine the relationship between industrial pollution, industrial carbon emissions and economic growth [18], as well as the relationship between agricultural carbon emissions and agricultural economic growth [19]. Agrochemical inputs being the main source of agricultural non-point source pollution, it is theoretically feasible to employ the decoupling factor to measure the blocking state between agrochemical inputs and agricultural economic growth. It will also shed light on both the agrochemical and agricultural development research.
In addition to the decoupling state of agricultural economic growth, source reduction control on agricultural non-point source pollution also depends on endogenous growth or a decrease of agrochemical input consumption. Index decomposition analysis (IDA), including the Laspeyres and the Divisia indexes, could well depict the endogenous state [20]. Despite the advantage in methods without zero-values, the Laspeyres index’s decomposition results have larger residuals. Sun’s complete decomposition model [21] makes up for the defect; however, the decomposition formula is relatively complex. In comparison, Ang and Choi’s log-mean Divisia index (LMDI) model has well solved both the residual and zero-value problem and was widely adopted in many research fields [22,23,24,25]. Considering agrochemical inputs’ nudge to the agrochemical economic growth, the source reduction control on agricultural non-point source pollution should firstly study the effect of the endogenous decrease of agrochemical input consumption with LMDI, which is a better way of source reduction control on agricultural non-point source pollution than reducing agrochemical input consumption directly.
Agricultural non-point source pollution mainly includes agrochemical pollution (fertilizers, pesticides, etc.), intensive farm pollution, sewage pollution in rural areas and so on. For the vast majority of basins in China, such as Taihu Lake and Dianchi Lake, the runoff of farmland, runoff from livestock and poultry farms, wastewater discharge and garbage dumping in urban-rural areas are the main causes of non-point source pollution [26]. However, the fertilizer and pesticide utilization rates of China’s three major grain crops —rice, corn and wheat in 2015—were respectively 35.2% and 36.6%, which were still far from the 50% of the developed countries [27]. The lower utilization rate and higher investment intensity aggravate the pollution of water environment by fertilizers and pesticides.
This study aims to obtain the variation trend of the relationship between source reduction control on agricultural non-point source pollution and agricultural economic growth, as well as the inner basis of source reduction from 1996 to 2014 in Eastern China, which plays an important role in providing a theoretical basis for the implementation of regional agricultural sustainable development policy and a reference for other regions through the analysis of evolution characteristics in a specific geographic area and in a time sequence. This paper aims at discussing the drive for agricultural chemical input based on the analysis of the relationship between agricultural chemical input and agricultural economic decoupling. We want to establish ways to reduce the input of agricultural non-point source pollution sources (i.e., pesticides and chemical fertilizers inputs) rather than discuss their relationship with the environment directly.

2. Methodology and Data

2.1. Tapio Decoupling Model

According to Tapio’s definition, this study wants to establish the decoupling model between agrochemical inputs’ consumption and agricultural economic growth in order to reflect decoupling states in time sequence. The decoupling elasticity refers to the ratio of the change of agrochemical input consumption to the growth of agricultural output value, which reflects the sensitive situation of agrochemical inputs for agricultural economic growth. The calculation formula is
α t + 1 = Δ P t + 1 / P t Δ A t + 1 / A t = ( P t + 1 P t P t ) / ( A t + 1 A t A t )
where α t + 1 is decoupling elasticity in t + 1 times; Δ P t + 1 , respectively are the change of agrochemical input consumption and agricultural output value growth in t + 1 times; P t + 1 , respectively are agrochemical input consumption and agricultural output value in t + 1 times; P t , respectively are agrochemical input consumption and agricultural output value in t times. According to Δ P t + 1 / P t and Δ A t + 1 / A t , the decoupling status can be divided into expansive negative decoupling, strong negative decoupling, weak negative decoupling, weak decoupling, strong decoupling, recessive decoupling, expansive coupling and recessive coupling.

2.2. LMDI Decomposition Model

Ang has proposed the logarithmic mean Divisia index (LMDI) for analytical limit, and the LMDI logarithmic index decomposition has the advantages of no residue, unique results, ease of use and understanding [24], and has been widely used in industry and other fields [28,29,30]. In the field of agriculture, domestic scholars have applied the farmland strategy based on grain growth, the influence factors of agricultural carbon emissions and the factors of greenhouse gas emissions from livestock husbandry [31,32,33].
This study respectively establishes the effect models of chemical fertilizer consumption and pesticide consumption:
P t = S t A t S t P t A t = S t Y t I t
where S t is total sown area in t times, Y t = A t / S t is the agricultural output value per total sown area in t times, I t = P t / A t is the agrochemical inputs’ consumption per agricultural output value in t times. Agrochemical input consumption is characterized by the function of agricultural output scale (S), agricultural output value per sown area (Y) and agrochemical input consumption per agricultural output value (I).
(i)
Agricultural output scale (S) is an important factor of agricultural economic growth. In this function, agrochemical input consumption will increase along with the expansion of agricultural output value under ceteris paribus. It can be called the area factor.
(ii)
Agricultural output value per total sown area (Y) is an important symbol for measuring agricultural economic growth. Under the limited agricultural ontology resource, agricultural output value is improved by the improvement of the unit sown area’s utilization. It can be called the effect of the sown area’s benefit, referred to agricultural productivity factor. The variation of agrochemical input consumption can affect the agricultural productivity factor under ceteris paribus.
(ii)
Agrochemical input consumption per agricultural output value (I) embodies the efficiency of chemical fertilizer consumption and pesticide consumption in agricultural output value. The higher the agrochemical input efficiency, the less the agrochemical input consumption and agricultural non-point source pollution. The agrochemical input consumption per agricultural output value contains the agrochemical technology level. It can be called the effect of agrochemical efficiency, referred to efficiency factor.
The contribution of agrochemical input consumption can be decomposed into
Δ P t = P t P 0 = ( P t P 0 ) ln P t / P 0 ln P t P 0 = L ( P t , P 0 ) ln ( S t S 0 Y t Y 0 I t I 0 ) = L ( P t , P 0 ) ln S t S 0 + L ( P t , P 0 ) ln Y t Y 0 + L ( P t , P 0 ) ln I t I 0
Δ P t = Δ P t , s c a + Δ P t , l a n + Δ P t , e f f
where Δ P t means a value for a given year t, and “t = 0” means a first year (1996) of the amount of agricultural chemical inputs. S t , S 0 are crop sown area in t times and base period, respectively; Y t , Y 0 are agricultural output per unit sowing area in t times and base period, respectively; I t , I 0 are agrochemical inputs’ consumption per agricultural output value in t times and base period, respectively.
L ( P t , P 0 ) = ( P t P 0 ) / ( ln P t / P 0 ) ; Δ P t , s c a = L ( P t , P 0 ) ln ( S t / S 0 ) is the change of agrochemical inputs’ consumption associated with area factor, Δ P t , l a n = L ( P t , P 0 ) ln ( Y t / Y 0 ) is the change of agrochemical inputs’ consumption associated with agricultural productivity factor, and Δ P t , e f f = L ( P t , P 0 ) ln ( I t / I 0 ) is the change of agrochemical inputs’ consumption associated with efficiency factor.

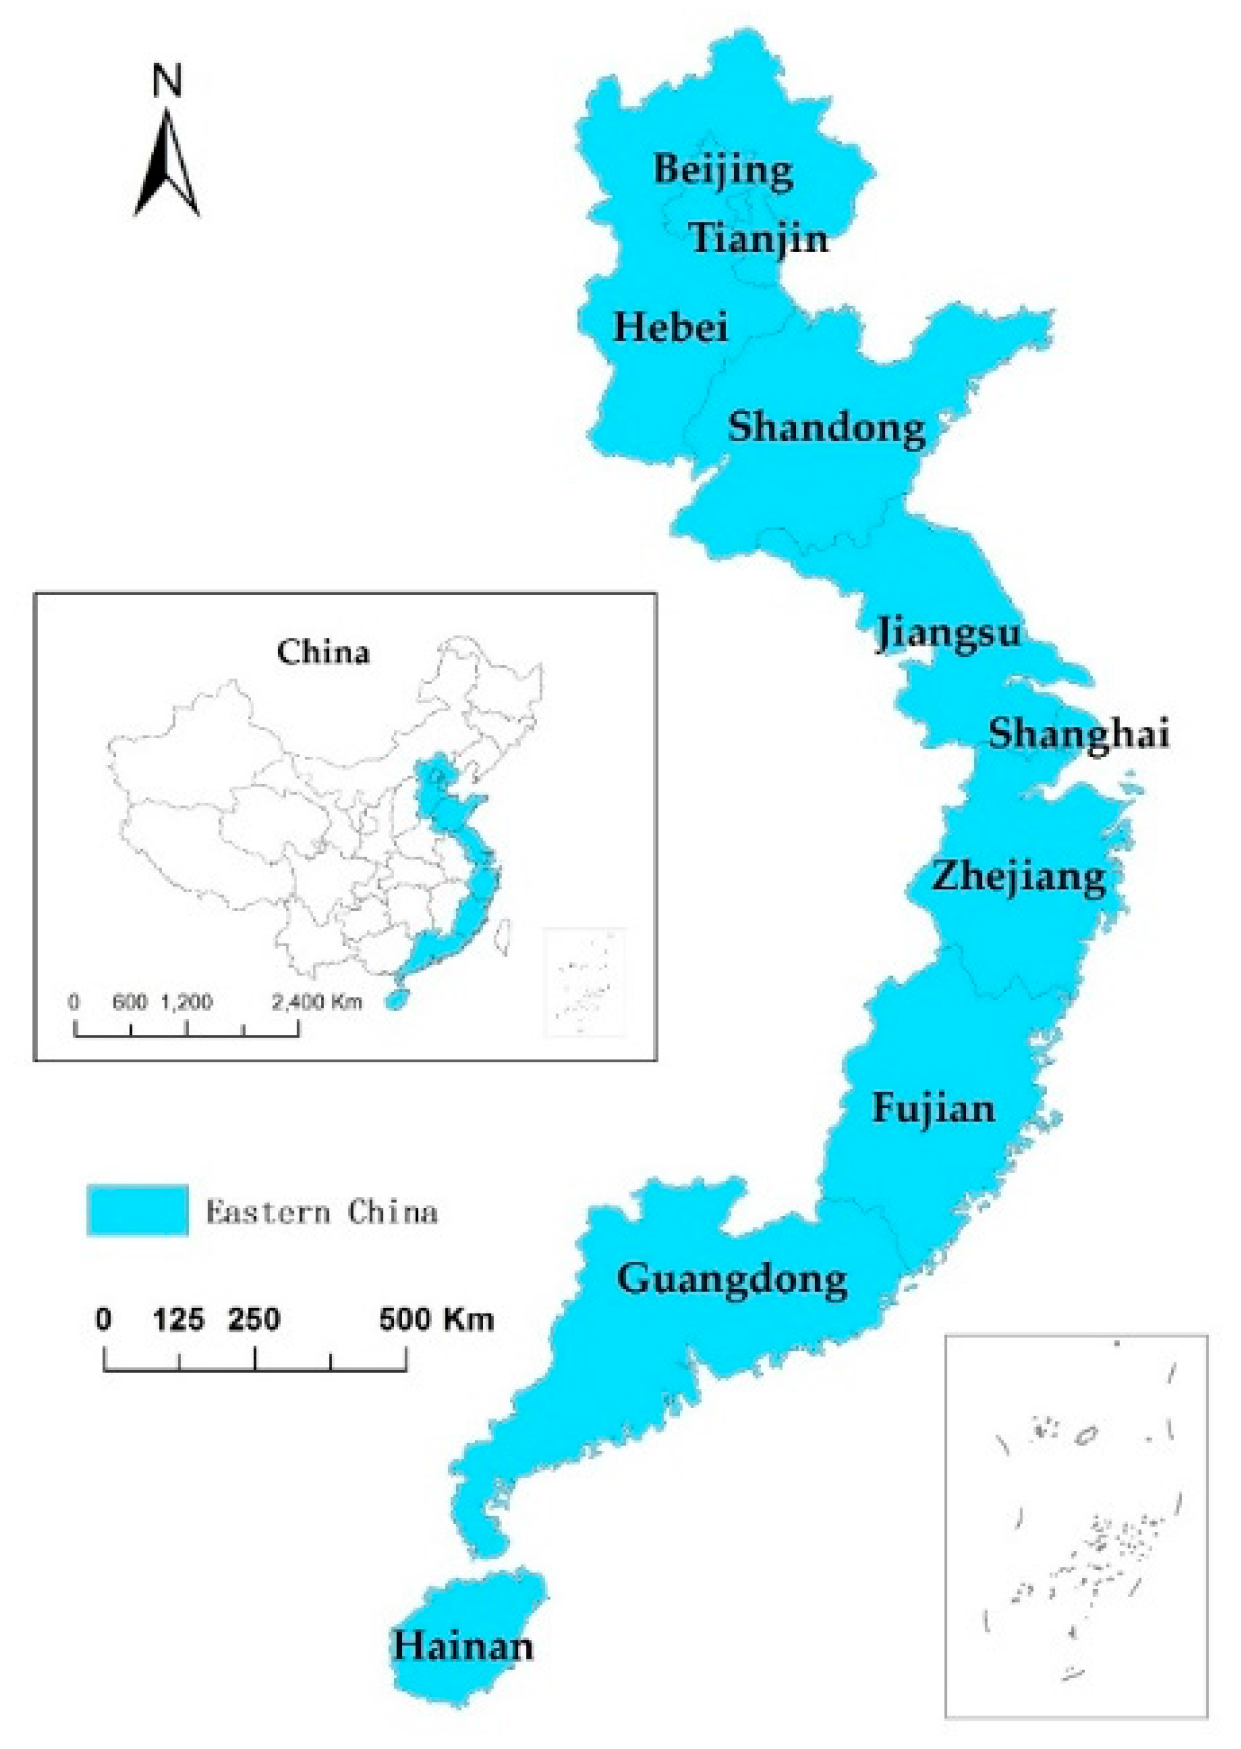
2.3. Research Area and Basic Data

According to the division of the national statistics bureau in 2011, Eastern China includes seven provinces and three cities along the coast (Figure 1). Eastern China is always at the forefront of China’s economic development and agricultural reform, being one of the most non-point source polluted areas. Agricultural non-point source pollution caused by chemical fertilizer is mainly brought from nitrogen (N) loss and phosphorus (P) loss. Chemical fertilizer converted to pure volume, which is calculated in accordance to the contents of N, P2O5 and K2O, can be a more realistic response to the situation of agricultural non-point source pollution. Therefore, chemical fertilizer converted to pure volume is used for analysis in this study. The data of chemical fertilizer converted to pure volume, agricultural output value and total sown area is collected from the China Statistical Yearbooks from 1996 to 2014 [6], and the data of pesticide consumption is collected from China Rural Statistical Yearbook during 1996–2014 [34]. Because the data is difficult to collect, the data is only updated until 2014. At the same time, there is a substantial lack of relevant data on water and soil pollution.

3. Results and Discussion

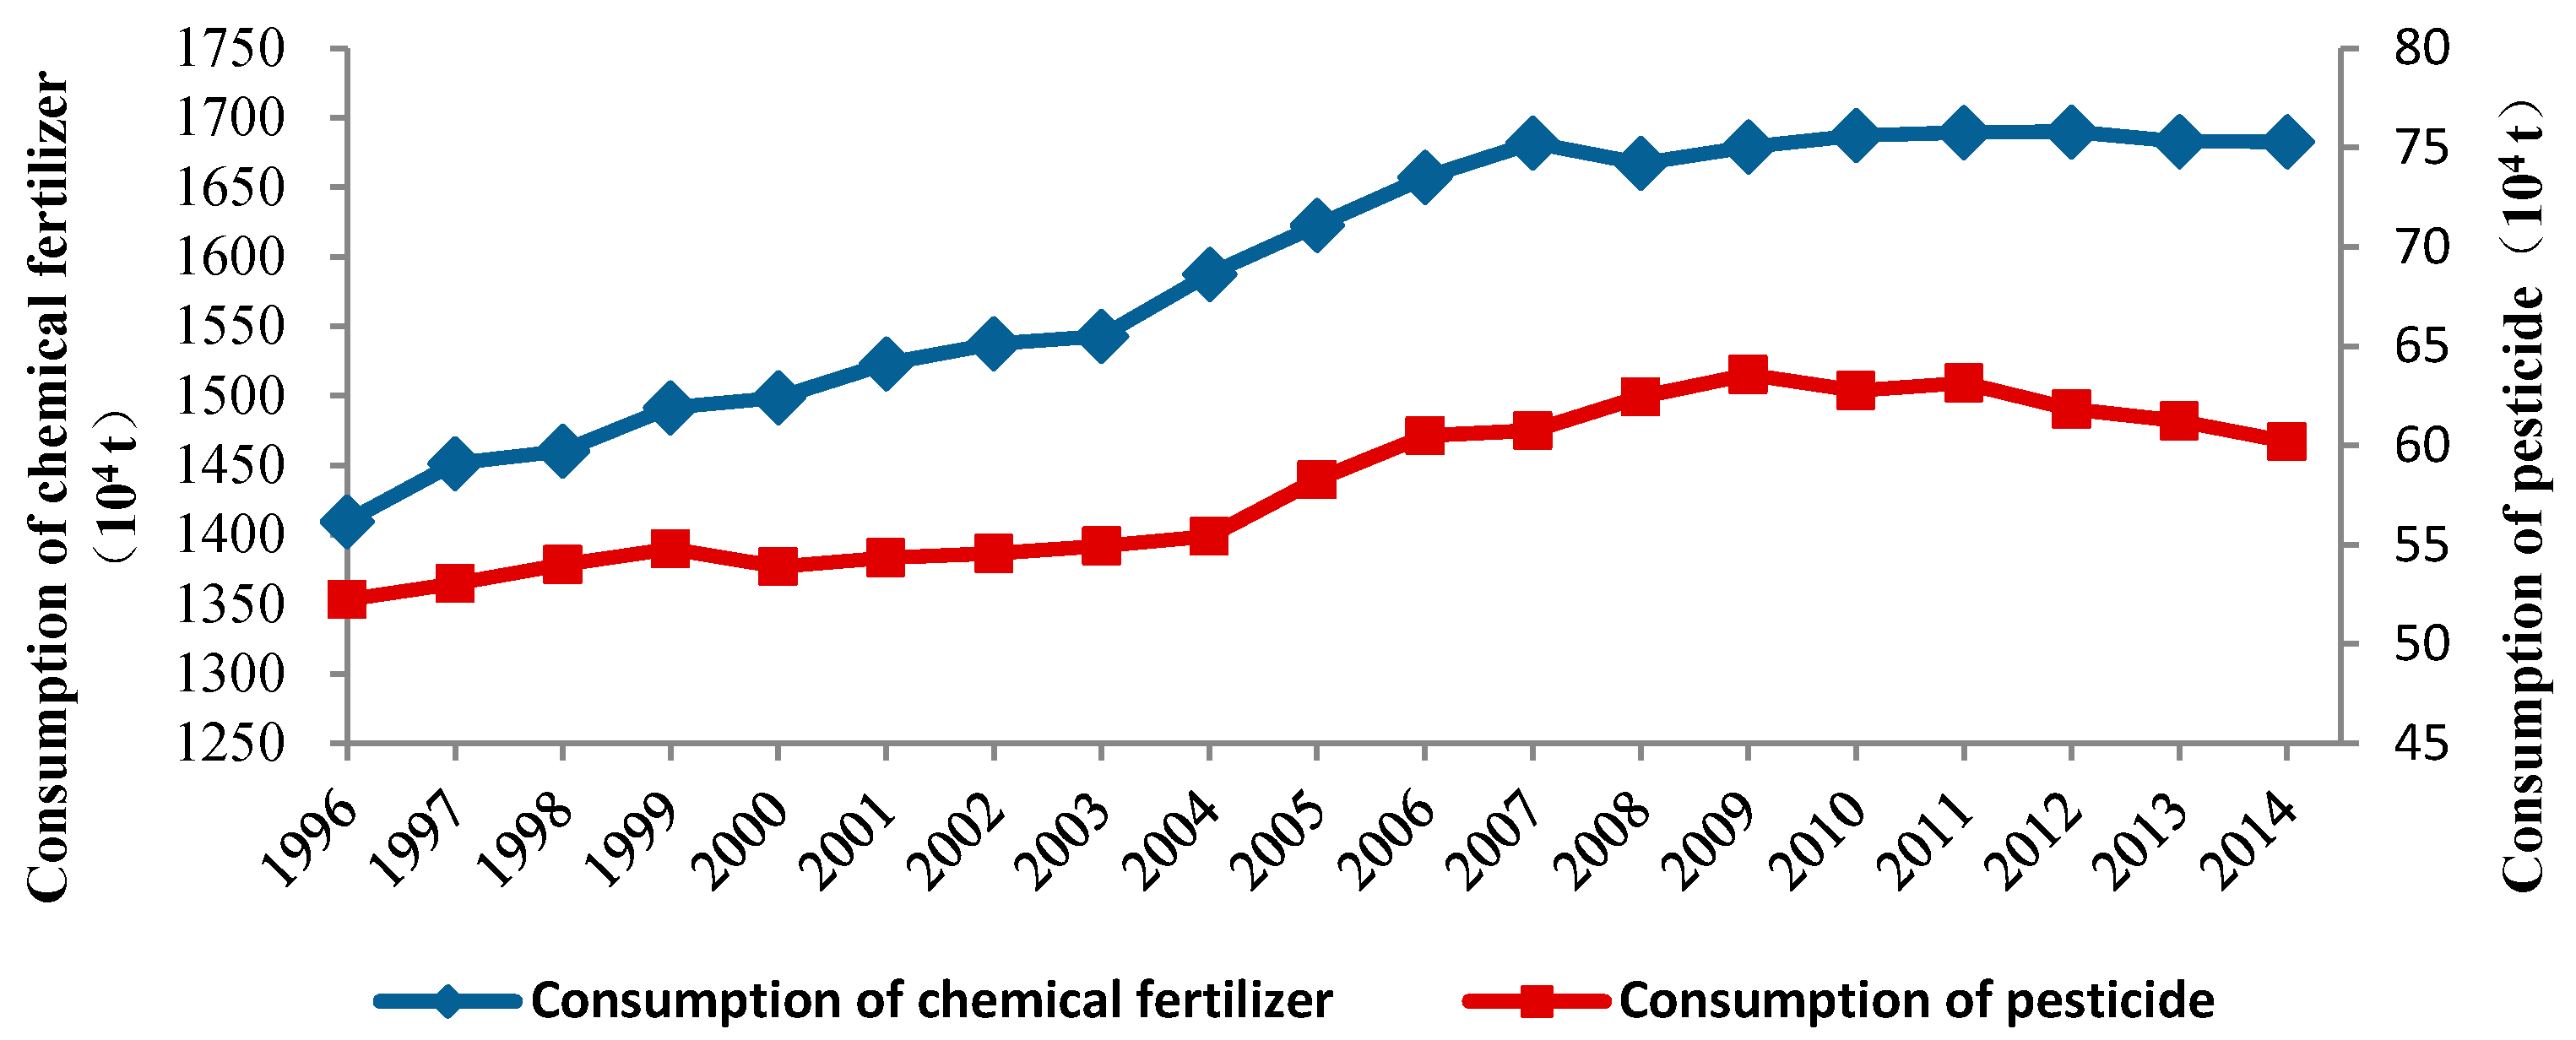
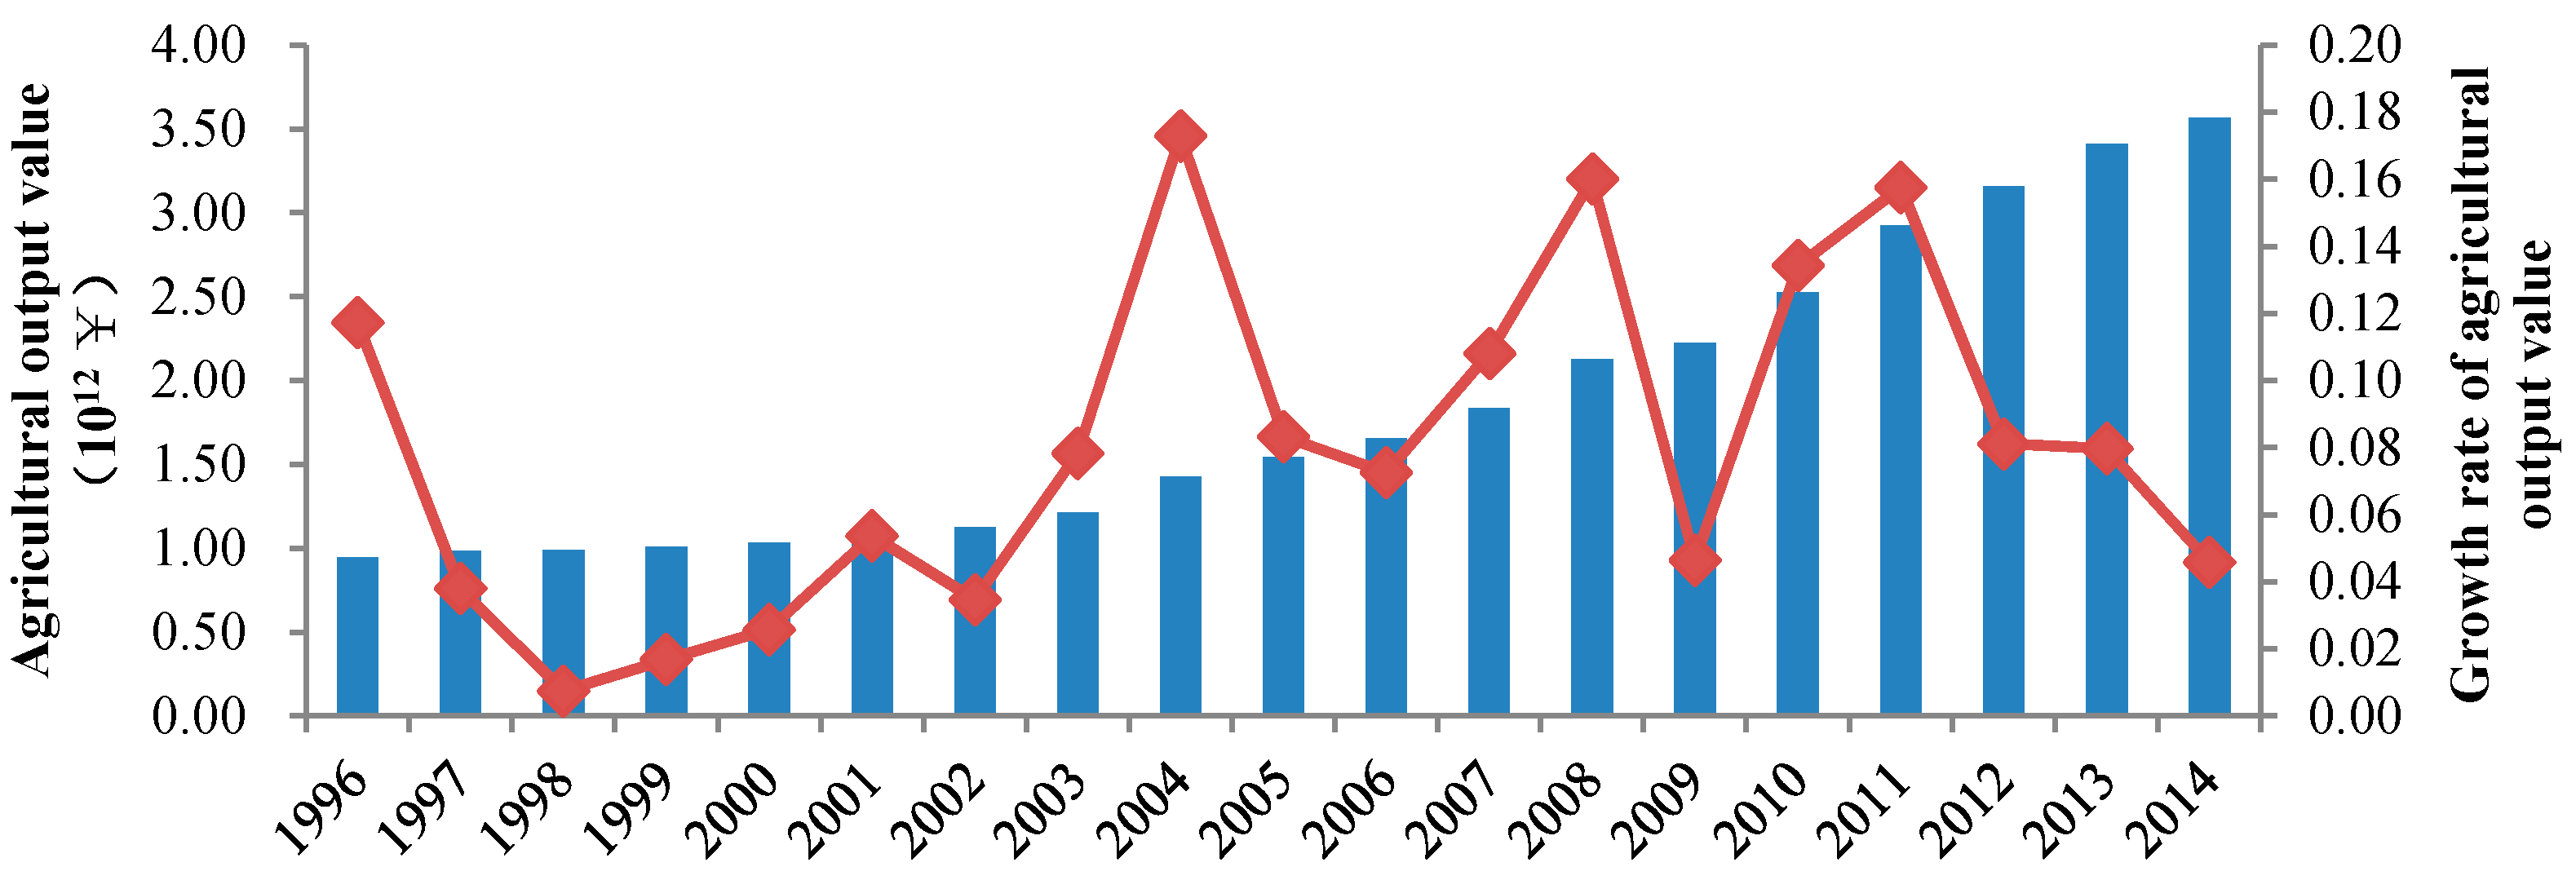
3.1. Agricultural Development Situation

From the perspective of agricultural output value, from 1996 to 2014 (Table 1), the agricultural output value in the eastern region increased by 0.95 trillion yuan to 3.57 trillion yuan, an increase of 2.76 times (Figure 2), and the situation of continuous growth has been maintained. In terms of the growth rate of output value, the annual growth rate remained above 1.6 points except for 1998, of which the highest was in 2004 at 17.28%; those above 15% were in 2008 (16.00%) and in 2011 (15.75%). In terms of the situation in each region, the highest output value in 2016 was Shandong (919.83 billion yuan), 3.22 times that of 2016, ranking first in output value each year; followed by Jiangsu, Hebei and Guangdong, all of which exceeded 500 billion yuan. The lowest output was Shanghai (32.22 billion yuan), and Beijing and Tianjin were less than 50 billion yuan. Of course, this is closely related to the size of the area and the industrial development pattern. The three regions are municipalities directly under the control of the Central Government, with limited land resources, focusing on the development of services and industries.
The data are from the China Statistical Yearbook (1997–2015) and China Rural Statistical Yearbook (1997–2015).
Agrochemical input consumption presented the trend from increasing to decreasing in Eastern China (Figure 3), which is closely related to the source reduction control policy implementation of agricultural non-point source pollution. On the whole, the inflection point of chemical fertilizer application appeared in 2013, while the inflection point of pesticide use appeared in 2012, both showing the trend of first increasing and then decreasing, but none of them dropped to the level of 1996; still increasing by 19.38% while pesticide use increased by 15.20%. According to the situation in each region, the highest amount of chemical fertilizer and pesticide was Shandong in 2014, with the highest in all years; the lowest were Beijing, Tianjin and Shanghai. Among them, the lowest level of chemical fertilizer was Shanghai (102,200 tons), and the lowest pesticide use was Beijing (3603 tons). The inflection points for the use of chemical fertilizers appeared earlier in the four regions of Tianjin, Shanghai, Jiangsu and Zhejiang, which occurred in 2010; while the inflection point of pesticide use appeared earlier in Shanghai and Jiangsu, which occurred in 2006, which may be related to the earliest implementation of water pollution prevention and control in the Taihu Lake Basin. It is noteworthy that Hebei has never seen any inflection point of chemical fertilizers and pesticides. Hebei has a relatively low level of economic development and is responsible for the supply of agricultural products to Beijing and Tianjin. The demand for agricultural output and agriculture production value is urgent, and it is unable to be fed back through vigorous industrial development, leading to the fact that the inflection point has not occurred yet.
The eastern region is affected by the overall regional industry transfer, paying attention to the development of services and industries. The sown area of agriculture has continuously decreased since 1999, with 38.6754 million hectares in 2014, dropping by 9.24% from 1996 to 10.64% below the highest level in 1998. Judging from all regions, the area with the highest sown area of crops in Shandong was 11,037,900 hectares. Only the sown area of crops in Shandong Province has increased. This was mainly due to the fact that in Shandong, as a large agricultural province, the domestic supply and export demand of agricultural products led to the further enhancement of agricultural industrialization and therefore promoted the increase of the sown area of agricultural crops. However, with the overall direction of industrial development in the eastern region, the growth rate is only 0.56%. In the lower regions, Beijing saw the biggest decrease of 63.57%; followed by Zhejiang at 42.63%. With the urbanization progress, most of the agricultural land in China was occupied by residential, industrial and service industries. In the areas where agricultural resources endowment was weaker and agricultural productivity efficiency was lower, the sown area of agricultural crops dropped sharply.
In non-point source pollution, nitrogen and phosphorus nutrients, pesticide and other pollutants are in a piece of land or an area which includes farmland, gardens, and golf courses, through surface runoff and soil infiltration into water bodies causing water pollution [35]. The problem of fertilizer and pesticide pollution which leads to the water environment problem is mainly reflected in the high amount of agricultural chemical investment, low utilization efficiency and serious loss. According to the “First Gazette of the Census of National Sources” in 2007 in China, the agricultural source water pollution emissions include 2.7046 million tons of total nitrogen, 13.2409 million tons of total phosphorus, and 2.874 million tons of chemical oxygen demand (COD). The pollution is already more than industrial source water pollution emissions and the life source water pollution emissions, which accounted for 57.19%, 67.35% and 35.67% of the total water pollution emission in China, respectively; the total nitrogen, total phosphorus and COD of agricultural sources in major lake basins reached 64.34%, 77.85% and 60.29%, respectively [36]. It is pointed out that agricultural pollution has become the largest source of water pollution in China. The total amount of use and application per unit cultivated land area are increasing year by year. As of 2010, the amount of fertilizer application to the per unit area of arable land in China is nearly four times the world average [37]; ranked only after the Netherlands, South Korea and Japan in 2008 [38]. In 2014, the total amount of using fertilizer application and pesticides in Eastern China had reached 16.827 million tons and 601,800 tons, respectively, all accounting for about 30% of the total amount of chemical fertilizers and pesticides used in China, and accounting for 10% and 17% of the total amount of global fertilizer application and pesticides used, respectively (World Bank data, FAO data).
Due to the relatively scattered and wide points of soil pollution data, comprehensive soil pollution cannot be obtained. Therefore, no specific analysis will be conducted here.

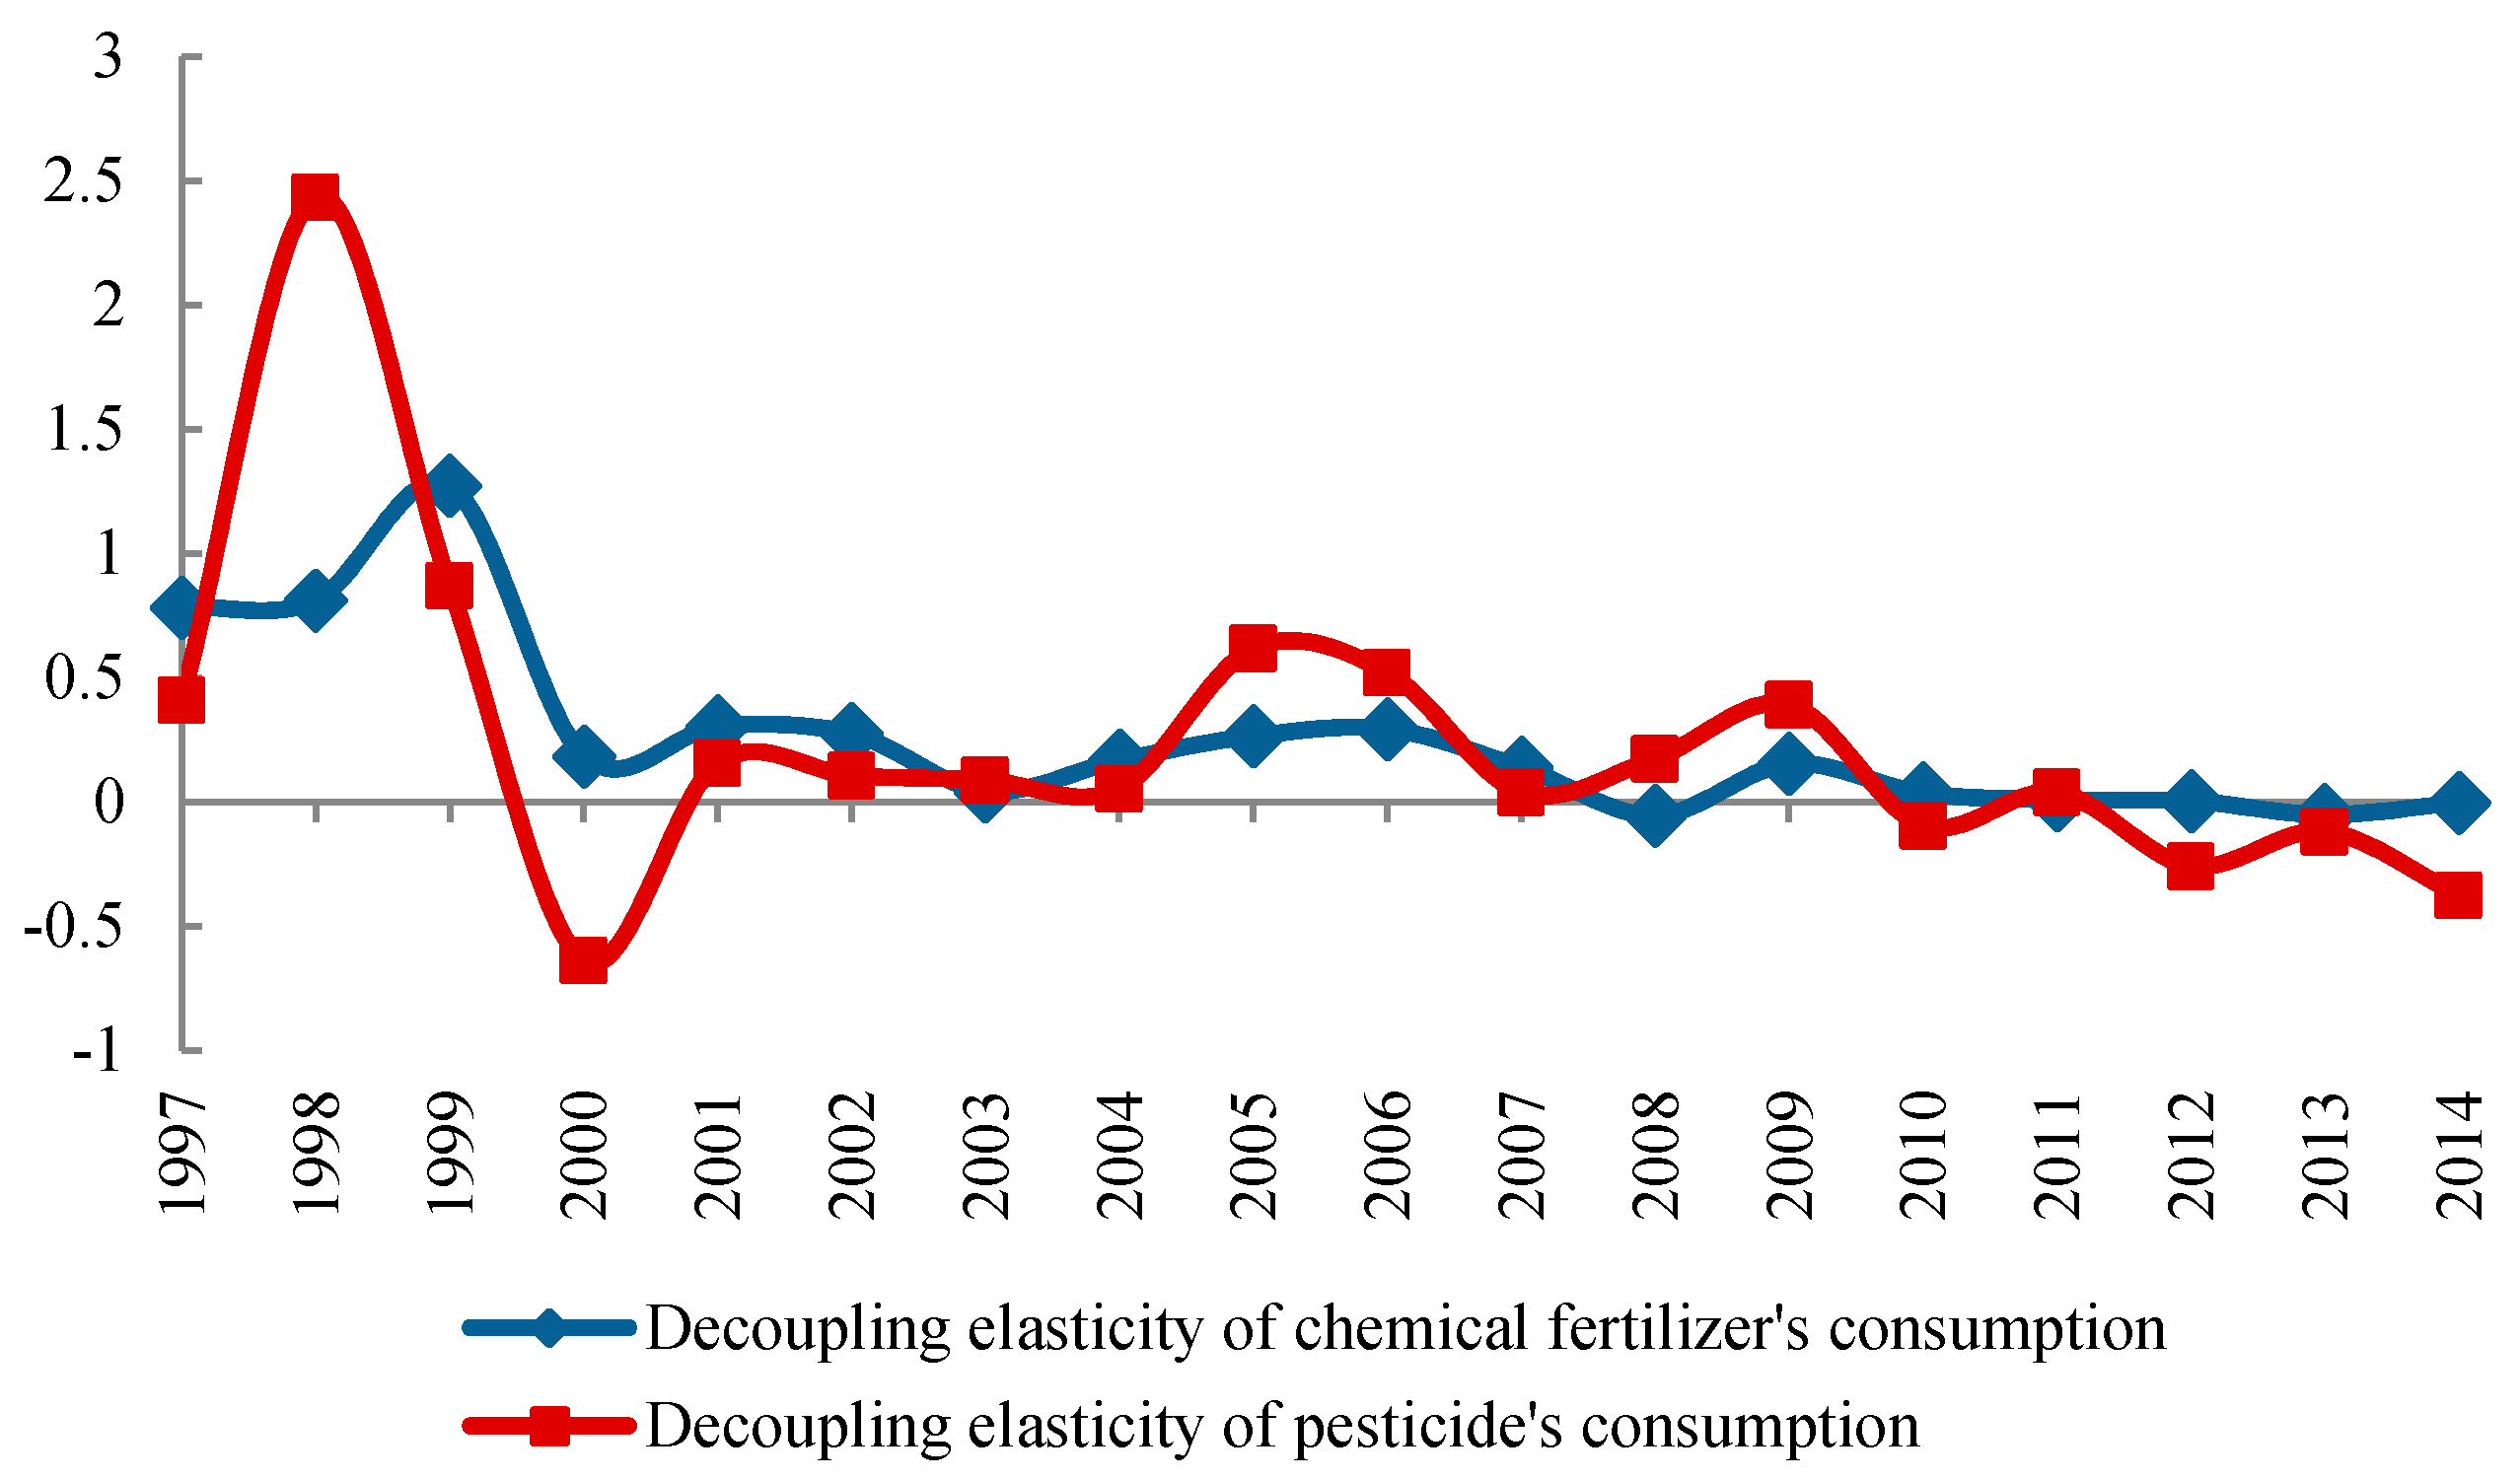
3.2. Decoupling Relationship between Agrochemical Inputs and Agricultural Economic Growth
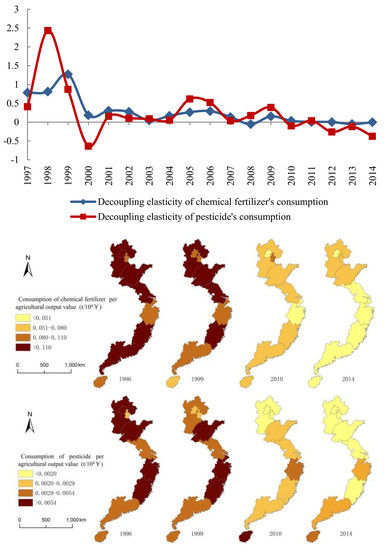
Because of the tendency of agricultural output value growth year by year ( Δ A t + 1 / A t > 0 ) in Eastern China, the decoupling status can be divided into strong decoupling ( Δ P t + 1 / P t < 0 & α t + 1 < 0 ), expansive negative decoupling ( Δ P t + 1 / P t > 0 & α t + 1 > 1.2 ), expansive coupling ( Δ P t + 1 / P t > 0 & 0.8 α t + 1 1.2 ) and weak decoupling ( Δ P t + 1 / P t > 0 & α t + 1 < 0.8 ).
The relationship between agricultural output value and agrochemical input consumption completes the transformation of expansive negative decoupling—expansive coupling—weak decoupling—strong decoupling (Figure 4). Relative to chemical fertilizer consumption, the decoupling elasticity of pesticide consumption presents a falling volatility status.
(i)
The stage of expansive negative decoupling and expansive coupling (during 1996–1999). The decoupling elasticity is basically greater than 0.8, and agricultural economic growth strongly depends on agrochemical inputs. The agrochemical means were quickly expanded under the policy guidance from 1981. The chemical fertilizer consumption was required to increase, and the structure and technology of chemical fertilizer application were required to improve in the 6th five-year plan on national economics and society development of China. This policy was delayed until the 9th five-year plan on national economics and society development of China, which proposed the speeding up of the development of agricultural industry. In spite of the agrochemical input control in certain areas such as Guangdong province which led to the decline of agrochemical input consumption in 1998, but were subject to the influence of policy guidance, it began to rebound in 1999.
(ii)
The stage of week decoupling (during 2000–2009). The decoupling elasticity is 0~0.8. Agrochemical input consumption and agricultural output value were basically in the growth phase, and agrochemical input consumption grew more slowly. The year of 2001 is seen as an important year of the source reduction control of agricultural non-point source pollution, because the policies of prevention and control of non-point source pollution were put forward in the 9th five-year plan on national economics and society development of China. In view of the actual situation, the control in Eastern China was executed earlier. It shows that the source reduction control policy of agricultural non-point source pollution gradually played a role, but the dependence on agrochemical to agricultural economic growth was hard to recind quickly.
The year of 2008 was a special year, when the decoupling elasticity showed a drastic slowdown. Through the survey, this status of strong decoupling was mainly due to the multiple increased price of chemical fertilizer cost by the increase of production in the international market. The rational economic decisions of farmer groups led to decreased chemical fertilizer application and decoupling elasticity of chemical fertilizer. It should not be removed. Relatively, the decoupling elasticity of pesticide consumption always declined with fluctuation. The status of strong decoupling was derived from the reduced pesticide consumption control of Shanghai, Fujian and other areas in 2000, but it did not form a trend of strong decoupling.
(iii)
The stage of strong decoupling (during 2010–2014). The decoupling elasticity of agrochemical inputs was basically less than zero, especially after the year of 2013, where it shows the status of strong decoupling (αt+1 < 0). The effect of source reduction control on agricultural non-point source pollution has already begun to emerge in this period. Along with the construction of agricultural irrigation and electric infrastructure, the application of agricultural machinery and the development of agricultural technology, the dependence of agricultural economic growth on agrochemical inputs has been weakened. The agrochemical input consumption reduction did not hinder the agricultural economic continuously growth.

3.3. Effect Decomposition of Agrochemical Inputs

3.3.1. LMDI Decomposition of Chemical Fertilizer Converted to Pure Volume

The consumption of chemical fertilizer based on the factors increased by 227.92 × 10⁴ t. The area factor contributed −149.50 × 10⁴ t, the agricultural productivity factor contributed 2194.57 × 104 t, and the efficiency factor contributed −1817.16 × 104 t (Table 2). The contribution rates of the three factors were respectively −65.59%, 962.87% and −797.27%. The efficiency factor can largely slow down the growth of chemical fertilizer consumption, while chemical fertilizer consumption was mainly provided by the agricultural productivity factor; the impact of the area factor was relatively small.

3.3.2. LMDI Decomposition of Pesticide Consumption

Pesticide consumption based on the factors increased by 7.94 × 10⁴ t in Eastern China. The area factor contributed −5.44 × 10⁴ t, the agricultural productivity factor contributed 79.86 × 10⁴ t and the efficiency factor contributed −66.48 × 10⁴ t. The contribution rates of the three factors were respectively −68.51%, 1005.66% and −837.16%. The same as chemical fertilizer, the efficiency factor can largely reduce the growth of pesticide consumption, while the agricultural productivity factor can accelerate it.
Overall, the agricultural output value per total sown area played a very strong role in promoting the rapid growth of agrochemical input consumption, which is related to the pressure to ensure a good harvest and increase agro-productions. However, with the advance of industrialization and urbanization, the total sown area in 2014 (3867.5 × 104 ha) decreased by 9.24% compared to in 1996 (4261.3 × 104 ha) in Eastern China, where agrochemical input was an important means to improve the efficiency in the short-term, whose investment cost was relatively small. Therefore, the agricultural productivity factor led to the growth of agrochemical input consumption.
Meanwhile, the source reduction control on agricultural non-point source pollution should work hard to improve the efficiency factor. Direct reduction of agrochemical input consumption may cause a reduction of agro-productions. The agrochemical technology includes agrochemical input, such as high efficiency chemical fertilizers and low-toxic pesticides, and the technology of agrochemical input application: for example, agrochemical fertilizer management technology [39,40]. Improving the level of agrochemical technology can not only promote agricultural output growth, but also can reduce agrochemical input consumption.

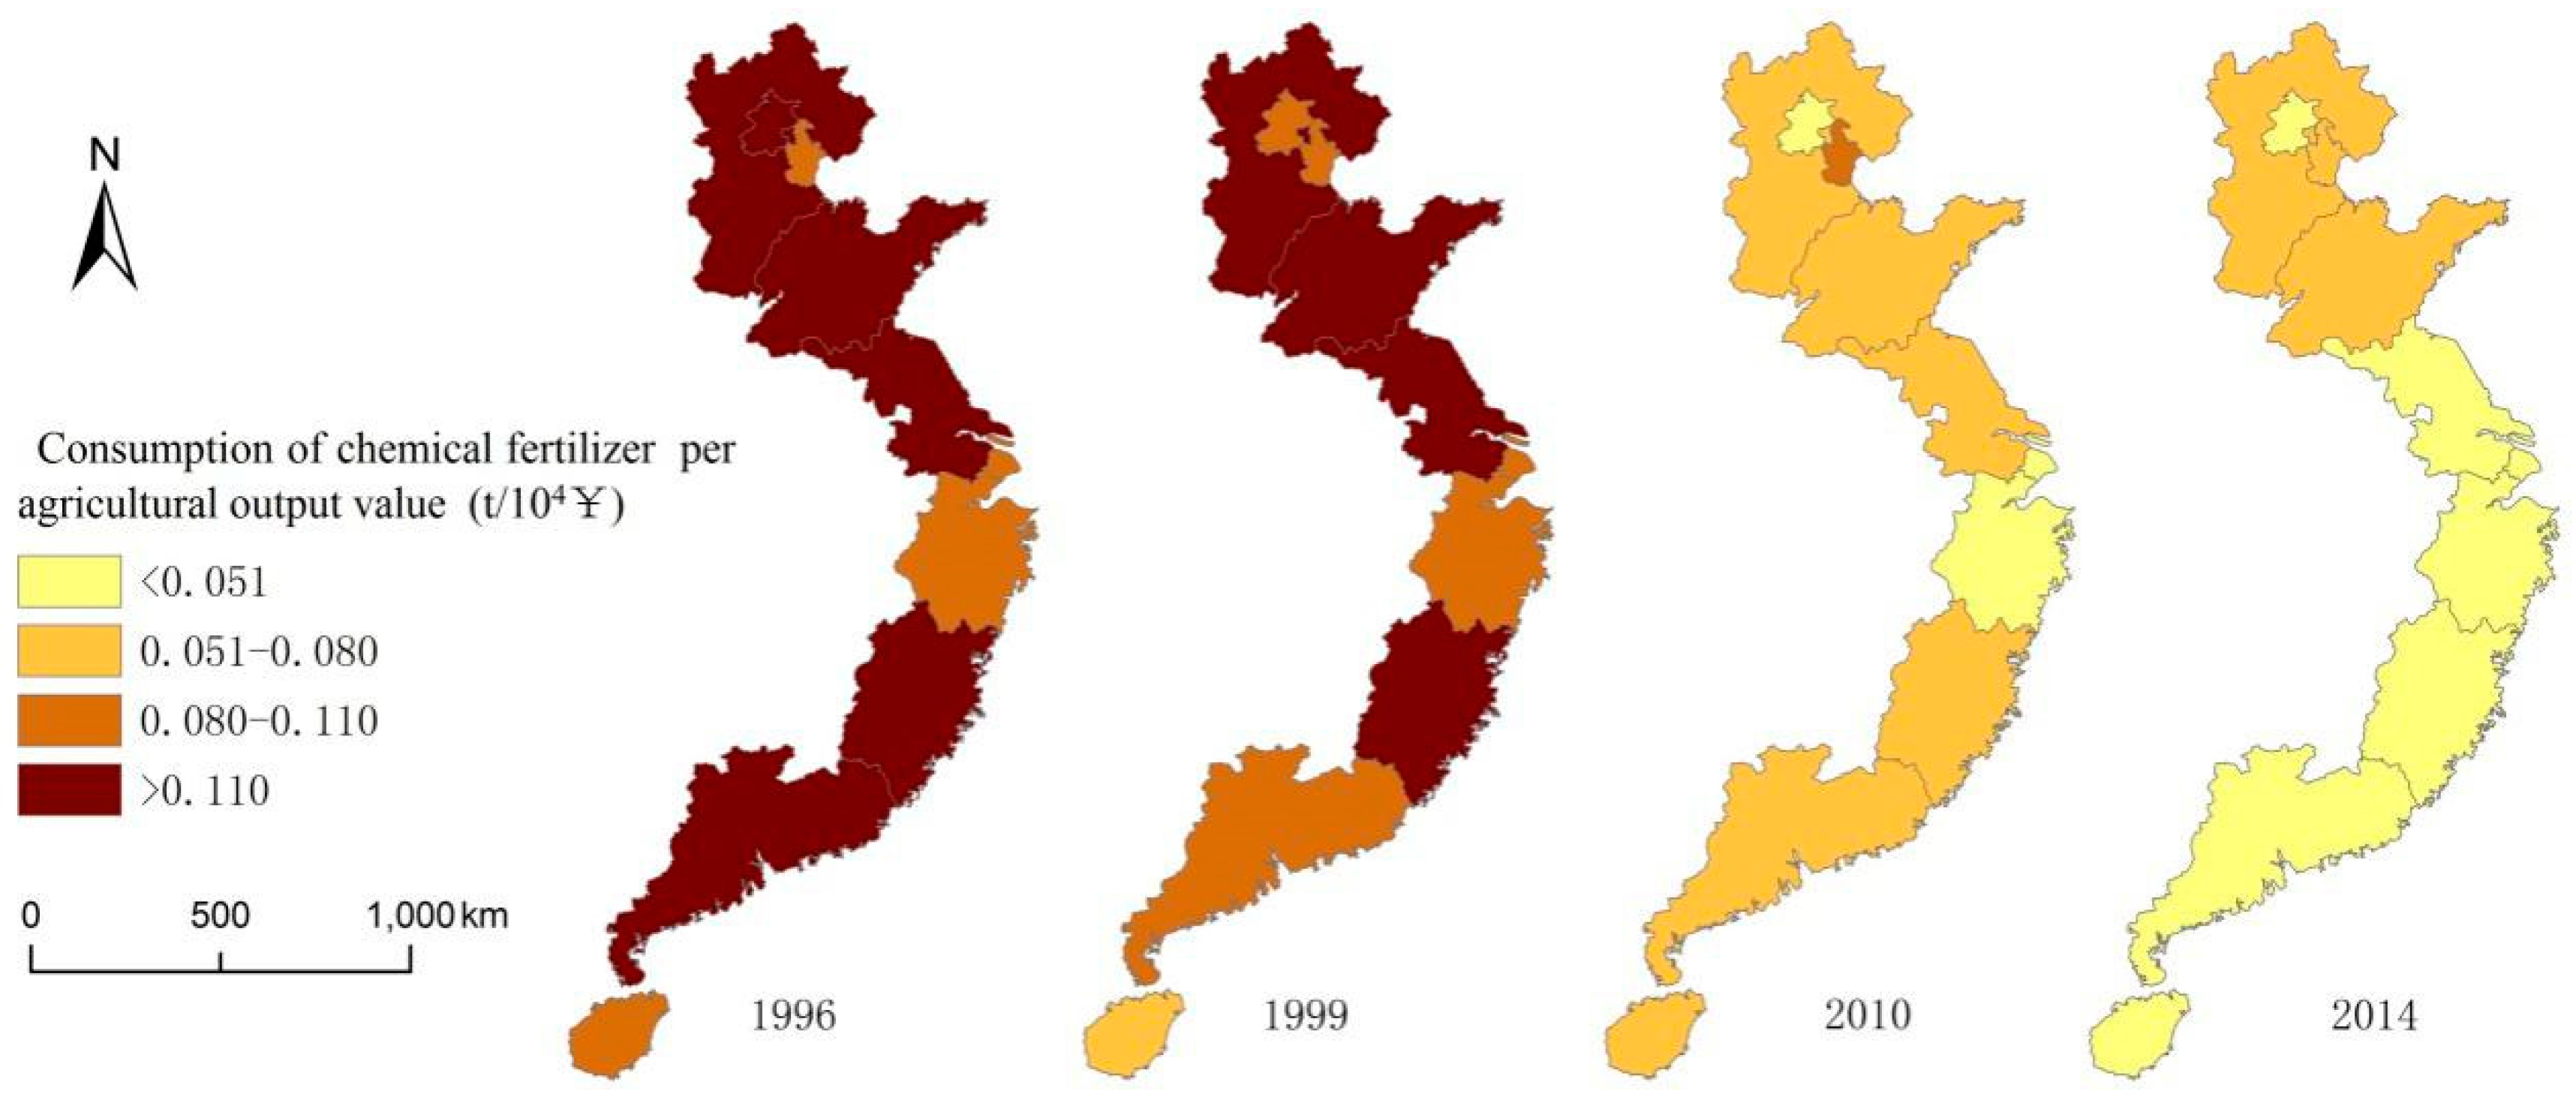
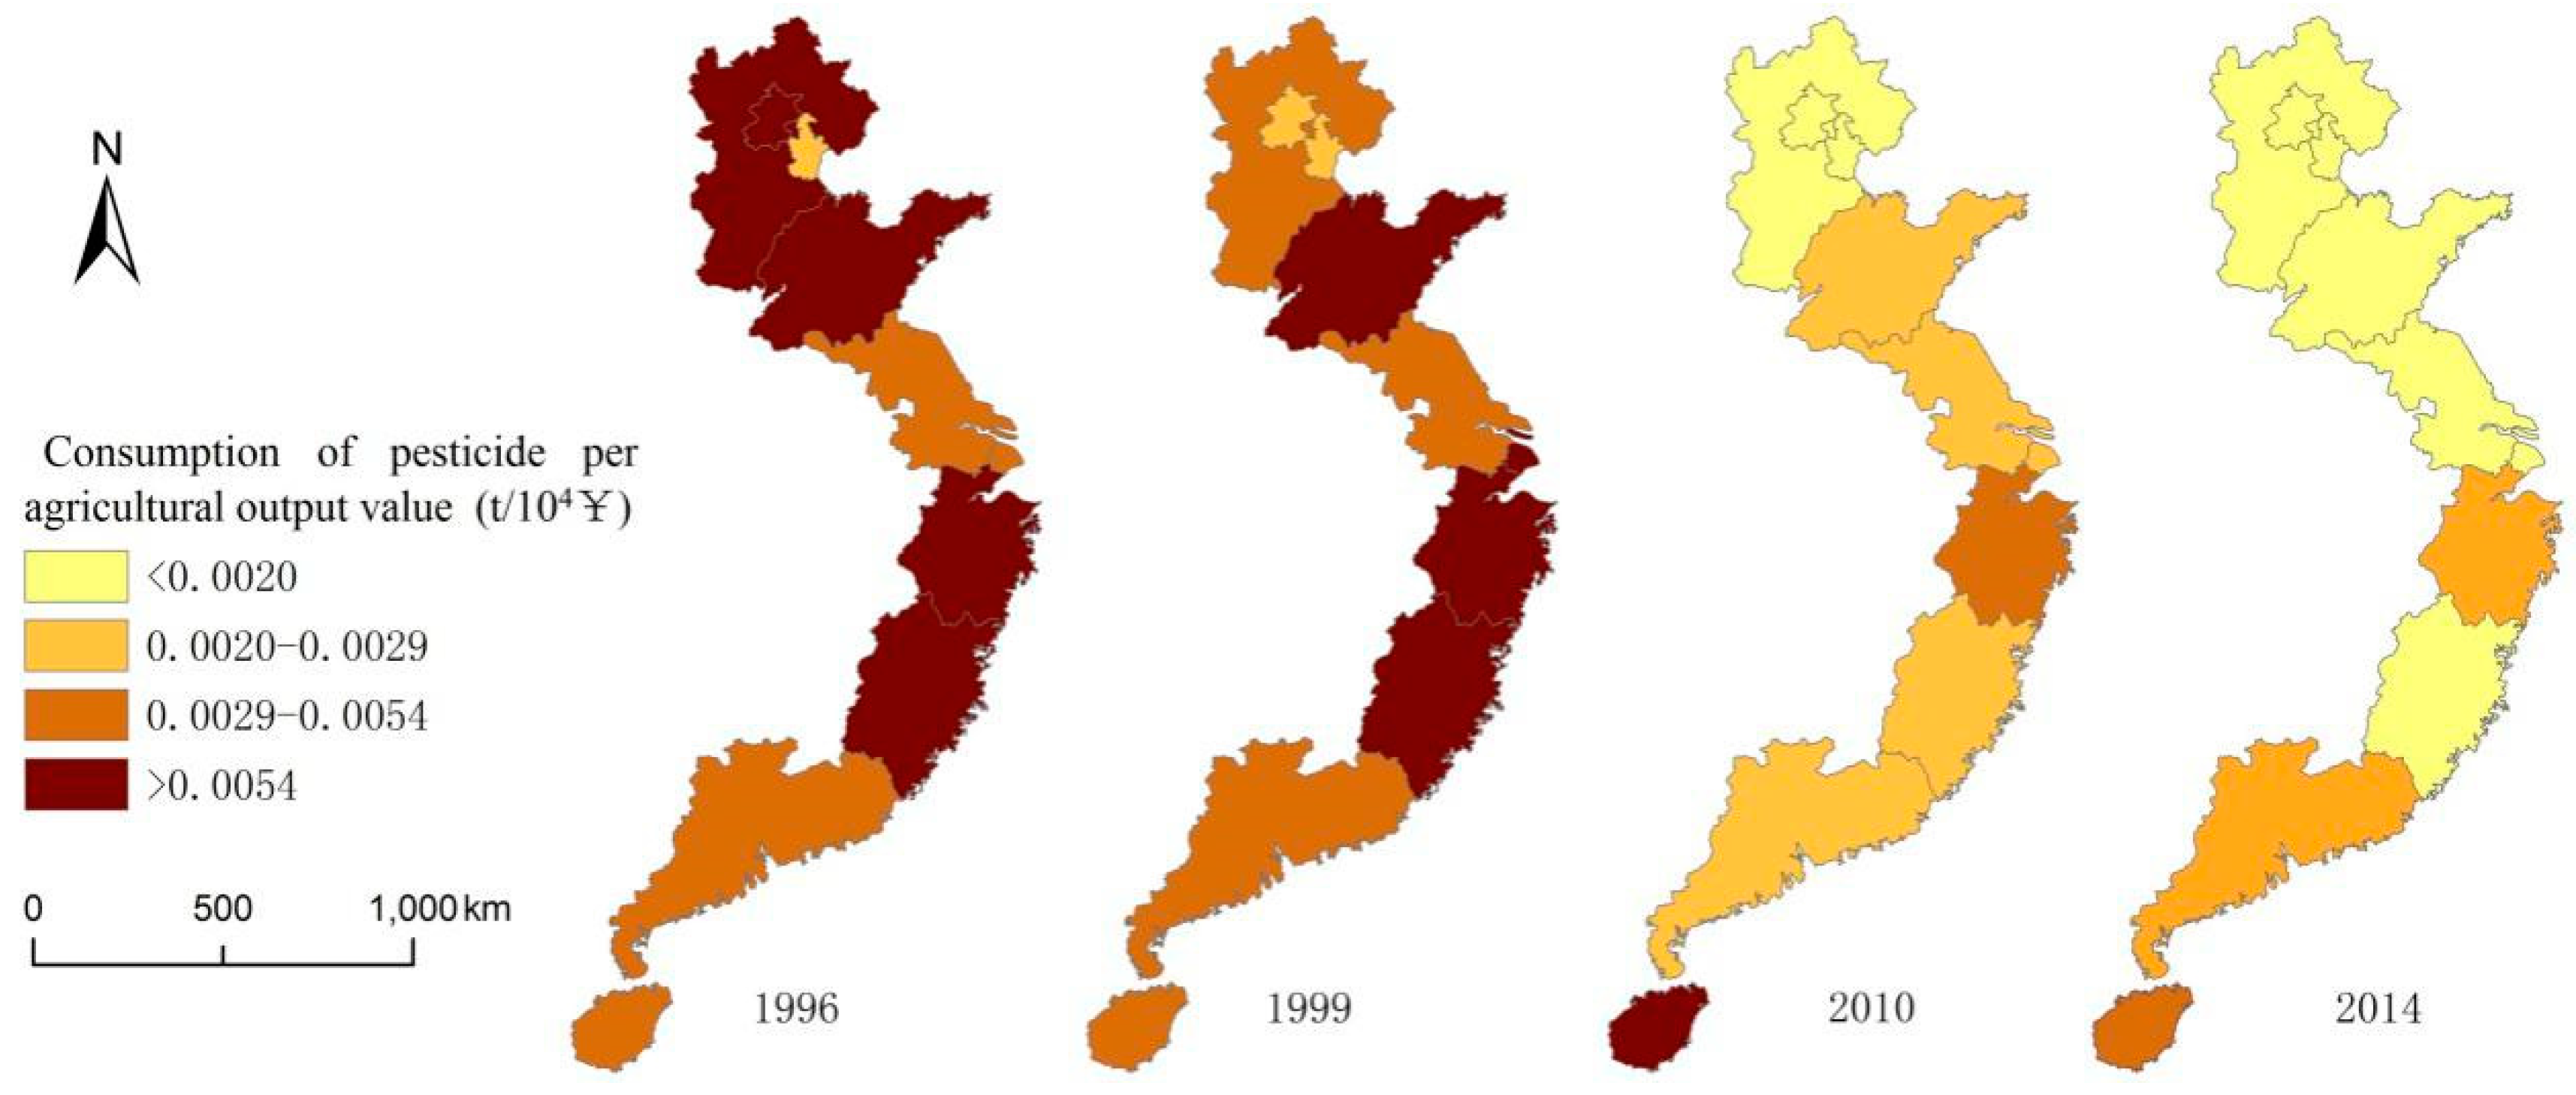
3.3.3. Spatial Pattern Change of the Efficiency Factor

The efficiency factor has an important role in reducing the source of agricultural non-point source pollution in Eastern China, which has been verified in whole space. Because agriculture has a strong dependence on topography, the control policy of each province is different. The change of the internal spatial pattern’s efficiency factor in Eastern China could provide an important basis for the adjustment of the agricultural economic growth’s external supply structure. In this study, the four-way division is used to analyze the change of agrochemical inputs’ consumption per agricultural output value in the critical years including 1996, 1999, 2010 and 2014.
Some areas of chemical fertilizer consumption control policies were not completely consistent with the nation’s in the time sequence (Figure 5). We can take Guangdong as an example. Guangdong strictly controlled the source of agricultural non-point source pollution based on the situation of agricultural non-point source pollution, thus decreasing the consumption of chemical fertilizer per agricultural output value since 1991.
While under the dual guidance of the agricultural external supply policy and the pressure of agricultural economic growth, most residential areas implemented the control policy to a late start, such as Shandong. After the year 1999, with the promotion of source reduction control policy implementation on agricultural non-point source pollution in Eastern China, chemical fertilizer consumption per agricultural output value in various regions were significantly reduced.
Pesticide consumption per agricultural output value was reduced later (Figure 6). Although the result was consistent with the direction of control policies, the spatial pattern change was more obvious. The control result of Beijing and other areas in 1999 was opposite to the control direction in the whole area, where pesticide’s consumption per agricultural output value showed a downward trend in 1996; while the control of Hainan, where agriculture economic development level was relatively low, was lagging behind and pesticide consumption per agricultural output value in 2010 (0.0056 t/104 ¥) was significantly higher than in 1999 (0.0033 t/104 ¥).
The source reduction control on agricultural non-point source pollution has obvious spatial differences. In various regions, the different levels of agricultural development and the different degrees of investment in agricultural mechanization and irrigation, will cause the different agrochemical input consumption in agricultural activities, which has caused different levels of agricultural non-point source pollution.

4. Conclusions

Along with growth of agricultural output value, agrochemical input consumption has shown a decline trend after an initial ascent, and the decoupling relationship with agricultural output value completed the transformation of expansive negative decoupling—expansive coupling—weak decoupling—strong decoupling in Eastern China from 1996 to 2014. It shows that, under the background of the agricultural non-point source pollution’s source reduction control, the dependence on agrochemical inputs to agricultural economic growth begins to gradually weaken. Thus, the source reduction control policies of the agricultural non-point source pollution can be a sustained implementation. The endogenous change factors of agrochemical input consumption is LMDI decomposed into area factor, agricultural productivity factor and efficiency factor. The efficiency factor can help slow down the increase of agrochemical input consumption, while the agricultural productivity factor was the main factor increasing the agrochemical input consumption; the area factor was not obvious. It shows that the constantly improving technological content and management of agrochemical inputs can reduce the agrochemical input consumption and ensure agriculture economic growth. There are regional differences in the source reduction control direction and the results on agricultural non-point source pollution.
With the environmental pollution caused by low utilization of fertilizers and pesticides, and the serious loss of nitrogen and phosphorus, China has adopted subsidy policies to reduce the proportion of major elements in chemical fertilizers, promoted the technical measures of soil testing and formula fertilization and reduced the source of agricultural non-point source pollution [41].
Chemical inputs should be controlled by means of the regional differential regulatory system, based on the laws and regulations. For the pioneering areas such as Shanghai, planning to 2020, the total amount of use of chemical fertilizers and pesticides are being reduced to 20% and 27%, respectively, in each acre [42]; for the less developed regions, represented by Guangdong and other regions, the requirement for zero growth is suitable [43]. In short, there must be differences in regional policies. In addition, the current requirement of zero growth for agrochemical input in our country only stipulates the total amount of pesticide fertilizer input. However, the input of fertilizer per unit sown area in Beijing and other areas continues to increase, requiring that China’s next phase of the policy should not only pay attention to the total amount of control, but also focus on the unit sown area of input control.
Based on the above analysis, the following suggestions are made:
(1)
Continuous developing and adopting of various agricultural efficiency measures. Under the background of continuous reduction in the quantity of agricultural chemical inputs, we must ensure diversified agricultural modernization through ensuring the sustained growth of agricultural output per unit sown area. Accelerate the construction of agricultural water conservancy, electrification and other infrastructure: all provinces and cities should build a rational and manageable agricultural infrastructure according to their respective agricultural landforms. At the same time, we must vigorously promote mechanization of agriculture and develop agricultural machinery targeting at the ease of operation in special agricultural landscapes, based on differences in crop categories, so as to continuously improve the labor efficiency of producers and remedy the influence on agricultural efficiency because of the lack of agrochemical technique.
(2)
Continuous improvement in the input and utilization efficiency of agrochemicals. The agricultural non-point source pollution is originally caused by the loss of nutrients in fertilizers and pesticides [26]. Therefore, alongside the strict control of the utilization of agrochemicals, the scientific and technological content during the agrochemical production shall be enhanced, and low pollution and toxicity level agrochemicals shall be preferentially developed, in particular high-efficiency complex fertilizer and low-toxic pesticide. At the same time, the fertilization and soil testing technology based on regional differences, and the pesticide residue absorption and digestion technology based on environmental characteristics shall be developed, to reduce the loss and residue of agrochemicals.
(3)
Adopt differentiated regional agricultural chemical input reduction control policy. Different provinces and cities have different economic and environmental resources, and all the provinces and cities should be based on the stage of the agricultural economic development and the present situation of non-point source pollution. According to the resources and environment of the agricultural ontology threshold, we should clarify the key points of control of agricultural chemical input reduction, set up different targets and policies in different regions [44]. In the provinces and cities where agricultural economic growth relies less on the production of agricultural chemicals, we should continue to strengthen the control of agricultural chemical, intensify the re-feeding of industrialization on agricultural modernization and explore the mechanism of inter-regional agricultural transactions. Hainan Province should formulate a corresponding agricultural facilities layout in accordance with the mountainous, hilly and plain landscape features, formulate preferential policies on farm machinery purchase and agricultural electricity utilization, so as to guide the environment-friendly and resource-friendly agriculture with the development of “recycling agriculture” and “low-carbon agriculture”.

Acknowledgments

The authors acknowledge the “School of Public Affairs Zhejiang University”, “Laboratory of Rural-Urban Construction Land Economical and Intensive Use”, “China Institute of Regulation Research, Zhejiang University of Finance & Economics” for the necessary support to develop this research. This work and the costs to publish in open access have been partially funded by the National Natural Science Foundation of Zhejiang Province (No. LY18G030029) and the Center for Research of Regulation and Policy of Zhejiang Province.

Author Contributions

Jianhui Yang conceived and designed the theoretical framework and mathematical model; Yaoben Lin and Jianhui Yang analyzed the data and wrote the paper; Yanmei Ye provided guidance and improving suggestions. All authors had read and approved the final manuscript.

Conflicts of Interest

The authors declare no conflict of interest. The founding sponsors had no role in the design of the study; in the collection, analyses, or interpretation of data; in the writing of the manuscript, and in the decision to publish the results.

References

  1. Schaffner, M.; Bader, H.P.; Scheidegger, R. Modeling the contribution of point sources and non-point sources to Thachin River water pollution. Sci. Total Environ. 2009, 407, 4902–4915. [Google Scholar] [CrossRef] [PubMed]
  2. Collins, A.L.; Anthony, S.G. Predicting sediment inputs to aquatic ecosystems across England and Wales under current environmental conditions. Appl. Geogr. 2008, 28, 281–294. [Google Scholar] [CrossRef]
  3. Harmel, D.; Potter, S.; Casebolt, P.; Reckhow, K.; Green, C.; Haney, R. Compilation of measured nutrient load data for agricultural land uses in the United States. J. Am. Water Resour. Assoc. 2006, 42, 1163–1178. [Google Scholar] [CrossRef]
  4. Delpla, I.; Baurès, E.; Jung, A.; Thomas, O. Impacts of rainfall events on runoff water quality in an agricultural environment in temperate areas. Sci. Total Environ. 2011, 409, 1683–1688. [Google Scholar] [CrossRef] [PubMed]
  5. Yang, L.-Z.; Feng, Y.-F.; Shi, W.-M.; Xue, L.-H.; Wong, S.-Q.; Song, X.-F.; Chang, Z.-Z. Review of the advances and development trends in agricultural non-point source pollution control in China. Chin. J. Eco-Agric. 2013, 21, 96–101. [Google Scholar]
  6. National Bureau of Statistics of China. Available online: http://www.stats.gov.cn/tjsj/ndsj/ (accessed on 30 January 2018).
  7. Baumgärtner, S.; Dyckhoff, H.; Faber, M.; Proops, J.; Schiller, J. The concept of joint production and ecological economics. Ecol. Econ. 2001, 36, 365–372. [Google Scholar] [CrossRef]
  8. Wang, Z.; Xiao, H. Analysis of the effect of fertilizer application on the growth of grain yield. Agric. Econ. Probl. 2008, 8, 65–68. [Google Scholar]
  9. Grossman, G.M.; Krueger, A.B. Environmental impacts of a North American free trade agreement. Natl. Bur. Econ. Res. 1991. [Google Scholar] [CrossRef]
  10. Selden, T.M.; Song, D. Environmental quality and development: Is there a Kuznets curve for air pollution estimates? J. Environ. Econ. Manag. 1994, 27, 147–162. [Google Scholar] [CrossRef]
  11. Pasqual, J.; Souto, G. Sustainability in natural resource management. Ecol. Econ. 2003, 46, 47–59. [Google Scholar] [CrossRef]
  12. Managi, S. Are there increasing returns to pollution abatement? Empirical analytics of the Environmental Kuznets Curve in pesticides. Ecol. Econ. 2006, 58, 617–636. [Google Scholar] [CrossRef]
  13. Tsuzuki, Y. An index directly indicates land-based pollutant load contributions of domestic wastewater to the water pollution and its application. Sci. Total Environ. 2006, 370, 425–440. [Google Scholar] [CrossRef] [PubMed]
  14. Philippe, A.; Howitt, P. A model of growth through creative destruction. Econometrica 1992, 60, 323–351. [Google Scholar]
  15. Stokey, N.L. Are There Limits to Growth? Int. Econ. Rev. 1998, 39, 1–31. [Google Scholar] [CrossRef]
  16. OECD (Organization for Economic Cooperation and Development). Indicators to Measure Decoupling of Environmental Pressure from Economic Growth; OECD: Paris, France, 2002. [Google Scholar]
  17. Tapio, P. Towards a theory of decoupling: Degrees of decoupling in the EU and the case of road traffic in Finland between 1970 and 2001. Transp. Policy 2005, 12, 137–151. [Google Scholar] [CrossRef]
  18. Abid, M. The close relationship between informal economic growth and carbon emissions in Tunisia since 1980: The (ir)relevance of structural breaks. Sustain. Cities Soc. 2015, 15, 11–21. [Google Scholar] [CrossRef]
  19. Silvia, C.; Esposti, R. Long-Term Agricultural GHG Emissions and Economic Growth: The Agricultural Environmental Kuznets Curve across Italian Regions. EAAE Congr. Chang. Uncertain. Chall. Agric. 2011, 3, 376–388. [Google Scholar]
  20. Zhang, Y.; Da, Y. The decomposition of energy-related carbon emission and its decoupling with economic growth in China. Renew. Sustain. Energy Rev. 2015, 41, 1255–1266. [Google Scholar] [CrossRef]
  21. Sun, J.W. Changes in energy consumption and energy intensity: A complete decomposition model. Energy Econ. 1998, 20, 85–100. [Google Scholar] [CrossRef]
  22. Ang, B.W.; Choi, K. Decomposition of aggregate energy and gas emission intensities for industry: A refined Divisia index method. Energy J. 1997, 18, 59–73. [Google Scholar] [CrossRef]
  23. Ang, B.W.; Liu, F.L. A new energy decomposition method: Perfect in decomposition and consistent in aggregation. Energy 2001, 26, 537–548. [Google Scholar] [CrossRef]
  24. Ang, B.W.; Liu, F.L.; Chew, E.P. Perfect decomposition techniques in energy and environmental analysis. Energy Policy 2003, 31, 1561–1566. [Google Scholar] [CrossRef]
  25. Ang, B.W.; Zhang, F.Q.; Choi, K. Factorizing changes in energy and environmental indicators through decomposition. Energy 1998, 23, 489–495. [Google Scholar] [CrossRef]
  26. Zhang, W.; Wu, S.; Ji, H.; Kolbe, H. Estimation of Agricultural Non-Point Source Pollution in China and the Alleviating Strategies I. Estimation of Agricultural Non-Point Source Pollution in China in Early 21 Century. Sci. Agric. Sin. 2004, 37, 1008–1017. [Google Scholar]
  27. China Food Safety News. Available online: http://paper.cfsn.cn/content/2015-12/15/node_2.htm (accessed on 30 January 2018).
  28. Jian-Lan, R.; Shu-Min, Z.; Peng, Z. An Ecological Appraisal of Industrial Structure and a thoughtfulness of designing models of Circle Economy in Shandong Province. Sci. Geogr. Sin. 2004, 24, 648–653. [Google Scholar]
  29. Bin, L.; Ke, W.; Qiang, X.Z. Energy Efficiency Based Regional Cluster Analysis of China. Econ. Geogr. 2013, 33, 15–21. [Google Scholar]
  30. Cheng, J.; Shi, X. Structural Shift, Techlogical Progress, Energy Price and Energy Efficiency. China Popul. Resour. Environ. 2010, 20, 35–42. [Google Scholar]
  31. Tao, J. Effects of Cultivated Land Use on Temporal-Spatial Variation of Grain Production in China. J. Nat. Resour. 2014, 29, 911–919. [Google Scholar]
  32. Li, G.; Li, Z. Empirical analysis on decomposition of carbon emission factors of agricultural energy consumption in China: Based on LMDI model. J. Agro-Tech. Econ. 2010, 10, 66–72. [Google Scholar]
  33. Yao, C.; Jie, S. Disconnect Analysis and Influence Factors of Animal Husbandry in China. China Popul. Resour. Environ. 2014, 24, 101–107. [Google Scholar]
  34. National Bureau of Statistics of China. Available online: http://www.yearbookchina.com/naviBooklist-YMCTJ-0.html (accessed on 30 January 2018).
  35. Zhang, W.; Wu, S.; Ji, H.; Kolbe, H. Estimation of Agricultural Non-Point Source Pollution in China and the Alleviating Strategies III. A Review of Policies and Practices for Agricultural Non-Point Source Pollution Control in China. Sci. Agric. Sin. 2004, 37, 1026–1033. [Google Scholar]
  36. Xiang, W.; Feng, Z. Analysis on Present Situation and Regional Disparity of Agricultural Chemical Fertilizer Input in China. Acta Agric. Jiangxi 2011, 23, 169–173. [Google Scholar]
  37. Ministry of Environmental Protection. Ministry of Environmental Protection, National Bureau of Statistics, Ministry of Agriculture. First National Census of Pollution Sources: 2010; Ministry of Environmental Protection: Beijing, China, 2010. [Google Scholar]
  38. Jiang, L.; Qiu, H.; Yue, J.; Liao, S.P.; Han, W. Decomposition of Factors Contributed to the Increase of China’s Chemical Fertilizer Use and Projections for Future Fertilizer Use in China. J. Nat. Resour. 2013, 28, 1869–1878. [Google Scholar]
  39. Xue, L.; Yang, L. Recommendations for nitrogen fertiliser topdressing rates in rice using canopy reflectance spectra. Biosyst. Eng. 2008, 100, 524–534. [Google Scholar] [CrossRef]
  40. Min, J.; Zhang, H.; Shi, W. Optimizing nitrogen input to reduce nitrate leaching loss in greenhouse vegetable production. Agric. Water Manag. 2012, 111, 53–59. [Google Scholar] [CrossRef]
  41. Yang, J.H. Research on Decoupling Relationship between Agricultural Chemical Inputs and Agricultural Economic Growth: Based on the Data of Six Provinces and One City in East China. J. Nat. Resour. 2017, 32, 1517–1527. [Google Scholar]
  42. The Shanghai Municipal Agricultural Commission. Available online: http://www.shac.gov.cn/xxgk/xxgkml/snwgzyw/zhongzhi/201509/t20150917_1507579.html (accessed on 30 January 2018).
  43. Ministry of Agriculture. Available online: http://www.cnagri.com/lypd/lyzx/zaliang/20150703/355708.html (accessed on 30 January 2018).
  44. Liu, Q. Spatio-temporal changes of fertilization intensity and environmental safety threshold in China. Trans. Chin. Soc. Agric. Eng. 2017, 33, 214–221. [Google Scholar]
Figure 1. Sketch map of Eastern China.
Sustainability 10 00917 g001
Figure 2. The change of agricultural output value in Eastern China from 1996 to 2014.
Sustainability 10 00917 g002
Figure 3. Agrochemical inputs’ consumption in Eastern China from 2001 to 2014.
Sustainability 10 00917 g003
Figure 4. Decoupling relationships between agrochemical inputs and agricultural growth from 2002 to 2014.
Sustainability 10 00917 g004
Figure 5. Spatial distributions of chemical fertilizer consumption per agricultural output value.
Sustainability 10 00917 g005
Figure 6. Spatial distributions of pesticide consumption per agricultural output value.
Sustainability 10 00917 g006
Table 1. The time-series of basic data in Eastern China from 1996 to 2014.
YearConsumption of Chemical Fertilizer (104 t)Consumption of Pesticide (104 t)Agricultural Output Value (1012 ¥)
19961409.5052.240.95
19971451.5053.060.98
19981460.2054.010.99
19991491.5054.801.01
20001498.6053.901.03
20011523.1054.351.09
20021537.6054.551.13
20031542.9054.931.21
20041587.5055.431.42
20051622.6258.281.54
20061657.1060.481.65
20071681.9460.731.83
20081667.2062.442.13
20091679.0963.572.23
20101687.2062.762.52
20111689.3063.142.92
20121689.8061.823.16
20131682.9061.243.41
20141682.7060.183.57
Table 2. Log-mean Divisia index (LMDI) decomposition of agrochemical inputs’ consumption in Eastern China from 1996 to 2014.
PeriodConsumption of Chemical Fertilizer (104 t)Consumption of Pesticide (104 t)
Area FactorAgricultural Productivity FactorEfficiency FactorTotal ChangeArea FactorAgricultural Productivity FactorEfficiency FactorTotal Change
1996–19975.5522.74−19.748.550.20.84−0.230.82
1997–199816.9819.25−5.3530.880.620.71−0.380.95
1998–1999−14.5239.14−17.617.01−0.541.44−0.120.79
1999–2000−28.8266.84−13.7824.24−1.052.43−2.28−0.9
2000–2001−20.299.27−64.7514.32−0.723.56−2.380.45
2001–2002−31.1683.31−46.885.27−1.112.97−1.610.25
2002–2003−40.92157.02−72.2143.89−1.465.59−3.720.41
2003–2004−16.75266.28−215.2834.25−0.599.4−8.390.42
2004–20055.72122.64−94.6133.750.24.34−1.692.85
2005–20060.2114.55−90.3524.40.014.15−1.962.2
2006–2007−70.52241.84−186.01−14.7−2.568.78−5.970.25
2007–200817.08231.54−258.8−10.180.638.51−7.441.7
2008–20098.6267.34−53.922.060.322.54−1.721.14
2009–20108.29203.8−203.988.110.317.65−8.77−0.81
2010–20118.1238.87−244.872.10.38.91−8.830.38
2011–2012−4.86136.61−131.250.5−0.185.05−6.19−1.32
2012–20135.75123.51−136.16−6.90.214.51−5.3−0.58
2013–20140.9774.47−75.65−0.20.042.69−3.77−1.05
1996–2014−149.52194.57−1817.16227.92−5.4479.86−66.487.94

