Spatiotemporal Patterns of Extreme Temperature across the Huai River Basin, China, during 1961–2014, and Regional Responses to Global Changes


Abstract
:1. Introduction
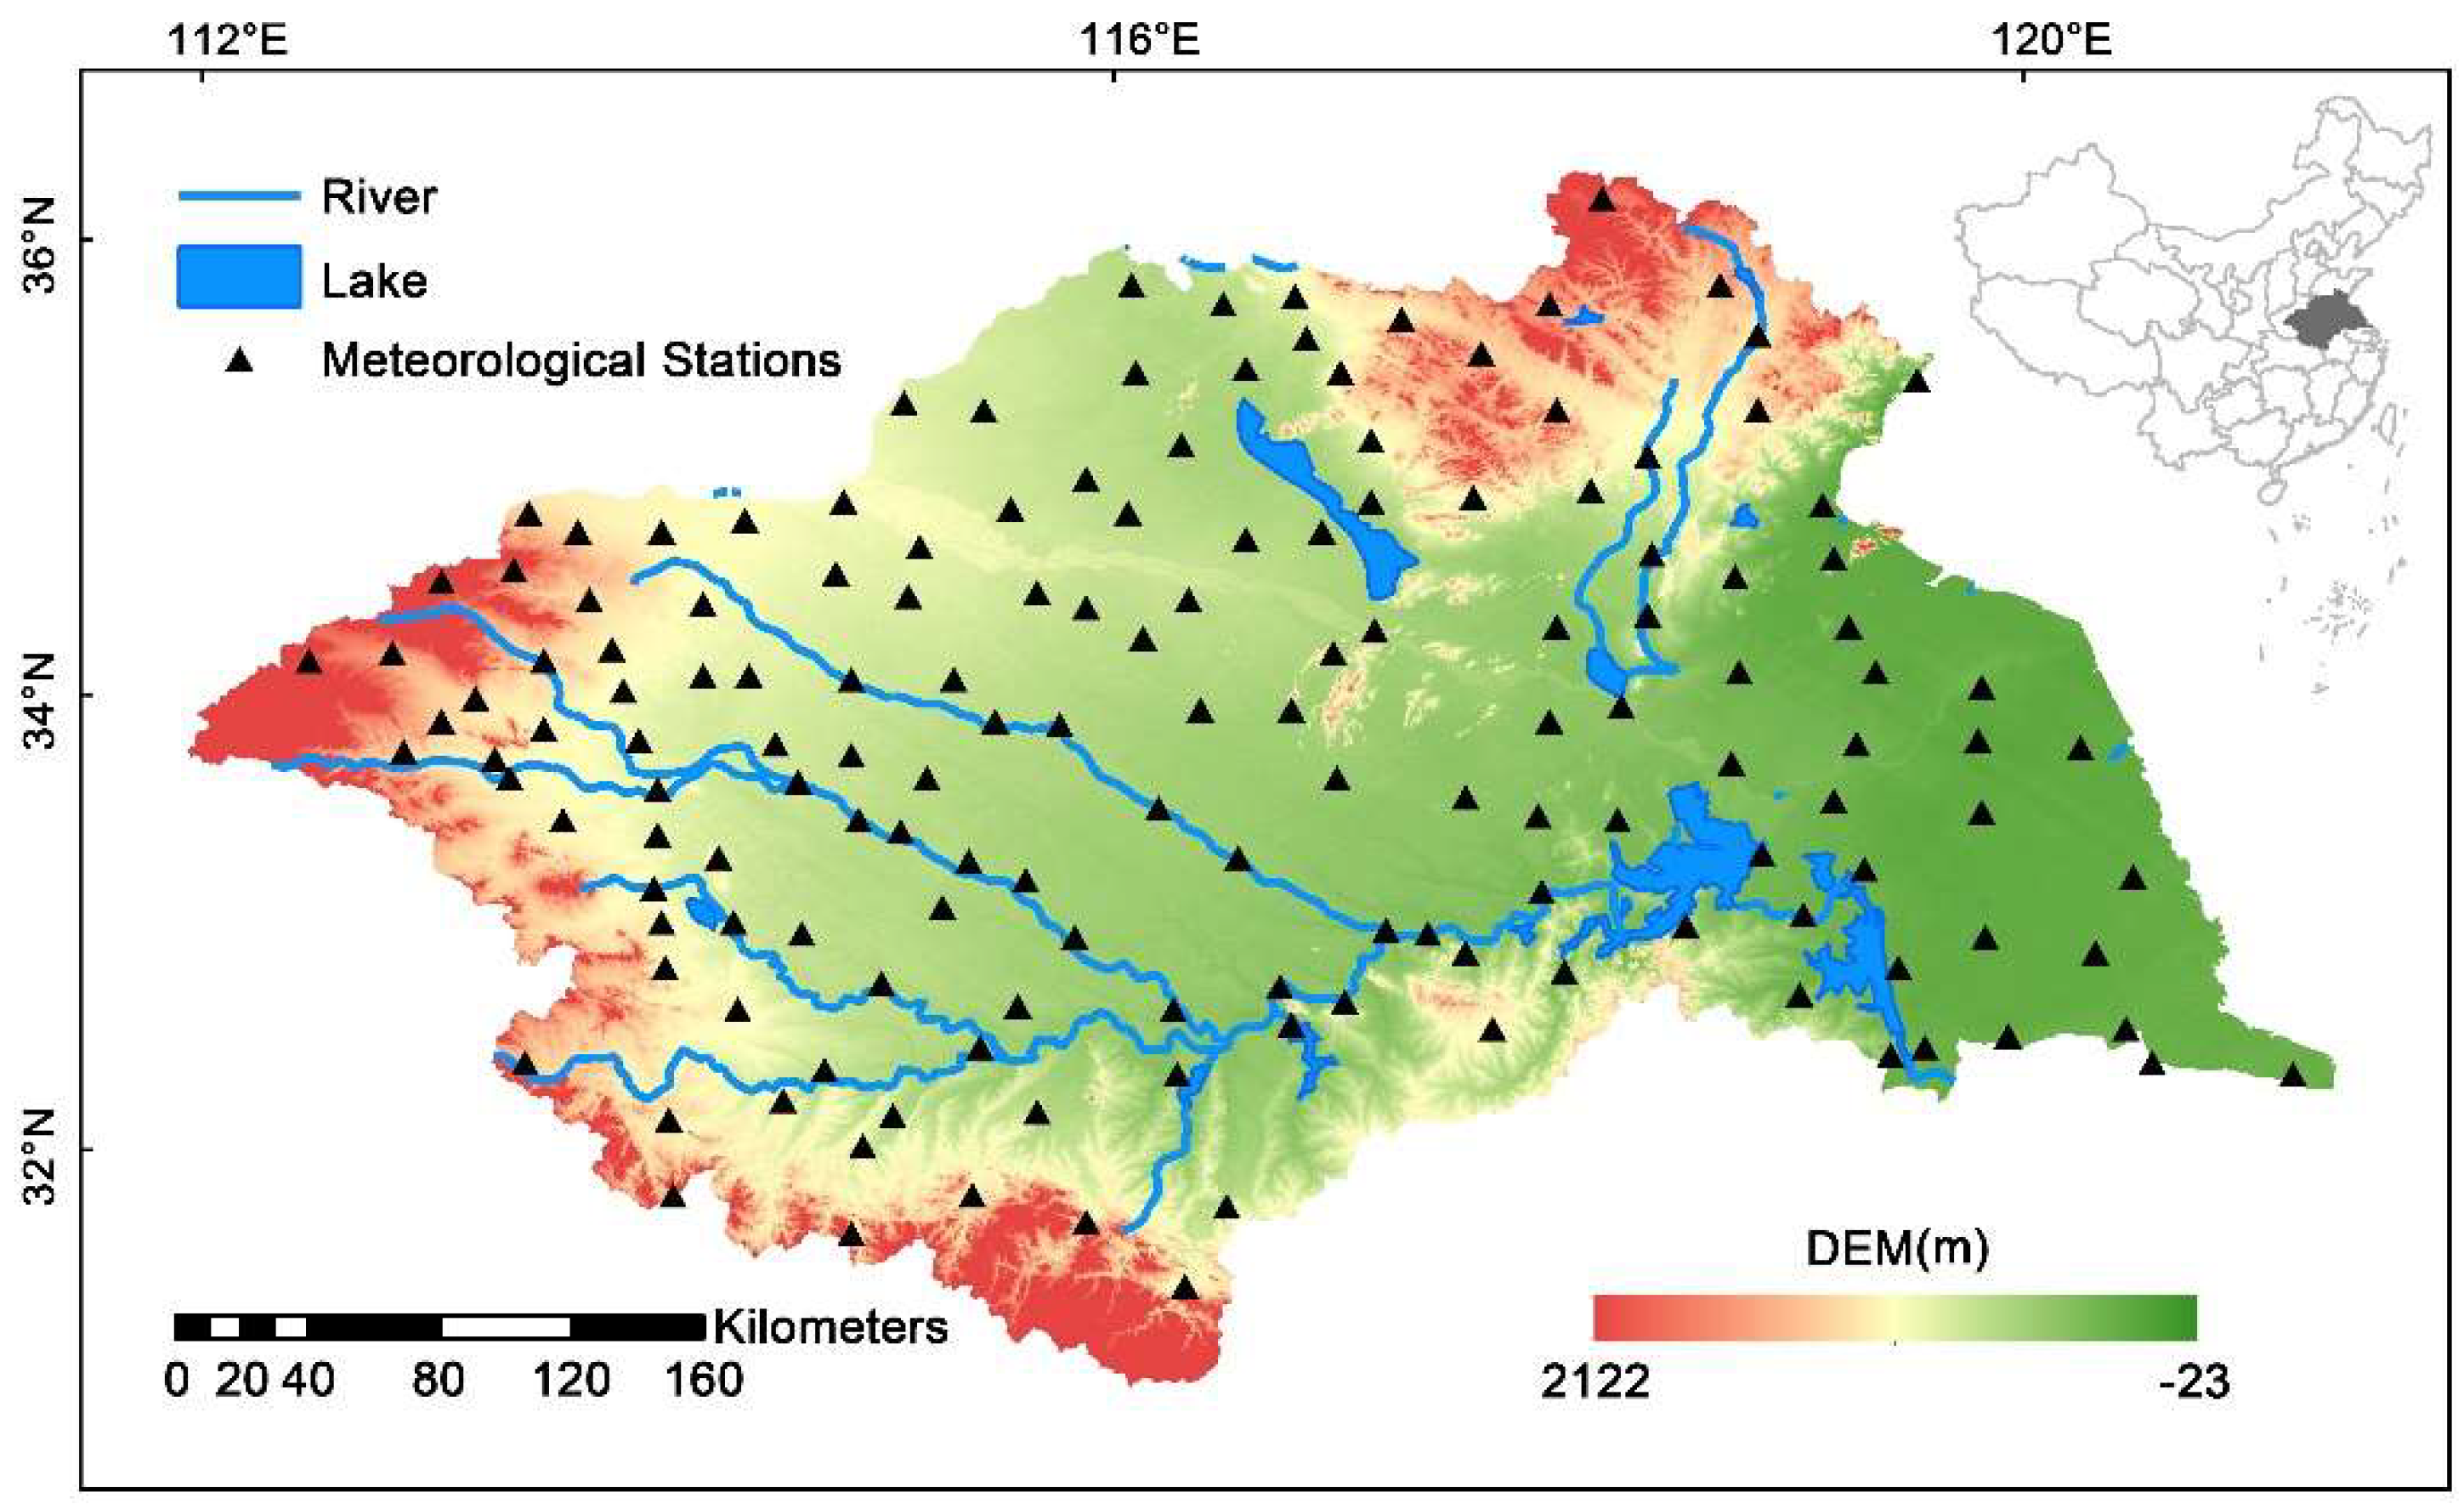
2. Data
3. Methods
3.1. Extreme Temperature Indices and Sen’s Trends
3.2. Mann–Kendall (MK) Trend Test Method
4. Results and Discussion
4.1. Trends in Extreme Temperature Indices
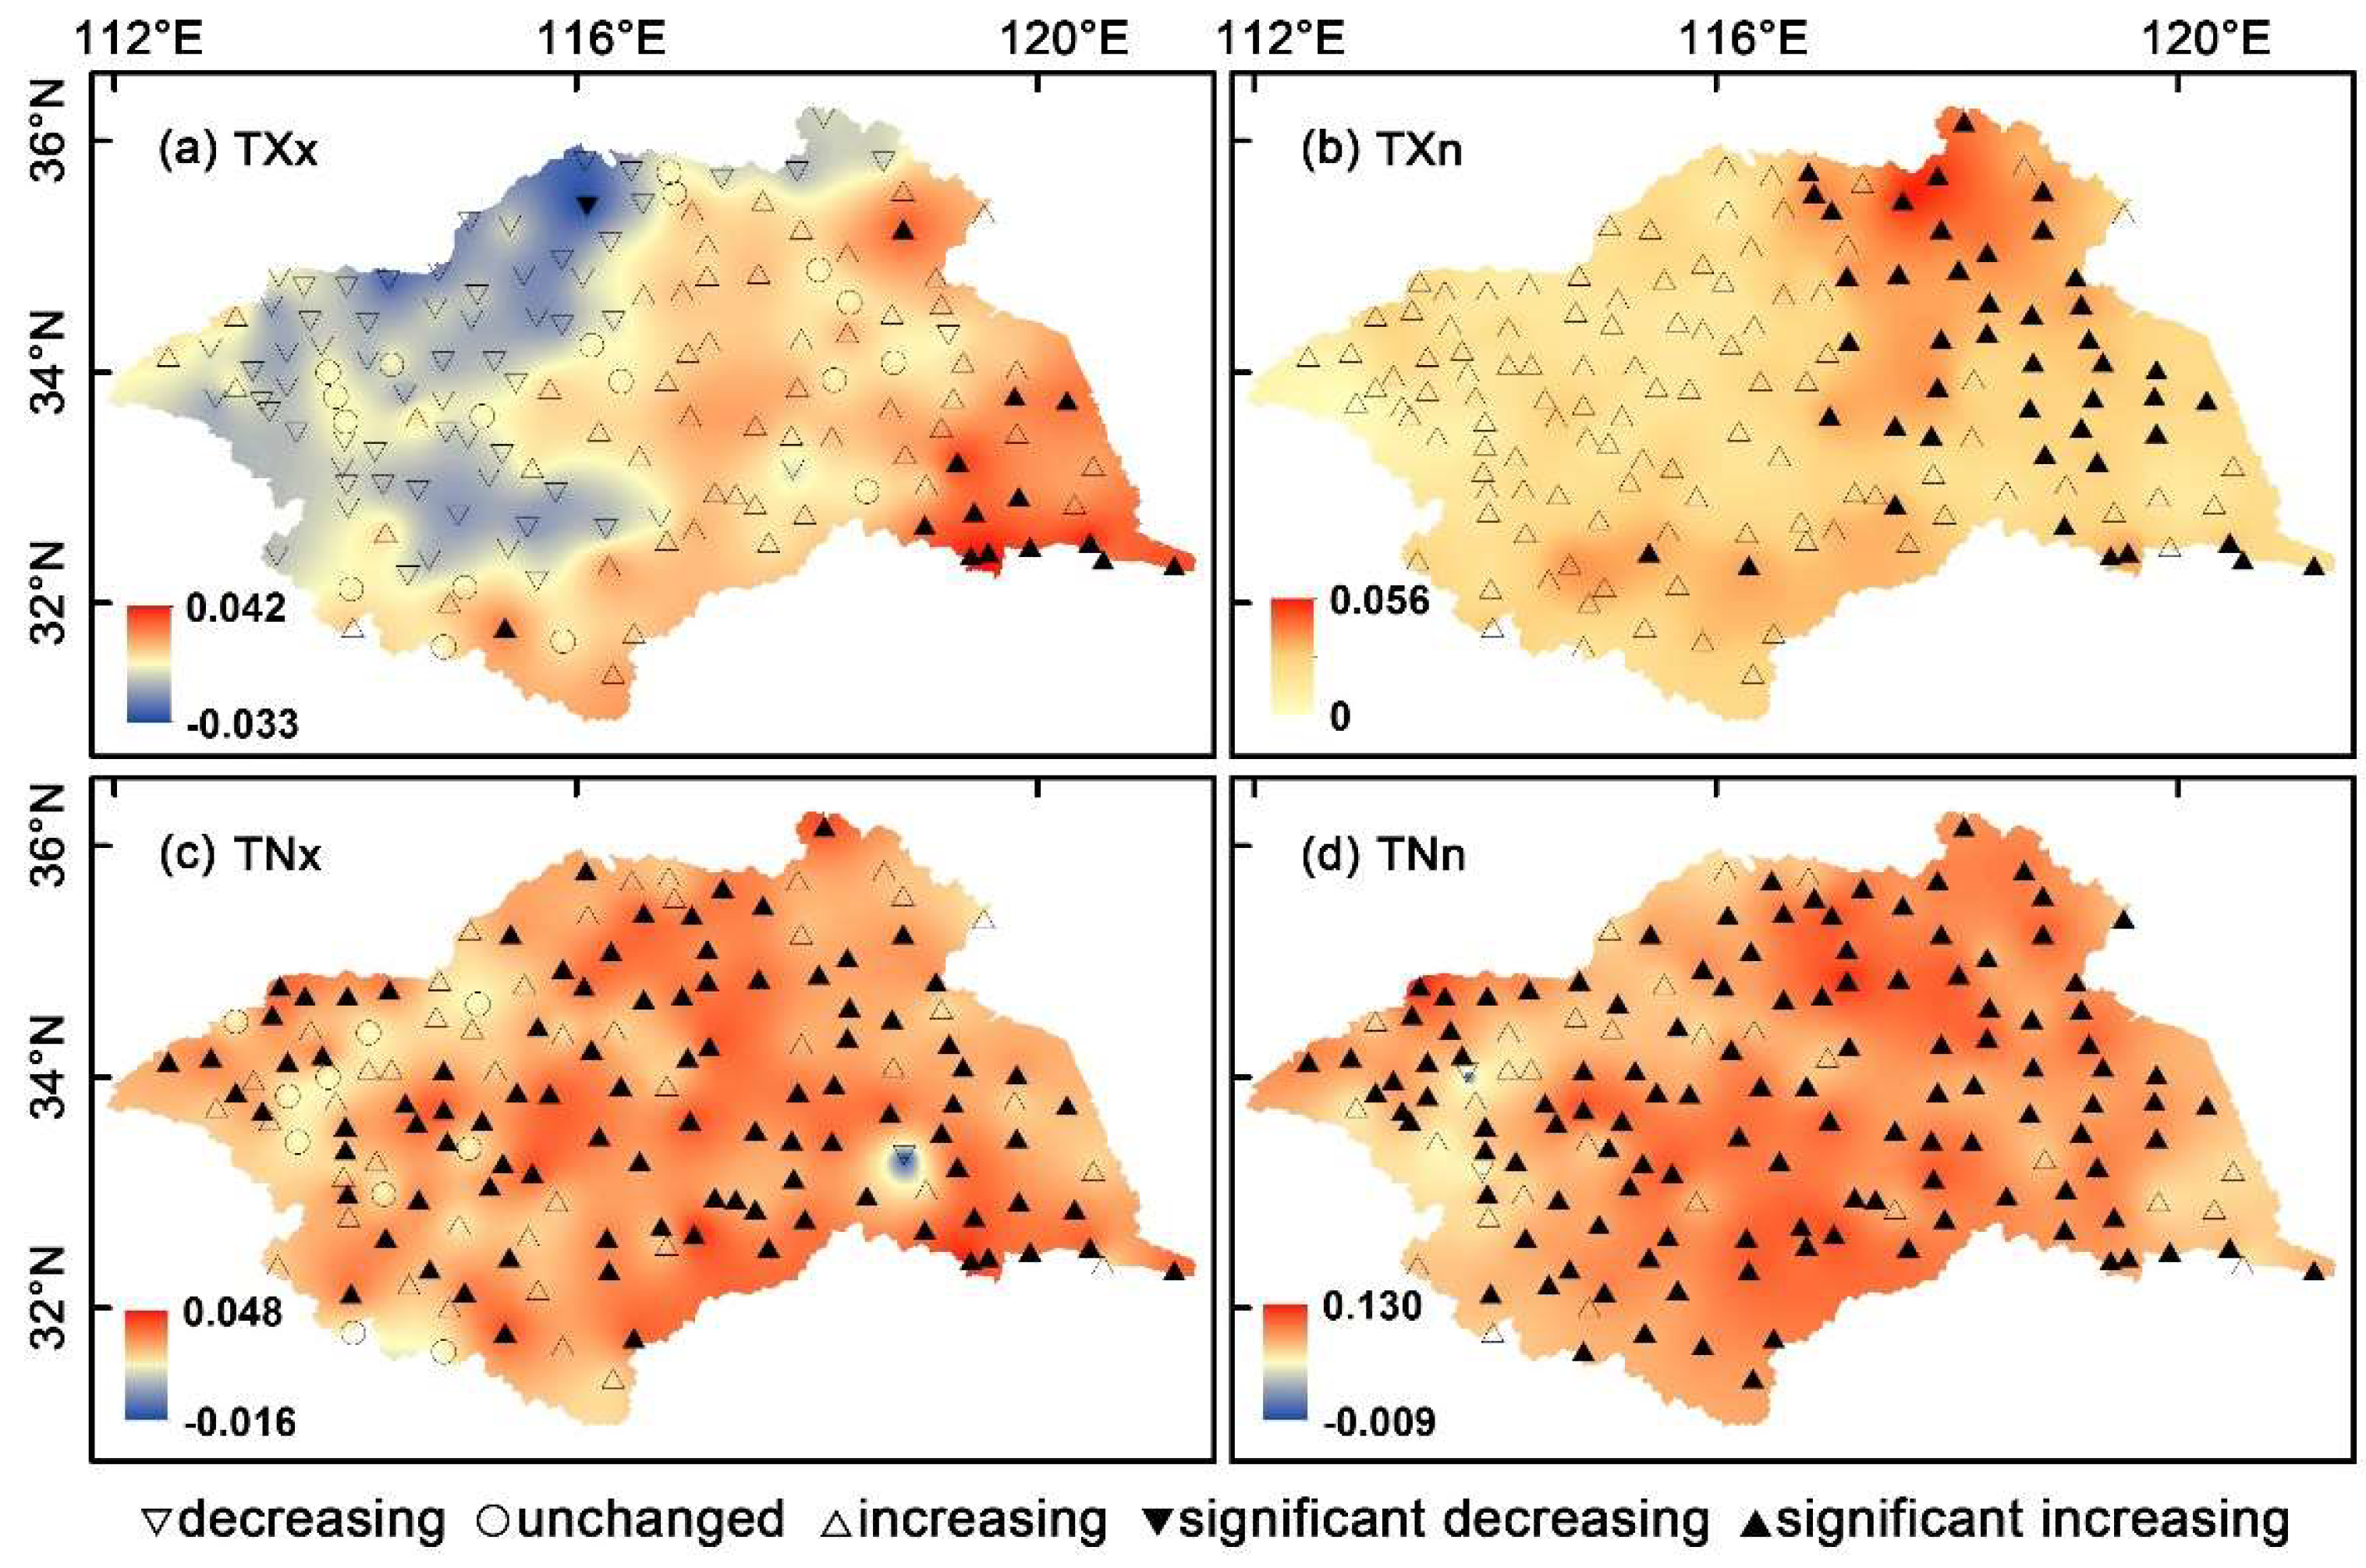
4.2. Trends of Extreme Maximum Temperature Indices
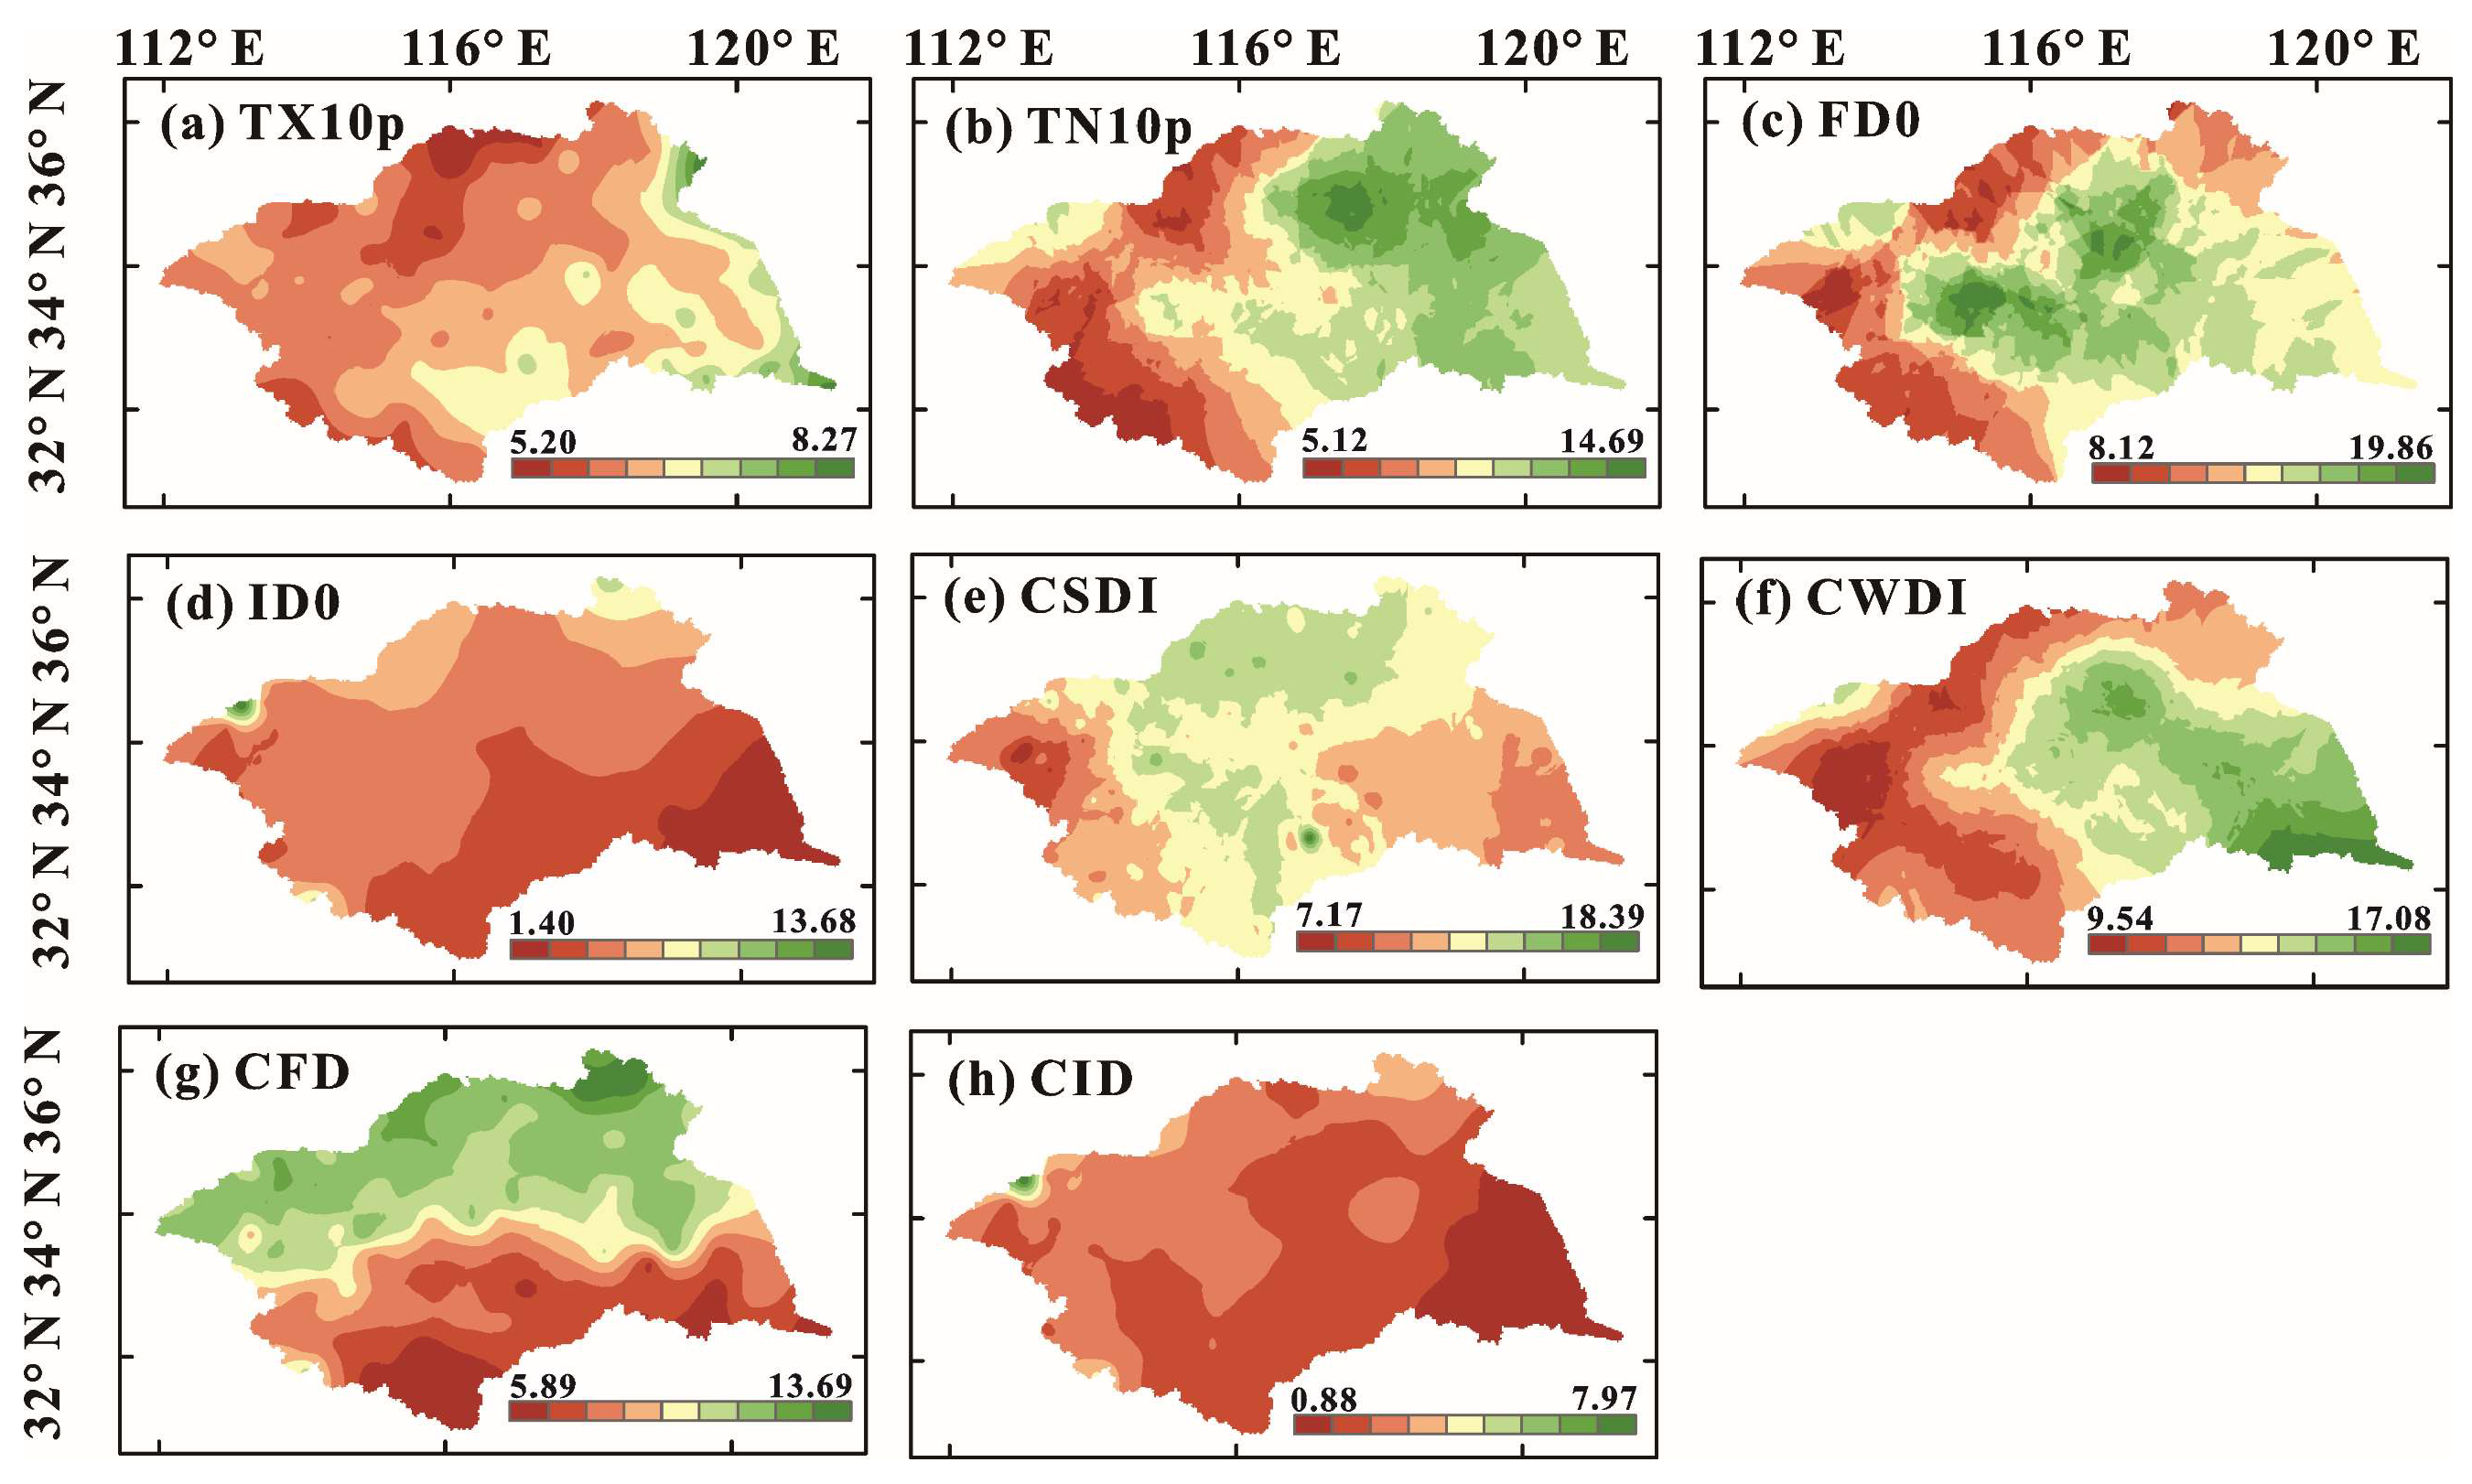
4.3. Trends of Extreme Minimum Temperature Indices
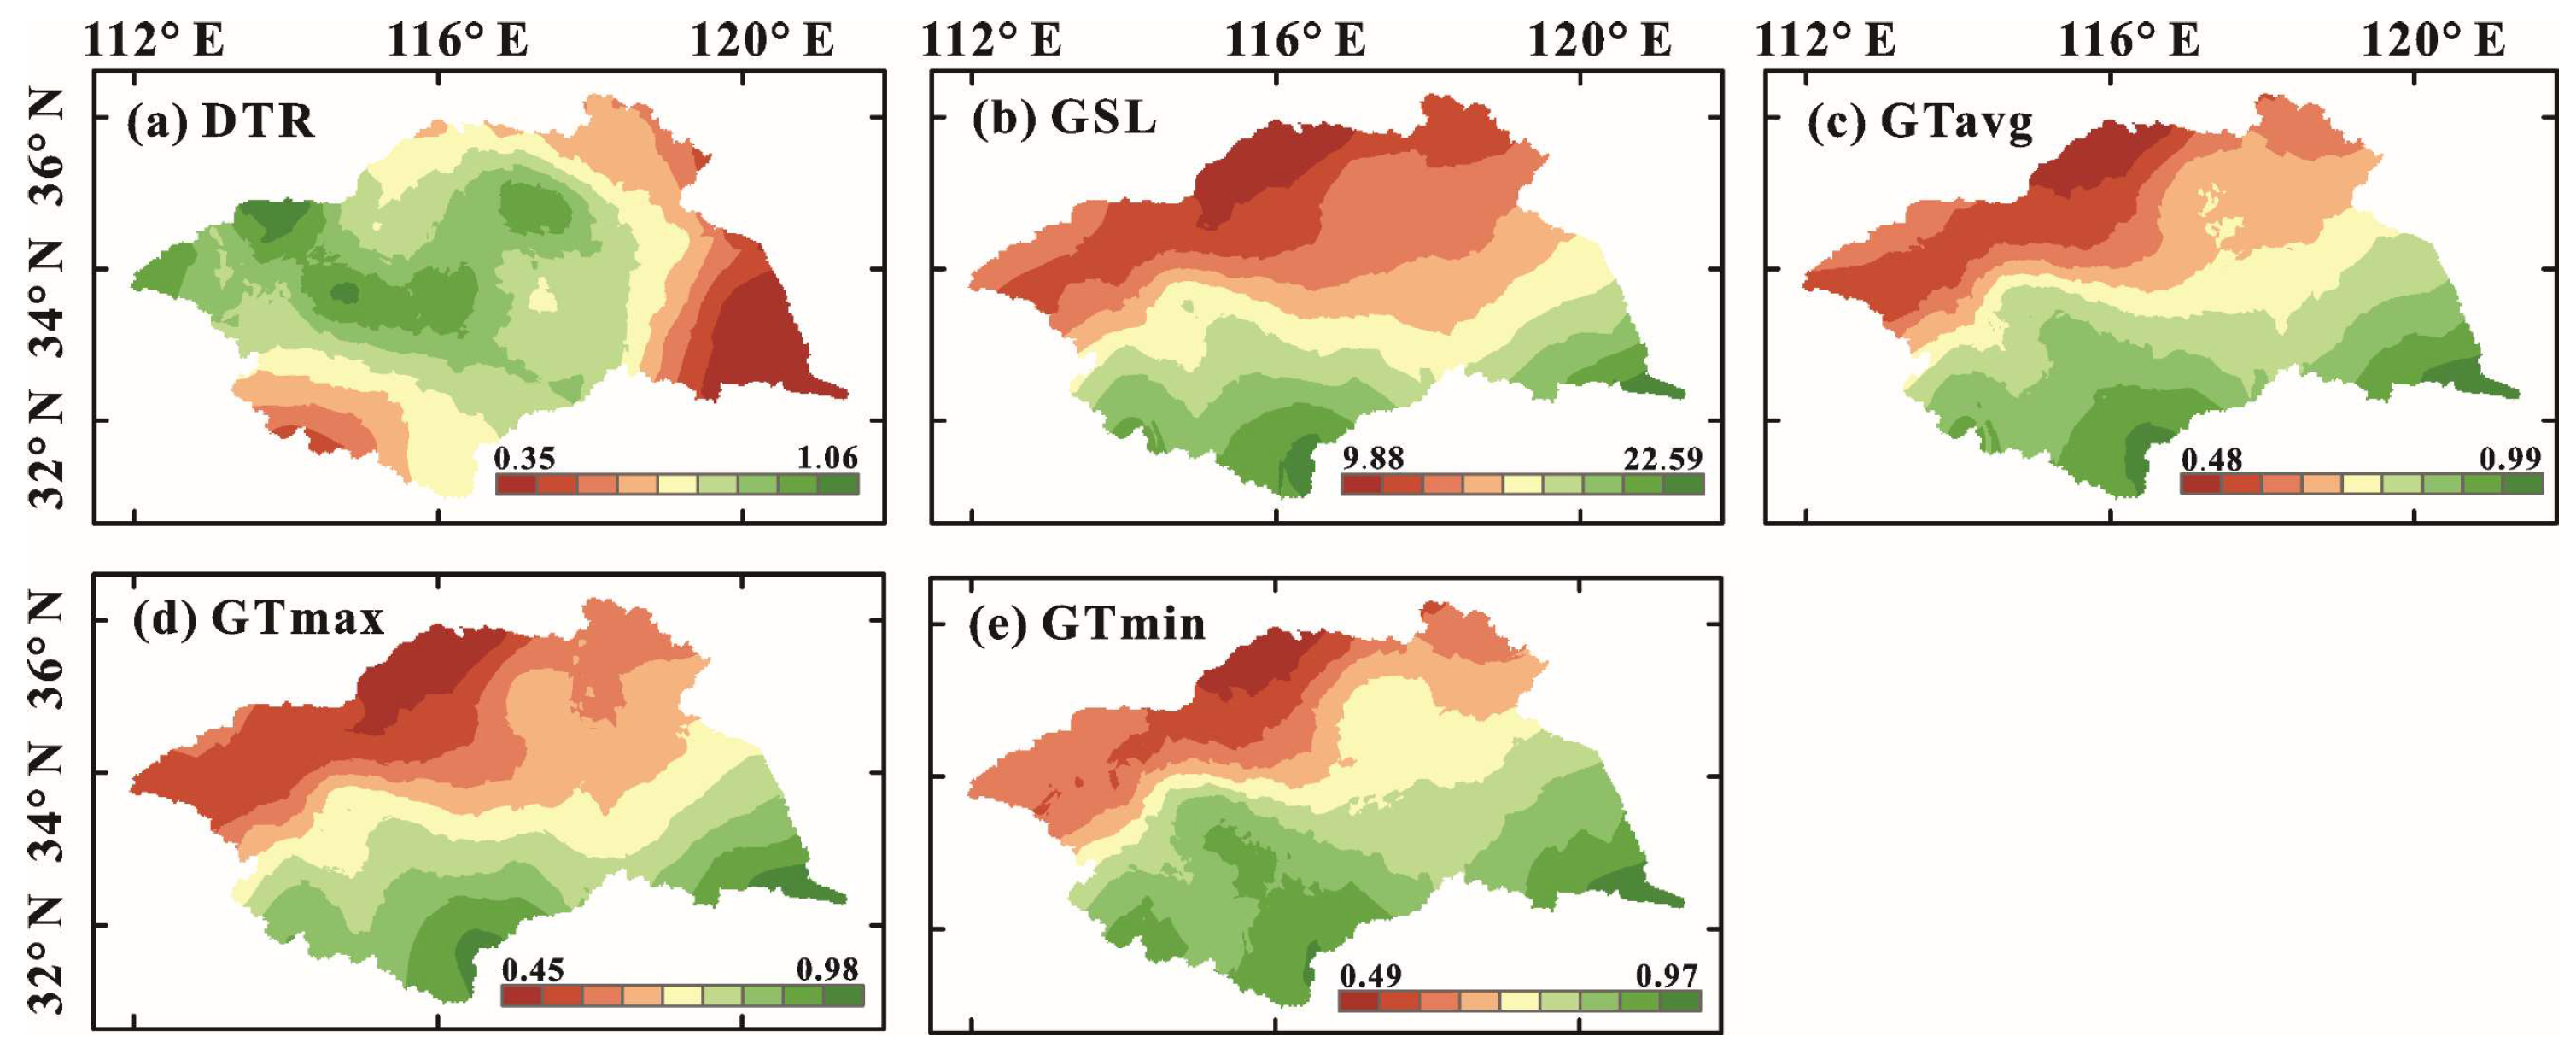
4.4. Trends in Other Indices
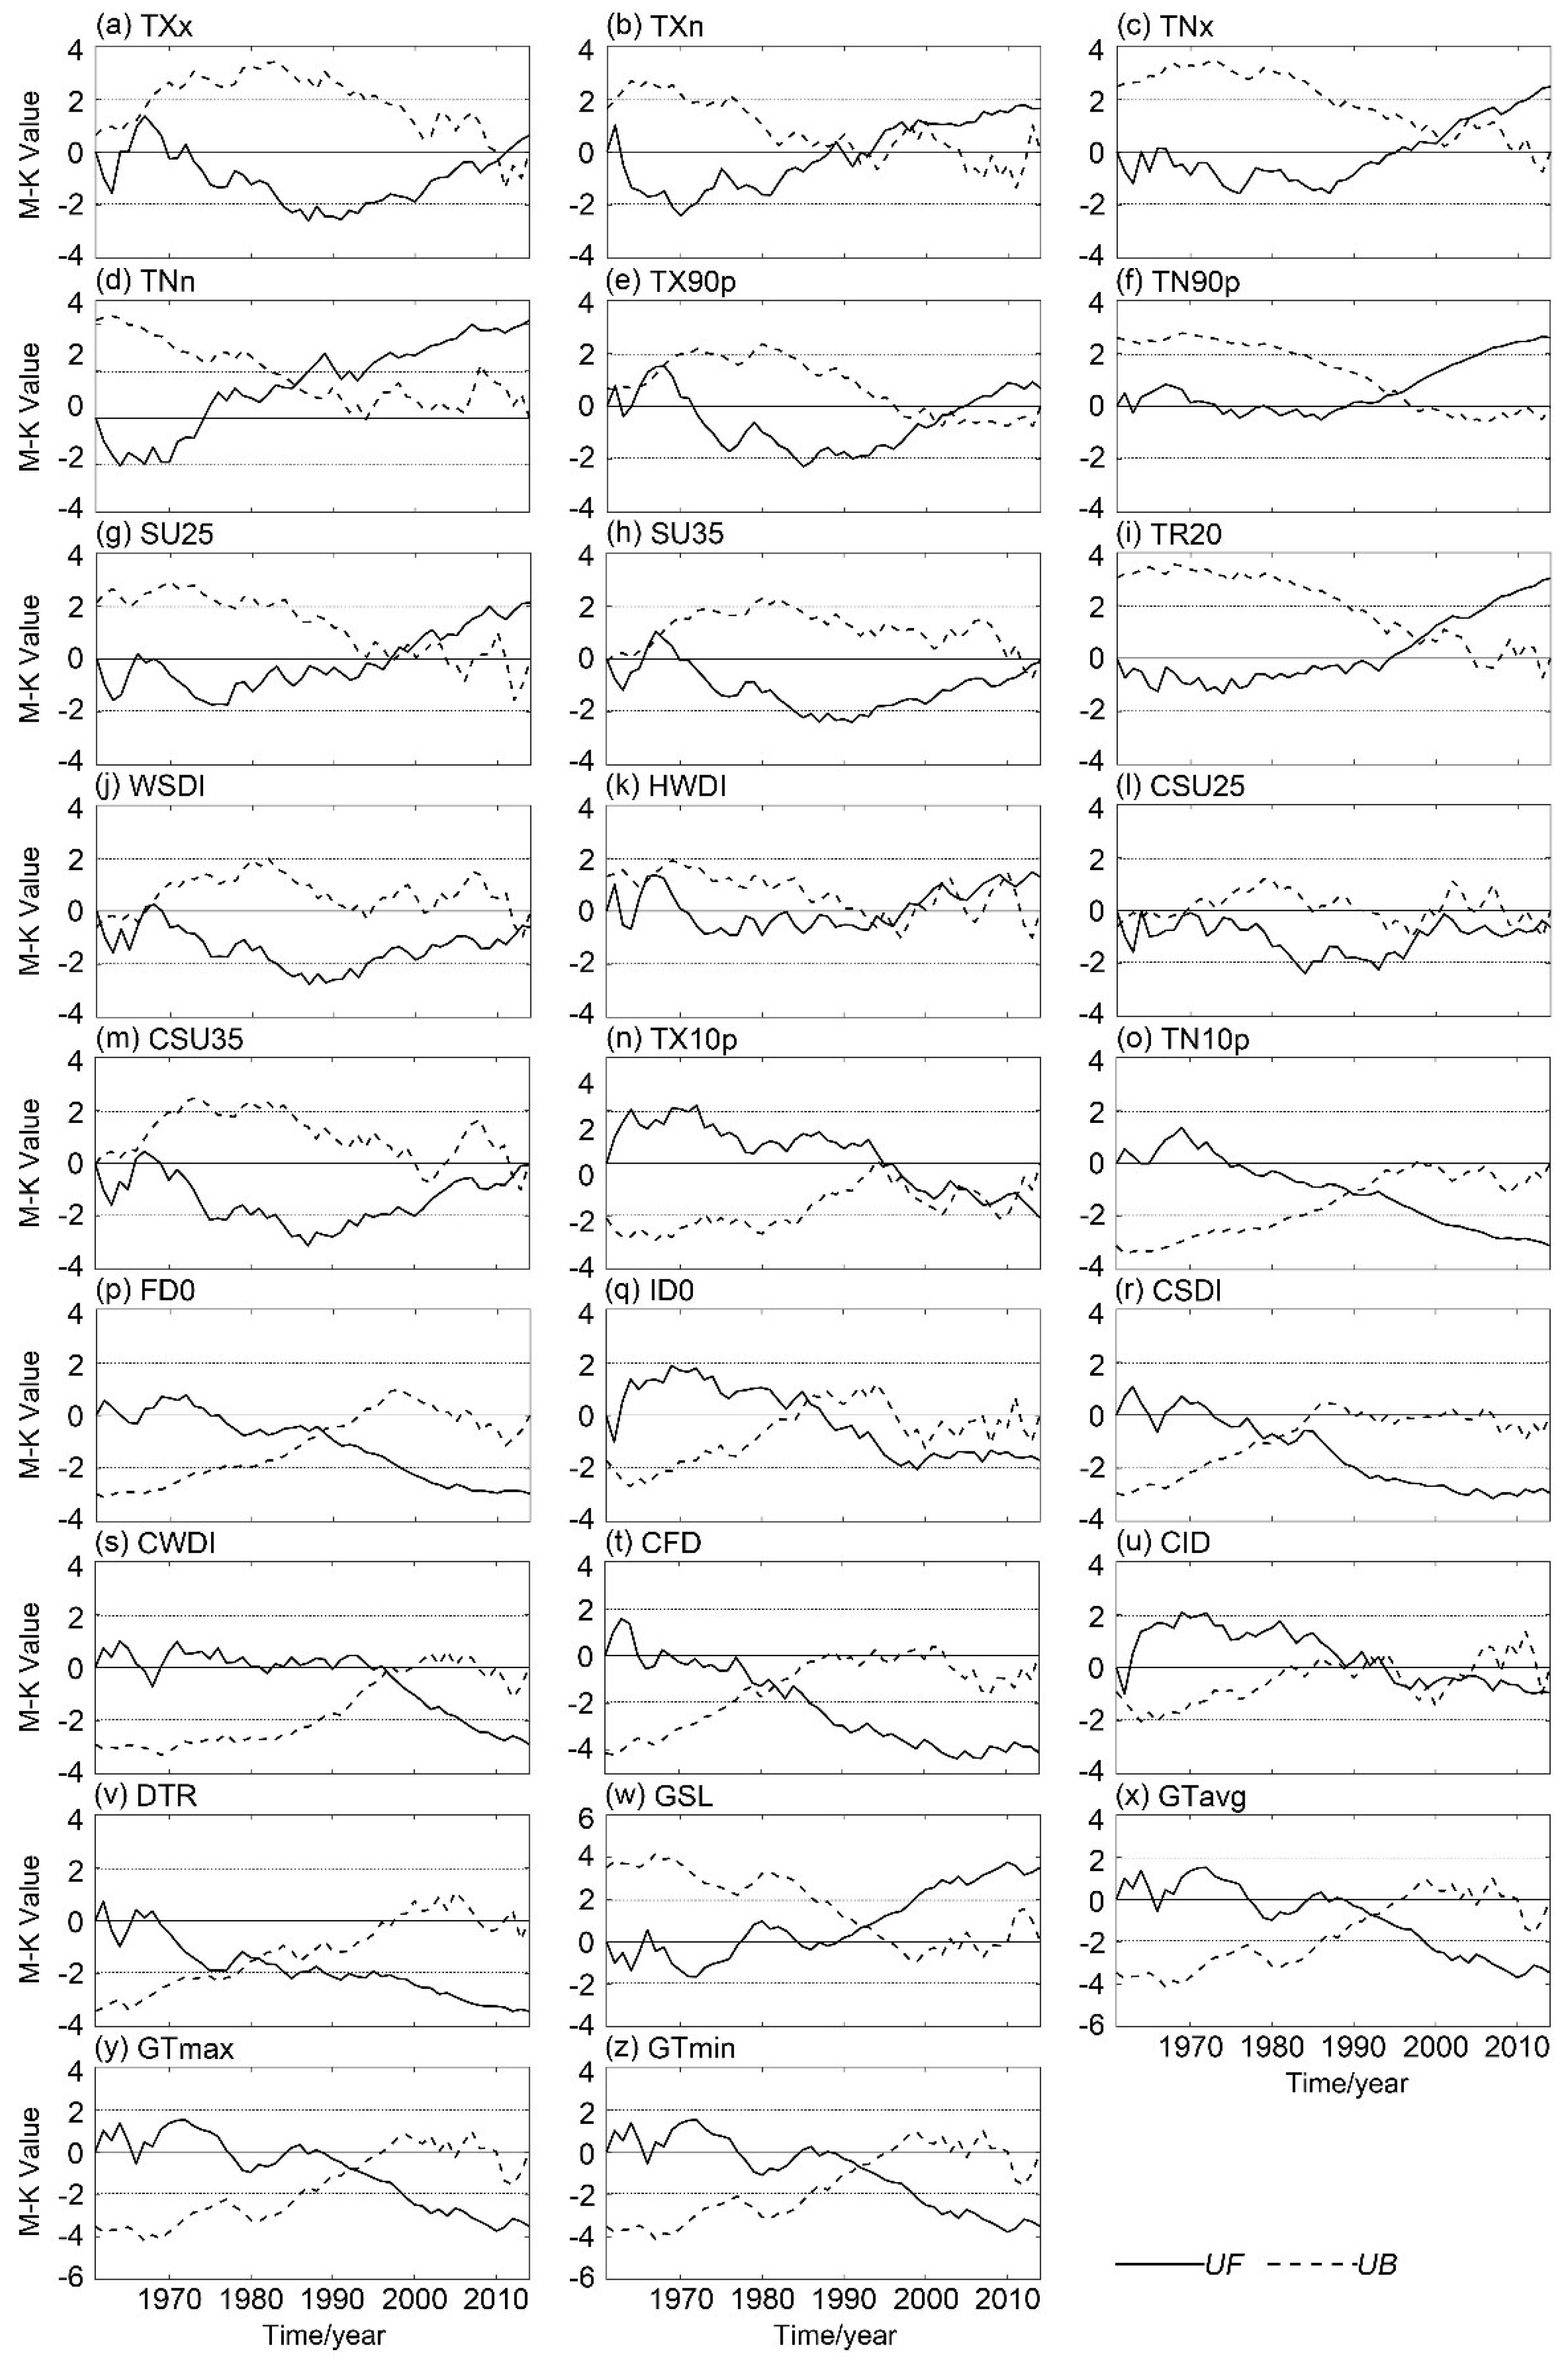
4.5. Abrupt Changes and Correlations of Extreme Temperature Indices
5. Discussion
5.1. Relations between Extreme Temperature Indices and Locations (Latitude and Longitude), Altitude
5.2. Regional Responses of Warming Processes in Huai River Basin to Global Changes
6. Conclusions
- (1)
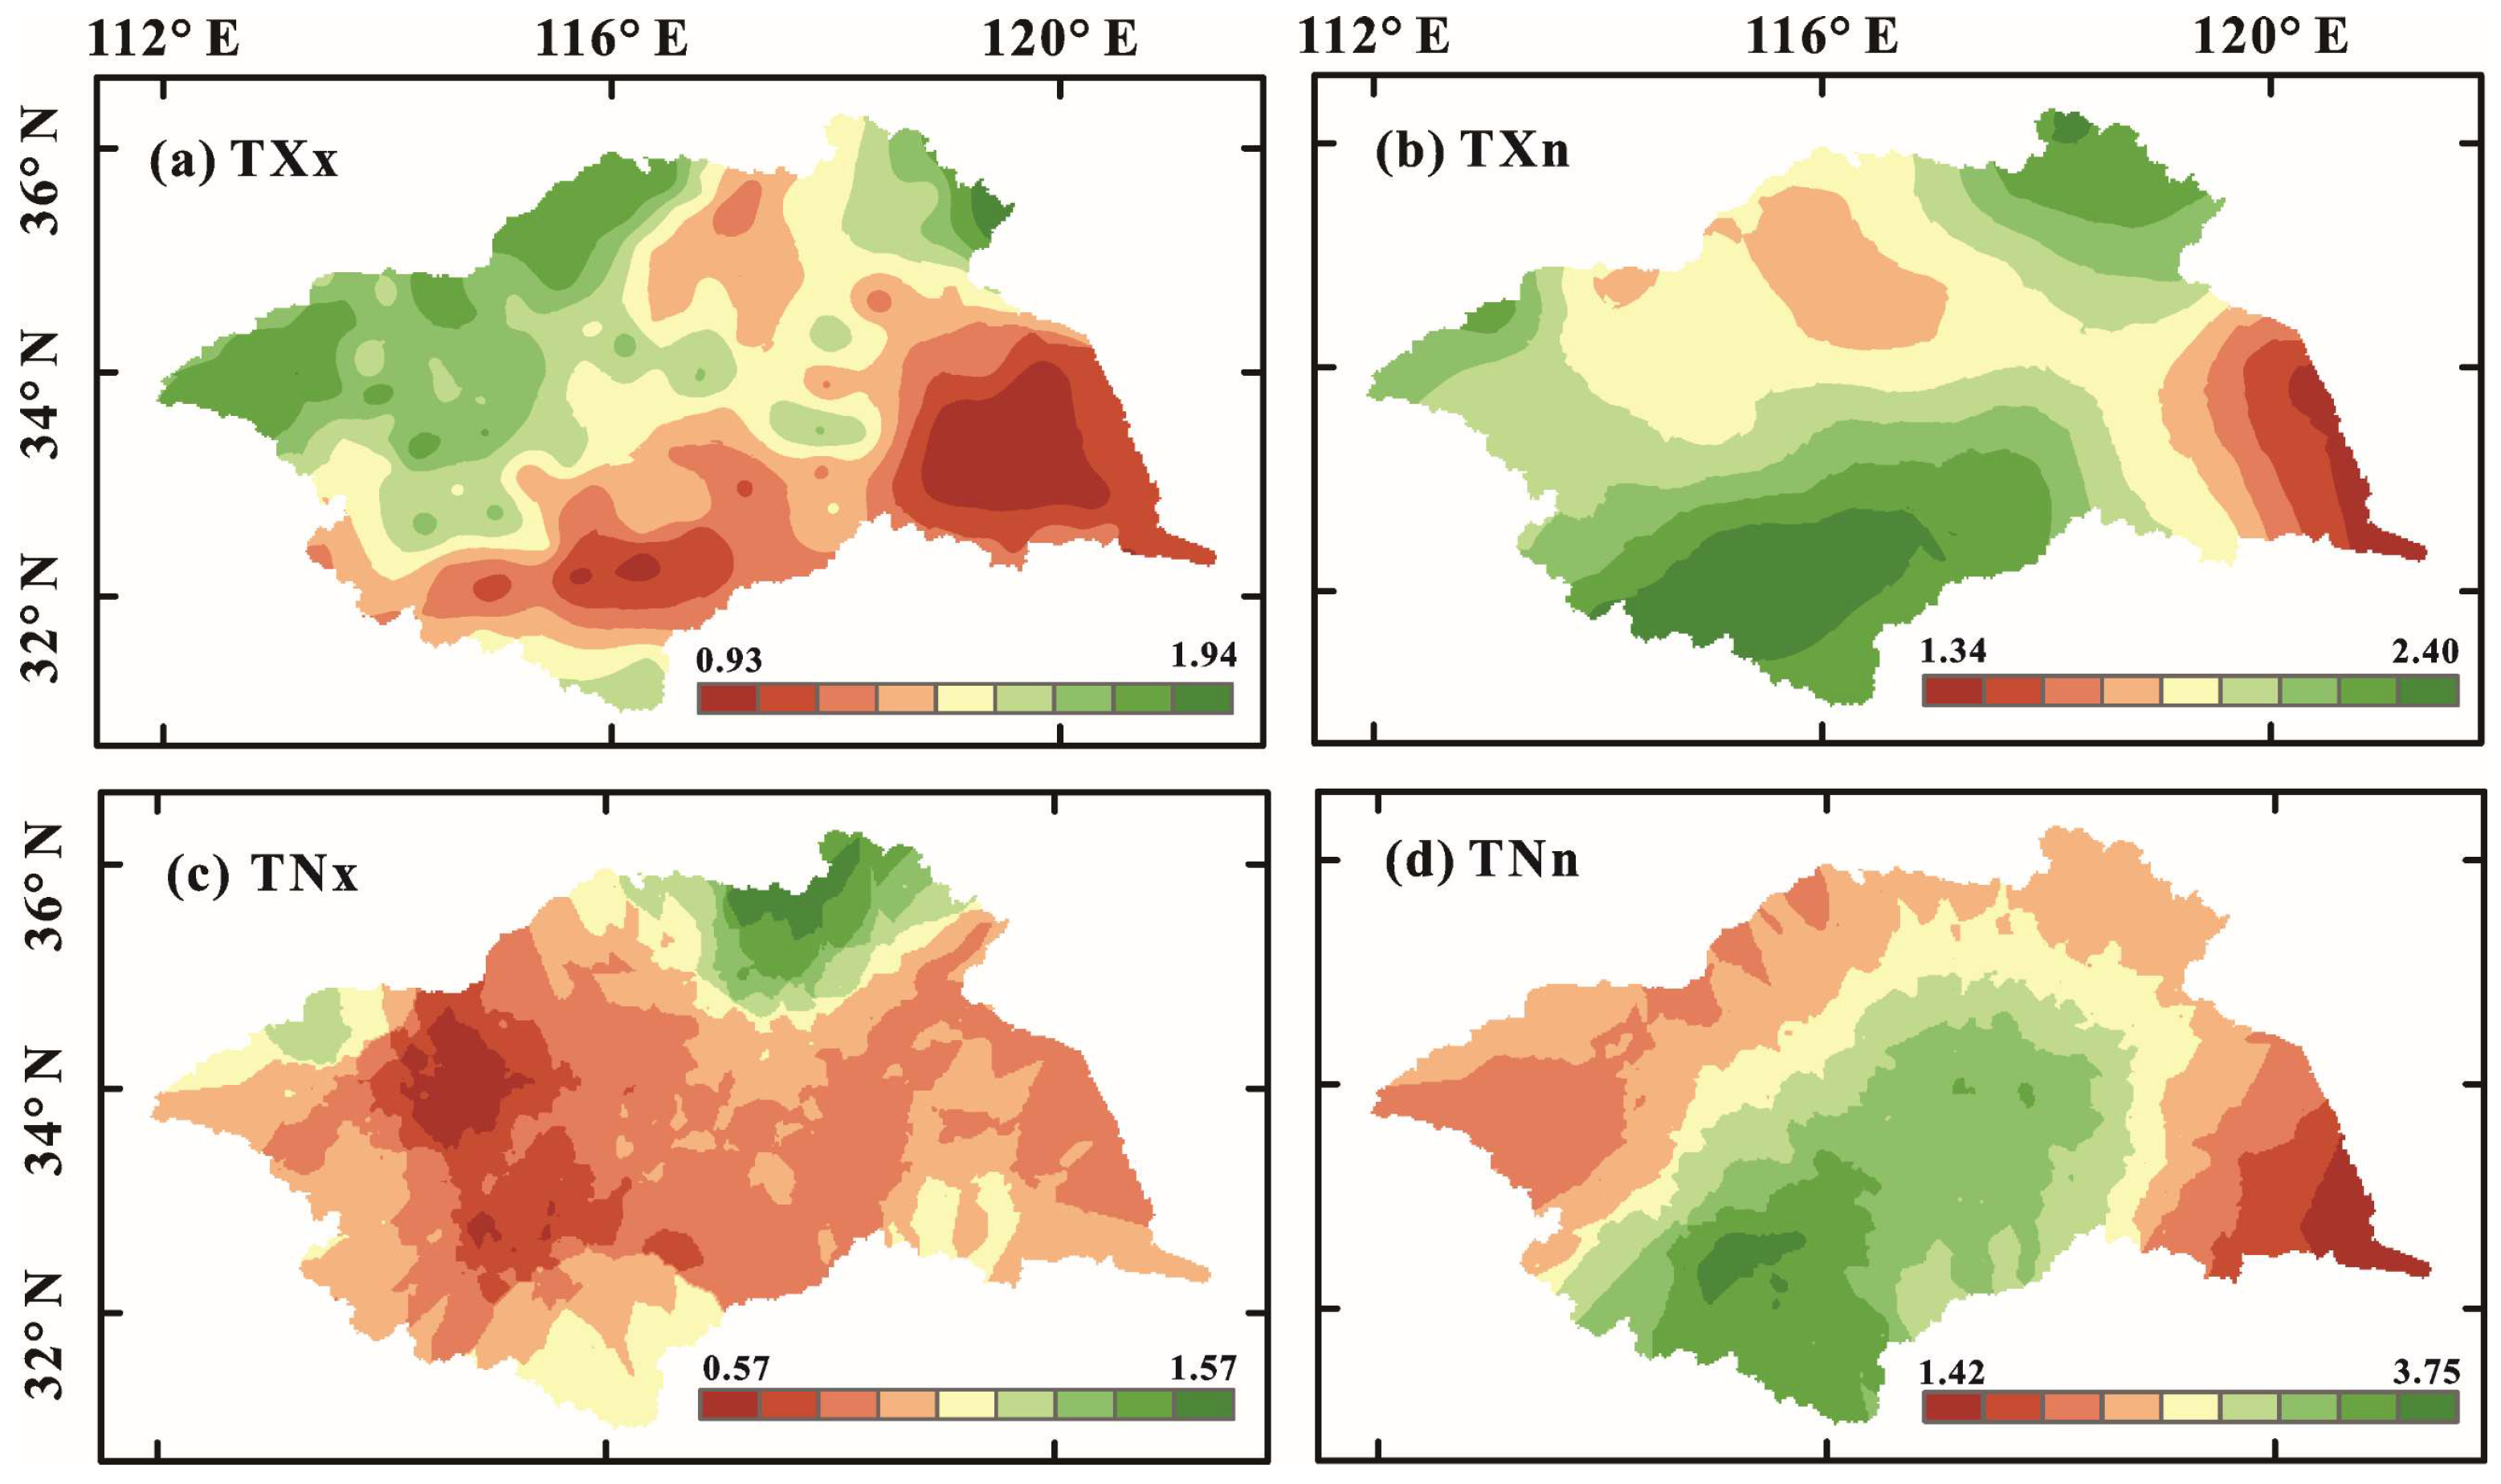
- Extreme indices (TXx, TNx, TXn, and TNn) have shown generally increasing tendencies, while a widespread increase could also be detected in TNx and TNn, with the largest increasing magnitudes of 0.4 °C per decade and 1.3 °C per decade, respectively. The minimum air temperature regimes have had a larger increasing magnitude than the maximum air temperature.
- (2)
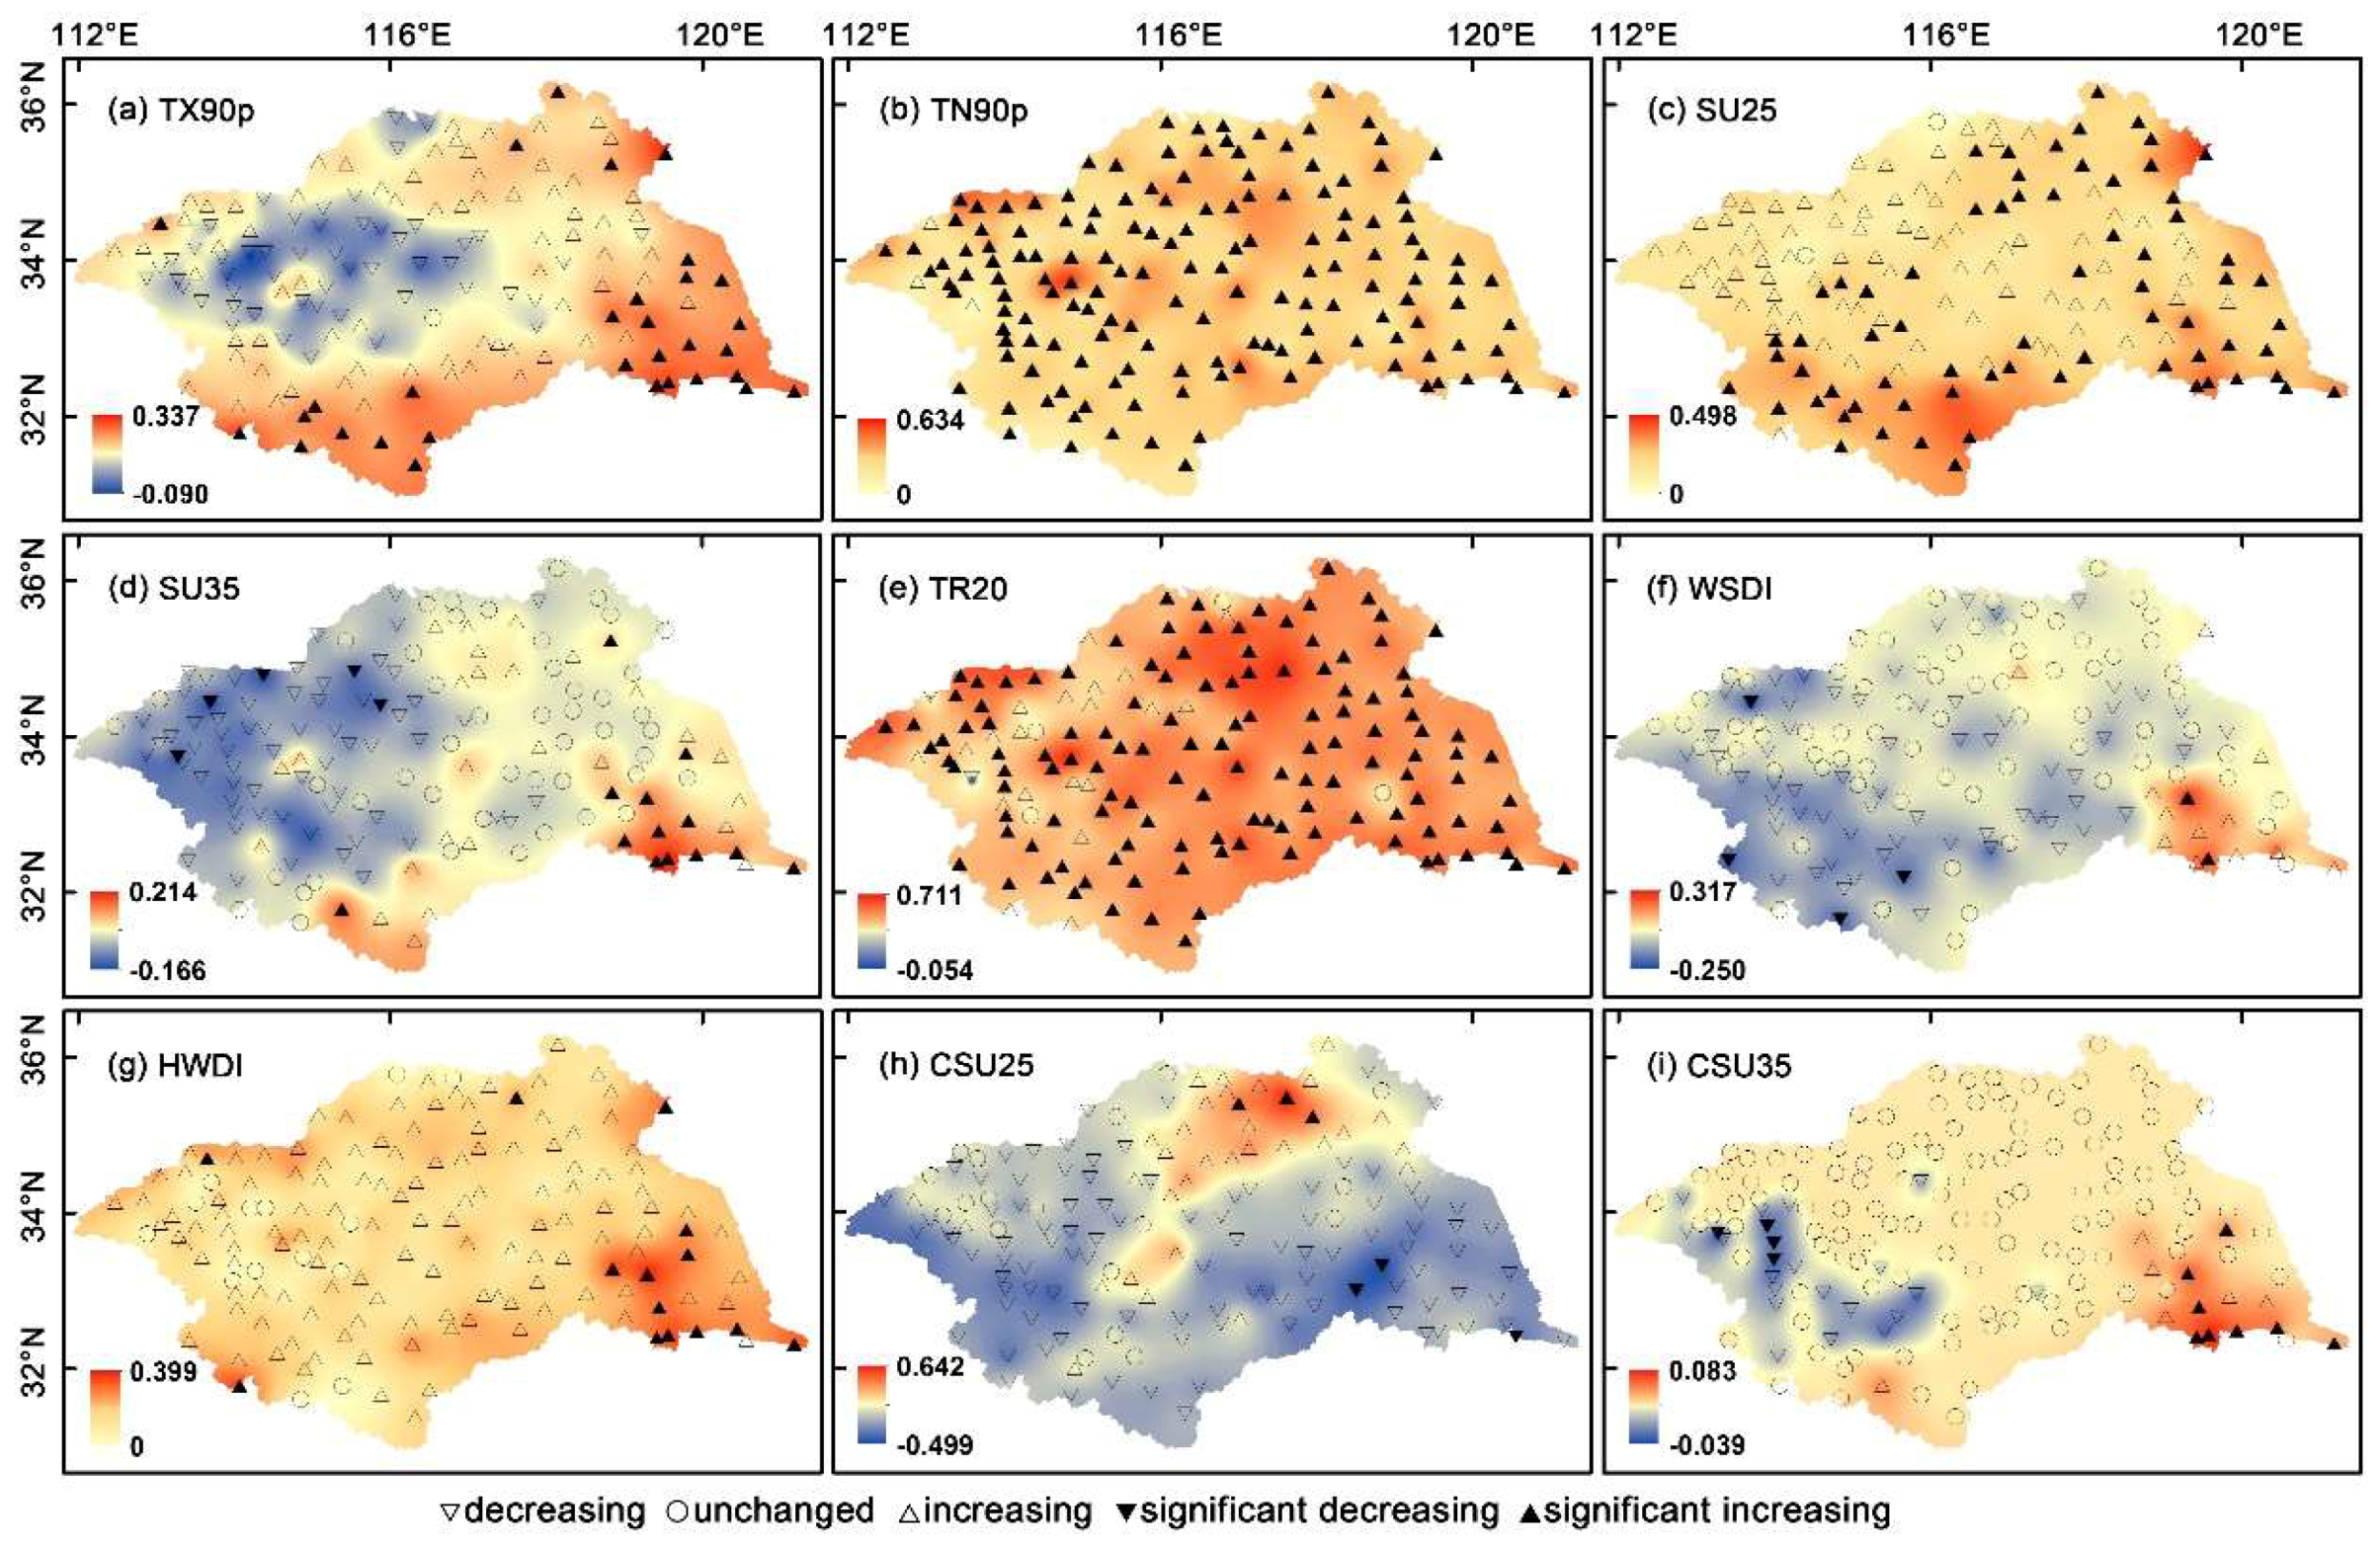
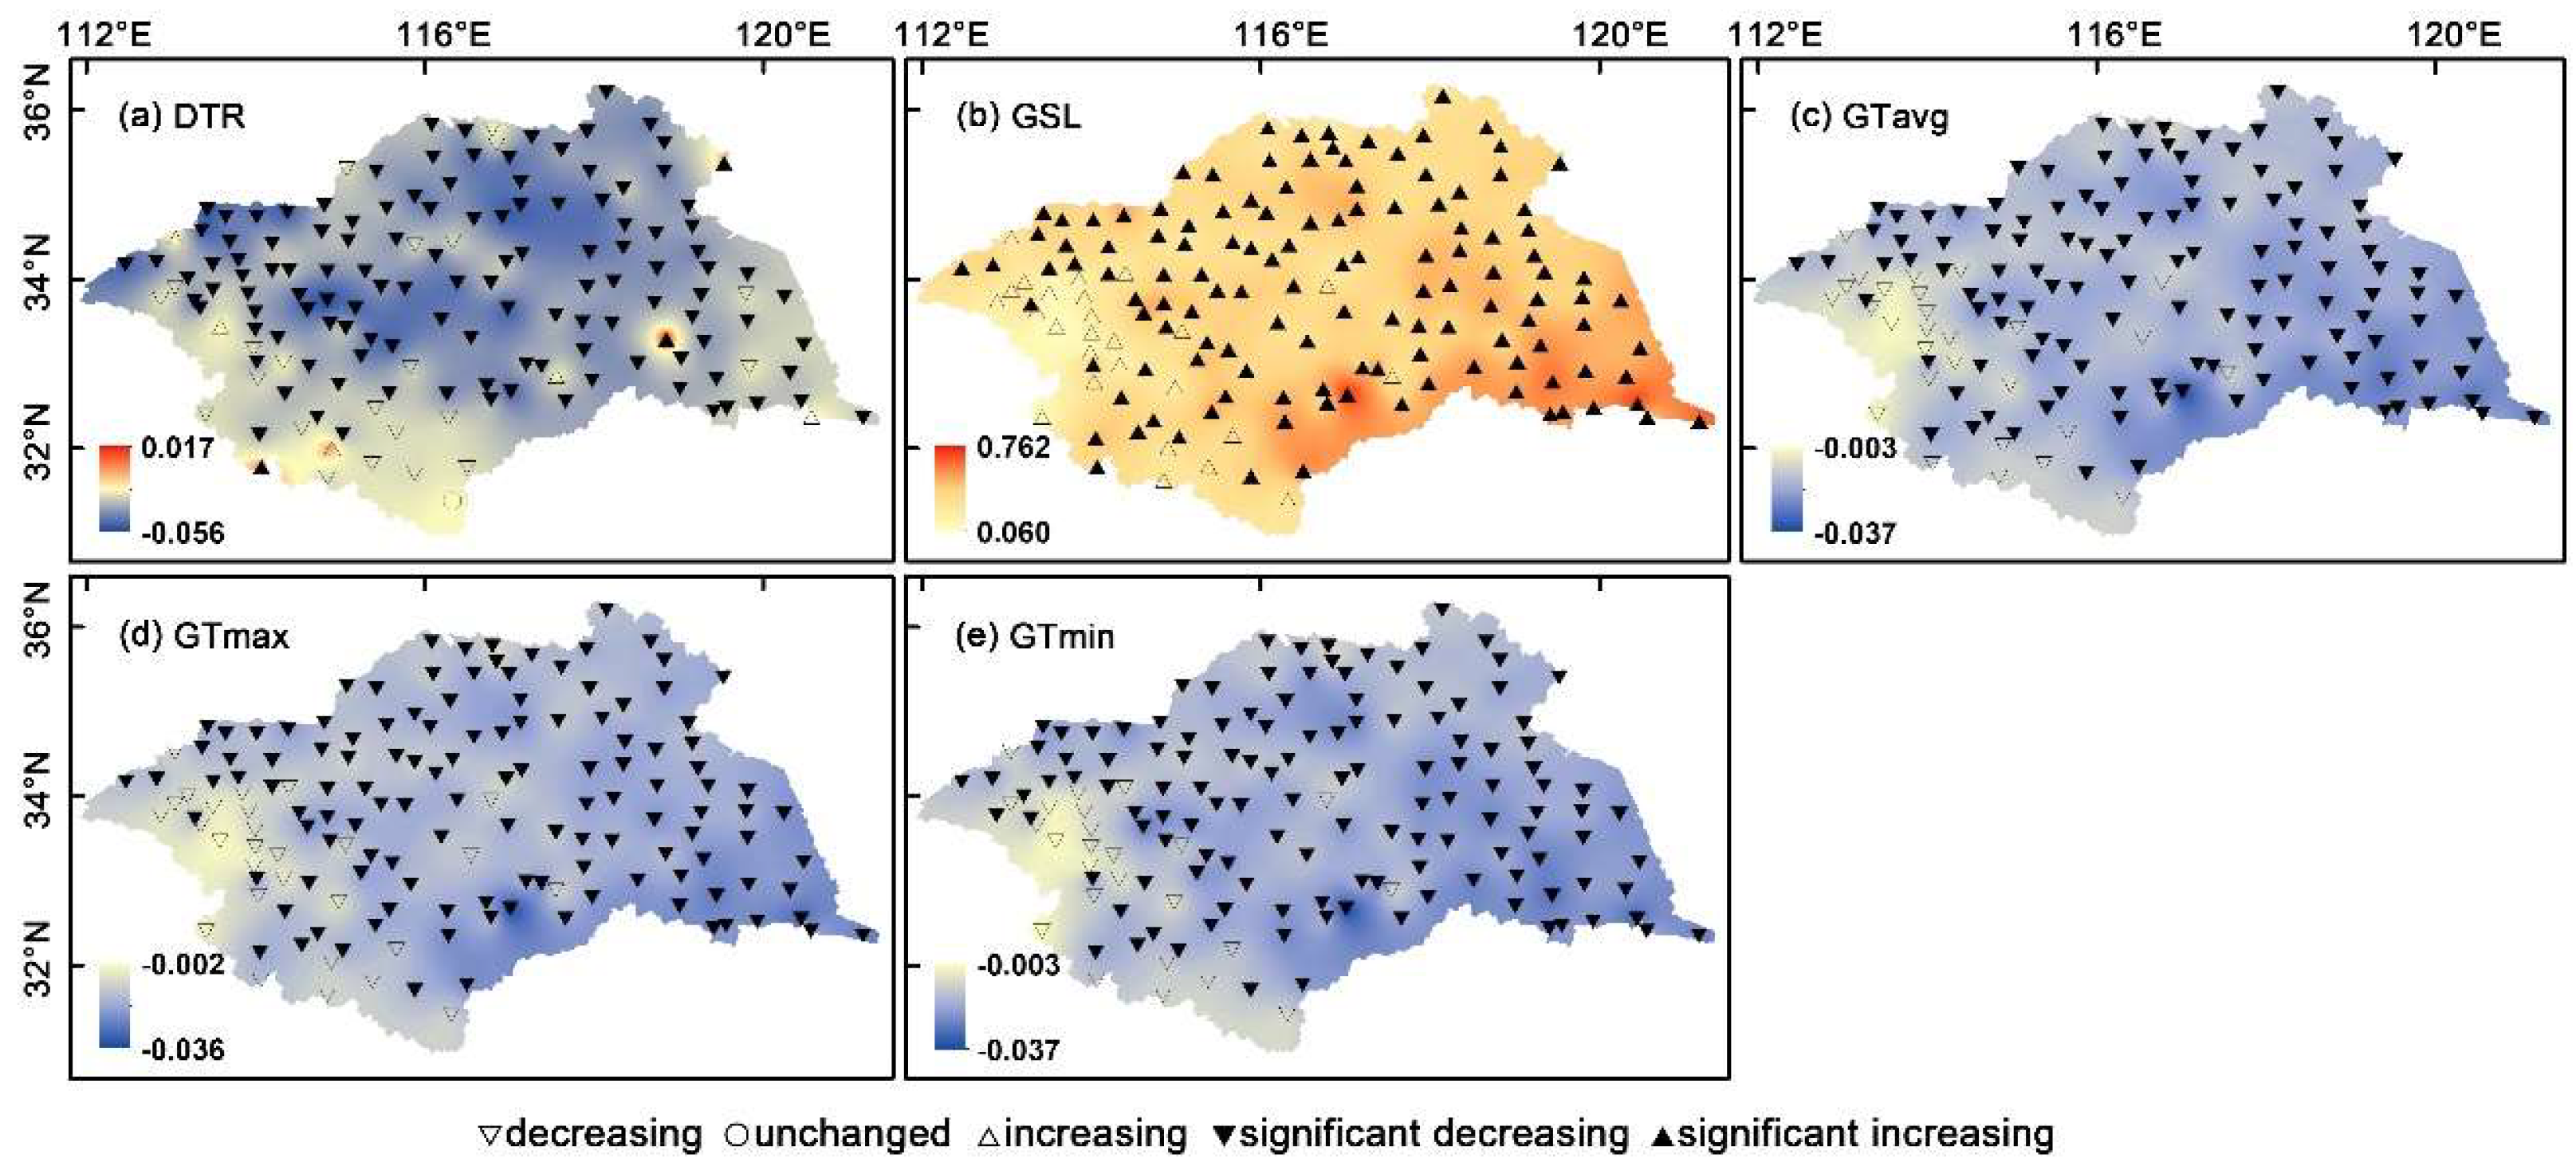
- The extreme maximum temperature indices showed increasing trends, and the significantly increasing trends in TN90p and TR20 were greater in magnitude than those related to the other extreme maximum temperature indices. Meanwhile, the extreme minimum temperature indices showed significant decreasing trends. The increasing trends of the extreme maximum temperature indices, and the decreasing trend of the extreme minimum temperature indices caused the GSL to increase. Although an increasing GSL is beneficial for increasing the growth time of crops, the decreasing extreme minimum temperature and increasing extreme maximum temperature may reduce the winter wheat yield. The remarkable increase in the minimum temperature and decrease of cold days, and hence the lengthening of the growing season, may imply shifting agricultural activities in terms of plant timing and crop types.
- (3)
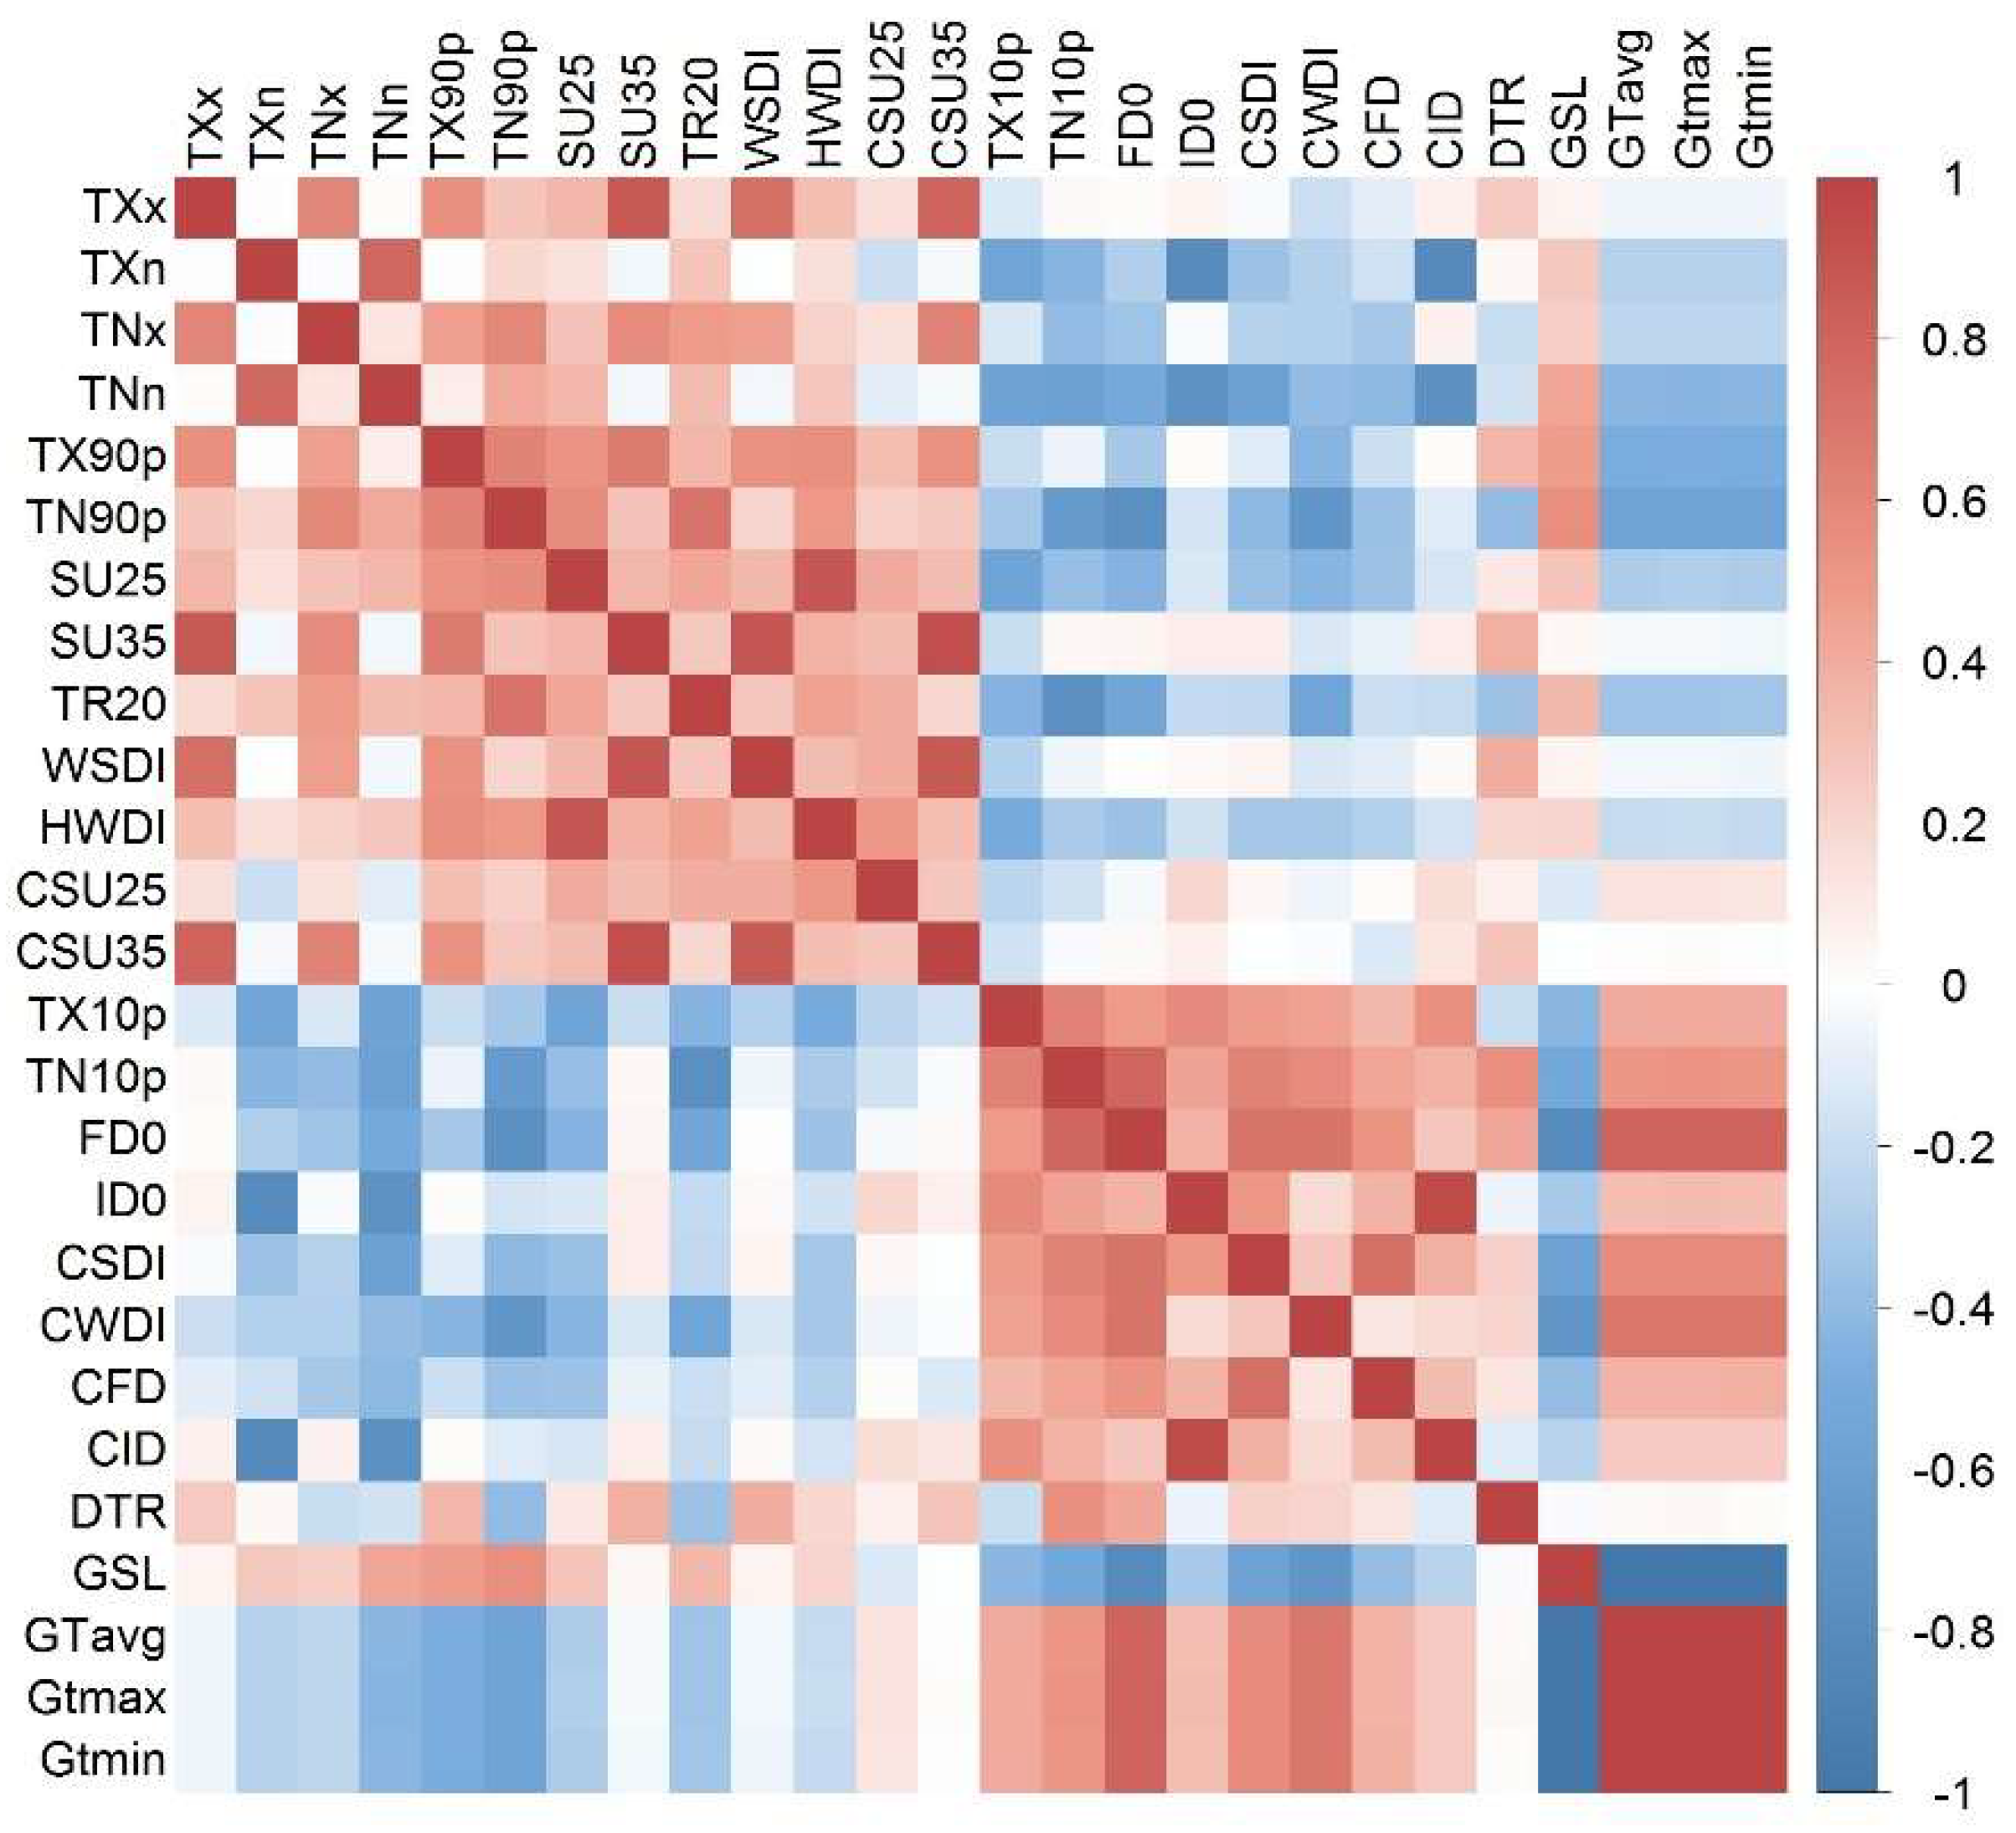
- The magnitude of trends regarding extreme minimum temperatures was larger than that regarding extreme maximum temperatures. The changing magnitude of the night-time temperature indices was larger than that of the daytime periods. The changing magnitude and significance of the extreme temperature indices in the eastern Huai River Basin were larger than those of the western Huai River Basin. Meanwhile, the extreme maximum temperature in the southeastern Huai River Basin was larger than that of the other regions of the Huai River Basin. This difference could be attributed to urban heating effects across the Yangtze Delta region, where urban aggregation is dominant. With the exception of CSU25, other extreme maximum temperature indices showed significant increasing trends in most of regions in the southeastern Huai River Basin, which should be attributed to the booming socioeconomic development in the southeastern Huai River Basin. Besides, fast urbanization and related urban heat island effects have also increased the extreme maximum temperature indices components. In addition, correlations amongst the extreme minimum temperatures were relatively higher than those amongst the extreme maximum temperature indices. Most of the extreme temperature indices showed close relationships to altitude and latitude. Latitude had the largest impacts on the extreme temperature, followed by altitude. Specifically, the GSL showed negative relations with altitude, and negative correlations could also be detected between longitude and the extreme minimum temperature. There were less days with extreme minimum temperatures in the eastern Huai River Basin than in the western Huai River Basin, which could be attributed to the higher temperature in the seaward regions than in the landward regions. A decrease in the extreme minimum temperature indices could also be detected in the western Huai River Basin; however, this decrease was not significant. This decrease did not significantly lengthen the GSL, since ID0 and CID both cause damage or death for crops, and thus great damage to agricultural production. The higher the altitude, the higher the probability of extreme minimum temperature indices (ID0 and CID), which have a great impact on agricultural activities and planting policies. Similar changing properties of the extreme temperature indices can be identified over the globe when compared with those across the Huai River Basin, China; these similarities indicate that warming processes in the Huai River Basin are indicative of greater global warming trends.
Acknowledgments
Author Contributions
Conflicts of Interest
References
- Fearnside, M.P. Forests and global warming mitigation in Brazil: Opportunities in the Brazilian forest sector for responses to global warming under the “clean development mechanism”. Biomass Bioenergy 1999, 16, 171–189. [Google Scholar] [CrossRef]
- Cox, P.M.; Betts, R.A.; Jones, C.D.; Spall, S.A.; Totterdell, I.J. Acceleration of global warming due to carbon-cycle feedbacks in a coupled climate model. Nature 2008, 408, 184–187. [Google Scholar] [CrossRef] [PubMed]
- Kurane, I. The effect of global warming on infectious diseases. Publ. Health Res Perspect. 2000, 1, 4–9. [Google Scholar] [CrossRef] [PubMed]
- Zhang, Q.; Li, J.; Singh, V.P.; Xiao, M.Z. Spatio-temporal relations between temperature and precipitation regimes: Implications for temperature-induced changes in the hydrological cycle. Glob. Planet. Chang. 2013, 111, 57–76. [Google Scholar] [CrossRef]
- Sterl, A.; Severijins, C.; Dijkstra, H.; Hazeleger, W.; Oldenborgh, G.J.; Broeke, M.V.; Burgers, G. When can we expect extremely high surface temperature? Geophys. Res Lett. 2008, 35, L14703. [Google Scholar] [CrossRef]
- Min, E.; Hazelege, W.; Oldenborgh, G.J.; Sterl, A. Evaluation of trends in high temperature extremes in north-western Europe in regional climate models. Environ. Res. Lett. 2013, 8, 014011. [Google Scholar] [CrossRef]
- Easterling, D.; Meehl, G.A.; Parmeasn, C.; Changnon, S.A.; Karl, T.R.; Mearns, L.O. Climate extremes: Observations, modeling, and impacts. Science 2000, 289. [Google Scholar] [CrossRef]
- Vincent, L.A.; Peterson, T.C.; Barros, V.R.; Marino, M.B.; Rusticucci, M.; Carrasco, G.; Ramirez, E.; Alves, L.M.; Ambrizzi, T.; Berlato, M.A.; et al. Observed trends in indices of daily temperature extremes in South America 1960–2000. J. Clim. 2005, 18, 5011–5023. [Google Scholar] [CrossRef]
- Alexander, L.V.; Zhang, X.; Peterson, T.C.; Caesar, J.; Gleason, B.; Klein Tank, A.M.; Haylock, M.; Collins, D.; Trewin, B.; Rahimzadeh, F.; et al. Global observed changes in daily climate extremes of temperature and precipitation. J. Geophys. Res. 2006, 111, D05109. [Google Scholar] [CrossRef]
- Lau, N.-C.; Nath, M.J. A model study of heat waves over North America: Meteorological aspects and projections for the twentyfirst century. J. Clim. 2012, 25, 4761–4784. [Google Scholar] [CrossRef]
- Chen, Y.D.; Li, J.; Zhang, Q. Changes in site-scale temperature extremes over China during 2071–2100 in CMIP5 simulations. J. Geophys. Res. Atmos. 2016, 121, 2732–2749. [Google Scholar] [CrossRef]
- Zhang, Q.; Li, J.; Chen, Y.D.; Chen, X. Observed changes of temperature extremes during 1960-2005 in China: Natural or human-induced variations? Theor. Appl. Climatol. 2011, 106, 417–431. [Google Scholar] [CrossRef]
- Hansen, J.; Sato, M.; Ruedy, R.; Lo, K.; Lea, D.W.; Medina-Elizade, M. Global temperature change. Proc. Natl. Acad. Sci. USA 2006, 103, 14288–14293. [Google Scholar] [CrossRef] [PubMed]
- Mann, M.E.; Gille, E.; Bradley, R.S.; Hughes, M.K.; Overpeck, J.; Keimig, F.T.; Gross, W. Global temperature patterns in past centuries: An interactive presentation. Earth Interact. 2000, 4, 1–29. [Google Scholar] [CrossRef]
- Cao, L.J.; Zhao, P.; Yan, Z.; Jones, P.; Zhu, Y.; Yu, Y.; Tang, G. Instrumental temperature series in eastern and central China back to the nineteenth century. J. Geophys. Res. Atmos. 2013, 118, 8197–8207. [Google Scholar] [CrossRef]
- Christidis, N.; Stott, P.A.; Brown, S.; Hegerl, G.C.; Caesar, J. Detection of changes in temperature extremes during the second half of the 20th century. Geophys. Res. Lett. 2005, 32, 242–257. [Google Scholar] [CrossRef]
- Christidis, N.; Stott, P.A. Attribution analyses of temperature extremes using a set of 16 indices. Weather Clim. Extremes 2016, 14, 24–35. [Google Scholar] [CrossRef]
- Dashkhuu, D.; Kim, J.P.; Chun, J.A.; Lee, W.-S. Long-term trends in daily temperature extremes over Mongolia. Weather Clim. Extremes 2015, 8, 26–33. [Google Scholar] [CrossRef]
- Ruml, M.; Gregorić, E.; Vujadinović, M.; Radovanović, S.; Matović, G.; Vuković, A.; Počuča, V.; Stojičić, D. Observed changes of temperature extremes in Serbia over the period 1961-2010. Atmos. Res. 2017, 183, 26–41. [Google Scholar] [CrossRef]
- Lin-Ye, J.; García-León, M.; Gràcia, V.; Ortego, M.I.; Stanica, A.; Sánchez-Arcilla, A. Multivariate Hybrid Modelling of Future Wave-Storms at the Northwestern Black Sea. Water 2018, 10, 221. [Google Scholar] [CrossRef]
- Zhang, Q.; Zheng, Y.; Singh, V.P.; Luo, M.; Xie, Z. Summer extreme precipitation in eastern China: Mechanisms and impacts. J. Geographys. Res. 2017, 122, 2766–2778. [Google Scholar] [CrossRef]
- Zhou, D.; Zhao, S.; Liu, S.; Zhang, L.; Zhu, C. Surface urban heat island in China’s 32 major cities: Spatial patterns and drivers. Remote Sens. Environ. 2014, 152, 51–61. [Google Scholar] [CrossRef]
- Zhou, D.; Zhao, S.; Zhang, L.; Sun, G.; Liu, Y. The footprint of urban heat island effect in China. Sci. Rep. 2015, 5, 11160. [Google Scholar] [CrossRef] [PubMed]
- Zhang, Q.; Sun, P.; Singh, V.P.; Chen, X. Spatial-temporal precipitation changes (1956–2000) and their implications for agriculture in China. Glob. Planet. Chang. 2012, 82–83, 86–95. [Google Scholar] [CrossRef]
- Sun, P.; Zhang, Q.; Wen, Q.Z.; Singh, V.P.; Shi, P.J. Multisource data based integrated agricultural drought monitoring in the Huai River basin, China. J. Geophys. Res. 2017. [Google Scholar] [CrossRef]
- Fang, S.; Jia, R.; Tu, W.; Sun, Z. Assessing Factors Driving the Change of Irrigation Water-Use Efficiency in China Based on Geographical Feature. Water 2017, 9, 759. [Google Scholar] [CrossRef]
- Zhu, Y.; Wang, H.; Zhou, W.; Ma, J. Recent changes in the summer precipitation pattern in Eastern China and the background circulation. Clim. Dyn. 2011, 36, 1463–1473. [Google Scholar] [CrossRef]
- The Huaihe River Commission of the Ministry of Water Resources, P.R.C. Introduction: Huaihe River Basin. 2008. Available online: http://www.hrc.gov.cn/lyjs.jhtml (accessed on 11 March 2018).
- Sun, P.; Sun, Y.Y.; Zhang, Q.; Shi, P.J.; Wen, Q.Z. Temporal and spatial variation characteristic of runoff processes and its cause in Huaihe Basin. J. Lake Sci. 2018, 30, 497–508. [Google Scholar]
- Wang, L.; Yuan, X.; Xie, Z.; Wu, P.; Li, Y. Increasing flash droughts over China during the recent global warming hiatus. Sci. Rep. 2016, 6, 30571. [Google Scholar] [CrossRef] [PubMed]
- Ci, H.; Zhang, Q.; Singh, V.P.; Xiao, M.; Liu, L. Spatiotemporal properties of growing season indices during 1961–2010 and possible association with agroclimatological regionalization of dominant crops in Xinjiang, China. Meteorol. Atmos. Phys. 2016, 128, 513–524. [Google Scholar] [CrossRef]
- Xiao, M.Z.; Zhang, Q.; Singh, V.P.; Chen, X.H. Probabilistic forecasting of seasonal drought behaviors in the Huai River basin, China. Theor. Appl. Climatol. 2017, 128, 667–677. [Google Scholar] [CrossRef]
- Zhou, T.; Wang, F.; Yang, Z. Comparative Analysis of ANN and SVM Models Combined with Wavelet Preprocess for Groundwater Depth Prediction. Water 2017, 9, 781. [Google Scholar] [CrossRef]
- Li, M.; Chu, R.; Shen, S.; Islam, A.R.M.T. Quantifying Climatic Impact on Reference Evapotranspiration Trends in the Huai River Basin of Eastern China. Water 2018, 10, 144. [Google Scholar] [CrossRef]
- Ma, F.; Yuan, X.; Ye, A. Seasonal drought predictability and forecast skill over China. J. Geophys. Res. 2015, 120, 8264–8275. [Google Scholar] [CrossRef]
- Zhang, Q.; Singh, V.P.; Li, J.; Chen, X. Analysis of the periods of maximum consecutive wet days in China. J. Geophys. Res. 2011, 116, D23106. [Google Scholar] [CrossRef]
- Sen, P.K. Estimates of the regression coefficient based on Kendall’s tau. J. Am. Stat. Assoc. 1968, 63, 1379–1389. [Google Scholar] [CrossRef]
- Gocic, M.; Trajkovic, S. Analysis of changes in meteorological variables using Mann-Kendall and Sen’s slope estimator statistical tests in Serbia. Glob. Planet. 2013, 100, 172–182. [Google Scholar] [CrossRef]
- Kahya, E.; Kalayc, I.S. Trend analysis of streamflow in Turkey. J. Hydrol. 2004, 289, 128–144. [Google Scholar] [CrossRef]
- Gerstengarbe, F.W.; Werner, P.C. Estimation of the beginning and end of recurrent events within a climate regime. Clim. Res. 1999, 11, 97–107. [Google Scholar] [CrossRef]
- Zhang, Q.; Sun, P.; Jiang, T.; Tu, X.; Chen, X. Spatio-temporal patterns of hydrological processes and their responses to human activities in the Poyang Lake basin, China. Hydrol. Sci. J. 2011, 56, 305–318. [Google Scholar] [CrossRef]
- Karl, T.R.; Janes, P.D.; Knight, R.W.; Kukla, J.; Plummer, N.; Razuvayev, V.; Gallo, K.P.; Lindesay, J.; Charlson, R.J.; Peterson, T.C. A symmetric trends of daily maximum and minimum temperatures: Empirical evidence and possible causes. Bull. Am. Math. Soc. 1993, 74, 1007–1023. [Google Scholar] [CrossRef]
- Zhang, Q.; Xu, C.-Y.; Zhang, Z.X.; Ren, G.Y. Climate change or variability? The case of Yellow river as indicated by extreme maximum and minimum air temperature during 1960–2004. Theor. Appl. Climatol. 2008, 93, 35–43. [Google Scholar] [CrossRef]
- Zhang, G.; Liu, X.; Wang, Y.; Luo, C.; Jiao, G.; Wang, C.; Yang, D. Response of Winter Wheat to Temperature Warming in Northern Regions of Henan Province. Chin. Agric. Sci. Bull. 2011, 27, 234–239. [Google Scholar]
- Andrews, E.D.; Antweiler, R.C.; Neiman, P.J.; Ralph, F.M. Influence of ENSO on Flood Frequency along the California Coast. J. Clim. 2004, 17, 337–348. [Google Scholar] [CrossRef]
- Ashok, K.; Behera, S.; Rao, A.S.; Weng, H.Y.; Yamagata, T. El Niño Modoki and its possible teleconnection. J. Geophys. Res. 2007, 112, C11007. [Google Scholar] [CrossRef]
- Su, J.; Wen, M.; Ding, Y.; Gao, Y.; Song, Y. Hiatus of Global Warming: A Review. Chin. J. Atmos. Sci. 2016, 40, 1143–1153. [Google Scholar] [CrossRef]
- Qin, D. Climate change science and sustainable development. Prog. Geogr. 2014, 33, 874–883. [Google Scholar]
- Yan, D.; Xu, T.; Girma, A.; Yuan, Z.; Weng, B.; Qin, T.; Do, P.; Yuan, Y. Regional Correlation between Precipitation and Vegetation in the Huang-Huai-Hai River Basin, China. Water 2017, 9, 557. [Google Scholar] [CrossRef]
- Chen, J.; Xia, J.; Zhao, Z.; Hong, S.; Liu, H.; Zhao, F. Using the RESC model and diversity indexes to assess the cross-scale water resource vulnerability and spatial heterogeneity in the Huai River Basin, China. Water 2016, 8, 431. [Google Scholar] [CrossRef]


| Categories | Abbreviation | Indices | Definitions | Unit |
|---|---|---|---|---|
| Extreme indices | TXx | The highest temperature of the maximum temperature series | The highest temperature of the daily and monthly maximum temperature | °C |
| TXn | The lowest temperature of the maximum temperature series | The lowest temperature of the daily and monthly maximum temperature | °C | |
| TNx | The highest temperature of the minimum temperature series | The highest temperature of the daily and monthly minimum temperature | °C | |
| TNn | The lowest temperature of the minimum temperature series | The lowest temperature of the daily and monthly minimum temperature | °C | |
| Extreme maximum temperature indices | TX90p | Number of warm days | Number of days with annual maximum temperature >90th percentile | d |
| TN90p | Number of days with warm nights | Number of days with annual minimum temperature >90th percentile | d | |
| SU25 | Number of summer days | Days with annual maximum temperature >25 °C | d | |
| SU35 | Number of heat days | Days with annual maximum temperature >35 °C | d | |
| TR20 | Number of days with heat nights | Days with annual minimum temperature >20 °C | d | |
| WSDI | Consecutive warm days | At least six consecutive days with daily maximum temperatures >90th percentile | d | |
| HWDI | Heat wave days | At least six consecutive days with daily maximum temperatures 5 °C higher than average maximum temperature | d | |
| CSU25 | Consecutive summer days | Consecutive days with temperature >25 °C | d | |
| CSU35 | Consecutive heat days | Consecutive days with temperature >35 °C | d | |
| Extreme minimum temperature indices | TX10p | Number of cold days | Number of days with maximum temperature <10th percentile | d |
| TN10p | Number of days with cold nights | Number of days with minimum temperature <10th percentile | d | |
| FD0 | Freezing days | Number of days with minimum temperature <0 °C | d | |
| ID0 | Icy days | Number of days with maximum temperature <0 °C | d | |
| CSDI | Consecutive cold days | At least six consecutive days with daily minimum temperature <10th percentile | d | |
| CWDI | Consecutive cool days | At least six consecutive days with daily minimum temperature 5 °C lower than average minimum temperature | d | |
| CFD | Consecutive freezing days | The largest consecutive days with minimum temperature <0 °C | d | |
| CID | Consecutive icy days | The largest consecutive days with maximum temperature <0 °C | d | |
| Other indices | DTR | Day temperature range | Difference between daily maximum and minimum temperature | °C |
| GSL | Growing season length | Length of consecutive days with daily temperature >5 °C | d | |
| GTavg | Average temperature during growing season | Average temperature during growing season | °C | |
| GTmax | Average maximum temperature during growing season | Average maximum temperature during growing season | °C | |
| GTmin | Average minimum temperature during growing season | Average minimum temperature during growing season | °C |
| TI | Percentage | NSU | NU | NSD | ND | NT | TI | Percentage | NSU | NU | NSD | ND | NT |
|---|---|---|---|---|---|---|---|---|---|---|---|---|---|
| TXx | 9.80% | 14 | 69 | 1 | 66 | 18 | TX10p | 43.14% | 0 | 1 | 66 | 152 | 0 |
| TXn | 29.41% | 45 | 153 | 0 | 0 | 0 | TN10p | 93.46% | 0 | 0 | 143 | 153 | 0 |
| TNx | 63.40% | 97 | 142 | 0 | 1 | 10 | FD0 | 96.73% | 0 | 0 | 148 | 152 | 1 |
| TNn | 79.74% | 122 | 151 | 0 | 2 | 0 | ID0 | 30.07% | 0 | 0 | 46 | 89 | 65 |
| TX90p | 20.26% | 31 | 101 | 0 | 51 | 1 | CSDI | 91.50% | 0 | 0 | 140 | 152 | 1 |
| TN90p | 98.04% | 150 | 153 | 0 | 0 | 0 | CWDI | 90.20% | 0 | 0 | 138 | 152 | 1 |
| SU25 | 44.44% | 68 | 153 | 0 | 0 | 2 | CFD | 84.31% | 0 | 0 | 129 | 151 | 2 |
| SU35 | 11.76% | 13 | 39 | 5 | 67 | 47 | CID | 3.92% | 0 | 0 | 6 | 10 | 143 |
| TR20 | 83.01% | 127 | 147 | 0 | 2 | 4 | DTR | 81.70% | 2 | 8 | 123 | 144 | 1 |
| WSDI | 3.92% | 2 | 14 | 4 | 66 | 73 | GSL | 83.01% | 127 | 153 | 0 | 0 | 0 |
| HWDI | 9.15% | 14 | 139 | 0 | 0 | 14 | GTavg | 81.70% | 0 | 0 | 125 | 153 | 0 |
| CSU25 | 3.92% | 3 | 34 | 3 | 101 | 18 | Gtmax | 81.70% | 0 | 0 | 125 | 153 | 0 |
| CSU35 | 7.84% | 8 | 14 | 4 | 23 | 116 | Gtmin | 83.66% | 0 | 0 | 128 | 153 | 0 |
| Categories | Extreme Temperature Indices | Lat. | Lon. | Alt. | Categories | Extreme Temperature Indices | Lat. | Lon. | Alt. |
|---|---|---|---|---|---|---|---|---|---|
| Extreme indices | TXx | 0.27 ** | −0.64 ** | −0.13 | Extreme minimum temperature indices | TX10p | −0.37 ** | −0.51 ** | 0.18 * |
| TXn | −0.13 | 0.31 ** | −0.64 ** | TN10p | −0.09 | 0.15 | 0.04 | ||
| TNx | −0.41 ** | 0.18 * | −0.42 ** | FD0 | 0.92 ** | −0.12 | 0.29 ** | ||
| TNn | −0.21 * | 0.01 | 0.03 | ID0 | 0.44 ** | −0.18 * | 0.87 ** | ||
| Extreme maximum temperature indices | TX90p | −0.48 ** | −0.35 ** | −0.06 | CSDI | 0.07 | −0.10 | 0.10 | |
| TN90p | 0.11 | −0.12 | −0.01 | CWDI | 0.62 ** | −0.07 | −0.38 ** | ||
| SU25 | −0.09 | −0.34 ** | −0.64 ** | CFD | 0.91 ** | −0.24 ** | 0.31 ** | ||
| SU35 | −0.28 ** | −0.73 ** | −0.14 | CID | 0.50 ** | −0.29 ** | 0.83 ** | ||
| TR20 | −0.74 ** | 0.20 * | −0.58 ** | Other indices | DTR | 0.58 ** | −0.49 ** | −0.09 | |
| WSDI | −0.72 ** | 0.50 ** | −0.35 ** | GSL | −0.92 ** | −0.02 | −0.32 ** | ||
| HWDI | 0.88 ** | 0.02 | −0.05 | GTavg | 0.10 | −0.36 ** | −0.61 ** | ||
| CSU25 | −0.01 | 0.15 | −0.80 ** | Gtmax | 0.28 ** | −0.47 ** | −0.43 ** | ||
| CSU35 | −0.53 ** | −0.46 ** | −0.30 ** | Gtmin | −0.33 ** | 0.12 | −0.45 ** |
| Categories | Extreme Temperature Indices | China | Other Countries | |||||||||||
|---|---|---|---|---|---|---|---|---|---|---|---|---|---|---|
| HR | YR | QL | PR | YLR | XJ | MC | MG | SB | IT | KY | US | GL | ||
| Extreme indices | TXx | ○ | ↗ | ↗ | ↗ | ↗ | ○ | ↗ | ↗ | ↗ | — | — | ↗ | ↗ |
| TXn | ↗ | ↗ | ↗ | ○ | ↗ | ○ | ↗ | ↘ | ↗ | — | — | ↗ | ↗ | |
| TNx | ↗ | ↗ | ↗ | ↗ | ↗ | ○ | ↗ | ↗ | ↗ | — | — | ↗ | ↗ | |
| TNn | ↗ | ↗ | ↗ | ↗ | ↗ | ○ | ↗ | ↗ | ↗ | — | ↗ | ↗ | ↗ | |
| Extreme maximum temperature indices | TX90p | ↗ | ↗ | ↗ | ↗ | ↗ | ↗ | ↗ | ↗ | ↗ | ↗ | ↗ | ↗ | ↗ |
| TN90p | ↗ | ↗ | ↗ | ↗ | ↗ | ↗ | ↗ | ↗ | ↗ | ↗ | ↗ | ↗ | ↗ | |
| SU25 | ↗ | ↗ | ↗ | ↗ | — | ↗ | ↗ | ↗ | ↗ | ↗ | ↗ | ↗ | ↗ | |
| TR20 | ↗ | ↗ | ↗ | ↗ | — | ↗ | ↗ | ↗ | ↗ | ↗ | — | ↗ | ↗ | |
| WSDI | ○ | ↗ | ↗ | ↗ | ↗ | ↗ | ↗ | — | ↗ | ↗ | ↗ | — | ↗ | |
| Extreme minimum temperature indices | TX10p | ↘ | ↘ | ↘ | ○ | ↘ | ↘ | ↘ | ↘ | ↘ | ↘ | ↗ | ↘ | ↘ |
| TN10p | ↘ | ↘ | ↘ | ↘ | ↘ | ↘ | ↘ | ↘ | ↘ | ↘ | ↗ | ↘ | ↘ | |
| FD0 | ↘ | ↘ | ↘ | ↘ | ↘ | ↘ | ↘ | ↘ | ↘ | ↘ | — | ↘ | ↘ | |
| ID0 | ↘ | ↘ | ↘ | ○ | ↘ | ↘ | ↘ | ↘ | ↘ | ↘ | — | ↘ | ↘ | |
| CSDI | ↘ | ↘ | ↘ | ↘ | — | ↘ | ↘ | — | ↘ | ↘ | — | — | ↘ | |
| Other indices | DTR | ↘ | ↘ | ↘ | ↘ | ↘ | ○ | — | ↘ | ↗ | — | ↘ | — | ↘ |
| GSL | ↗ | ↗ | ↗ | ○ | ↗ | ↗ | — | ↗ | ↗ | ↗ | — | — | ↗ | |
© 2018 by the authors. Licensee MDPI, Basel, Switzerland. This article is an open access article distributed under the terms and conditions of the Creative Commons Attribution (CC BY) license (http://creativecommons.org/licenses/by/4.0/).
Share and Cite
Sun, P.; Zhang, Q.; Yao, R.; Singh, V.P.; Song, C. Spatiotemporal Patterns of Extreme Temperature across the Huai River Basin, China, during 1961–2014, and Regional Responses to Global Changes. Sustainability 2018, 10, 1236. https://doi.org/10.3390/su10041236
Sun P, Zhang Q, Yao R, Singh VP, Song C. Spatiotemporal Patterns of Extreme Temperature across the Huai River Basin, China, during 1961–2014, and Regional Responses to Global Changes. Sustainability. 2018; 10(4):1236. https://doi.org/10.3390/su10041236
Chicago/Turabian StyleSun, Peng, Qiang Zhang, Rui Yao, Vijay P Singh, and Changqing Song. 2018. "Spatiotemporal Patterns of Extreme Temperature across the Huai River Basin, China, during 1961–2014, and Regional Responses to Global Changes" Sustainability 10, no. 4: 1236. https://doi.org/10.3390/su10041236
APA StyleSun, P., Zhang, Q., Yao, R., Singh, V. P., & Song, C. (2018). Spatiotemporal Patterns of Extreme Temperature across the Huai River Basin, China, during 1961–2014, and Regional Responses to Global Changes. Sustainability, 10(4), 1236. https://doi.org/10.3390/su10041236