Article

Multilevel Analysis of International Scientific Collaboration Network in the Influenza Virus Vaccine Field: 2006–2013

1
School of Public Policy and Management, University of Chinese Academy of Sciences, Beijing 100049, China
2
School of Management and Economics, Beijing Institute of Technology, Beijing 100081, China
3
Sustainable Development Research Institute for Economy and Society of Beijing, Beijing 100081, China
*
Author to whom correspondence should be addressed.
Sustainability 2018, 10(4), 1232; https://doi.org/10.3390/su10041232
Submission received: 2 March 2018 / Revised: 13 April 2018 / Accepted: 17 April 2018 / Published: 18 April 2018
(This article belongs to the Special Issue Sustainability for Healthcare)

Abstract

:
Influenza virus vaccine plays an important role in preventing influenza and protecting people’s health. The international collaboration in influenza virus vaccine field is related to the sustainability of healthcare. To understand the elaborate characteristics of multiform international collaboration in the influenza virus vaccine field, this paper constructs a multilayered analytical framework (at the country, city and institution levels) of international scientific collaboration to examine the regional distribution, dynamic changes and common themes of collaboration. A total of 1878 international collaboration papers of the influenza virus vaccine field published from 2006 to 2013 were collected from the Web of Science database. Based on this dataset, the paper utilizes bibliometrics and social network analysis approaches to explore international publication trends and collaboration performance in the influenza virus vaccine field. Results show that: (1) the three kinds of collaboration networks (country, city and institution levels) all present dynamic structures, strong core-periphery characteristics, and their degree centrality distributions follows segmented Zifp-Pareto distribution; and (2) although it is known that there exist corresponding relationships among countries, cities and institutions in the geographical position, most of their associated categories, network locations and changing trends are all non-conformal. These findings suggest that multilayered analysis enables a more comprehensive understanding of international scientific collaboration in the influenza virus vaccine field. In general, detailed conclusions can help different levels of governments to draw policy implications for promoting further international collaboration research to enhance the ability on preventing the disease.

1. Introduction

Influenza viruses typically cause outbreak son a local scale and then spread to a worldwide scope including Africa, the Americas, and Oceania, with potentially severe consequences for human health and national economies [1,2]. According to new estimates by the United States Centers for Disease Control and Prevention, the World Health Organization (WHO) and global health partners, up to 650,000 deaths annually are associated with respiratory diseases from seasonal influenza [3]. In the recent report of the WHO, it also claimed that another influenza pandemic is inevitable. In this interconnected world, the onset of the next global flu outbreak is only a matter of time and no conditions to be fulfilled—it will have far-reaching consequences. A severe pandemic could lead to millions of deaths and wipe out more than 1% of global GDP [4]. “These figures indicate the high burden of influenza and its substantial social and economic cost to the world”, said Dr Peter Salama, Executive Director of the WHO’s Health Emergencies Programme. “They highlight the importance of influenza prevention for seasonal epidemics, as well as preparedness for pandemics”. Vaccination has been commonly recognized as an ideal way to prevent and control, and even eradicate, all types of flu [5]. In the event of an influenza pandemic, the rapid development, production, and distribution of vaccines may save millions of lives. The WHO encourages countries to prioritize influenza prevention and produce national estimates to inform prevention policies, and annual influenza vaccination is recommended to prevent disease and complications from influenza infection. It is believed that influenza virus vaccine (IVV) plays an important role in preventing influenza and protecting people’s health. However, the numerous serotypes and high variability of the influenza virus challenge the research and development (R&D) of influenza vaccines. Preparation for new vaccines depends not only on domestic R&D investment but also on international collaboration. Hence, enhancing the understanding of the international scientific collaboration in the IVV field is of crucial importance for promoting technical innovation. In addition, preventing the influenza pandemic via international scientific collaboration in the IVV field is related to healthcare which is the third of the 17 Sustainable Development Goals (SDGs): ensure healthy lives and promote well-being for all ages. It can strengthen the sustainability of healthcare from following aspects: on one hand, international scientific collaboration in the IVV field can promote the common development and coordinated development of different countries’ related healthcare system to cope with the possible crisis; on the other hand, through in-depth international collaboration, the development efficiency and technological level of vaccines can be improved, thereby enhancing the effectiveness of relevant healthcare measures and achieving efficient development.
Vaccine research is closely linked to global sustainable healthcare matters and has always been a concern of many scientists. As early as 1998, Guzman et al. described and discussed the scientific production of Iberian-American countries in the fields of vaccines [6]. Results showed that there was a discontinuity in the vaccines’ scientific production over the years and that each country had peculiar behaviors. Later, an increasing number of scholars analyzed and evaluated vaccine research carried out in different parts of the world using different bibliometric indicators in different research areas, such as the malaria vaccine [7], childhood immunization [8], the Ebola virus [9,10], nor walk viruses [11], and so forth. Nevertheless, few bibliometric studies dealing with IVV research have been reported in literature, especially for issues of the international scientific collaboration network.
With the development of information technology and the acceleration of globalization process, the importance of international collaboration has already received theoretical and practical recognition [12,13,14,15]. Scientific research collaboration among authors from different places can facilitate keeping up with advances in findings and methods of related fields and foster more efficient development outcomes [16,17]. There are many scientists who work on international publications, and different scholars conduct studies from different angles (at the country or institution level, or both) and draw different conclusions. The approaches commonly used to examine international publication trends and collaboration performance of a certain research field are bibliometrics and social network analysis. Recent studies have highlighted the necessity of also considering intercity collaboration to fully understand cooperative and innovative activities [18,19]. However, studies examining the relationships among these three levels of international scientific collaboration are not yet fully developed.
In our previous work, we designed a technology classification system and search strategy for the identification of the IVV field and presented a global analysis of the IVV field’s technology resource distribution and development characteristics [20]. Uneven distributions of technology resources and an imbalance in the national scientific and technological strengths in IVV require extensive R&D collaboration at the country and city levels as well as the more specific institution level. In 2006, the WHO launched the Global Action Plan for Influenza Vaccines (GAPI), calling on all countries of the world to take a positive position on the research and development of effective vaccines. Three years later, the WHO issued a new Global Action Plan for Influenza Vaccines (GAP II) to succeed the activities of GAP I. Greatly supported and promoted by the WHO, newer and expanded R&D alliances have been formed in both developed and developing countries, and progress is being made with new scientific achievements and technologies [21]. The objectives of this paper are to create a map of multilevel international scientific collaboration within the IVV field around the world after the GAPs were put into effect and to discuss the similarities and the differences between three types of collaboration networks. The paper intends to draw the policy implications to enhance the further research in IVV field which hope to prevent the disease and promote the sustainability of global healthcare.
The remainder of this paper proceeds as follows: Section 2 describes the research framework for the multilevel analysis and presents the research questions. Section 3 introduces the data and methods. Section 4 analyzes the characteristics of the global scientific collaboration network in the IVV field, discusses the empirical results, and probes how these findings can enlighten international collaboration activities. Concluding remarks are provided in the last section.

2. Theoretical Framework and Research Questions

As mentioned, international collaboration has proven beneficial in consolidating scientific activities and guaranteeing the improvement of scientific production. With rapid globalization, many studies about international scientific collaboration have appeared. Meanwhile, collaboration networks are an important medium for examining scholarly communication [22]. Some scholars investigated the networks as well as core groups of international collaboration in either specific fields or selected cooperating partners at the country and institution levels [23,24,25,26,27]. Country-level collaboration studies help in the examination of the roles of every nation, while institution-level collaboration studies are useful for exploring the typology of collaborative links (national and international), the size of the research community, and the scope of the collaboration.
Cities, as spatial carriers of science and technology (S&T) development, have become important actors that no one should ignore in international relations. Local governments are increasingly engaged in international collaborations in various ways, promoting intercity collaboration and thus forming a multilateral network. In a sense, intercity collaboration is the necessary and beneficial supplement to country- and institution-level collaboration, playing the role of a connecting link between the preceding and the following. In 2013, Lei et al. discussed three different collaborative types: namely city, domestic (different cities of the same country), and international collaboration, in the solar cell industry [28]. However, studies examining the relationships among these three levels of international scientific collaboration remain limited.
In an attempt to integrate these levels, we construct a multilayered analytical framework (at the institution, city, and country levels) of international scientific collaboration (see Figure 1). Based on these three collaboration levels, the paper studies the regional distribution, dynamic changes, and common themes of internationally collaborated papers in the IVV field. The specific research questions are as follows:
  • Research question 1: What are the main characteristics of international scientific collaboration (at the country, city, and institution levels) in the IVV field? What do the levels have in common, what are their differences, and how could they be integrated? These questions will be covered and explored in this paper.
  • Research question 2: The aforesaid analysis has mainly examined the respective characteristic of all three levels of collaboration, but are there are any differences or similarities of three kinds of network structures? We attempt to apply Zipf’s law of Scientometrics [29] to make a profound analysis and theoretical explanation.

3. Materials and Methods

3.1. Data Collection

In our previous work, according to the relevant literatures [30,31] and Chinese experts’ opinions, we designed the technology classification system of the IVV field, which can be divided into four major categories, including inactivated vaccine, live attenuated vaccine, recombinant vaccine, and synthetic peptide vaccine, and further divided into eight subcategories: inactivated virus vaccine, split vaccine, subunit vaccine, live attenuated vaccine, recombinant protein vaccine, recombinant vector vaccine, recombinant DNA vaccine, and synthetic peptide vaccine [20] (See Table 1).
We then used a keyword query approach to identify each sub-field related paper from the specific databases. The Web of Science (WoS) database is the world’s most influential multidisciplinary academic literature abstracting and indexing database, maintained by the Institute for Scientific Information (ISI) in Philadelphia [32]. The Science Citation Index (SCI) and the Social Sciences Citation Index (SSCI) are two sub-databases, covering high-quality, peer-reviewed journals in the natural sciences, engineering, social sciences, and other fields [33]. Therefore, the paper data of this study were retrieved from the SCI and SSCI. After the data was downloaded, we consolidated and cleansed it via the software Vantage Point, because we are studying human vaccines but some papers mostly about veterinary, poultry or livestock vaccines inevitably were mixed in with the sample.
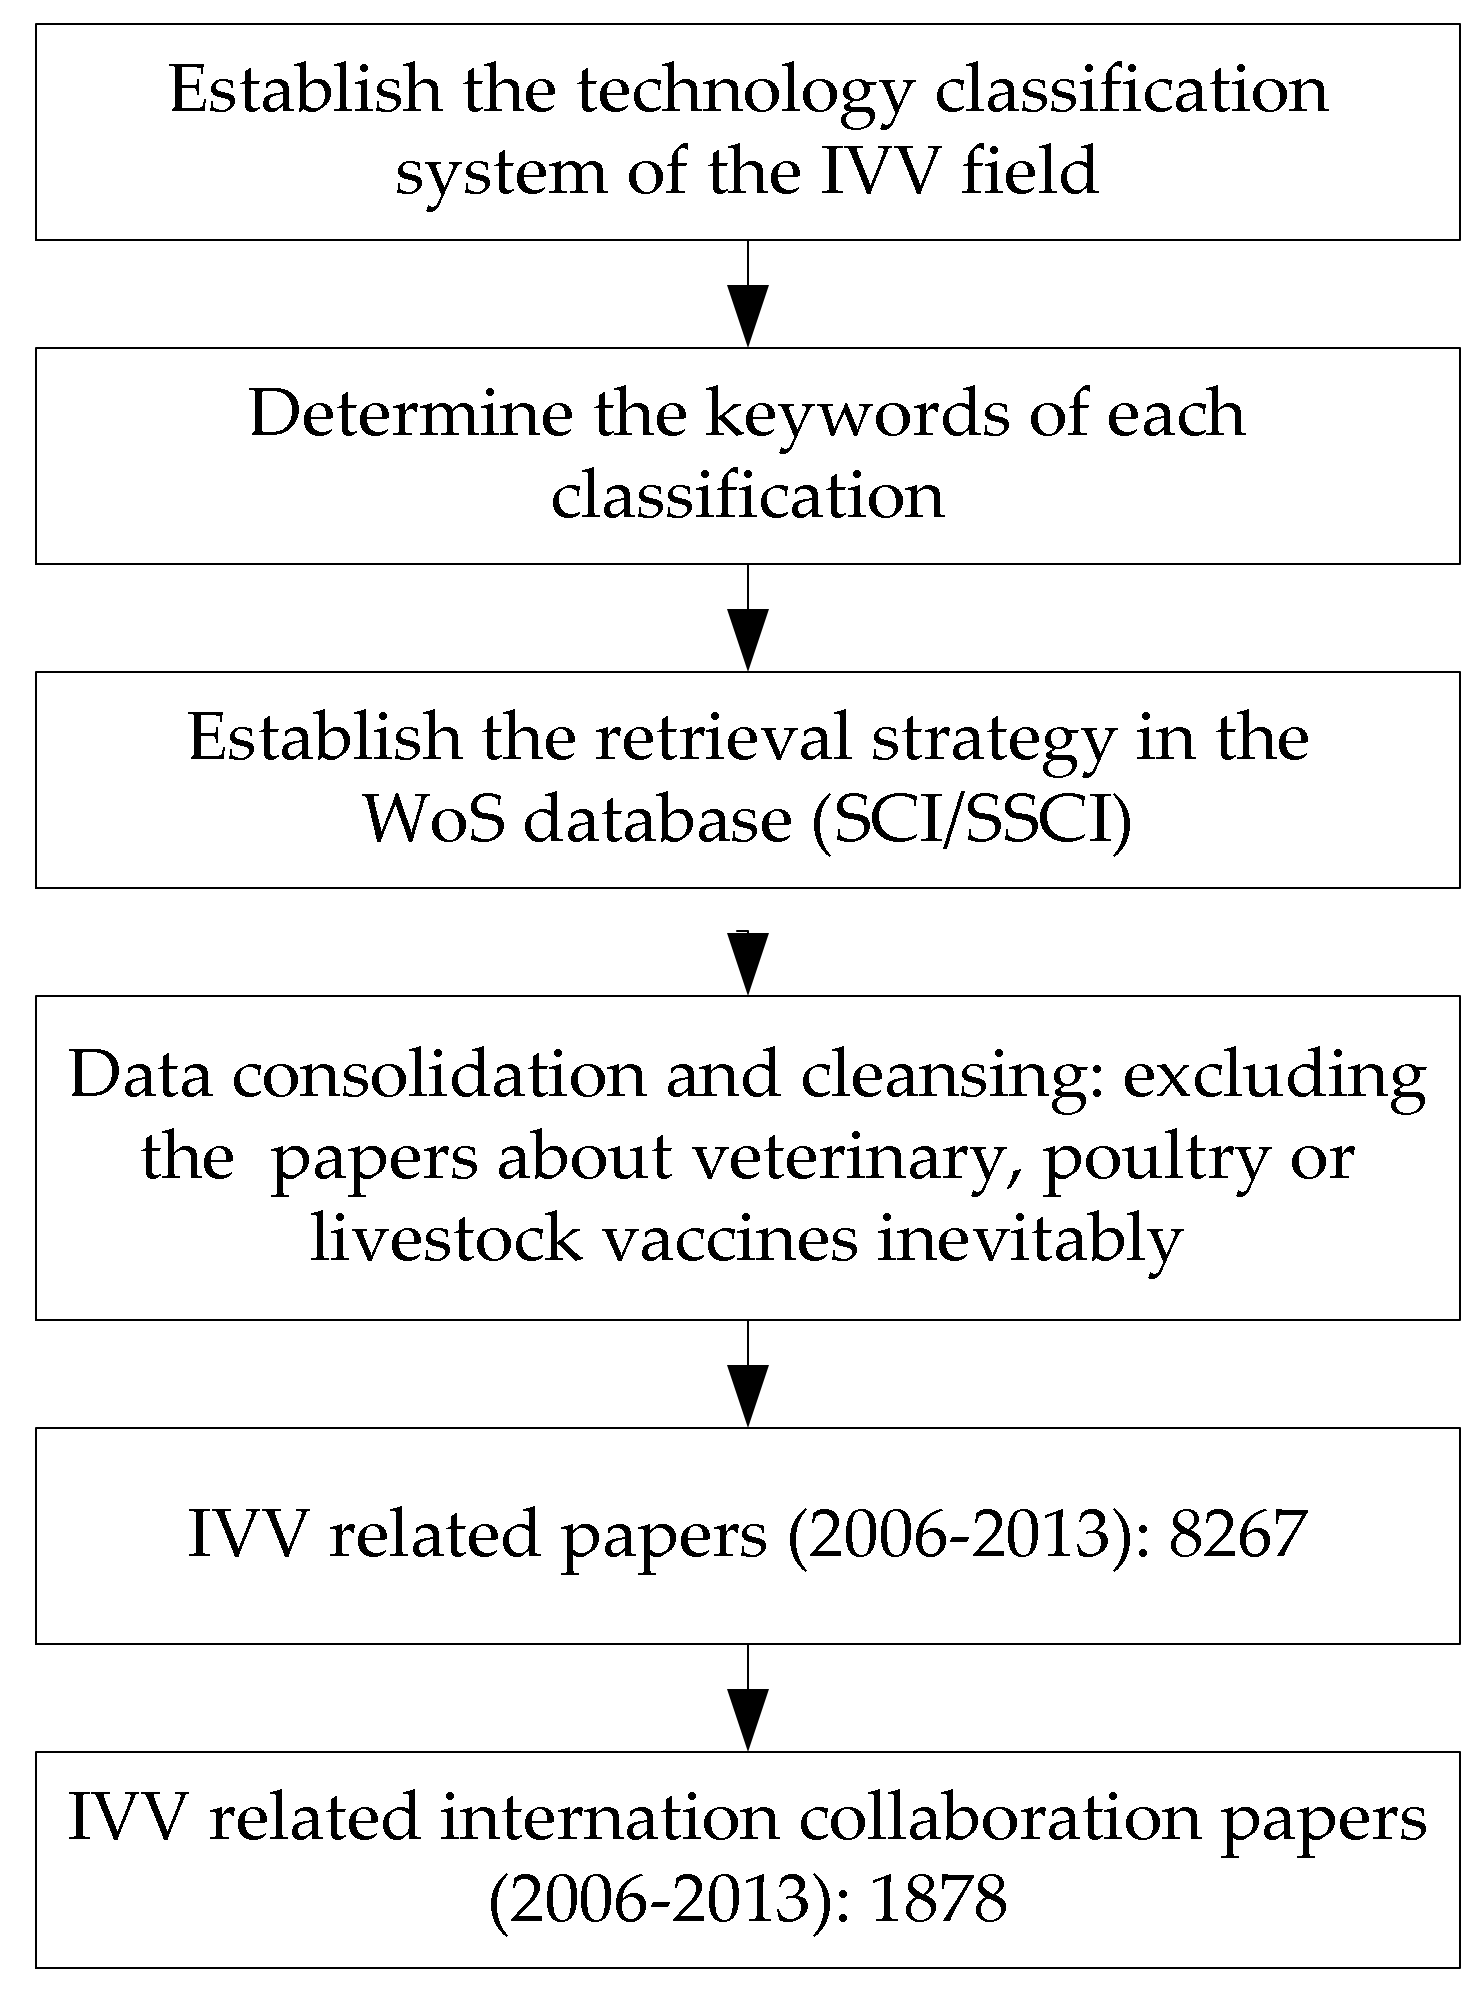
Finally, we defined papers with authors from at least two countries as belonging to the scope of international collaboration. 1878 international collaboration papers of the IVV field that were published from 2006 to 2013 were collected. Figure 2 shows the workflow of the data-collection process. Table 2 shows the number of total papers and international collaboration papers in each year of the IVV field.

3.2. Research Methods

In this research, different statistical, bibliometric and social network analysis approaches are used to examine international scientific collaboration networks, which are expected to provide valuable quantitative information for R&D in the IVV field. Statistical analysis pertains to the collection, organization, interpretation or explanation, and presentation of data [34,35]. Bibliometric analysis is a set method including qualitative, quantitative and computational approaches that is widely applied to evaluate the impact of countries and institutions or to map scientific fields and the production of indicators for use in policy and management contexts.
Social network analysis is the process of investigating structures and properties of the relationships of different social units (individuals, groups or societies) through the use of network and graph theories. Centrality, one of the research emphases, refers to a group of metrics that aim to quantify the “importance” or “influence” of a particular unit within a network. The conventional measures are degree centrality, betweenness centrality, and closeness centrality. Freeman (1978, 1979), in his seminal paper on social network analysis, explained that the selection of three types of indices depends on the research question: if you are mainly concerned about exchange activities, degree centrality can be used as the basis of measurement; if the research is focused on the control of communication, you can choose betweenness centrality; if the independence or effectiveness of information transfer is to be analyzed, closeness centrality can be adopted [36,37]. For the aim of this research, Freeman’s degree centrality (DC) is selected as an indicator. It is defined as a node’s number of ties; actors who have more ties to other actors may be in advantageous positions.
We utilize the collaborative breadth index (CBI) and the collaborative depth index (CDI) in the analysis. For purposes of comparing across networks in four time periods, Freeman’s DC was used to measure the breadth of one country or region’s international collaboration from a macro view. The larger one’s degree, then the more widespread its knowledge sources. Collaborative depth is defined as the index of the collaboration extent and collaboration distribution of a certain country with its foreign scientific partners through co-publishing papers. A country’s CDI is determined as follows:
C D I i = j = 1 N M i , j / D C i ( 1 i , j N )
where Mi,j indicates the number of collaboration papers produced by country i and country j (but does not rule out the possibility that another country is involved). N represents the set of partner countries. Obviously, the greater the number of a country’s multinational papers, the higher the frequency of academic exchange activities that appeared between this country and its partners and the deeper their collaboration relations. We used the software Vantage Point and UCINET to conduct the analysis.

4. Results

4.1. Country Level

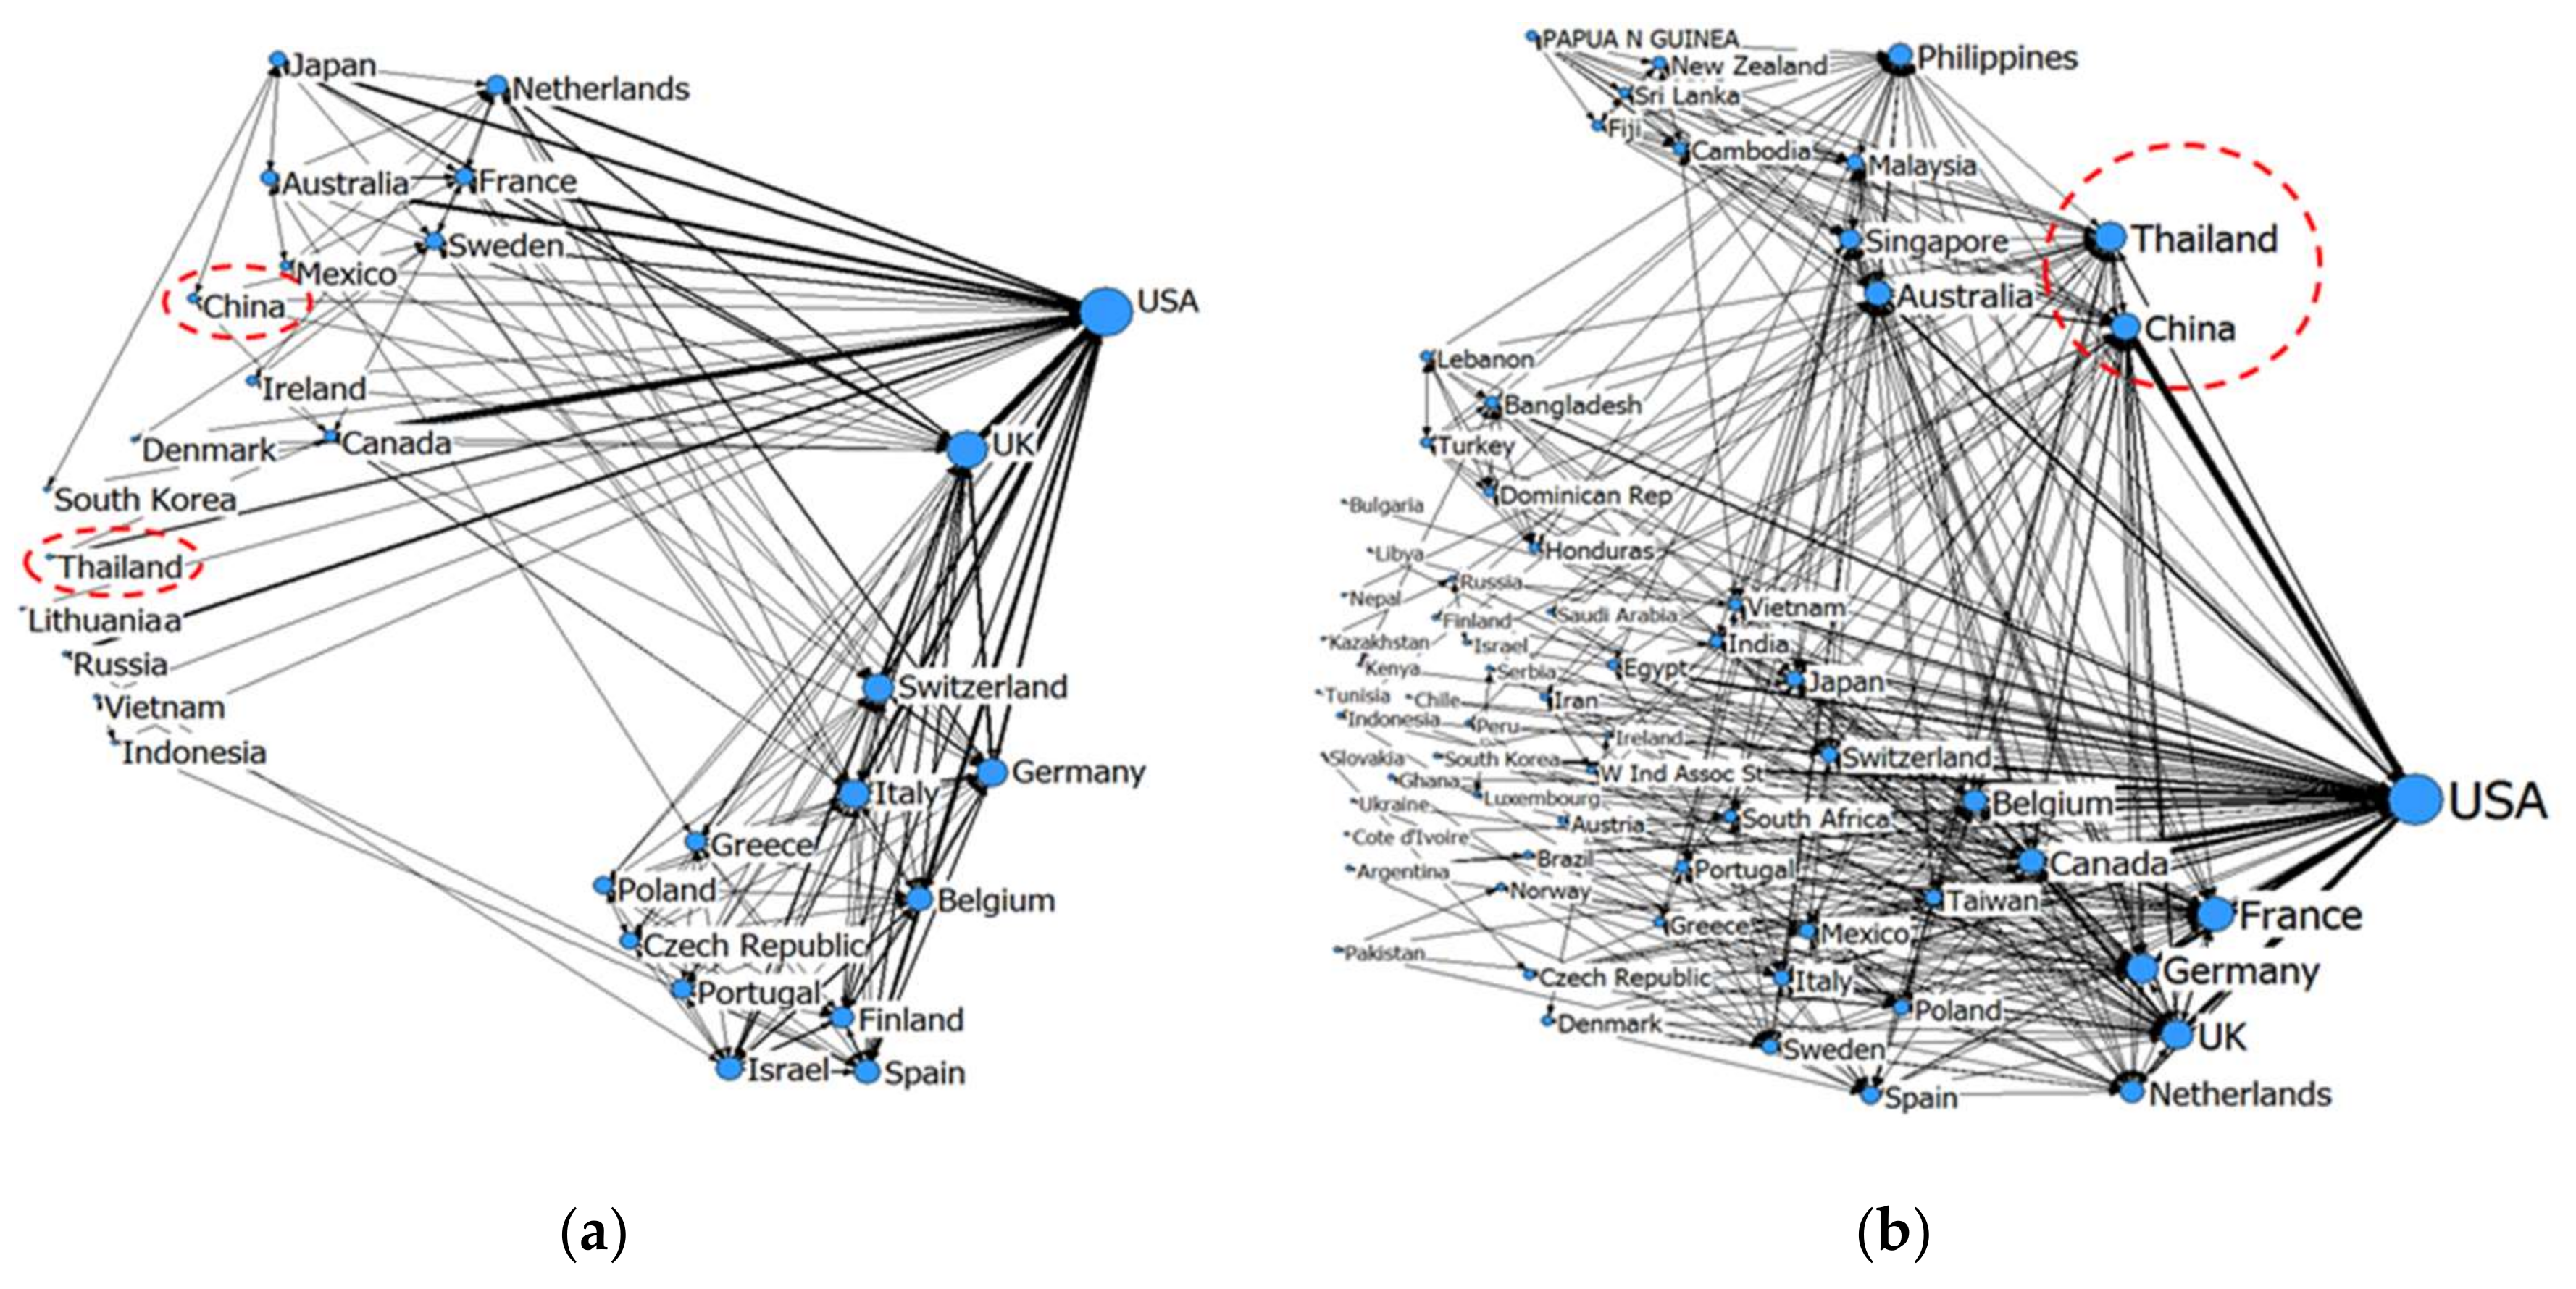
Our analysis of the global scientific country-level collaboration network starts with its graphical illustration at two time points—2006 and 2013. The size of nodes is determined by the total number of papers published in joint collaboration for each country, while the strength of the ties between nodes represents the quantity of collaboration [38]. Figure 3a,b reveal that the country-level network was rather weakly connected at first. The major players were the United States and some developed European countries, such as Germany, the UK, and France. Subsequently, the number of countries in the network and the linkages between them increase at a rapid rate. In 2013, the United States also takes the leading position, although the influence of the aforementioned European countries is still evident. It is noteworthy that Asian countries such as China and Thailand have an important place in this network. Unfortunately, there is a lack of contribution from African countries despite the great importance and significance of the field for them.
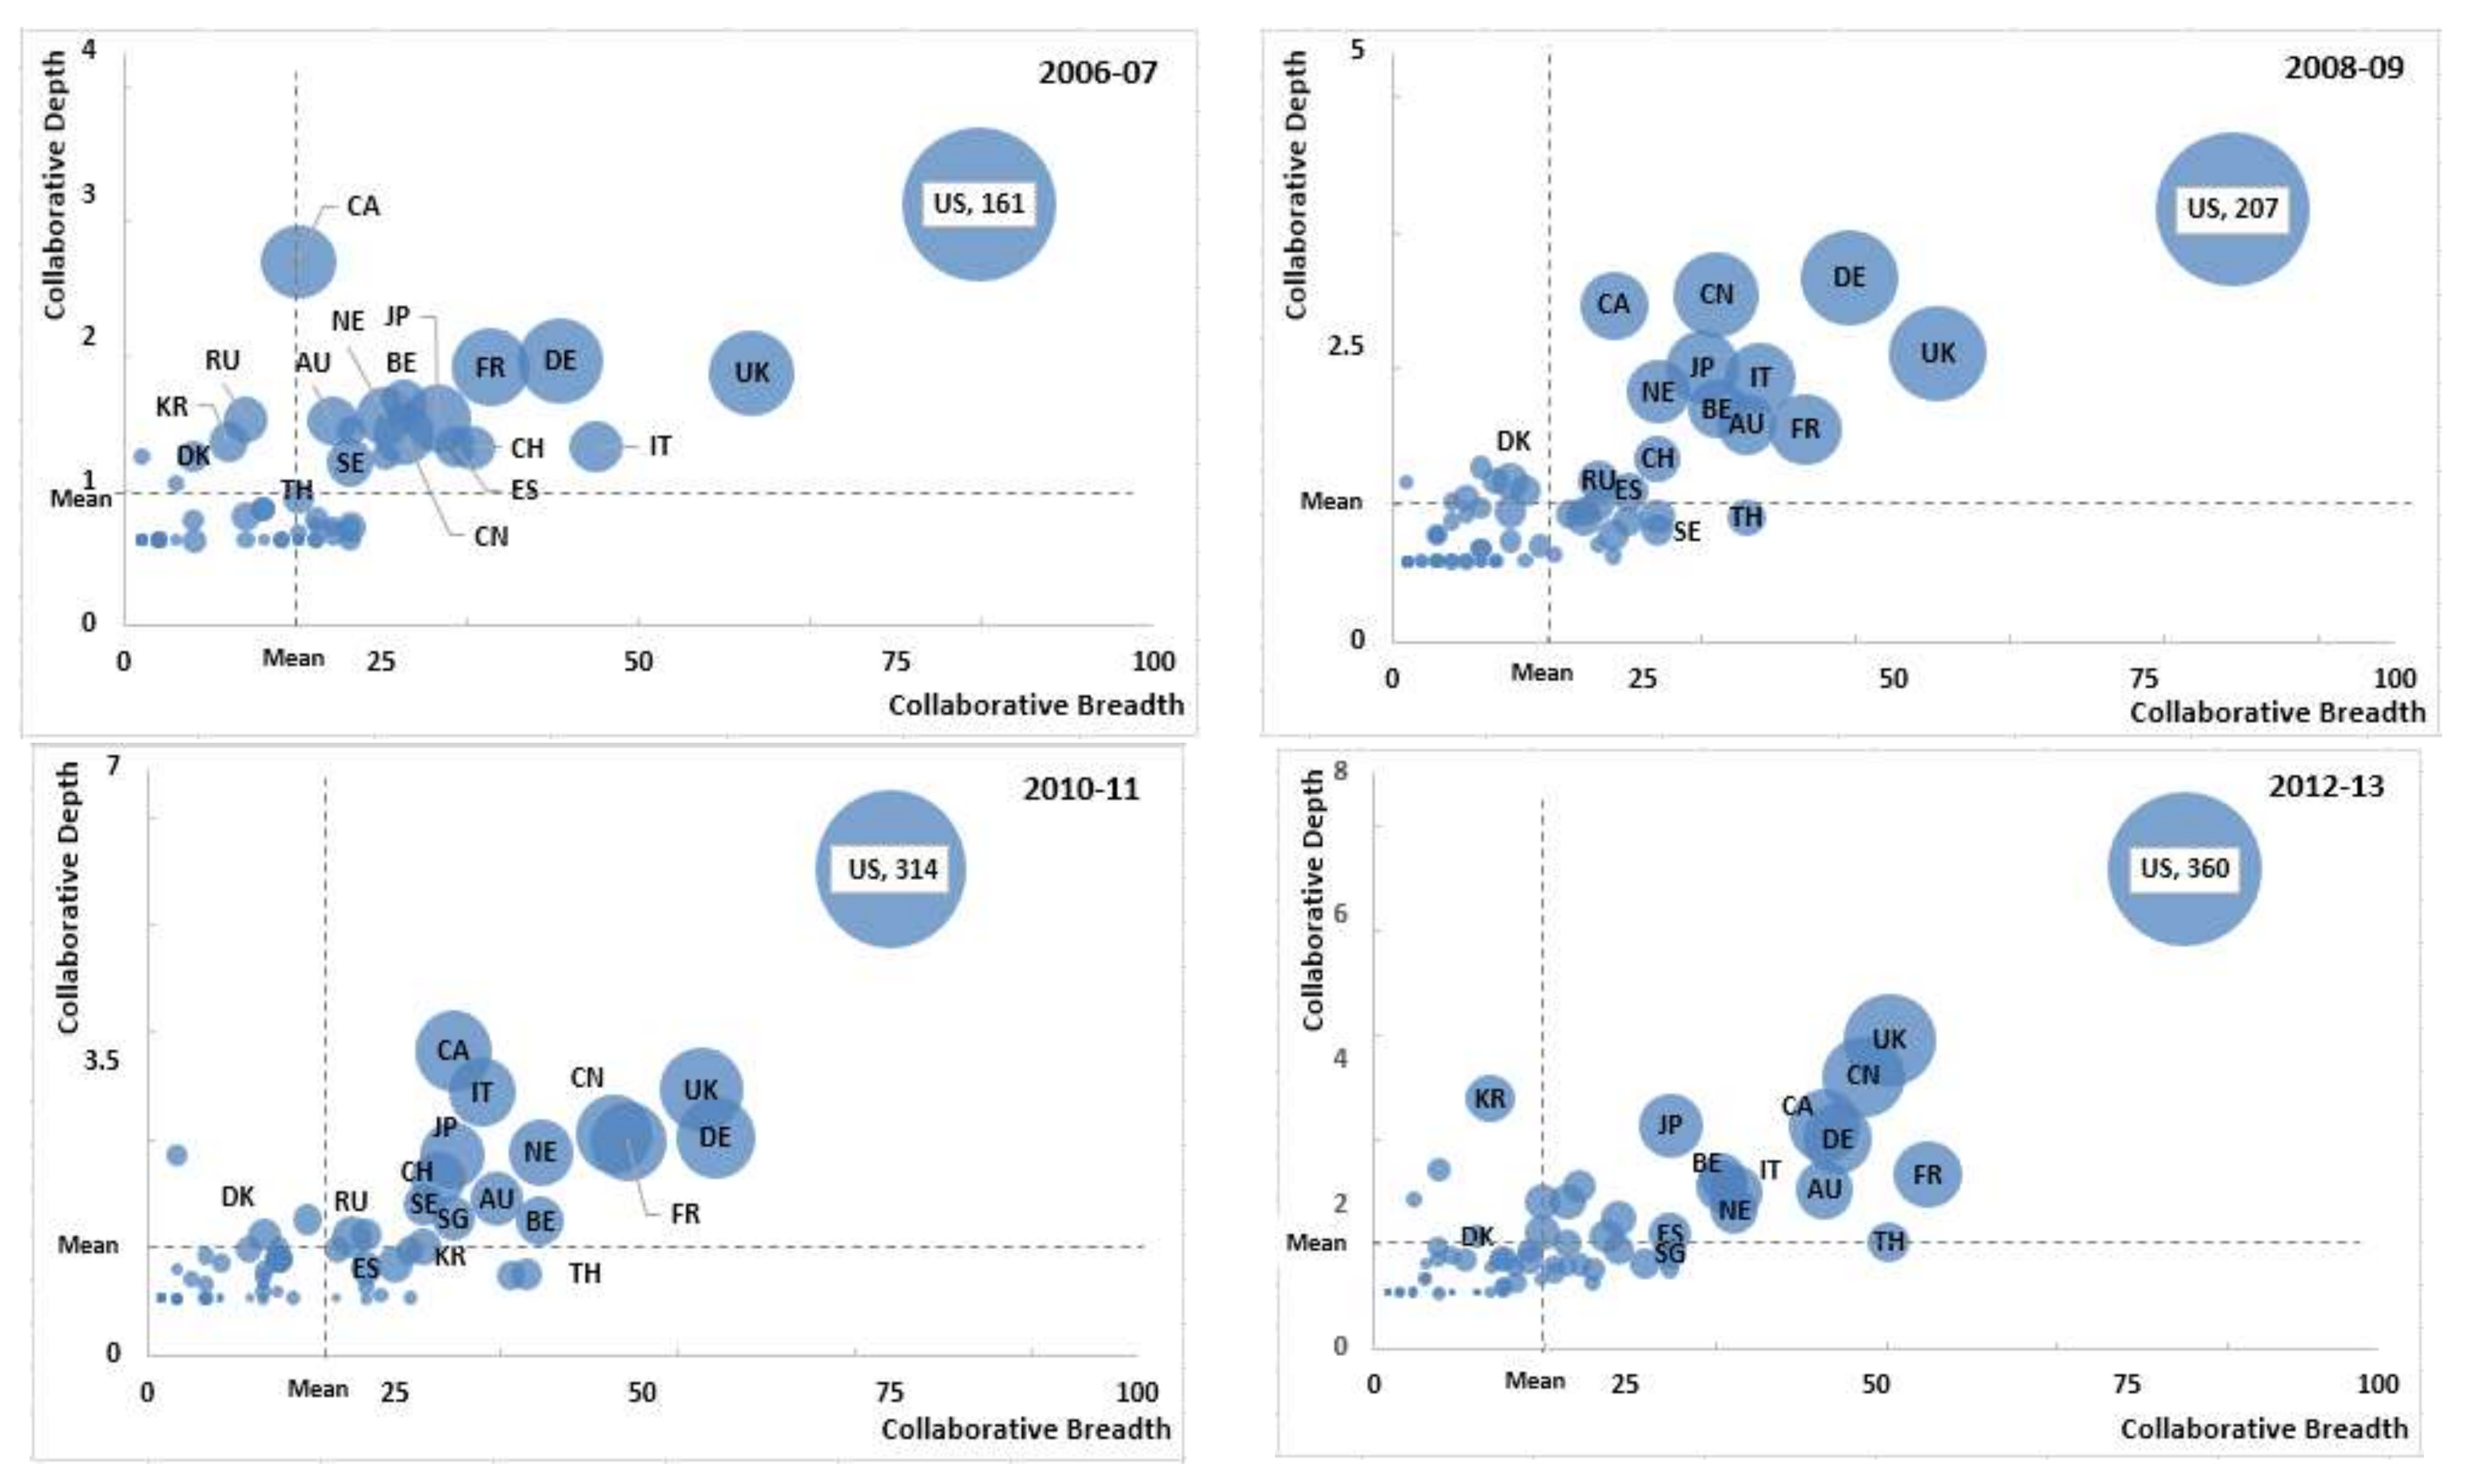
Next, we reveal the breadth and depth of collaborative partnerships of different countries on parameters such as DC and collaboration extent (frequency) within 2006–2007, 2008–2009, 2010–2011, and 2012–2013. By using Equation (1) which is mentioned in the research methods section for each country in every time period, the bubble graphs of four periods reflecting partner countries’ cooperative situations were established in which the abscissa indicates the collaborative breadth, the ordinate indicates the collaborative depth, and the bubble size represents the number of multinational papers of each country. The bubble graph of the average values of collaborative breadth and depth is divided into four quadrants, so all partner countries are classified into four types, as suggested in Table 3.
From the bubble graph we can identify some findings (see Figure 4):
  • With the elapse of time, international scientific collaboration is increasingly becoming more in-depth in the IVV field, while different countries present different developmental levels.
  • The United States has the most international buddies and is the largest collaboration partner of other countries because it has the most multinational paper counts. Undoubtedly, it is worthy of being called the core figure in the country-level collaboration network (see Figure 3).
  • European countries such as the United Kingdom, Germany, France, Italy, Belgium and The Netherlands have always been in the HH quadrant. By contrast with these countries, Denmark has often been marginalized and located in the LH quadrant.
  • Among the Asian countries, Japan and China also performed quite well. In particular, Thailand through efforts over several years, entered a new quadrant during 2012–2013.
  • Likewise, Canada and Australia reach international advanced level in 2008–2009.

4.2. City Level

The scientific output of a nation is associated highly with its specific productive regions. From the foregoing section it is clear that various countries have occupied different positions in the collaboration network across the four time periods, which usually combine with the existence of regional collaborating centers. With the development of science and technology as important regional economic units of a country, the urban position gradually becomes outstanding [39]. In order to obtain further information on interregional cooperation, we extracted the city address information of multinational papers during the four time periods. Afterwards, HH-type cities were chosen to be sorted according to the number of multinational papers (see Table 4).
In general, despite the increase of HH-type cities across the four time periods (45→70→83→110), the characteristics of international scientific collaboration in the IVV field such as imbalanced area distribution and uncertain dynamic changes were found. Furthermore, several cities’ positions in the regional collaboration network do not fit with their countries’ place in the national collaboration network. For instance, the United States remains substantially ahead, as illustrated in Figure 4, and the number of its cities in Table 4 increase; however, whether in the CBI, CDI, or the amount of multinational papers, American cities are not always in the lead. This could be attributed mainly to more equally distributed research across cities in the United States, in contrast to countries such as the United Kingdom, Canada, and Australia, which have highly concentrated and dependent research in some specific cities. On the other hand, there are some cities that have reached global prominence whose countries do not belong to the HH type, such as Auckland, New Zealand; São Paulo, Brazil; Mexico City DF, Mexico; and Seoul, Korea.
London, UK, and Tokyo, Japan, were always in the top three in terms of multinational papers in the IVV field. In 2006–2007, Tokyo occupied first place of collaborating centers, while London became the core of the international scientific collaboration network in the IVV field during 2008–2009. The case of Japan is interesting and deserves our full attention. There are some Japanese cities that play important roles in the collaboration network—e.g., Tokyo, Saitama, and Hokkaido are included in the list of global IVV collaborating centers. However, the number of multinational papers published by Japan is not very high. This phenomenon may need more attention and perhaps investigation by relevant Japanese government departments. After all, the development of a technological field across a country is better than the advancement at only one point in a country in both bibliometric and practical views [40].
Since 2010, Atlanta, GA, USA, has become a collaborating center of global IVV research. This may be because the Centers for Disease Control and Prevention (CDC), the leading national public health institute of the United States, is headquartered in Atlanta. The CDC brings together many top scientists related to the IVV field, including epidemiologists, biologists, physicians, veterinarians, behavioral scientists, nurses, medical technologists, public health advisors, health communicators, toxicologists, chemists, computer scientists, and statisticians, which makes it possess the leading functions in scientific research and play active roles in discipline innovation. The statistics show that there are 14 American cities in the HH quadrant in 2006–2007; the number increased to 25 until 2012–2013, and Baltimore, San Diego, Cincinnati, Cambridge, Philadelphia, Seattle, Pittsburgh, and Ames all became new collaboration centers. In the meantime, other American cities’ positions as world collaborating centers decreased (such as New York and Memphis).
The rise and development of Chinese cities was a conspicuous phenomenon, as shown in Table 4. In 2006–2007, China did not have a HH-type city; even better performers (Hong Kong and Beijing) were merely located in the HL quadrant, and the remaining cities were all in weak positions. Since severe acute respiratory syndrome (SARS) caught the country by surprise in 2003, China has ramped up its scientific efforts, building several infectious-disease institutes and more than 400 laboratories devoted to flu surveillance and testing, plus adding sentinel equipment to some 550 hospitals. In 2009, China became the first country in the developing world to host a WHO Collaborating Center for Reference and Research on Influenza. Joining other collaborating centers in Australia, Japan, the United Kingdom, and the United States, the Beijing-based National Influenza Center serves as a regional hub for monitoring and responding to flu outbreaks. The Chinese center hosts research in new antiviral medicines and helps provide pandemic preparedness training for medical personnel from across East Asia. Therefore, in the fourth time period, six cities (Hong Kong, Beijing, Shanghai, Harbin, Tianjin, and Shantou) have entered the HH quadrant.

4.3. Institution Level

The performance of institutions is the foundation for regional and even national development. Exploring the central institutions in the IVV field can help these institutions to select fitting collaboration partners. As with the city level, we first divided all partner institutions into four types and then chose the top 10 HH-type institutions for further analysis. Table 5 shows that the rankings for the number of multinational papers change among the top 10 HH-type institutions. Among them, four of the institutions are in the United States and two are in Japan, while the United Kingdom, China, the Netherlands and Canada each host one institution on the list. The CDC, University of Wisconsin, St. Jude’s Children’s Research Hospital, and University of Tokyo have been global leaders in the IVV field whose rankings are always in the top few. Other institutions have maintained an upward trend; specifically, Emory University and Toronto University successfully shifted from the LL quadrant to the HH quadrant in 2008–2009. In contrast with the institutions’ city, the changing trends of most institutions themselves are non-conformal. For example, Rotterdam, Netherlands, showed the trend of falling in Table 4, while Erasmus MC of Table 5 moved up the ranks continually. The University of Oxford, one of the most famous universities in the UK, and second to Tokyo, Japan, in multinational paper counts, was even in the HL quadrant in 2006–2007. Beijing’s ranking rose to fourth place in 2012–2013, but Beijing’s institutions did not make the top 10. Of course, there are counter-examples, such as two institutions of Atlanta, which is a new collaborating center that also surged ahead on the list.
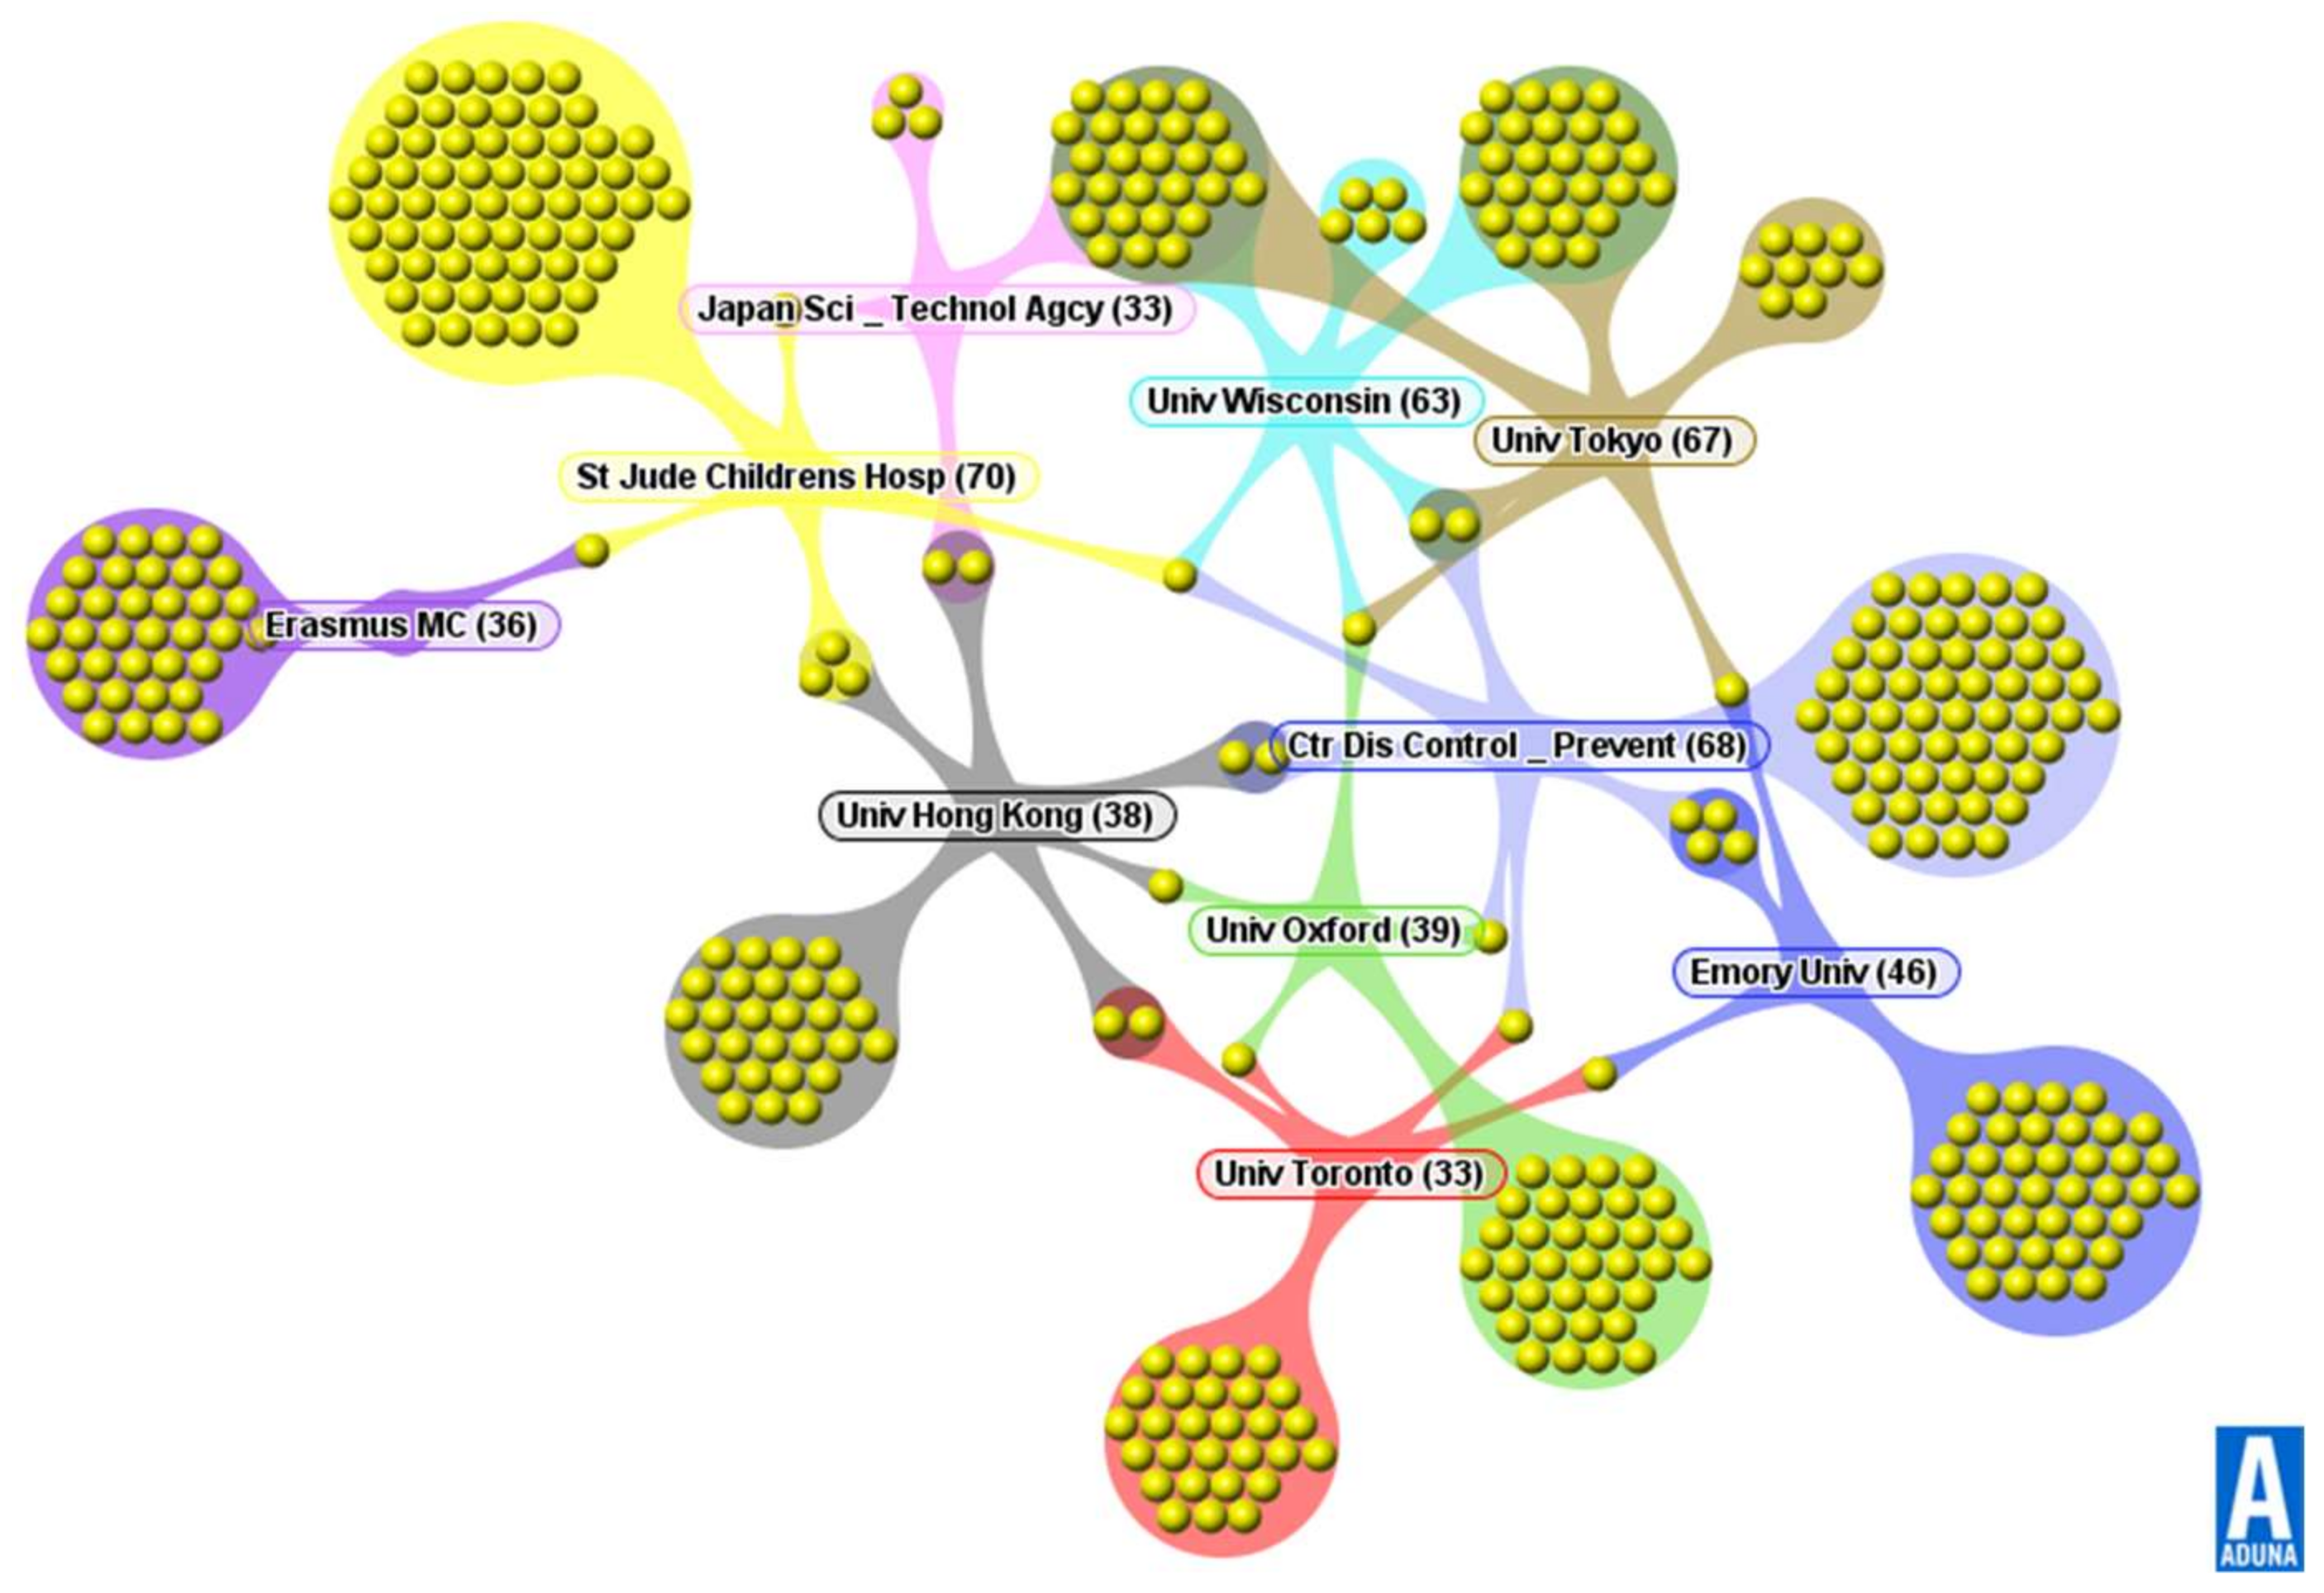
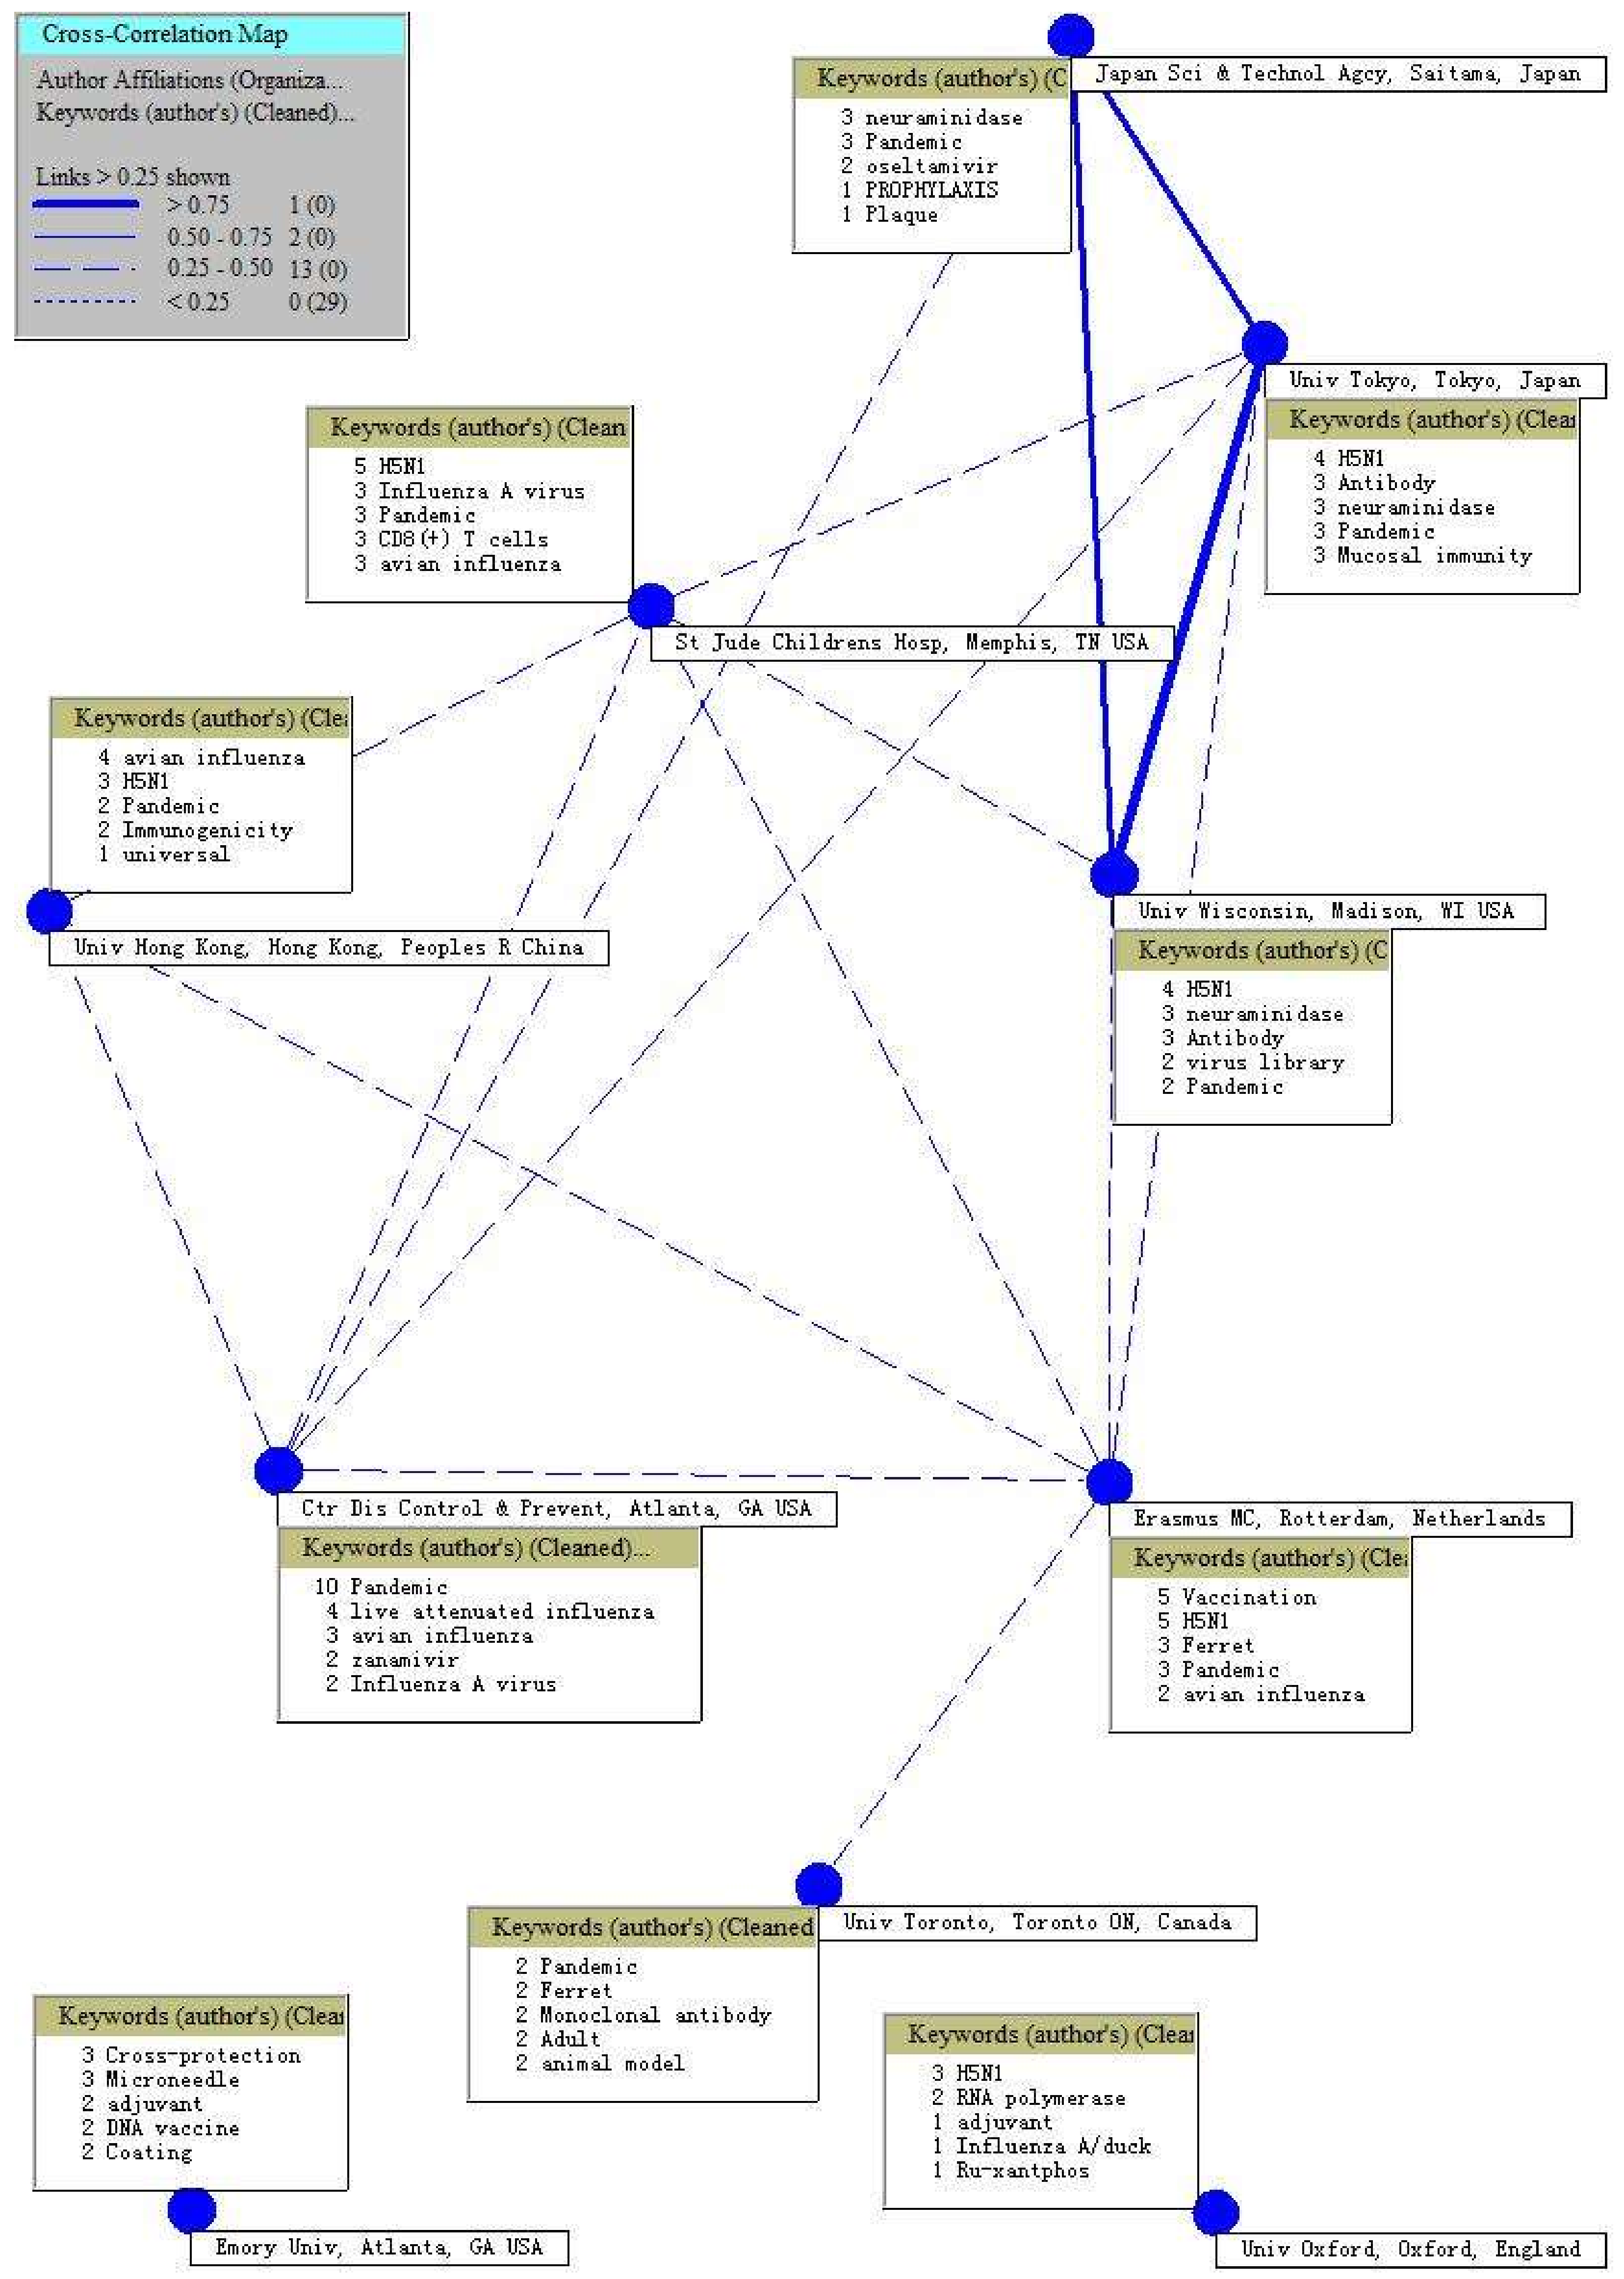
Figure 5 shows the collaboration network of the top 10 institutions in the HH quadrant in terms of numbers of multinational papers. The significant relationships between institutions permitted the identification of up to 10 large collaboration nuclei. We can see that St. Jude’s Children’s Research Hospital, located in Memphis, TN, USA, is the most prolific institution (70 papers). The CDC of the USA establishes the most collaboration relationships, while Erasmus MC of The Netherlands has the minimum number of partnerships. To discover the common interesting point between two organizations, we created a cross-correlation map (see Figure 6) of the top 10 HH-type institutions. The relationships in the illustration show organizations that are working on similar topics (as defined by the keyword field in their publications). To reduce visual clutter, only the strongest of the entire set of possible similarities are shown. The highest similarity (0.87) of IVV research appeared between the University of Tokyo and the University of Wisconsin. The keywords shared by the two universities were H5N1, antibody, neuraminidase, and pandemic. Their differences, however, are that the University of Tokyo focuses on mucosal immunity issues while the University of Wisconsin pays more attention to constructing a virus library. The Japan Science and Technology Agency (JST) also has a high degree of similarity with these two universities. The words in their frequency list that are shared with JST’s paper keywords are neuraminidase and pandemic. It is surprising that the similarity degree (0.59) of JST and the University of Tokyo (Japan’s own university) is less than that (0.63) of JST and the University of Wisconsin. Certainly, there are considerably more unique words in other institutions’ frequency lists with feeble correlations.

4.4. Comparison

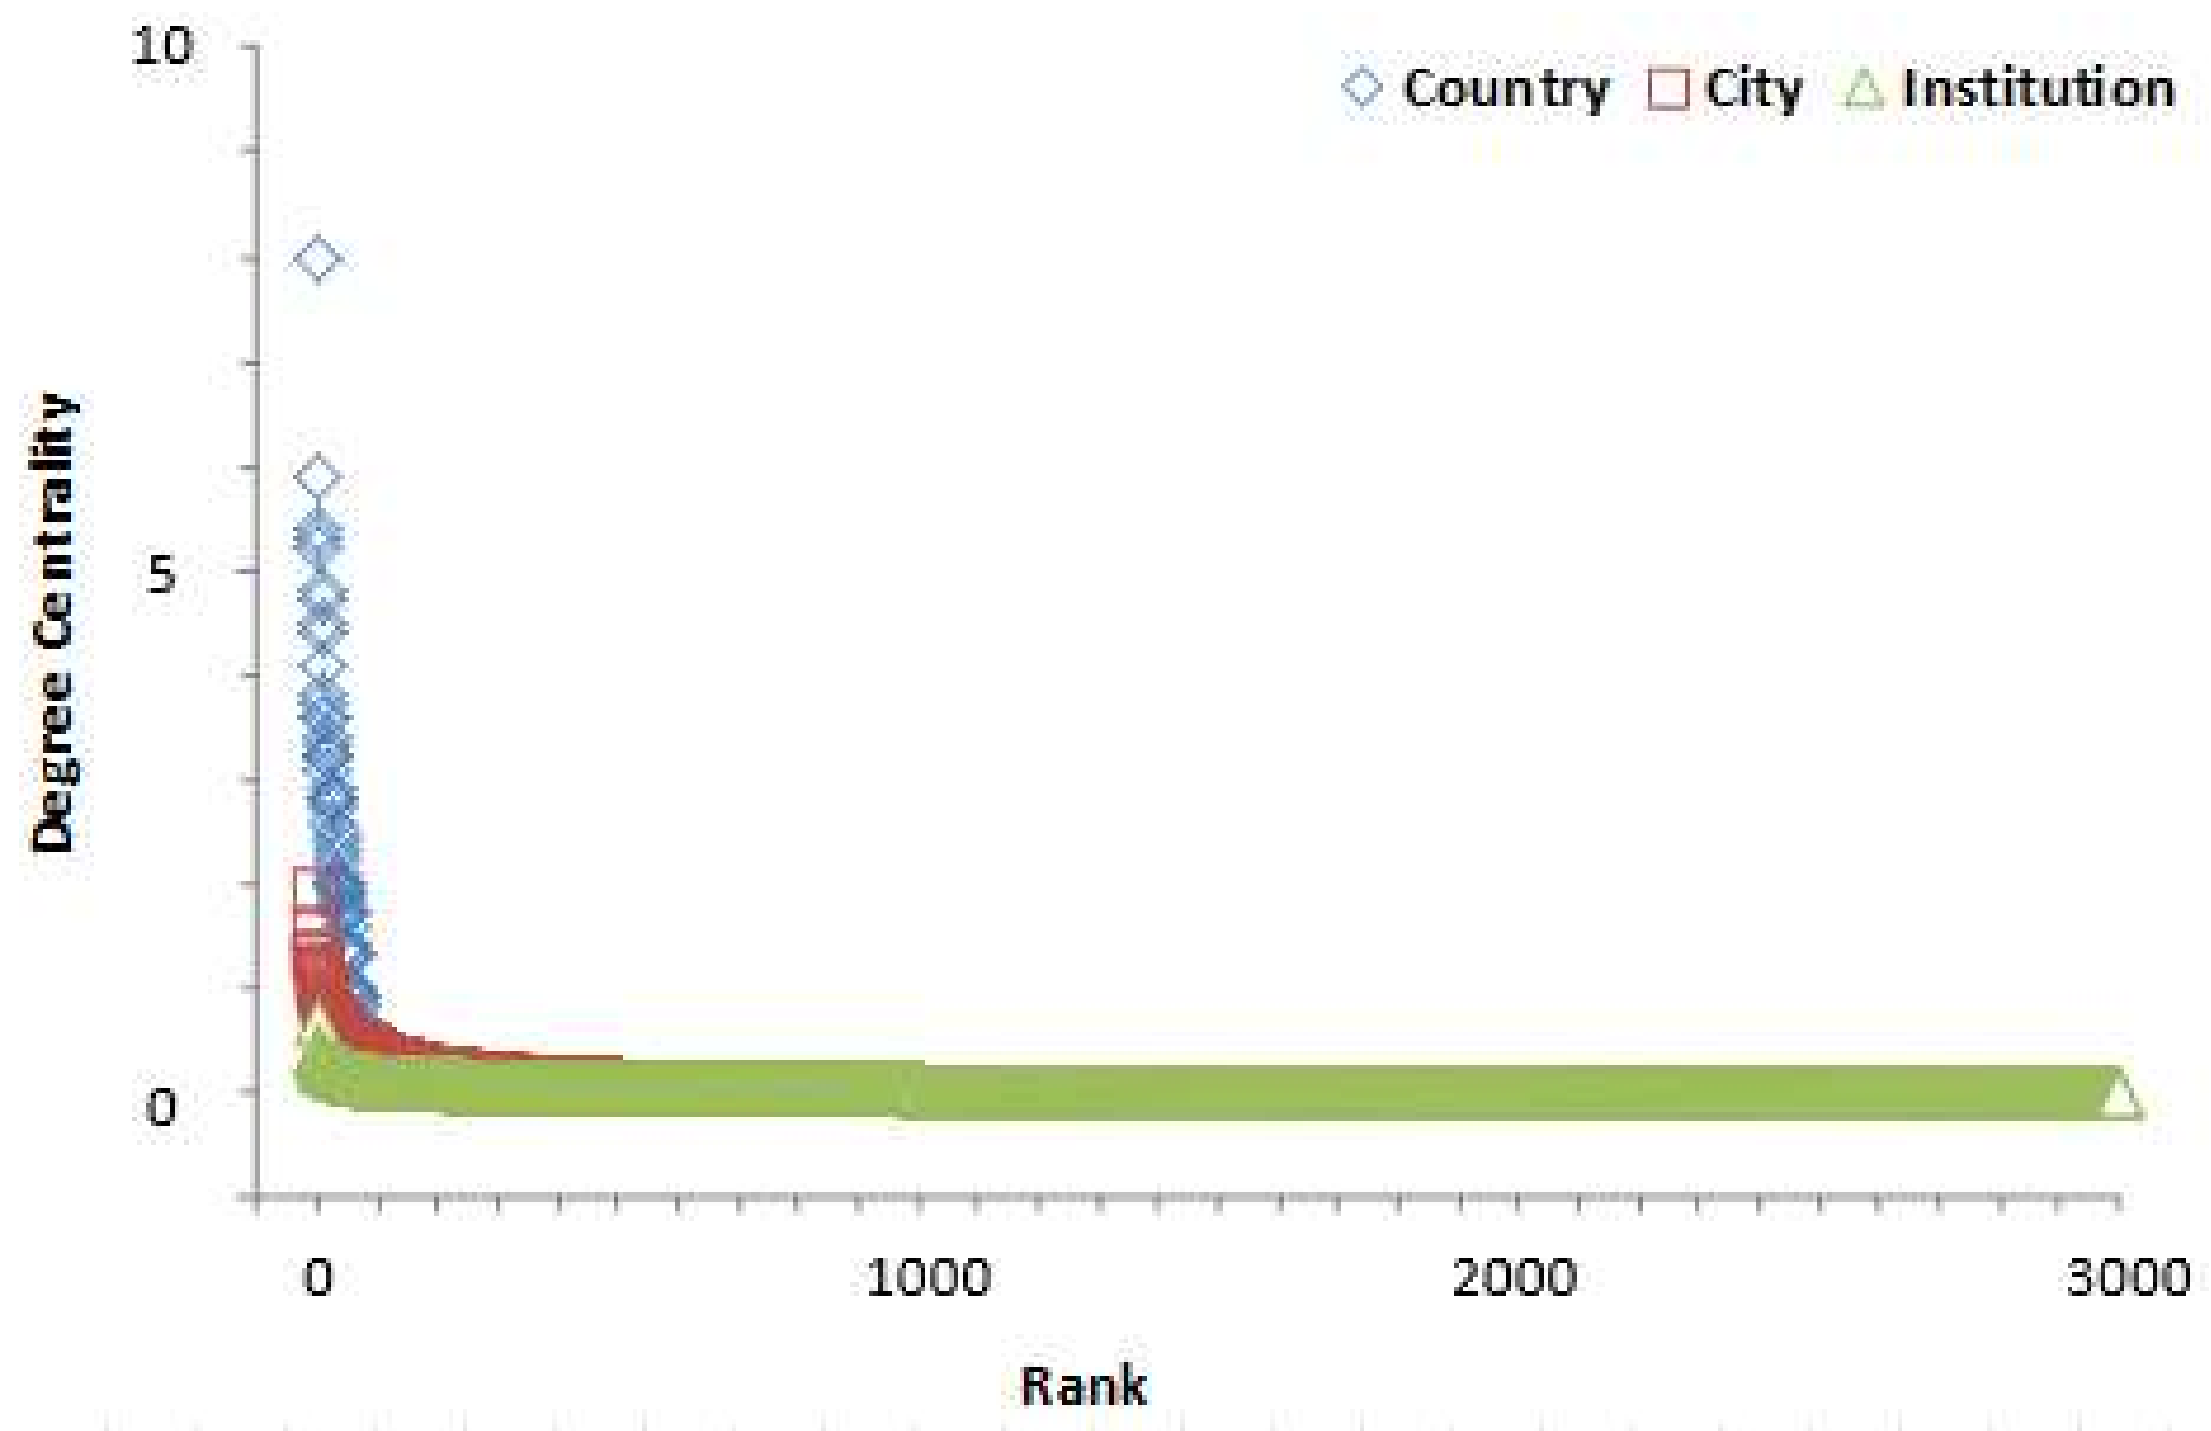
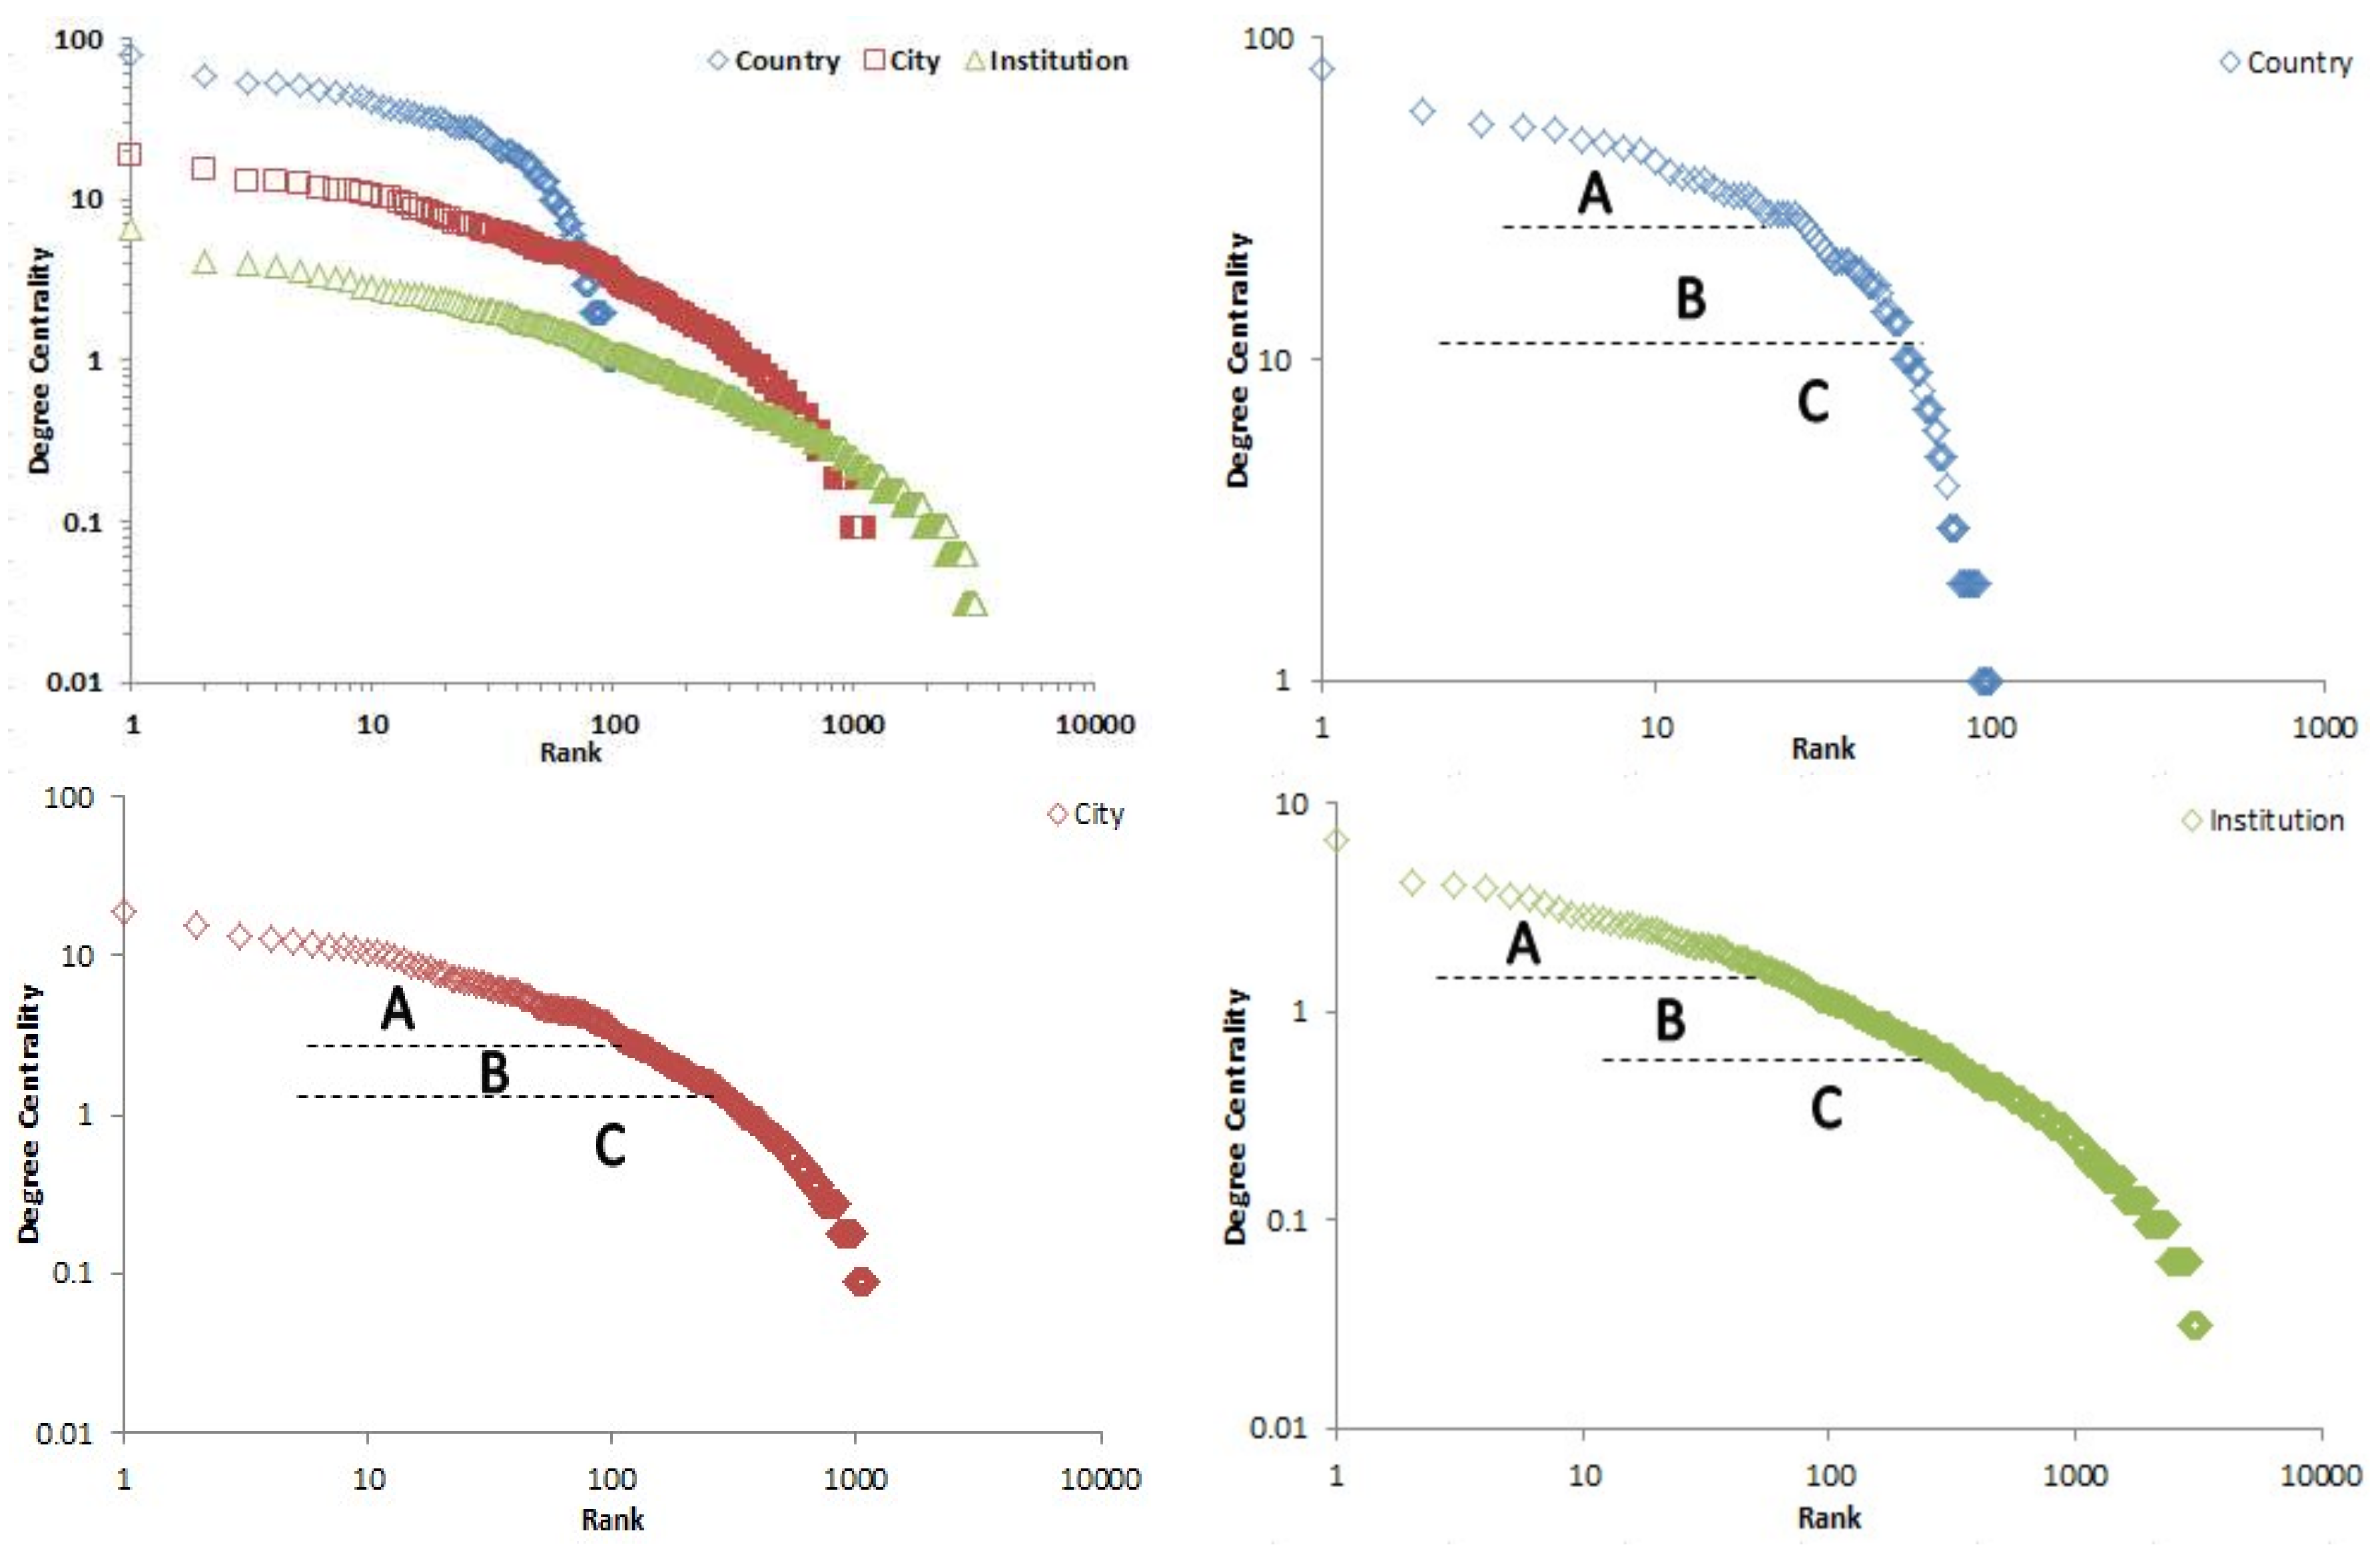
In the above analysis, we have examined the respective characteristics of all three levels of collaboration, but are there are any similarities among them? In this section we discuss the distribution characteristics of DC curves in the three kinds of cooperation networks. As shown in Figure 7, the vertical and horizontal axes represent one’s DC and rank, respectively. Three DC curves all show a long tail, with a great sagging shape in high-degree segments and a flat profile in low-degree segments. This is also consistent with the actual situation of cooperation networks [41]; that is, the core members are very limited, and more countries, cities and institutions are in the periphery, playing the role of participants.
Many actual situations exhibit regularity to some extent. As in the earlier studies, many indicators for scientometrics such as citation rate, number of papers, and betweenness centrality follow the Zipf-Pareto distribution in that the plot between indicator y and its rank are consistent with power law curve [42,43,44,45]:
y = Cr−α (C is a constant, α > 0)
In this case, if the distribution of DC follows a power law, then logDC = logC’ − α(logr). Let a = −α, b = logC’, x = logr, and y = logDC, and the logarithmic curve of DC should satisfy a straight line: y = ax + b. The log-transformed distribution of DC curves provides a detailed and accurate picture of the complex DC curves of the three kinds of cooperation networks (see Figure 8).
In accordance with the sub-section points of Figure 7, each segment of the three curves is analyzed by linear regression statistics. The results are shown in Table 6. The confidence coefficients are at least 95%, and the values of all adjusted r-squares are over 0.9, proving a higher goodness of fit of the model. In one way, the DC distribution of the three levels of international scientific collaboration networks in the IVV field follows the Zipf-Pareto distribution. From another perspective, the Zipf-Pareto distribution is universal in describing the scientific collaboration phenomenon of different levels. Meanwhile, the intensity of cooperation of all countries, cities, and institutions can be divided into high, medium, and low degrees according to the distribution characteristics of the Zipf-Pareto curve, as listed in Table 6. It is worth mentioning that the whole DC logarithmic curves of the city and institution levels are closer to straight lines than that of the country level; even the two adjusted r-square values of the city-level and institution-level curves are approximately equal (R2institution-level = 0.8876, R2city-level = 0.8682, R2country-level = 0.6933). DC curves reveal a group of actors’ locations in the collaboration network as well as their collaborative breadth and depth. It would appear that the collaborative characteristics of institutions are more similar to those of their respective cities than those of their countries. We speculate the reason is that one country or region comprises many cities, but every city may only have a few institutions responsible for IVV research.

5. Conclusions and Discussion

From the perspective of multilayered relation networks, this paper constructs a multilevel analytical framework of international scientific collaboration. We longitudinally examined the regional distribution, dynamic changes, and common themes of collaborations (at the country, city, and institution levels) of the IVV field, based on scientific publications from 2006 to 2013 collected from the WoS database. The results suggest that multilayered analysis helps provide a more comprehensive understanding of international scientific collaboration. The following conclusions are drawn from the analysis of the three levels of international scientific collaborations in the IVV field from 2006 to 2013.
The three kinds of collaboration networks all suggest strong core-periphery characteristics and dynamic structures. The values of degree centrality of collaboration networks are subject to segmented Zifp-Pareto distribution.
Although the number of multinational papers has shown an obvious increase in recent years and its proportion also exhibits an overall upward trend, the global scientific collaboration network of IVV is far from being complete and suggests strong core-periphery characteristics. Its center is formed by the United States and some European and Asian countries, while many other countries are in the periphery, playing the role of participants; and so it is with the city-level and institution-level collaboration networks. At the city level, for instance, the core members are very limited and include Atlanta, London and Tokyo. HL-type, LH-type, and LL-type cities have the most in number.
Also, the network positions of countries, cities and institutions vary with time: some present small fluctuations and others make considerable changes during the investigation periods; in terms of direction of movement, they moved from central to relative peripheral positions or in the opposite direction. For example, cities, such as London and Tokyo, and institutions, such as the University of Wisconsin and St. Jude’s Children’s Research Hospital, have always been on the cutting edge. Atlanta and the CDC have become collaborating centers of global IVV research, but some have slipped backwards, such as Memphis, TN, USA; Marburg, Germany; and Herts, United Kingdom.
Despite the regional imbalance of scientific papers distributed in the countries, cities, and institutions, the degree centrality distribution of the three levels of international scientific collaboration networks in the IVV field follows the Zipf-Pareto distribution. After that, the intensity of cooperation of all countries, cities, and institutions can be divided into high, medium, and low degrees according to the curves’ hierarchical characteristics.
It is known that there exist corresponding relationships among countries, cities, and institutions for geographical location; however, their associated categories, network locations, and changing trends are all non-conformal.
At first, all partner countries, cities, and institutions are classified into four types (HH, HL, LH, and LL); however, the associated categories of one institution, its city, and its country differ universally. Secondly, there is a real asymmetry between several cities and their countries’ positions in the corresponding collaboration networks. The United States remains substantially ahead at the country level; however, American cities are not always in the lead at the city level. This could be mainly due to more equally distributed research over the cities in the United States, in contrast to countries such as the United Kingdom, Canada, and Australia, which have highly concentrated and dependent research in some specific cities. In addition, there are some cities that have reached global prominence whose countries do not belong to the HH type, such as Auckland, New Zealand; São Paulo, Brazil; Mexico City DF, Mexico; and Seoul, Korea.
Because all three levels change with time, and the trend of each change is not similar, it is not appropriate to conclude how the three levels as a whole are behaving. The ranking changes of multinational paper counts of most institutions and their cities and countries did not take place at the same time. China, for instance, has formed good international collaboration networks in the IVV field. Owing much to emphasis placed on vaccine R&D expenditure and the demand for biomedical advances, the world has witnessed a spectacular rise and development in the international collaboration of Chinese cities in recent years. To be specific, six cities including Hong Kong, Beijing, Shanghai, Harbin, Tianjin and Shantou have entered the HH quadrant and in particular, Beijing has risen to the world’s fourth place from 2012–2013.Nevertheless, at the institution level, the universities, enterprises, and research institutes of Beijing did not even make the top 10. As for this situation, promoting the engagement of multileveled sectors in governance for health is required.
In the context of implementing a global action plan for influenza vaccines coordinated by the WHO and the sustainability of healthcare, each government should enhance the optimal design for policy relevance. Local governments should boost their presence in international scientific collaboration activities, as well as change and improve the external environment, as far as possible to fit into the global competition and opportunities. Every institution should identify partners that have wider collaborative breadth and deeper collaborative depth, then increase their engagement in international collaboration. On the basis of those endeavor, we consider that the ability of global IVV research can be enhanced to improve the preventive effect of IVV, which then can help us to prevent the disease, protect people’s health, and maintain social stability. Therefore, to some extent, it can make contribution on achieving the SDGs: ensure healthy lives and promote well-being for all ages. Furthermore, in order to achieve the sustainability development of healthcare, such as common development, coordinated development and efficient development, the specific manners to stimulate international collaboration in the IVV field still need further discussion. For instance, governments can establish a collaborative fund or a transnational scientific program for advancing the international collaboration in the IVV field.
This kind of multilevel analytical framework and analysis process can give an integrated pattern of international scientific collaboration. It can also be extended for utilization in other technological fields. Nevertheless, the paper has its limitations. First, the data of this study simply comprise published papers. In a follow-up study, patent data and vaccine business cases will be added. With this data, the relationship between scholarly literature and patent documents in the IVV field may be uncovered as a result of tracing citation links by both scientific fields and technological sectors. In addition, by matching the affiliated addresses both in papers and in patent data combinations, we intend to assess the extent of the overlap between the two communities and to identify the role of key institutions in the process of knowledge transfer. A well-tailored case study, such as the needle-free nasal spray formulation H5N1 flu vaccine test lesson, and well-developed collaboration network analysis for a specified country (or city or institution) should be helpful to the recognition of different collaborative patterns. Second, although we depict a cross-correlation map to show institutions that are working on similar topics, the relativity between the number of multinational papers and the similarity of research themes has not been analyzed fully and specifically by correlation analysis. Neither has the relationship between the three levels. What is their inner link? What is their external connection? Could they replace or supplement each other? These topics will be covered and probed in our future study.

Acknowledgments

This work was supported by the National Natural Science Foundation of China (grant numbers: 71573017, 71603019, 71273030), the Special Fund for Joint Development Program of Beijing Municipal Commission of Education, and the Basic Research Foundation of Beijing Institute of Technology (grant numbers: 20172142006).

Author Contributions

The manuscript was approved by all authors for publication. Yijie Cheng, Yun Liu and Xuanting Ye conceived and designed the study. Yijie Cheng and Xuanting Ye performed the experiments. Yijie Cheng and Xuanting Ye wrote the paper. Yun Liu, Xuanting Ye and Zhe Yan reviewed and edited the manuscript. I would like to declare on behalf of my co-authors that the work described was original research that has not been published previously, and not under consideration for publication elsewhere, in whole or in part. All the authors listed have approved the manuscript that is enclosed.

Conflicts of Interest

The authors declare no conflict of interest.

References

  1. Liu, T.X.; Peng, Z.-C. Possible Impacts of Influenza Pandemic on China’s Economy. J. Tsinghua Univ. Philos. Soc. Sci. 2007, 4, 11. [Google Scholar]
  2. Keogh-Brown, M.R.; Wren-Lewis, S.; Edmunds, W.J.; Beutels, P.; Smith, R.D. The possible macroeconomic impact on the UK of an influenza pandemic. Health Econ. 2010, 19, 1345–1360. [Google Scholar] [CrossRef] [PubMed]
  3. WHO. Up to 650 000 People Die of Respiratory Diseases Linked to Seasonal Flu Each Year. Available online: http://www.who.int/mediacentre/news/releases/2017/seasonal-flu/en/ (accessed on 17 April 2018).
  4. WHO. 10 Menaces sur la Santé Mondiale en 2018. Available online: http://www.who.int/features/2018/10-threats-global-heath/fr/ (accessed on 17 April 2018). (In French).
  5. Paul-Pierre, P. Emerging diseases, zoonoses and vaccines to control them. Vaccine 2009, 276, 6435–6438. [Google Scholar] [CrossRef] [PubMed]
  6. Guzman, M.V.; Sanz, E.; Sotolongo, G. Bibliometric study on vaccines (1990–1995) part I: Scientific production in iberian-american countries. Scientometrics 1998, 43, 189–205. [Google Scholar] [CrossRef]
  7. Garg, K.C.; Kumar, S.; Madhavi, Y.; Bahl, M. Bibliometrics of global malaria vaccine research. Health Inf. Libr. J. 2009, 26, 22–31. [Google Scholar] [CrossRef] [PubMed]
  8. Wiysonge, C.S.; Uthman, O.A.; Ndumbe, P.M.; Hussey, G.D. A bibliometric analysis of childhood immunization research productivity in Africa since the onset of the Expanded Program on Immunization in 1974. BMC Med. 2013, 11, 66. [Google Scholar] [CrossRef] [PubMed] [Green Version]
  9. Zhao, X.Y.; Sheng, L.; Diao, T.X.; Zhang, Y.; Wang, L.; Yanjun, Z. Knowledge mapping analysis of Ebola research. Bratislavskelekarskelisty 2014, 116, 729–734. [Google Scholar] [CrossRef]
  10. Olijnyk, N.V. An algorithmic historiography of the ebola research specialty: Mapping the science behind ebola. Scientometrics 2015, 105, 623–643. [Google Scholar] [CrossRef]
  11. Head, M.G.; Fitchett, J.R.; Lichtman, A.B.; Soyode, D.T.; Harris, J.N.; Atun, R. Mapping investments and published outputs in norovirus research: A systematic analysis of research funded in the United States and United Kingdom during 1997–2013. J. Infect. Dis. 2016, 213 (Suppl. 1), S3–S7. [Google Scholar] [CrossRef] [PubMed]
  12. Wagner, C.S.; Leydesdorff, L. Network structure, self-organization, and the growth of international collaboration in science. Res. Policy 2005, 34, 1608–1618. [Google Scholar] [CrossRef]
  13. Ye, X.; Liu, Y.; Porter, A.L. International collaborative patterns in China’s nanotechnology publications. Int. J. Technol. Manag. 2012, 59, 255–272. [Google Scholar] [CrossRef]
  14. Cheng, Y.; Liu, Y.; Fan, W. Research on the evaluation of nation nanotechnology innovation international level based on patent analysis. In Proceedings of the 2014 Portland International Conference on Management of Engineering & Technology (PICMET), Kanazawa, Japan, 27–31 July 2014; pp. 1373–1382. [Google Scholar]
  15. Bai, X.; Liu, Y. Exploring the Asian innovation networks (AINS) characteristics. Inf. Dev. 2017. [Google Scholar] [CrossRef]
  16. Zheng, J.; Zhao, Z.Y.; Zhang, X.; Chen, D.Z.; Huang, M.H. International collaboration development in nanotechnology: A perspective of patent network analysis. Scientometrics 2014, 98, 683–702. [Google Scholar] [CrossRef]
  17. Huang, Y.; Ma, J.; Porter, A.L.; Kwon, S.; Zhu, D. Analyzing collaboration networks and developmental patterns of nano-enabled drug delivery (NEDD) for brain cancer. Beilstein J. Nanotechnol. 2015, 6, 1666–1676. [Google Scholar] [CrossRef] [PubMed]
  18. Neal, Z. Differentiating centrality and power in the world city network. Urban Stud. 2011, 48, 2733–2748. [Google Scholar] [CrossRef]
  19. Guan, J.; Zhang, J.; Yan, Y. The impact of multilevel networks on innovation. Res. Policy 2015, 44, 545–559. [Google Scholar] [CrossRef]
  20. Chen, N.; Liu, Y.; Cheng, Y.; Liu, L.; Yan, Z.; Tao, L.; Guo, X.; Luo, Y.; Yan, A. Technology resource, distribution, and development characteristics of global influenza virus vaccine: A patent bibliometric analysis. PLoS ONE 2015, 10. [Google Scholar] [CrossRef] [PubMed]
  21. WHO. Global Action Plan for Influenza Vaccines. Available online: http://www.who.int/influenza_vaccines_plan/objectives/en/ (accessed on 17 April 2018).
  22. Yan, E.; Guns, R. Predicting and recommending collaborations: An author-, institution-, and country-level analysis. J. Informetr. 2014, 8, 295–309. [Google Scholar] [CrossRef]
  23. Ortega, J.L.; Aguillo, I.F. Institutional and country collaboration in an online service of scientific profiles: Google Scholar Citations. J. Informetr. 2013, 7, 394–403. [Google Scholar] [CrossRef]
  24. Bordons, M.; Aparicio, J.; Costas, R. Heterogeneity of collaboration and its relationship with research impact in a biomedical field. Scientometrics 2013, 96, 443–466. [Google Scholar] [CrossRef]
  25. Han, P.; Shi, J.; Li, X.; Wang, D.; Shen, S.; Su, X. International collaboration in LIS: Global trends and networks at the country and institution level. Scientometrics 2014, 98, 53–72. [Google Scholar] [CrossRef]
  26. Barnett, G.A.; Han, W.P.; Jiang, K.; Tang, C.; Aguillo, I.F. A multi-level network analysis of web-citations among the world’s universities. Scientometrics 2014, 99, 5–26. [Google Scholar] [CrossRef]
  27. Chen, K.; Yao, Q.; Sun, J.; He, Z.; Yao, L.; Liu, Z. International publication trends and collaboration performance of china in healthcare science and services research. Isr. J. Health Policy Res. 2015, 5, 75–79. [Google Scholar] [CrossRef] [PubMed]
  28. Lei, X.P.; Zhao, Z.Y.; Zhang, X.; Chen, D.Z.; Huang, M.H.; Zheng, J.; Liu, R.-S.; Zhang, J.; Zhao, Y. Technological collaboration patterns in solar cell industry based on patent inventors and assignees analysis. Scientometrics 2013, 96, 427–441. [Google Scholar] [CrossRef]
  29. Günther, R.; Levitin, L.; Schapiro, B.; Wagner, P. Zipf´s law and the effect of ranking on probability distributions. Int. J. Theor. Phys. 1996, 35, 395–417. [Google Scholar] [CrossRef]
  30. Gambaryan, A.S.; Robertson, J.S.; Matrosovich, M.N. Effects of egg-adaptation on the receptor-binding properties of human influenza A and B viruses. Virology 1999, 258, 232–239. [Google Scholar] [CrossRef] [PubMed]
  31. Wareing, M.D.; Tannock, G.A. Live attenuated vaccines against influenza; an historical review. Vaccine 2001, 19, 3320–3330. [Google Scholar] [CrossRef]
  32. Albert, N.; Miguel, M. Scientific production and international collaboration in occupational health, 1992–2001. Scand. J. Work Environ. Health 2004, 30, 223–233. [Google Scholar]
  33. Zheng, J.; Zhao, Z.Y.; Zhang, X.; Chen, D.Z.; Huang, M.H.; Lei, X.P.; Zhang, Z.; Zhao, Y. International scientific and technological collaboration of china from 2004 to 2008: A perspective from paper and patent analysis. Scientometrics 2012, 91, 65–80. [Google Scholar] [CrossRef]
  34. Annabeth, L. Propst. Think and explain with statistics. Technometrics 1988, 30, 233. [Google Scholar]
  35. Dodge, Y. The Oxford Dictionary of Statistical Terms; Oxford University Press: Oxford, UK, 2006. [Google Scholar]
  36. Freeman, L.C. Centrality in social networks conceptual clarification. Soc. Netw. 1978, 1, 215–239. [Google Scholar] [CrossRef]
  37. Freeman, L.C.; Roeder, D.; Mulholland, R.R. Centrality in social networks: II. Experimental results. Soc. Netw. 1979, 2, 119–141. [Google Scholar] [CrossRef]
  38. Prato, G.D.; Nepelski, D. Global technological collaboration network: Network analysis of international co-inventions. J. Technol. Transf. 2012, 39, 358–375. [Google Scholar] [CrossRef] [Green Version]
  39. Florida, R. Cities and the Creative Class; Routledge: Abingdon, UK, 2005. [Google Scholar]
  40. Wang, X.; Li, R.; Ren, S.; Zhu, D.; Huang, M.; Qiu, P. Collaboration network and pattern analysis: Case study of dye-sensitized solar cells. Scientometrics 2014, 98, 1745–1762. [Google Scholar] [CrossRef]
  41. Hou, Y.; Xia, Y.; Liu, T.; Lv, H. Research on Multi layered Scholarly Cooperation Network Based on Journal Articles and Patent. J. China Soc. Sci. Tech. Inf. 2014, 33, 1057–1066. [Google Scholar]
  42. Liming, L.; Lihua, L. Scientific publication activities of 32 countries.—Zipf-pareto distribution. Scientometrics 1993, 26, 263–273. [Google Scholar] [CrossRef]
  43. Wang, X.; Wang, W. Zipf-pareto distribution of medical papers from NSFC. Stud. Sci. Sci. 2006, 24, 47–49. [Google Scholar]
  44. Lin, D.; Chen, C.; Liu, Z. Statistical Characteristics of an Evolving Co-citation Network: The Distribution of Betweenness Centrality. In Proceedings of the International Conference on Scientometrics and Informetrics, Rio de Janeiro, Brazil, 28–31 July 2009; pp. 522–560. [Google Scholar]
  45. Lin, D.; Chen, C.; Zeyuan, A.L. Study on zipf-pareto distribution of the betweenness centrality of a co-citation network. J. China Soc. Sci. Tech. Inf. 2011, 30, 76–82. [Google Scholar]
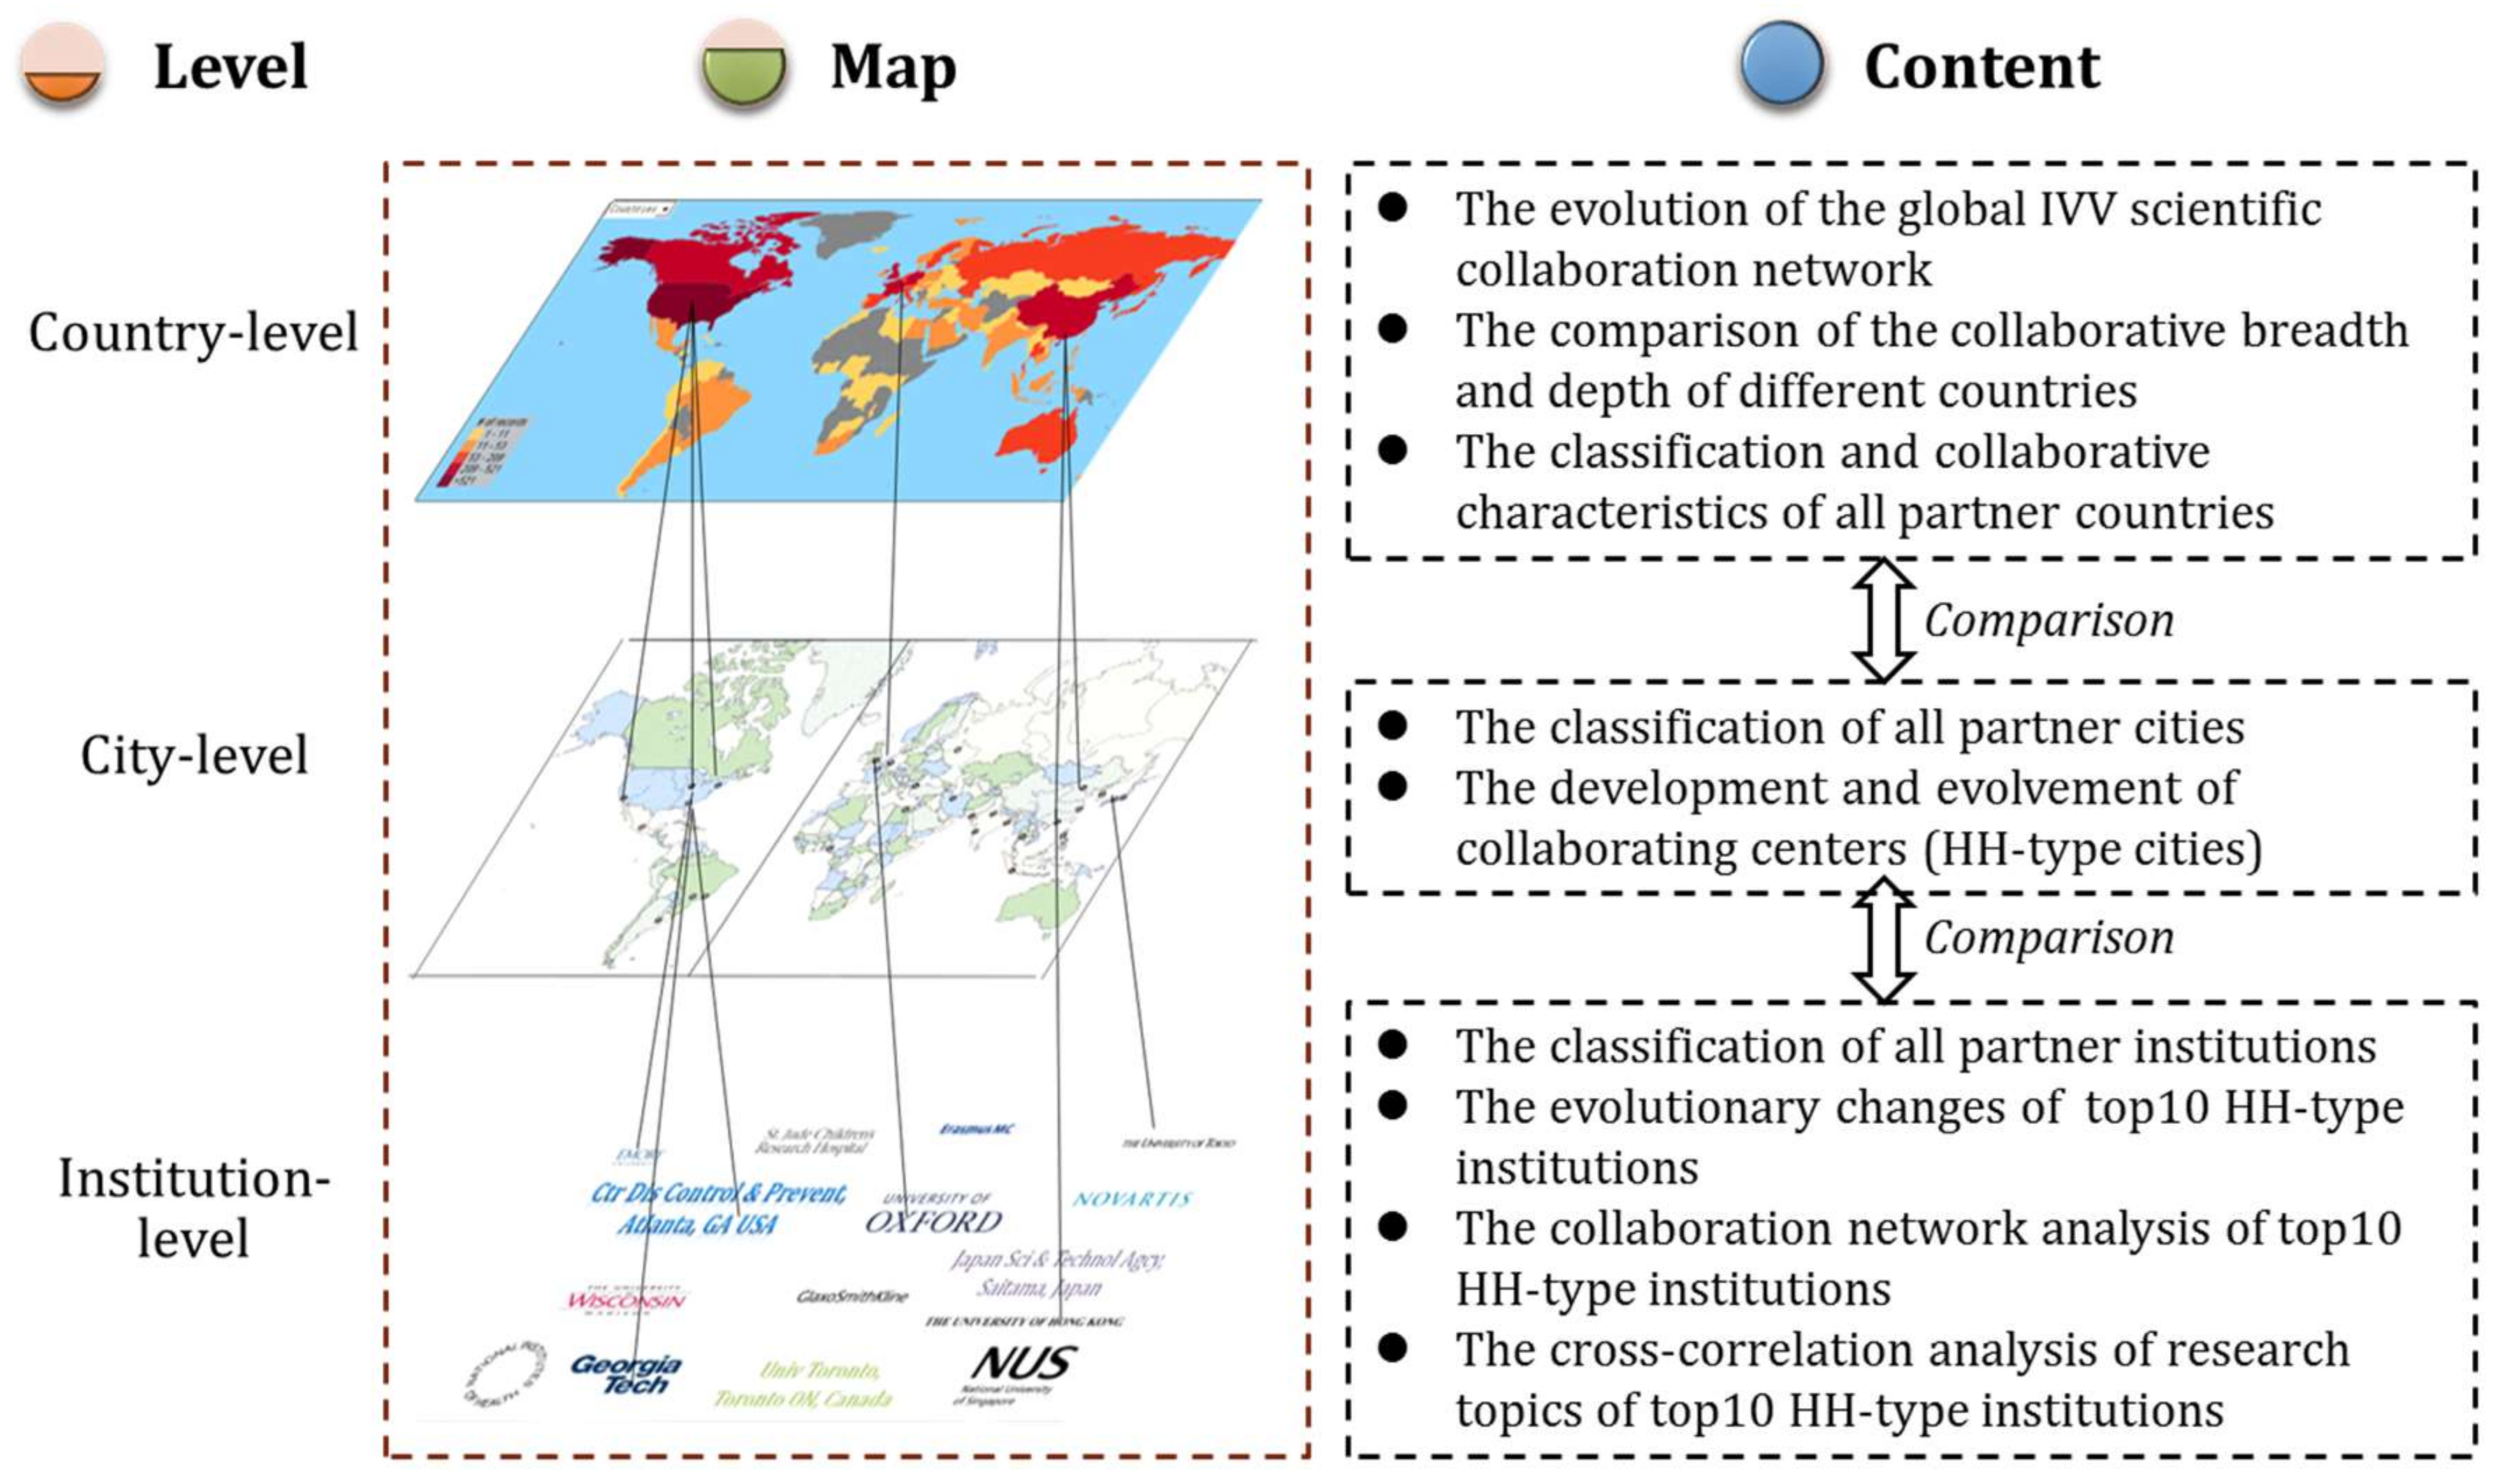
Figure 1. Collaboration levels.
Sustainability 10 01232 g001
Figure 2. The workflow of the data-collection process.
Sustainability 10 01232 g002
Figure 3. (a) Collaboration network of partner countries, 2006; and (b) collaboration network of partner countries, 2013.
Sustainability 10 01232 g003
Figure 4. Four bubble graphs of partner countries’ collaborative breadth and depth.
Sustainability 10 01232 g004
Figure 5. Collaboration network of the top 10 HH-type institutions.
Sustainability 10 01232 g005
Figure 6. Cross-correlation map of the top 10 institutions.
Sustainability 10 01232 g006
Figure 7. Degree centrality curves of three kinds of cooperation networks.
Sustainability 10 01232 g007
Figure 8. Degree centrality curves of three kinds of cooperation networks (log-transformed).
Sustainability 10 01232 g008
Table 1. Classification system of the IVV field.
CategoriesSubcategories
inactivated vaccineinactivated virus vaccine
split vaccine
sub-unit vaccine
live attenuated vaccinelive attenuated vaccine
recombinant vaccinerecombinant protein vaccine
recombinant vector vaccine
recombinant DNA vaccine
synthetic peptide vaccinesynthetic peptide vaccine
Table 2. The number of total papers and international collaboration papers in the IVV field.
Year20062007200820092010201120122013
Number of papers5896748159671188137013051359
Number of international collaboration papers119154179220275303305323
Percentage (%)20.2022.8521.9622.7523.1522.1223.3723.77
Table 3. Four types of partner countries.
TypeCBICDIImportance of NodesCharacteristics
HHHighHighCentralExtensive knowledge communication
HLHighLowSignificantA wide group of partners with lesser concentration and depth
LHLowHighGeneralIn-depth knowledge communication with certain partners
LLLowLowFringePlay a relatively minor role in knowledge exchange activities
Note: Below-average CBI or CDI values are labeled as low while above-average values are high.
Table 4. The evolution of geographic centers of the country-level collaboration network.
Rank2006–20072008–20092010–20112012–2013
Collaborating CentersCollaborating CentersCollaborating CentersCollaborating Centers
1Tokyo, JapanLondon, UK ↑Atlanta, GA, USA ↑Atlanta, GA USA
2London, UKTokyo, Japan ↓London, UK ↓London, UK
3Memphis, TN, USAAtlanta, GA, USA ↑Tokyo, Japan ↓Tokyo, Japan
4Lyon, FranceVic, Australia ↑New York, NY, USA ↑Beijing, China ↑
5Vic, AustraliaSiena, Italy ↑Beijing, China ↑Boston, MA, USA ↑
6Paris, FranceBerlin, Germany Singapore, Singapore ↑Bethesda, MD, USA ↑
7Atlanta, GA, USARotterdam, The Netherlands Bethesda, MD, USA ↑Hong Kong, China ↑
8Bethesda, MD, USAMarburg, Germany ↑Lyon, France ↑Madison, WI, USA ↑
9Athens, GA, USAMemphis, TN, USA ↓Memphis, TN, USASeoul, Korea ↑
10Moscow, RussiaBeijing, China Berlin, Germany ↓Paris, France ↑
11Seoul, KoreaNew York, NY, USA ↑Toronto, ON, Canada ↑Vic, Australia ↑
12Birmingham, AL, USAMadison, WI, USA ↑Madison, WI, USANew York, NY, USA ↓
13Madison, WI, USABoston, MA, USA ↑Saitama, Japan ↑Saitama, Japan
14Hokkaido, JapanNSW, Australia Paris, France ↑Bangkok, Thailand ↑
15Boston, MA, USAMoscow, Russia ↓Siena, Italy ↓Hanoi, Vietnam ↑
16St Louis, MO, USALyon, France ↓Boston, MA, USA ↓Cambridge, MA, USA ↑
17Siena, ItalySt Louis, MO, USA ↓Marburg, Germany ↓Memphis, TN, USA ↓
18Marburg, GermanyHong Kong, China Oxford, UK ↑Siena, Italy ↓
19Stockholm, SwedenWinnipeg, MB, Canada ↑Hong Kong, China ↓Singapore, Singapore ↓
20New York, NY, USAToronto, ON, Canada Vic, Australia ↓NSW, Australia ↑
21Freiburg, GermanyOxford, UK Rotterdam, The Netherlands ↓Lyon, France ↓
22Herts, UKSaitama, Japan ↑Athens, GA, USA ↑Oxford, UK ↑
23Utrecht, The NetherlandsSingapore, Singapore ↑Cambridge, MA, USA Mexico City DF, Mexico ↑
24Gaithersburg, MD, USALouvain, Belgium Shanghai, China ↑Cambridge, UK ↑
25Bangkok, ThailandFife, UK Winnipeg, MB, Canada ↓Ottawa, ON, Canada ↑
26Saitama, JapanMarcy Letoile, France Hanoi, Vietnam ↑Shanghai, China ↓
27Emeryville, CA, USARome, Italy NSW, Australia ↓Winnipeg, MB, Canada ↓
28Gothenburg, SwedenQld, Australia Geneva, Switzerland ↑Toronto, ON, Canada ↓
29Pearl River, NY, USAShanghai, China Utrecht, The Netherlands ↑Birmingham, AL, USA ↑
30Edmonton, AB, CanadaBaltimore, MD, USA Rome, Italy ↓Vienna, Austria
31Basel, SwitzerlandAarhus, Denmark Amsterdam, The Netherlands Los Angeles, CA, USA ↑
32Winnipeg, MB, CanadaPearl River, NY, USA ↓Baltimore, MD, USA ↓Seattle, WA, USA ↑
33Geneva, SwitzerlandGhent, Belgium Hamilton, ON, Canada Baltimore, MD, USA ↓
34Zurich, SwitzerlandAuckland, New Zealand Cambridge, UK Zurich, Switzerland ↑
35Antwerp, BelgiumRixensart, Belgium Philadelphia, PA, USA Geneva, Switzerland ↓
36Bilbao, SpainSan Diego, CA, USA Freiburg, Germany ↑Wavre, Belgium ↑
37Petah Tiqwa, IsraelHokkaido, Japan ↓Seattle, WA, USA Madrid, Spain
38Marseille, FranceHaerbin, China Haerbin, ChinaLa Jolla, CA, USA ↑
39FIN-Tampere, FinlandHerts, UK ↓Stockholm, Sweden ↑Philadelphia, PA, USA ↓
40Ann Arbor, MI, USAHanoi, Vietnam Vancouver, BC, Canada ↑Rotterdam, The Netherlands ↓
41Farmington, CT, USABirmingham, AL, USA ↓Montreal, PQ, Canada Ann Arbor, MI, USA ↑
42Surrey, UKCincinnati, OH, USA Pittsburgh, PA, USA Stockholm, Sweden ↓
43Singapore, SingaporeShiga, Japan ACT, Australia Cincinnati, OH, USA ↑
44Milan, ItalyMunster, Germany St Petersburg, Russia Osaka, Japan
45W Midlands, UKWurzburg, Germany Ames, IA, USA Moscow, Russia ↑
Note: Star: When a city first appears in the HH quadrant, it is marked by a star. Arrow: If a city rose in rankings, the trend shows as an upward arrow to indicate that the trend is rising, and as a downward arrow to indicate that the trend is falling.
Table 5. Top 10 institutions in the HH quadrant.
Top10 InstitutionsTotal #All Years2006–20072008–20092010–20112012–2013
St Jude Childrens Hosp, Memphis, TN, USA7011217
Ctr Dis Control & Prevent, Atlanta, GA, USA6822441
Univ Tokyo, Tokyo, Japan6735122
Univ Wisconsin, Madison, WI, USA6344333
Emory Univ, Atlanta, GA, USA465LL764
Univ Oxford, Oxford, UK396HL111110
Univ Hong Kong, Hong Kong, China387HLHL146
Erasmus MC, Rotterdam, The Netherlands368HL655
Japan Sci&Technol Agcy, Saitama, Japan3391912108
Univ Toronto, Toronto, ON, Canada3310LL1079
Note: When an institution is not in the HH quadrant in a particular time period, we substitute its ranking with its quadrant for that time period. Total # represents the total number of multinational papers.
Table 6. The hierarchical characteristics of Zipf-Pareto distribution of three degree centrality curves (log-transformed).
IntervalRankABAdjusted R SquareDegreeNumber of NodesShare (%)
Country levelA1~21−0.30701.90360.966329~802120.79
B22~50−0.88002.67070.953214~282928.71
C51~101−0.88008.28920.96221~135150.50
City levelA1~97−0.40381.38980.97473.62~18.914978.77
B98~258−0.85732.23860.99201.538~3.52916114.56
C259~1106−1.95495.02840.93930.09~1.44884876.67
Institution levelA1~53−0.32110.78250.98541.63~6.583531.66
B54~228−0.58231.21820.99570.721~1.5991755.48
C229~3191−1.17342.83040.91170.031~0.69296392.85