Article

The Management of Unsold Food in Outdoor Market Areas: Food Operators’ Behaviour and Attitudes

1
Department of Management, University of Turin, Corso Unione Sovietica 218 bis, 10134 Turin, Italy
2
NatRisk—Research Centre on Natural Risks in Mountain and Hilly Environments, University of Torino, Largo Paolo Braccini 2, Grugliasco, 10095 Turin, Italy
3
ESOMAS Department, University of Turin, Corso Unione Sovietica 218 bis, 10134 Turin, Italy
*
Author to whom correspondence should be addressed.
Sustainability 2018, 10(4), 1180; https://doi.org/10.3390/su10041180
Submission received: 6 March 2018 / Revised: 30 March 2018 / Accepted: 12 April 2018 / Published: 14 April 2018
(This article belongs to the Special Issue Sustainable Agribusiness and Food Supply Chain)

Abstract

:
Food wastage has been widely discussed and investigated from different perspectives in literature. The EU-28 produces about 88 million tonnes of food wastage every year, making the awareness of this phenomenon a vital matter. This paper focuses on the outdoor-market operators’ perception and behaviour towards the food waste phenomenon in a particular phase of the agro-food supply chain. It assesses the different approaches used to manage unsold produce and its destination. A sample of 214 market retailers in the Greater Torino market areas of Italy were identified, to whom a questionnaire was administered by interview to analyze the main actors involved in the food-wastage process and profile them according to their perception, behaviour, and attitude. The results show that there are three distinct kinds of market operators, i.e., farmers, peddlers, and hybrids. Their attitudes and behaviour towards unsold food differ, as does their inclination towards a sustainable approach, which depends on their personal experience and role in the supply chain. Moreover, the results provide some relevant elements that may contribute to improving the management of the food-waste phenomenon. Moreover, they bring some useful evidence to light that could lay the basis of more effective tools to be put at the disposal of various institutions.

1. Introduction

Food waste is a worldwide phenomenon. It shows no signs of diminishing and brings with it economic, environmental and social consequences. However, as it has been long overlooked, there is ever more waste at all levels of the food chain. According to the European Union, “food waste” can be defined as, “All the foodstuffs discarded from the food supply chain for economic or aesthetic reasons or owing to the nearness of the ‘use by’ date, but which are still perfectly edible and fit for human consumption and, in the absence of any alternative use, are ultimately eliminated and disposed of, generating negative externalities from an environmental point of view, economic costs and a loss of revenue for businesses” [1].
A distinction may be made between food loss and food waste. Food loss starts in the early phases of the supply chain, i.e., during primary production and processing, whilst food waste occurs in the last phase of the food chain during distribution and consumption, i.e., wholesale and logistics, retail and market, food service, and household [2]. Furthermore, some authors state that food wastage is a combination of food waste and food loss as a whole. Others state that food loss means the decrease in quantity and/or quality of edible food available for human consumption. Food waste is a part of food loss and refers to the discarded edible food from the supply chain due to free choice and/or negligence by its actors [3,4].
The Waste Resources Action Programme (WRAP) [5] reported that food loss can be classified according to its level of avoidance, i.e., into avoidable, potentially avoidable, and inevitable. Waste may also be made-up of “food products discarded by the agro-food chain, which have lost commercial value, but which may still be destined for human consumption” [6] as their food quality requirements remain unaltered [7]. According to Smil [8], food waste can also be the result of excessive nutrition of individuals, i.e., how much a person consumes and how much, in reality, is needed.
Food waste is also defined as “the result of the lack of value attributed to food production and to food itself during all the various phases of the food chain” [9]. Therefore, food waste may start even before primary agricultural production, as the quantity of foodstuff produced under the current economic system is organized according to set commercial agreements which do not always correspond to the actual needs of the demand [10].
Whilst, on the one hand, it may seem difficult to arrive at a univocal definition of the concept of waste and/or food loss, it is equally true that the genesis of this phenomenon involves all the subjects taking part in the primary production at various levels. These involve processing, handling, distribution, and the consumption of food products [11]. WRAP divides the concept of waste within the food chain into four different phases [5]. These are production and processing, retail, food service, and household consumption. However, according to Gustavsson et al. [12] and Verghese et al. [13] there are five phases, i.e., agricultural production, post-harvest production and storage management, processing and packaging, distribution (wholesale and retail), and consumption.
On the basis of the aforementioned data, this study covers the “distribution phase” and the related concept of “food waste.” The scope of this paper is to investigate the farmers’ and peddlers’ perception of the food waste phenomenon and how they integrate the circular economy concept. In this paper, the term “farmers” means the primary fruit and vegetable producers that sell their products on the outdoor markets. The term “peddlers” means those retailers who sell other people’s products, e.g., fruit and vegetables on the outdoor markets.

2. Literature Review

2.1. Food Wastage

The amount of food waste has been estimated by the Institution of Mechanical Engineers (IME) as being 1.2–2 billion tonnes/year, equal to 30–50% of global food production [14]. A more recent study has estimated global food waste as being 1.6 billion tonnes/year, where 1.3–1.6 is edible, for a commercial value of $750 million American [15]. The EU-28 estimated food waste at 88 million tonnes in 2012, covering both edible food and inedible parts associated with the food. It also reported a total waste of 173 kg per person/year, meaning that the European population was wasting 20% of the total amount of food produced. The household produces the most food waste, i.e., 47 million tonnes/year, followed by the processing phase (17 million tonnes), food services (10.5 million tonnes), primary production (9.1 million tonnes), and distribution (4.6 million tonnes) [16]. It has been hypothesized that if initiatives to reduce food waste are not taken, then the future estimate would increase by 40%, reaching 126 million tonnes/year. The world food waste estimate was assessed of 1.6 billion tonnes as reported in the Council of the European Commission search [17].
The current production and consumption models appear to be unsustainable due to the intensive use of natural resources and the continuous waste coming from the production phases [18]. A supply chain inspired by the principles of a circular economy, rather than traditional supply chains, could well provide a solution to this problem, in as much as it would allow for a reduction in the environmental and economic costs related to the disposal of food waste [19].
The concept of circular economy, i.e., an economic system able to regenerate itself seamlessly, can be synthetically defined as cradle-to-cradle [20]. It took hold in the 70s [21,22] and was more precisely defined at the end of the 80s by Pearce et al. [23], who emphasize the importance of natural resources for modern economy [24]. A current and common adopted definition is provided by the Ellen MacArthur Foundation, stating that a circular economy is “an industrial economy that is restorative or regenerative by intention and design” [22]. This concept can also be extended to the food chain and, at least at the theoretical level, could be a possible response to the phenomenon of food waste and a resource to access more sustainable food systems, e.g., by strengthening collaborative relationships between agro-food companies [25,26]. Recent studies in the agro-food sector have stressed the need for alternative agro-food networks capable of imposing themselves and representing a response to the collective demand for transition towards more sustainable practices [27].

2.2. Supply Chain Context

Food waste affects the global society, environment, and economy. Particularly, the global population is a key to understanding the size of the problem [28]. Some studies have estimated that global food production must increase by at least 50%, i.e., reaching 9.3 billion by 2050, if food security for the world population is to be guaranteed [29,30]. Waste management can be efficacious only if there is better management all along the food system chain and a better use is made of the limited resources available [31].
The agro-food supply chain has a pivotal role in the food-wastage phenomenon [4,5,12,13,32]:
(a)
production loss takes place during harvesting;
(b)
poor post-harvest management leads to degradation and accidental spillage during transportation and storage;
(c)
the processing stage generates loss due to spillage and degradation during industrial processing e.g., washing, peeling, slicing, boiling, and packaging;
(d)
the distribution stage generates waste due to multiple causes, including inappropriate orders and incorrect demand forecasts in the market system, e.g., retailers and outdoor markets;
(e)
the consumption phase generates waste at a household and foodservice level.
Food waste takes place in the first phases of the food chain, e.g., the post-harvest phase, due to financial, structural, storage, and transport barriers, amounting to 4–16% of the total waste in low-income countries. In the middle-high income countries, food waste is most prominent in the last phases of the food chain. On the one hand, the consumers’ behaviour may be influenced by rules and habits that, in some cases, define too restrictive quality and aesthetic standards, e.g., expiring ‘best-before-dates’. On the other, farmer/retailer sales agreements may contribute to the amount of farm crops being wasted. The total quantity of consumer food waste was 222 million tonnes/year in the EU countries, almost equal to that of the net total food production in sub-Saharan Africa, i.e., 230 million tonnes/year [12].
One third of global food production is lost between the food production and consumption phases, for an estimated value of $1 trillion American [33]. The US statistics show that organic waste accounts for the second largest percentage of waste dumped into landfills. Noteworthy is the fact that this quantity of food waste is 30–40% of the total food produced in the US, equal to more than 20 kg of food per person, per month [34]. The retail and consumer US food losses were estimated at $161.6 billion American, in 2010 [35]. The highest loss was observed in the following food categories: “meat and fish” (30%), “vegetables” (19%), and “dairy products” (17%), equal to $27 billion American. The total loss of food amounts to 387 billion calories per day no longer available to the consumer.
Food loss and waste take place in every stage of the supply chain and may depend on specific factors belonging to a particular country, i.e., the economic and climatic conditions, production systems and infrastructures, and the market and consumption trends. Numerous studies have been carried out on the analysis of food waste in different phases of the supply chain, showing their costs and negative externalities. These include studies on food waste along with the entire supply chain in Switzerland [36] and in food services [37], the different product categories that contribute to the generation of waste [38], the household-waste costs in South Africa [39], and the elements involved in the production of food waste [40].
Some studies reported on food waste in the distribution phase [11] and identified some factors and elements that influence food loss in retail stores [41,42,43] and the tomato chain and related loss/waste in large-scale distribution [44]. Another report suggested how food waste could be avoided in food retailing [45].

2.3. Conceptual Framework

Numerous studies have reported on farmers/peddlers and their activities. Some of them reported on farmers and food [46,47,48,49], food security [50,51], the willingness to pay more for local food [52], crops [49], genetic improvement [53], or commercialization of waste-based organic fertilizers [54]. Others discussed the farmers’ opinion on the effect of climate [55,56,57], policy implementation at a local level [58], or crops [59,60]. Peddlers were enrolled into studies dedicated to food safety [61,62,63], food quality [64], commercial fraud [65], food value chains [66,67,68,69], market rules [70,71], or sociological and historical concerns [72,73,74]. Urban marketplaces have been studied for food security [75,76] and food safety [77]. Other studies were related to the density of food outlets [78,79], urbanism and social spaces [80], and foodservice comparisons [81].
A Scopus database search revealed no studies that linked peddlers and topics such as food waste and circular economy. Some studies reported on farmers, food waste, and circular economy, with particular reference to food recovery programmes and their efficacy in reducing food insecurity due to “food waste” in the marketplace [82] and on the market farmers’ perception of food waste [83]. When the terms “farmers” and “circular economy” were searched simultaneously, it was seen that some farmers did not know anything about the circular economy [84], the costs of upgrading agricultural activities [85], the creation of a bio-based circular economy model approach to transform foodstuff supply chains [19], and the importance of organic production to improve the competitiveness of small farmers [86]. When the terms “farmers’ market” and “unsold products” were linked, the results showed that small-scale vegetable farmers should implement a Corporate Social Responsibility (CSR) model if they are to fight market information asymmetry and the related low commercial value of their production [87].
Some studies reported that it is essential to reduce food loss and food waste for the question of food security [75]. This can be done by using the fruit and vegetable waste at a retail and consumer level (supermarkets and food markets) as substrates in bioprocesses [88] to produce organic fertilizers [89,90], as long as this waste is treated correctly to reduce the environmental impact [91]. Compulsory regulation can set some quality standards to reduce waste [92]. Some private initiatives, such as food-recovery programmes to help needy persons, may also decrease waste [82] as would the production of foodstuff with the fruit and vegetables not considered aesthetic for commercial use [93]. Beausang et al. [83] reported that some farmers did not know the extent of the food waste phenomenon and did not consider it an issue of primary concern. They even perceived food waste to be an intrinsic part of farming and, as such, do not routinely record how much waste they produce. Furhter, they are unable to provide reliable estimates for their food waste and/or loss.
If effective initiatives to reduce the food-waste phenomenon are to be implemented, it must be clear who exactly is involved in each particular phase of the food supply chain, as well as what potentially influences their perception.

3. Study Area and Methods

This paper analyzes the actors involved in the retail phase of the food supply chain in outdoor markets, i.e., farmers and peddlers, to identify their behaviour and attitudes toward food waste. It also details how much attention they pay to the concept of food waste and managing their unsold food in a market context. The study group included farmers and peddlers operating in markets in the area known as Greater Torino (Torino Città Metropolitana), i.e., the Commune of Torino and its Province. Torino is the city of the Salone del Gusto and Terra Madre, the most famous Slow Food events [94,95,96,97], and Eataly [98,99,100,101,102], the only Italian distribution chain of national high-quality foodstuffs with an international chain of stores. The territory of Greater Torino hosts 432 outdoor markets and 2/3 are mainly dedicated to foodstuffs. Further, the Commune of Torino hosts 42 local markets, the largest and most historical being Porta Palazzo [103]. This market has at least 1000 operators over a surface of 49,991 m2.
The study sample included the most important street markets in the Greater Torino area. The inclusion criterion was markets with at least 50 sellers. A total of 27 fruit and vegetable markets were included: the fruit and vegetable markets of Porta Palazzo (farmers’ market and the peddlers’ fruit and vegetable market), Baltimora, Benefica, Brunelleschi, Chieti, Cincinnato, Crocetta, Don Grioli, Guala, Nitti, Madama Cristina, Pavese, Racconigi, Santa Giulia, Sebastopoli, and Svizzera were studied in the Commune of Torino. Vegetable markets in the Province of Torino, i.e., Carmagnola, Chieri, Chivasso, Collegno, Giaveno, Moncalieri, Orbassano, Pianezza, Pinerolo, Rivalta, and Rivoli also met the inclusion criterion. Details of the questionnaire design are in Section 3.1. and the statistical methods in Section 3.2.

3.1. Questionnaire Design

In order to collect data and information in line with the objective identified, the authors interviewed operators using a questionnaire with closed questions. This provided the interviewers with a homogeneous guide and the closed questions gave uniform data to be statistically elaborated. If there were any unanswered questions, the question/s were put again during the individual interviews to understand why. It was found that some sellers were not interested in the topic or did not know what to say about it.
A preliminary version of the questionnaire was pretested on 16 farmers and peddlers operating at the Porta Palazzo market, to detect any mistakes and assess any structural weaknesses [104,105]. This step was very important because, on the basis of results obtained, the authors were able to identify another kind of relevant seller, hybrids, and to make few more adjustments to the questionnaire. Hybrids are farmers that mainly sell their own fruit and vegetable products but sometimes also buy the fruit and vegetable products they sell from others.
The final version of the questionnaire was divided into three parts. The first part collected the interviewees’ demographic, social, and educational/formative information, e.g., gender, age, municipality of residence, nationality, qualification, education, and their activity, e.g., license and number of market days per year.
The second part concerned the characteristics of food waste and the interviewees‘ perception of this phenomenon. The idea was that of understanding exactly what each of them thought about waste. Questions included: if they thought that reducing waste could offer economic and/or environmental/social advantages, what they could do to reduce waste and make the best possible use of their unsold products. It was then asked if they had any knowledge of the waste-management programmes already adopted to this end in Torino.
The third part evaluated unsold-food-product management, evidencing specific behaviour and attitudes. The last questions in this section covered whether the interviewees would be willing to donate what they had not sold for distribution to the needy on a regular basis, be it daily, weekly monthly, or seasonally if it were organised on a large-scale level project. If they were willing to do so, they were asked if they would do it without any kind of return or if they expected perks like reduced costs for stalls and/or parking areas etc.
A total of 214 food operators, i.e., farmers, peddlers, and hybrids replied to the structured interviews [106] during the summer of 2017. The study group was recruited directly at the marketplaces [107] throughout the day, from 6 a.m. to 8 a.m.
The interviews, which took an average of 30 min, were aimed at collecting information on the market operators’ activities. Although all the questions were asked, their order was sometimes changed during the individual interviews, as the interviewees sometimes began to answer one question and included something that another question would have asked. This is in line with other authors and, as aforementioned, it was possible to collect extra data [108,109]. The interviewers asked the questions, recorded the answers, and made note of the main topics. The interview results were then polled and divided up equally between the authors, who analysed them separately so as not to influence one another [110]. The results of the analysis were then compared and the main points identified.

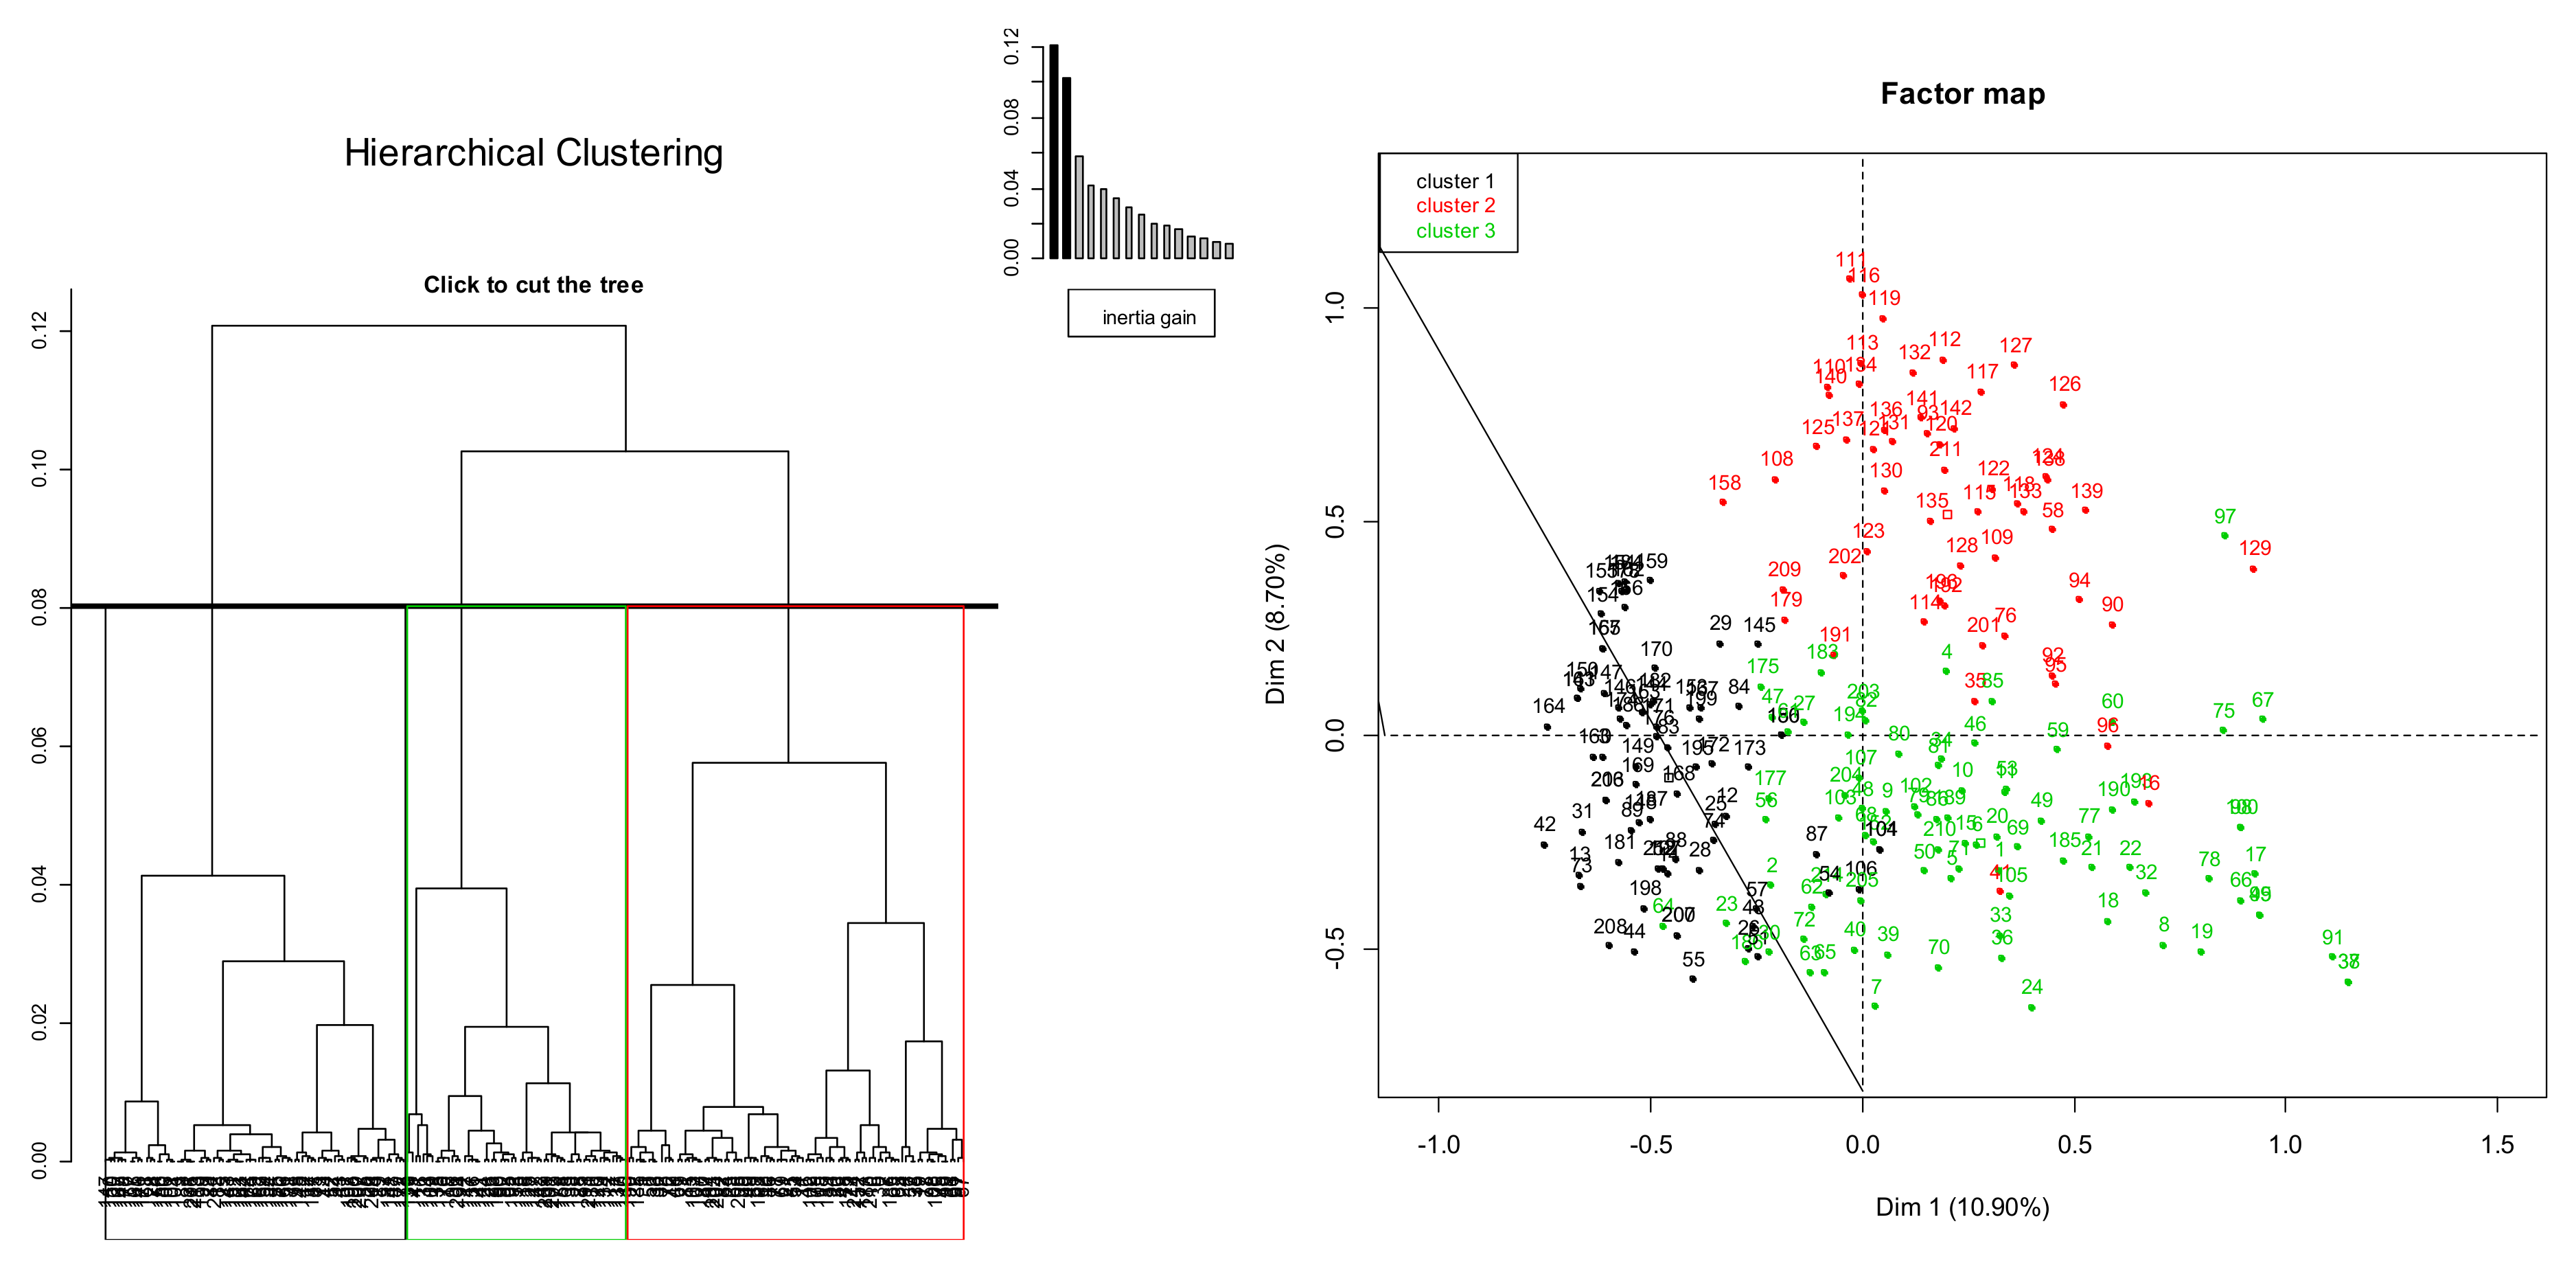
3.2. Statistical Method

The scope of this study was to identify and qualify the market operators’ perception and behaviour as to unsold food management. In this case, the data were explored by multivariate statistical techniques to reach a joint framework on the relationships among the variables.
First, a set of quantitative variables corresponding to four questions—based each on a 10-point Likert scale—was considered to obtain four response profiles. In this case a Hierarchical Cluster Analysis (HCA), using squared Euclidean distance as a similarity measure and the Ward method, was applied to group the answers by response affinity. The profiles obtained were considered as four levels of a qualitative variable, also used for further analyses. Second, a Multiple Correspondence Analysis (MCA) was used to consider the main qualitative variables as a whole, including profile membership from the previous analysis. The MCA technique is used to detect and represent underlying structures in a dataset made-up of qualitative variables. R software v3.4.4 (The R Foundation, Vienna, Austria), FactoMineR [111] and CA [112] packages were used for the analyses. Third, using the dimensions obtained through the MCA as new quantitative variables, a HCA (again using squared Euclidean distance as a similarity measure and the Ward method) was performed in a definitive way to identify the natural groups of the sample respondents in order to qualify their different activity styles.

4. Findings

The study sample included a total of 214 food operators, 71.5% male and 28.5% female; 54.21% of them live in the Province of Torino, 36.92% in the City of Torino, and 8.8% in the other provinces of the Piedmont Region. The age distribution was evenly spread across ages: 30.37% were in the 36–45-year-old range, 26.17% > 55, 22.90% 46–55, and 20.56% < 36. A total of 85.51% of the operators were Italian, 13.08% Extra-EU (Africa and Asia), and 1.41% EU (Romania and France). Their education level varied: 47.66% had left school at 14; 35.51% had a high school certificate; 14.02% had a primary school certificate, and 2.34% had a degree. A total of 35.98% of the interviewees worked at Porta Palazzo market, 34.58% in other markets in the city of Torino, and 29.44% in the Province of Torino (Table 1).
In line with the established method, an HCA with four quantitative variables was applied, including: how wastage was considered, the influence wastage had on activities, how much was wasted in the interviewees’ market activities, and how useful unsold products were in daily activities. Consequently, four groups were set-up:
(1)
“Prodigal”—This group of food operators (50.00% of the sample) produces a lot of waste and is not interested in reuse or recycling activities;
(2)
“Parsimonious”—This group of food operators (21.96% of the sample) are careful not to create waste and do not reuse what wastage they do produce;
(3)
“Active”—Although this group of food operators (16.36% of the sample) does produce waste food, they reuse or recycle their waste products;
(4)
“Indifferent”—This group of food operators (11.68% of the sample), is not interested in wastage because all of them gave incomplete answers to our questions and when asked why, during the interviews, they declared that they were not interested in this topic. Therefore, they were identified as a residual group.
An MCA was then performed using the variables in Table 1 on the basis of the profiles previously obtained. The variable “Food wastage definition” was obtained by recoding the results of an open question dedicated to the individual perception of food wastage. The different meanings of food wastage were then categorized as follows:
Wastage: food wastage that occurred along the whole food supply chain.
Waste: food wastage that occurred at the end of the food supply chain i.e., foodservices and household consumers.
Loss: food wastage that occurred at the start of the food supply chain, i.e., food producers, food industries and retailers.
Reuse: food wastage in the form of unsold food that can be re-used.
Unsold: food wastage produced by the unsold food products.
Wrong: an incorrect management of food waste by consumers.
Cultural limit: the lack of knowledge as to the elementary concepts of food wastage.
The horizontal axis in Figure 1 shows—from left to right—a progression in the density of farmers and workers who are both farmers and peddlers, as well as the trend in density of interviewees who live outside Torino. The right part of the map depicts where there is more interest in reusing wastage in an organic form within activities. The vertical axis shows the farmers (only) on the top and the hybrids, i.e., both farmers and peddlers, who are on the bottom right-hand side of the graph. Food operators, who are only peddlers are shown on the bottom left-hand side of the graph, were a higher density of this category.
Overall, it can be seen that the map assumes a sort of triangular form and the vertex positions are strongly influenced by the three types of activities carried out, as previously reported herein.
Most of the peddlers live and work in Torino and are indifferent to recycling activities and the wastage of products (PRF_Indifferent). One way to stimulate their interest could be that of involving them in donating to associations (HOW_DonNoProfitYes).
The top right-hand side shows that most of the farmers are residents of the Province of Torino (RESID_ProvTO) or outside it (RESID_OutsideTO). They are actively involved in recycling activities, i.e., the use of unsold food for compost manure (HOW_ReuseOrgFormYes) and the donation to other families (HOW_DonFamilyYes), and perceive wastage as reuse (FWD_reuse) and also unsold (FWD_unsold).
The bottom right-hand side shows hybrids who work in the Province of Torino (MK_OutsideTO). They are involved in ecological and recycling activities (PRF_Active; HOW_ReuseOrgFormYes) and perceive wastage firstly as a loss (FWD_loss) and secondly as a cultural limit (FWD_cultural_limit).
The category of owners (EMPLOYER) can be seen in the centre of the graph, i.e., in an average position having a counterpart position more on the bottom in the category of employees (EMPLOYEE). On average, the owners tend to pay more attention to avoiding product wastage, but they are not particularly sensitive to recycling (PRF_Parsimonious) and perceive wastage as waste (FWD_waste).
The employees work in larger market set-ups, like the Porta Palazzo market (MK_PortaPalazzoTO), more than the other categories do. They are very involved in the question of product wastage (PRF_Prodigal). They generally have unsold products more than two days per week. This group tends to donate to families (HOW_DonFamilyYes) and, at the end of market day, sell food to a lower price avoiding the unsold foodstuffs (HOW_SellLwPriceYes).
Due to the MCA coding scheme, the inertia of the solution space is artificially inflated and, therefore, the percentage of inertia explained by the first dimension is underestimated [113]. The percentage of explained variance of the first two factors, shown in Figure 1 and Figure 2, has been re-evaluated. The Benzécri method [114] obtained 53.25% for the first dimension and 22.81% for the second one. The Greenacre method [112] is a more parsimonious method and therefore 35.82% was obtained for the first dimension and 15.35% for the second one. When the sum of the percentages of the variance explained by the first two factors are taken into consideration, both cases express a good representation.
The three clusters shown in Figure 2 were obtained by an HCA, after the MCA, using the dimensions obtained through this analysis as new quantitative variables, i.e., the first five dimensions were included, summing up more than 95% of the explained variance according to Benzécri’s revaluation.
The map of individuals evidences the triangular structure of the graph as aforementioned, whilst the three vertices seem to agree with each other both as to the formation of the three clusters and the most important working set-up represented by the type of activity (farmers, peddlers, or hybrids). In this sense, the first cluster (CLUS 1—position: bottom left-hand side) is mainly made up of peddlers (97% peddlers, 68% of all the peddlers belong to this cluster). The second cluster (CLUS 2—position: at the top of the graph) mainly includes farmers (92% farmers, 87% of all the farmers belong to this cluster). The third cluster (CLUS 3—position: bottom right-hand side) shows hybrids (93% hybrids, 61% of all hybrids belong to cluster 3).

5. Discussion and Conclusions

Food wastage has been extensively discussed in literature and has been further investigated from different perspectives [36,37,38,39,40,41]. The importance of the topic lies in the fact that every year about 88 million tonnes of food wastage are produced in EU. Families and farmers are mainly responsible for the phenomenon (81%). Since this problem is present mainly at the end of the production chain [17], this research has been dedicated to the study of the behaviour and attitudes of three important actors, i.e., farmers, peddlers, and hybrids. Even if these actors have been both recognized and analyzed in literature [46,47,48,49,50,52,54,59,61,64,66], to the best of our knowledge, no studies have centered their attention on behaviour and sensibility towards food wastage.
Analyzing the results obtained through the questionnaires given to 214 operators in the Greater Torino markets, the authors were able to identify three relevant groups: farmers, peddlers, and hybrids. Each of these groups is defined by specific elements, such as education, awareness about food wastage, involvement in product wastage, and attitude towards donations. The data obtained allowed for some specific attitudes and behaviour to be attributed to each group. On the basis of the data obtained each group was classified according to where they usually work and live and the definition given to food wastage—useful to understand their behaviour and approach toward the topic.
The group of farmers includes people living either in the Torino Province or outside it and they usually work in the Porta Palazzo market (in the city centre). They associate the definition of food wastage with “reuse” and “unsold,” so that they take into consideration the possibility of making different use of their unsold food at the end of the day. They usually donate their unsold food to families and are quite active in recycling activities. Their vision about the food wastage is open to the possibility of reusing it and shows that farmers pay attention to recycling activities.
The group of peddlers live and work in Torino and are the highest percentage of sellers on the Porta Palazzo market. They associate the definition of food wastage with “food waste” or the food that is lost during any stage of the food supply chain. They usually have more than two days per week of unsold goods but are not used to making donations to families, although they do donate to nonprofit organizations. The price of goods is always the same and no price-cutting policies are adopted at the end of the day for the unsold stock. Moreover, they do not reuse compost feed in any organic form since they do not live in the country but in the urban area of Torino. They feel quite indifferent to recycling activities and the wastage of products. In this case, the concept of food wastage is linked to something that cannot be reused: peddlers do not pay as much attention to recycling activities as farmers do.
Hybrids live and work in the Torino Province. They associate the definition of food wastage with “loss,” so they have a perception of something that cannot be saved from an economic point of view. Normally, they have fewer than two days of unsold food per week. They are not used to donating to nonprofit organizations, but they try to reuse waste in the form of compost feed. They are involved in ecological and recycling activities. The hybrids are younger than the other two groups, have a higher education level, and are aware of more initiatives linked to wastage, e.g., technological applications, associations, and specific projects active within the city. Considering the education level and their knowledge in terms of technological aspects, hybrids seem to be the most prepared on the topic and the group that can be easily involved in dedicated initiatives in the supply chain process.
The relevance of our results is mainly linked to having obtained a first identikit of the main actors involved in the food wastage phenomenon in outdoor markets. Moreover, it was observed that each one of the three groups has its own specific inclination towards the management of food wastage and, probably influenced by their position and education, they associate it to a different meaning. For farmers, food wastage is something linked to unsold goods and can be reused; for peddlers, it means everything that is lost in any of the different stages of the supply chain; and for hybrids, it is simply a loss that can take on a new life, e.g., transformation into compost feed.

6. Implications and Future Research

To date, the literature on food waste and the outdoor-market operators’ activities has not yet been fully developed, leaving some gaps still to be filled. Indeed, our study showed that farmers, peddlers, and hybrids implemented different unsold-food management systems to reduce the food waste.
The different behaviour identified depends on the varied conception of food wastage the groups have, which range from an active one to an indifferent one. Profiling the actors involved in the food wastage chain is an important step towards the implementation of various actions that could increase the awareness of the phenomenon. Indeed, the level of awareness is fundamental if the amount of food wastage has to be reduced at each stage. Moreover, educational and cultural levels play an important role in influencing people’s behaviour. Therefore, awareness can be promoted by specific programmes included in school syllabuses.
Not all of the interviewees were aware of the possibility of donating unsold food or of how to do it. They knew nothing about the start-ups or associations that can help them to reuse food wastage avoid or reduce loss. That is why institutions could carry out more communication campaigns to raise awareness and inform farmers, peddlers, and hybrids.
Future research, starting from these preliminary data, will expand its focus to the analysis of farmers, peddlers, and hybrids in numerous European markets to clarify if and how cultural differences influence the perception of unsold food and the behaviour of the different actors involved. Moreover, we are of the opinion that a focus group with farmers, peddlers, and hybrids would help to clarify the unsold food phenomenon further.

Acknowledgments

The authors thank Barbara Wade for her linguistic advice.

Author Contributions

These authors contributed equally to this paper.

Conflicts of Interest

The authors declare no conflict of interest.

References

  1. UE. Risoluzione del Parlamento Europeo del 19 Gennaio 2012 “Evitare lo Spreco di Alimenti”. Available online: http://www.europarl.europa.eu/sides/getDoc.do?pubRef=-//EP//TEXT+TA+P7-TA-2012-0014+0+DOC+XML+V0//IT (accessed on 10 February 2015).
  2. Parfitt, J.; Barthel, M.; Macnaughton, S. Food waste within food supply chains: Quantification and potential for change to 2050. Philos. Trans. R. Soc. B 2010, 365, 3065–3081. [Google Scholar] [CrossRef] [PubMed]
  3. FAO. Definitional Framework of Food Loss; FAO: Rome, Italy, 2014; Available online: http://www.fao.org/fileadmin/user_upload/savefood/PDF/FLW_Definition_and_Scope_2014.pdf (accessed on 26 March 2018).
  4. Okawa, K. Market and Trade Impacts of Food Loss and Waste Reduction. In OECD Food, Agriculture and Fisheries Papers; OECD Publishing: Paris, France, 2015; Volume 75, Available online: http://dx.doi.org/10.1787/5js4w29h0wr2-en (accessed on 26 March 2018).
  5. WRAP. Household Food and Drink Waste in the UK. Report Prepared by WRAP; WRAP: Banbury, UK, 2009; Available online: http://www.wrap.org.uk/sites/files/wrap/Household%20food%20and%20drink%20waste%20in%20the%20UK%20-%20report.pdf (accessed on 12 February 2015).
  6. Barilla CFN. Lo Spreco Alimentare: Cause, Impatti e Prodotti; Fondazione BCFN: Parma, Italy, 2012; Available online: http://www.barillacfn.com/wp-content/uploads/2012/11/WEB_ITA.pdf (accessed on 2 February 2018).
  7. Peri, C. The universe of food quality. Food Qual. Preference 2006, 17, 3–8. [Google Scholar] [CrossRef]
  8. Smil, V. Improving Efficiency and Reducing Waste in Our Food System. Environ. Sci. 2004, 1, 17–26. [Google Scholar] [CrossRef]
  9. Hudson, U.; Messa, M. Documento di Posizione Sulle Perdite e gli Sprechi Alimentari, Slow Food 2014. Available online: http://www.slowfood.com/sloweurope/wp-content/uploads/ITA-position-paper-foodwaste.pdf (accessed on 20 January 2015).
  10. Stuart, T. Sprechi. Il cibo che Buttiamo, che Distruggiamo, che Potremmo Utilizzare; Bruno Mondadori: Milano, Italy, 2009; pp. 47–52. ISBN 8861593798. [Google Scholar]
  11. Cicatiello, C.; Franco, S.; Pancino, B.; Blasi, E. The value of food waste: An exploratory study on retailing. J. Retail. Consum. Serv. 2016, 30, 96–104. [Google Scholar] [CrossRef]
  12. Gustavsson, J.; Cederberg, C.; Sonesson, U.; van Otterdijk, R.; Meybeck, A. Global Food Losses and Food Waste; FAO Report; FAO: Rome, Italy, 2011; Available online: http://www.fao.org/docrep/014/mb060e/mb060e.pdf (accessed on 2 February 2015).
  13. Verghese, K.; Lewis, H.; Lockrey, S.; Williams, H. The Role of Packaging in Minimising Food Waste in the Supply Chain of the Future. Final Report; RMIT University: Melbourne, Australia, 2013; Available online: http://www.chep.com/foodwaste/ (accessed on 12 February 2015).
  14. IME. Global Food Waste Not, Want Not. Available online: www.imeche.org/docs/default-source/reports/Global_Food_Report.pdf?sfvrsn=0 (accessed on 12 February 2015).
  15. FAO. Food Wastage: Key Facts and Fingers. 2017. Available online: http://www.fao.org/news/story/en/item/196402/icode/ (accessed on 1 February 2017).
  16. Stenmarck, A.; Jensen, C.; Quested, T.; Moates, G. Estimates of European Waste Levels, Fusion Project, Commissioned by European Commission; Fusions: Stockholm, Sweden, 2016; ISBN 978-91-88319-01-2. [Google Scholar]
  17. EU. Commission Staff Working Document Impact Assessment on Measures Addressing Food Waste to Complete SWD (2014) 207 Regarding the Review of EU Waste Management Targets. Annex 3. Available online: http://register.consilium.europa.eu/doc/srv?l=EN&t=PDF&f=ST+11598+2014+ADD+12 (accessed on 10 February 2015).
  18. Borrello, M.; Caracciolo, F.; Lombardi, A.; Pascucci, S.; Cembalo, L. Consumers’ perspective on circular economy strategy for reducing food waste. Sustainability (Basel) 2017, 9, 141. [Google Scholar] [CrossRef]
  19. Borrello, M.; Lombardi, A.; Pascucci, S.; Cembalo, L. The seven challenges for transitioning into a bio-based circular economy in the agri-food sector. Recent Patents Food Nutr. Agric. 2016, 8, 39–47. [Google Scholar] [CrossRef]
  20. McDonough, W.; Braungart, M. Cradle to Cradle: Remaking the Way We Make Things, 1st ed.; North Point Press: New York, NY, USA, 2002. [Google Scholar]
  21. Stahel, W.; Reday, G. The Potential for Substituting Manpower for Energy, Report to the Commission of the European Communities; Battelle, Geneva Research Centre: Columbus, OI, USA, 1976. [Google Scholar]
  22. Ellen MacArthur Foundation (EMF). Towards the Circular Economy; EMF: Cowes, UK, 2013; Volume 1. [Google Scholar]
  23. Pearce, D.W.; Turner, R.K. Economics of Natural Resources and the Environment; Johns Hopkins University Press: Baltimore, MD, USA, 1989. [Google Scholar]
  24. Geissdoerfer, M.; Savaget, P.; Bocken, N.M.P.; Hultink, E.J. The Circular Economy—A New Sustainability Paradigm? J. Clean. Prod. 2017, 143, 757–768. [Google Scholar] [CrossRef]
  25. Mondéjar-Jiménez, J.A.; Ferrari, G.; Secondi, L.; Principato, L. From the table to waste: An exploratory study on behaviour towards food waste of Spanish and Italian youths. J. Clean. Prod. 2016, 138, 8–18. [Google Scholar] [CrossRef]
  26. Kristensen, D.K.; Kjeldsen, C.; Thorsøe, M.H. Enabling Sustainable Agro-Food Futures: Exploring Fault Lines and Synergies between the Integrated Territorial Paradigm, Rural Eco-Economy and Circular Economy. J. Agric. Environ. Ethics 2016, 29, 749–765. [Google Scholar] [CrossRef]
  27. Jurgilevich, A.; Birge, T.; Kentala-Lehtonen, J.; Korhonen-Kurki, K.; Pietikäinen, J.; Saikku, L.; Schösler, H. Transition towards circular economy in the food system. Sustainability (Basel) 2016, 8, 69. [Google Scholar] [CrossRef]
  28. Lundqvist, J. Losses and waste in the global crisis. Rev. Environ. Sci. Bio/Technol. 2009, 8, 121–123. [Google Scholar] [CrossRef]
  29. Clark, J.; Manning, L. What are the factors that an opportunity sample of UK students insinuate as being associated with their wastage of food in the home setting? Resour. Conserv. Recycl. 2018, 130, 20–30. [Google Scholar] [CrossRef]
  30. Bond, M.; Meacham, T.; Bhunnoo, R.; Benton, T.G. Food Waste within Global Food Systems. A Global Food Security Report. Glob. Food Secur. 2013. Available online: http://www.foodsecurity.ac.uk/assets/pdfs/food-waste-report.pdf2 (accessed on 20 February 2018).
  31. Battilani, A. Limited access to resources: Challenges or opportunities? Acta Hortic. 2015, 1081, 27–40. [Google Scholar] [CrossRef]
  32. Segrè, A.; Falasconi, L. Il Libro Nero Dello Spreco in Italia: Il Cibo; Edizioni Ambiente: Milano, Italy, 2011; ISBN 9788866270003. [Google Scholar]
  33. UNEP; WRI. Reducing Food Loss and Waste. Available online: http://www.wri.org/sites/default/files/reducing_food_loss_and_waste.pdf (accessed on 11 February 2015).
  34. UNEP. Food Waste: The Facts. Available online: http://www.worldfooddayusa.org/food_waste_the_facts (accessed on 13 February 2015).
  35. USDA (United States Department of Agriculture). The Estimated Amount, Value, and Calories of Postharvest Food Losses at the Retail and Consumer Levels in the United States. Available online: www.ers.usda.gov/media/1282292/eib121_summary.pdf (accessed on 10 February 2015).
  36. Beretta, C.; Stoessel, F.; Baier, U.; Hellweg, S. Quantifying food losses and the potential for reduction in Switzerland. Waste Manag. 2013, 33, 764–773. [Google Scholar] [CrossRef] [PubMed]
  37. Engstrom, R.; Carlsson-Kanyama, A. Food losses in food service institutions Examples from Sweden. Food Policy 2004, 29, 203–213. [Google Scholar] [CrossRef]
  38. Buzby, J.C.; Hyman, J. Total and per capita value of food loss in the United States. Food Policy 2012, 37, 561–570. [Google Scholar] [CrossRef]
  39. Nahman, A.; de Lange, W.; Oelofse, S.; Godfrey, L. The costs of household food waste in South Africa. Waste Manag. 2012, 32, 2147–2153. [Google Scholar] [CrossRef] [PubMed]
  40. Kummu, M.; de Moel, H.; Porkka, M.; Siebert, S.; Varis, O.; Ward, P.J. Lost food, wasted resources: Global food supply chain losses and their impacts on freshwater, cropland, and fertiliser use. Sci. Total Environ. 2012, 438, 477–489. [Google Scholar] [CrossRef] [PubMed]
  41. Lebersorger, S.; Schneider, F. Food loss rates at the food retail, influencing factors and reasons as a basis for waste prevention measures. Waste Manag. 2014, 34, 1911–1919. [Google Scholar] [CrossRef] [PubMed]
  42. Eriksson, M.; Strid, I.; Hansson, P.A. Food losses in six Swedish retail stores: Wastage of fruit and vegetables in relation to quantities delivered. Resour. Conserv. Recycl. 2012, 68, 14–20. [Google Scholar] [CrossRef]
  43. Porat, R.; Lichter, A.; Terry, L.A.; Harker, R.; Buzby, J. Postharvest losses of fruit and vegetables during retail and in consumers’ homes: Quantifications, causes, and means of prevention. Postharvest Biol. Technol. 2018, 139, 135–149. [Google Scholar] [CrossRef]
  44. Lanfranchi, M.; Falco, N.D.; Santagada, R.; Sippelli, S.; Giannetto, C. Analysis and models for the reduction of waste in organized large-scale retail distribution: “The tomato”. Qual. Access Success 2018, 19, 130–133. [Google Scholar]
  45. Kulikovskaja, V.; Aschemann-Witzel, J. Food Waste Avoidance Actions in Food Retailing: The Case of Denmark. J. Int. Food Agribus. Mark. 2017, 29, 328–345. [Google Scholar] [CrossRef]
  46. Yu, H.; Gibson, K.E.; Wright, K.G.; Neal, J.A.; Sirsat, S.A. Food safety and food quality perceptions of farmers’ market consumers in the United States. Food Control 2017, 79, 266–271. [Google Scholar] [CrossRef]
  47. Bovay, J. Demand for collective food-safety standards. Agric. Econ. 2017, 48, 793–803. [Google Scholar] [CrossRef]
  48. Zhang, M.; Jin, Y.; Qiao, H.; Zheng, F. Product quality asymmetry and food safety: Investigating the “one farm household, two production systems” of fruit and vegetable farmers in China. China Econ. Rev. 2017, 45, 232–243. [Google Scholar] [CrossRef]
  49. Ayedun, B.; Okpachu, G.; Manyong, V.; Atehnkeng, J.; Akinola, A.; Abu, G.A.; Bandyopadhyay, R.; Abdoulaye, T. An assessment of willingness to pay by maize and groundnut farmers for aflatoxin biocontrol product in northern Nigeria. J. Food Prot. 2017, 80, 1451–1460. [Google Scholar] [CrossRef] [PubMed]
  50. Corsi, S.; Marchisio, L.V.; Orsi, L. Connecting smallholder farmers to local markets: Drivers of collective action, land tenure and food security in East Chad. Land Use Policy 2017, 68, 39–47. [Google Scholar] [CrossRef]
  51. Hulbrock, E.; Otten, J.J.; Quinn, E.; Johnson, D.B.; Lerman, S. Exploring the Use of Seattle’s Farmers’ Market Incentive Program (“Fresh Bucks”) by Household Food Security Levels. J. Hunger Environ. Nutr. 2017, 12, 362–374. [Google Scholar] [CrossRef]
  52. Berg, N.; Preston, K.L. Willingness to pay for local food?: Consumer preferences and shopping behavior at Otago Farmers Market. Transp. Res. Part A Policy Pract. 2017, 103, 343–361. [Google Scholar] [CrossRef]
  53. Tindano, K.; Moula, N.; Traoré, A.; Leroy, P.; Antoine-Moussiaux, N. Assessing the diversity of preferences of suburban smallholder sheep keepers for breeding rams in Ouagadougou, Burkina Faso. Trop. Anim. Health Prod. 2017, 49, 1187–1193. [Google Scholar] [CrossRef] [PubMed]
  54. Danso, G.K.; Otoo, M.; Ekere, W.; Ddungu, S.; Madurangi, G. Market feasibility of faecal sludge and municipal solid waste-based compost as measured by farmers’ willingness-to-pay for product attributes: Evidence from Kampala—Uganda. Resources 2017, 6, 31. [Google Scholar] [CrossRef]
  55. Lee, J. Farmer participation in a climate-smart future: Evidence from the Kenya agricultural carbon market project. Land Use Policy 2017, 68, 72–79. [Google Scholar] [CrossRef]
  56. Otieno, P.S.; Ogutu, C.A.; Mburu, J.; Nyikal, R.A. Effect of Global-GAP policy on climate change perceptions of smallholder French beans farmers in central and Eastern Regions, Kenya. Climate 2017, 5, 27. [Google Scholar] [CrossRef]
  57. Boansi, D.; Tambo, J.A.; Müller, M. Analysis of farmers’ adaptation to weather extremes in West African Sudan Savanna. Weather Clim. Extrem. 2017, 16, 1–13. [Google Scholar] [CrossRef]
  58. Pradhan, N.S.; Fu, Y.; Zhang, L.; Yang, Y. Farmers’ perception of effective drought policy implementation: A case study of 2009–2010 drought in Yunnan province, China. Land Use Policy 2017, 67, 48–56. [Google Scholar] [CrossRef]
  59. Islam, Z.; Alauddin, M.; Sarker, M.A.R. Determinants and implications of crop production loss: An empirical exploration using ordered probit analysis. Land Use Policy 2017, 67, 527–536. [Google Scholar] [CrossRef]
  60. Nonvide, G.M.A.; Sarpong, D.B.; Kwadzo, G.T.M.; Anim-Somuah, H.; Amoussouga Gero, F. Farmers’ perceptions of irrigation and constraints on rice production in Benin: A stakeholder-consultation approach. Int. J. Water Resour. D 2017, 1–21. [Google Scholar] [CrossRef]
  61. Cheng, Y.; Zhang, Y.; Ma, J.; Zhan, S. Food safety knowledge, attitude and self-reported practice of secondary school students in Beijing, China: A cross-sectional study. PLoS ONE 2017, 12, e0187208. [Google Scholar] [CrossRef] [PubMed]
  62. Abou, E.A. Bacteriological quality of ready to eat meals. J. Egypt. Public Health Assoc. 1995, 70, 627–641. [Google Scholar] [PubMed]
  63. Agege, C.O. Products and the consumer: An analysis of food and drug legislation in Nigeria. Food Drug Cosmet. Law J. 1988, 43, 201–214. [Google Scholar]
  64. Chen, Z.G.; Li, X.; Fan, X.J. Method for the discrimination of the variety of potatoes with vis/NIR spectroscopy, Guang Pu Xue Yu Guang Pu Fen Xi. Spectrosc. Spect. Anal. 2016, 36, 2474–2478. [Google Scholar]
  65. Janssens, F. Street food markets in Amsterdam: Unravelling the original sin of the market trader. In Street Food: Culture, Economy, Health and Governance; Routledge: Chichester, UK, 2014. [Google Scholar]
  66. Onono, J.O.; Alarcon, P.; Karani, M.; Muinde, P.; Akoko, J.M.; Maud, C.; Fevre, E.M.; Häsler, B.; Rushton, J. Identification of production challenges and benefits using value chain mapping of egg food systems in Nairobi, Kenya. Agric. Syst. 2018, 159, 1–8. [Google Scholar] [CrossRef]
  67. Carron, M.; Alarcon, P.; Karani, M.; Muinde, P.; Akoko, J.; Onono, J.; Fèvre, E.M.; Häsler, B.; Rushton, J. The broiler meat system in Nairobi, Kenya: Using a value chain framework to understand animal and product flows, governance and sanitary risks. Prev. Vet. Med. 2017, 147, 90–99. [Google Scholar] [CrossRef] [PubMed]
  68. Youssouf, I.; Youssouf, M.L.; Soumarkamla, D.; Ayao, M. Traditional poultry supply and marketing in the city of N’Djamena in Chad. Int. J. Poult. Sci. 2012, 11, 341–348. [Google Scholar] [CrossRef]
  69. Nakamura, S. Spatial Considerations of the Behaviour of Seafood Peddlers; The Case of the San’in District, Western Japan. Hum. Geogr. 1985, 37, 310–331. [Google Scholar] [CrossRef]
  70. De Pádua Carrieri, A.; Murta, I.B.D. Cleaning up the city: A study on the removal of street vendors from downtown Belo Horizonte, Brazil. Can. J. Adm. Sci. 2011, 28, 217–225. [Google Scholar] [CrossRef]
  71. Zhu, Q. An appraisal and analysis of the law of “Plastic-Bag Ban”. Enrgy Procedia 2011, 5, 2516–2521. [Google Scholar] [CrossRef]
  72. Kirli, C. A profile of the labor force in early nineteenth-century Istanbul. Int. Labor Work.-Class 2001, 60, 125–140. [Google Scholar]
  73. Margavio, A.V.; Salomone, J. Economic advantages of familism: The case of the sicilians of Louisiana. Sociol. Spectr. 1987, 7, 101–119. [Google Scholar] [CrossRef]
  74. Osborne, B.S. Trading on a frontier: The function of peddlers, markets and fairs in nineteenth-century Ontario. Can. Pap. Rural Hist. 1980, 2, 59–81. [Google Scholar]
  75. Underhill, S.J.R.; Zhou, Y.; Sherzad, S.; Singh-Peterson, L.; Tagoai, S.M. Horticultural postharvest loss in municipal fruit and vegetable markets in Samoa. Food Secur. 2017, 9, 1373–1383. [Google Scholar] [CrossRef]
  76. Morland, K.; Filomena, S. Disparities in the availability of fruits and vegetables between racially segregated urban neighbourhoods. Public Health Nutr. 2007, 10, 1481–1489. [Google Scholar] [CrossRef] [PubMed]
  77. Koushki, M.R. Microbiological quality of pasteurized milk marketed in Tehran urban area. J. Pure Appl. Microbiol. 2017, 11, 37–42. [Google Scholar] [CrossRef]
  78. Bader, M.D.M.; Purciel, M.; Yousefzadeh, P.; Neckerman, K.M. Disparities in neighborhood food environments: Implications of measurement strategies. Econ. Geogr. 2010, 86, 409–430. [Google Scholar] [CrossRef] [PubMed]
  79. Rundle, A.; Neckerman, K.M.; Freeman, L.; Lovasi, G.S.; Purciel, M.; Quinn, J.; Richards, C.; Sircar, N.; Weiss, C. Neighborhood food environment and walkability predict obesity in New York City. Environ. Health Perspect. 2009, 117, 442–447. [Google Scholar] [CrossRef] [PubMed]
  80. Mele, C.; Ng, M.; Chim, M.B. Urban markets as a ‘corrective’ to advanced urbanism: The social space of wet markets in contemporary Singapore. Urban Stud. 2015, 52, 103–120. [Google Scholar] [CrossRef]
  81. Duran, A.C.; Lock, K.; Latorre, M.R.D.O.; Jaime, P.C. Evaluating the use of in-store measures in retail food stores and restaurants in Brazil. Rev. Saude Publ. 2015, 49, 80. [Google Scholar] [CrossRef] [PubMed]
  82. Sisson, L.G. Food Recovery Program at Farmers’ Markets Increases Access to Fresh Fruits and Vegetables for Food Insecure Individuals. J. Hunger Environ. Nutr. 2016, 11, 337–339. [Google Scholar] [CrossRef]
  83. Beausang, C.; Hall, C.; Toma, L. Food waste and losses in primary production: Qualitative insights from horticulture. Resour. Conserv. Recycl. 2017, 126, 177–185. [Google Scholar] [CrossRef]
  84. Guo, P.; Zhang, X. Study on circular economy education in rural areas in China. In Proceedings of the International Conference on Logistics, Engineering, Management and Computer Science, Shenyang, China, 24–26 May 2014; Atlantis Press: Paris, France, 2014. [Google Scholar]
  85. Wei, B.G.; Feng, Z.C.; Yang, C.Y. Research on motive, problems and countermeasures of agricultural cycle economy of farming households. China Popul. Resour. Environ. 2009, 4. Available online: http://en.cnki.com.cn/Article_en/CJFDTOTAL-ZGRZ200904022.htm (accessed on 23 February 2018).
  86. Kilcher, L. Kubas Biolandbau-Revolution: Auskommen mit den eigenen Ressourcen. Geogr. Rundsch. 2006, 58, 54–60. [Google Scholar]
  87. Sutopo, W.; Hisjam, M.; Yuniaristanto, Y. Developing an agri-food supply chain application for determining the priority of CSR program to empower farmers as a qualified supplier of modern retailer. Lect. Notes Eng. Comp. 2013, 2, 1180–1184. [Google Scholar]
  88. Díaz, A.I.; Laca, A.; Laca, A.; Díaz, M. Treatment of supermarket vegetable wastes to be used as alternative substrates in bioprocesses. Waste Manag. 2017, 67, 59–66. [Google Scholar] [CrossRef] [PubMed]
  89. Jara-Samaniego, J.; Pérez-Murcia, M.D.; Bustamante, M.A.; Paredes, C.; Pérez-Espinosa, A.; Gavilanes-Terán, I.; López, M.; Marhuenda-Egea, F.C.; Brito, H.; Moral, R. Development of organic fertilizers from food market waste and urban gardening by composting in Ecuador. PLoS ONE 2017, 12. [Google Scholar] [CrossRef] [PubMed]
  90. Kadir, A.A.; Azhari, N.W.; Jamaludin, S.N. An overview of organic waste in composting. MATEC Web Conf. 2016, 47. [Google Scholar] [CrossRef]
  91. Eriksson, M.; Spångberg, J. Carbon footprint and energy use of food waste management options for fresh fruit and vegetables from supermarkets. Waste Manag. 2017, 60, 786–799. [Google Scholar] [CrossRef] [PubMed]
  92. Mattsson, K. Standards for fresh fruit and vegetables—For trading in high quality products. Acta Hortic. 2015, 1091, 73–80. [Google Scholar] [CrossRef]
  93. Barba, M.; Díaz-Ruiz, R. Switching imperfect and ugly products to beautiful opportunities. In Envisioning a Future without Food Waste and Food Poverty: Societal Challenges; Wageningen Academic Publishers: Wageningen, The Netherlands, 2015; pp. 279–284. ISBN 978-90-8686-275-7. [Google Scholar]
  94. Parkins, W.; Craig, G. Culture and the politics of alternative food networks. Food Cult. Soc. 2009, 12, 77–103. [Google Scholar] [CrossRef]
  95. Black, R.E. Porta Palazzo: The Anthropology of an Italian Market; University of Pennsylvania Press: Philadelphia, PA, USA, 2012; pp. 1–221. [Google Scholar]
  96. Myers, J. The logic of the gift: The possibilities and limitations of Carlo Petrini’s slow food alternative. Agric. Hum. Values 2013, 30, 405–415. [Google Scholar] [CrossRef]
  97. Hendrikx, B.; Dormans, S.; Lagendijk, A.; Thelwall, M. Understanding the geographical development of social movements: A web-link analysis of Slow Food. Glob. Netw. 2017, 17, 47–67. [Google Scholar] [CrossRef]
  98. Massa, S.; Testa, S. The role of ideology in brand strategy: The case of a food retail company in Italy. Int. J. Retail Distrib. Manag. 2012, 40, 109–127. [Google Scholar] [CrossRef]
  99. Sebastiani, R.; Montagnini, F.; Dalli, D. Ethical Consumption and New Business Models in the Food Industry. Evidence from the Eataly Case. J. Bus. Ethics 2013, 114, 473–488. [Google Scholar] [CrossRef]
  100. Bertoldi, B.; Giachino, C.; Stupino, M. Innovative approaches to brand value and consumer perception: The Eataly case. J. Cust. Behav. 2015, 14, 353–367. [Google Scholar] [CrossRef]
  101. D’Ippolito, B.; Timpano, F. The Role of Non-Technological Innovations in Services: The Case of Food Retailing. Creativity Innov. Manag. 2016, 25, 73–89. [Google Scholar] [CrossRef]
  102. Di Gregorio, D. Place-based business models for resilient local economies: Cases from Italian slow food, agritourism and the albergo diffuso. J. Enterp. Communities 2017, 11, 113–128. [Google Scholar] [CrossRef]
  103. Gilli, M.; Ferrari, S. Tourism in multi-ethnic districts: The case of Porta Palazzo market in Torino. Leis. Stud. 2018, 37, 146–157. [Google Scholar] [CrossRef]
  104. Vecchio, R.; Annunziata, A. Consumers’ attitudes towards sustainable food: A cluster analysis of Italian university students. New Medit 2013, 12, 47–56. [Google Scholar]
  105. Clonan, A.; Holdsworth, M.; Swift, J.; Wilson, P. Awareness and attitudes of consumers to sustainable food. In Ethical Futures: Bioscience and Food Horizons; Wageningen University: Wageningen, The Netherlands, 2009; pp. 205–210. ISBN 978-90-8686-115-6. [Google Scholar]
  106. Alvesson, M. Methodology for close up studies—Struggling with closeness and closure. High Educ. 2003, 46, 167–193. Available online: http://link.springer.com/article/10.1023/A:1024716513774 (accessed on 3 April 2017). [CrossRef]
  107. Leiper, C.; Clarke-Sather, A. Co-creating an alternative: The moral economy of participating in farmers’ markets. Local Environ. 2017, 22, 840–858. [Google Scholar] [CrossRef]
  108. Pitrone, M.C. Il Sondaggio; Franco Angeli Editore: Milano, Italy, 1984. [Google Scholar]
  109. Fideli, R.; Marradi, A. Intervista (Interview). In Enciclopedia delle Scienze Sociali; Istituto della Enciclopedia Italiana: Roma, Italy, 1996; pp. 71–82. ISBN 0486-0349. [Google Scholar]
  110. Atkinson, A.C.; Shaffir, W. Standards for Field Research in Management Accounting. Available online: http://ssrn.com/abstract=137268 (accessed on 20 April 2016).
  111. Escofier, B.; Pagès, J. Analyses Factorielles Simples et Multiples: Objectifs, Méthodes et Interprétation; Dunod: Paris, France, 2005. [Google Scholar]
  112. Greenacre, M.J. Correspondence Analysis in Practice; Academic Press: London, UK, 1993; ISBN 0033-3123. [Google Scholar]
  113. Abdi, H.; Valentin, D. Multiple Correspondence Analysis. In Encyclopedia of Measurement and Statistics; Salkind, N., Ed.; Sage: Thousand Oaks, CA, USA, 2007. [Google Scholar]
  114. Benzécri, J.P. Sur le calcul des taux d’inertie dans l’analyse d’un questionnaire. Cah. de l’Anal. des Données 1973, 4, 377–378. [Google Scholar]
Figure 1. The MCA determined by the first two dimensions.
Sustainability 10 01180 g001
Figure 2. Clusters obtained by the HCA (after the MCA). On the left, the dendrogram shows the chosen distance level to identify clusters. On the right, each cluster is represented with its specific elements.
Sustainability 10 01180 g002
Table 1. Sample distribution of the variables collected.
VariableCategoryDescriptionDistribution per Type
Type of activityFARMERFarmers24.30%
PEDDLERPeddlers50.00%
FARMER and PEDDLERHybrids25.70%
ResidenceRESID_InsideTOCity of Torino36.92%
RESID_ProvTOProvince of Torino54.21%
RESID_OutsideTOOutside of the Province of Torino8.88%
Market locationMK_PortaPalazzoPorta Palazzo market (city of Torino)35.98%
MK_InsideTOIn the city of Torino34.58%
MK_OutsideTOIn the Province of Torino29.44%
Active participantsEMPLOYEREmployers85.98%
EMPLOYEEEmployees14.02%
Unsold management: donation to no-profit organisationsHOW_DonNoProfitYesYes11.21%
HOW_DonNoProfitNoNo88.79%
Unsold management: donation to familiesHOW_DonFamilyYesYes32.71%
HOW_DonFamilyNoNo67.29%
Unsold management: sell “lower” price goodsHOW_SellLwPriceYesYes50.93%
HOW_SellLwPriceNoNo49.07%
Unsold management: own family consumptionHOW_OwnCosYesYes59.35%
HOW_OwnConsNoNo40.65%
Unsold management: used in organic formsHOW_ReuseOrgFormYesYes32.24%
HOW_ReuseOrgFormNoNo67.76%
Days in a week with unsold goodsUnSOLD_More2daysMore than 2 days a week39.72%
UnSOLD_LE2days2 days a week or less60.28%
Food wastage definitionFWD_WasteWaste14,95%
FWD_WastageWastage35.52%
FWD_LossLoss5.14%
FWD_ReuseReuse10.28%
FWD_UnsoldUnsold6.54%
FWD_WrongWrong14.02%
FWD_Cultural LimitCultural Limit13.55%
ProfilesPRF_IndifferentIndifferent11.68%
PRF_ParsimoniousParsimonious21.96%
PRF_ActiveActive16.36%
PRF_ProdigalProdigal50.00%
1 The different categories of each variable are described in the column “category” using the same labels as those in Figure 1.

