Review

Driving Behaviour and Sustainable Mobility—Policies and Approaches Revisited

by
Ali Keyvanfar
1,2,3,4,
Arezou Shafaghat
3,4,*,
Nasiru Zakari Muhammad
5 and
M. Salim Ferwati
6,*
1
Center for Energy Research, Jacobs School of Engineering, University of California, San Diego, CA 92093, USA
2
Facultad de Arquitectura y Urbanismo, Universidad Tecnológica Equinoccial, Calle Rumipamba s/n y Bourgeois, Quito 170508, Ecuador
3
Department of Landscape Architecture, Faculty of Built Environment, Universiti Teknologi Malaysia, Skudai 81310, Johor, Malaysia
4
MIT-UTM MSCP Program, Institute Sultan Iskandar, Universiti Teknologi Malaysia, Skudai 81310, Malaysia
5
Faculty of Engineering, Kano University of Science and Technology Wudil, PMB 3244, Kano 20027, Nigeria
6
Department of Architecture and Urban Planning, College of Engineering, Qatar University, Doha P.O.Box 2713, Qatar
*
Authors to whom correspondence should be addressed.
Sustainability 2018, 10(4), 1152; https://doi.org/10.3390/su10041152
Submission received: 9 February 2018 / Revised: 8 April 2018 / Accepted: 9 April 2018 / Published: 11 April 2018
(This article belongs to the Section Sustainable Transportation)

Abstract

:
Climate change is receiving increasing attention in recent years. The transportation sector contributes substantially to increased fuel consumption, greenhouse gas (GHG) emissions, and poor air quality, which imposes a serious respiratory health hazard. Road transport has made a significant contribution to this effect. Consequently, many countries have attempted to mitigate climate change using various strategies. This study analysed and compared the number of policies and other approaches necessary to achieve reduced fuel consumption and carbon emission. Frequency aggregation indicates that the mitigation policies associated with driving behaviours adopted to curtail this consumption and decrease hazardous emissions, as well as a safety enhancement. Furthermore, car-sharing/carpooling was the least investigated approach to establish its influence on mitigation of climate change. Additionally, the influence of such driving behaviours as acceleration/deceleration and the compliance to speed limits on each approach was discussed. Other driving behaviours, such as gear shifting, compliance to traffic laws, choice of route, and idling and braking style, were also discussed. Likewise, the influence of aggression, anxiety, and motivation on driving behaviour of motorists was highlighted. The research determined that driving behaviours can lead to new adaptive driving behaviours and, thus, cause a significant decrease of vehicle fuel consumption and CO2 emissions.

Graphical Abstract

1. Introduction

Climate change and the increased number of operating vehicles to cater to the human population contribute to carbon dioxide emission. According to Muslim et al. [1], the transportation sector contributes substantially to CO2 emissions. Generally, emissions of CO2, NOx, CO, and CH due to the operation of vehicles has always led to environmental pollution, greenhouse gasses (GHG), and health issues [2,3]. According to the International Energy Agency, road transport has a more significant contribution to climate change as compared to other sectors in the transportation industry [4]. This was asserted by Muslim et al. [1], where they reported a 13.8% contribution of the transportation industry to global GHG emissions, of which 9.9% was due to road transport. Likewise, in Europe, road transportation contributes significantly to carbon emissions [5]. Vehicle fuel consumption and carbon emissions are influenced by driving behaviour, as well as traffic conditions, average driving distance for safety, and the status of the vehicle [6,7,8]. However, the driving behaviour literature lacks a comprehensive review on the policies, strategies, and approaches to mitigate climate change and safety issues. In this regard, the current study aimed to investigate the policies and strategies of driving behaviours for sustainable mobility. The research explored those policies and strategies associated with vehicle fuel consumption, tailpipe emissions, and safety. The content analysis method was conducted in the research, as it is a replicable, scientific, and transparent method of literature review analysis [9,10].

2. The Association between Fuel Consumption, Emissions, and Driving Behaviour

2.1. Fuel Consumption and Driving Behaviour

Transportation fuels are the energy sources that power various transportation modes for carrying goods and transporting people [11]. Basically, fuels are the result of refining products that vary based on their chemical properties, such as hydrogen (H), nitrogen (N), carbon (C), and oxygen (O2). Such properties will result in various types of liquid fuels, petroleum, natural gas, coal-derived liquids (CTL), biofuels, alcohol, hydrogen, and ammonia. Approximately 80% of current transportation fuels are derived from petroleum, which include gasoline (petrol), diesel, jet fuel, liquefied petroleum gas (LPG), and marine fuel [12]. Around 77% of global energy consumption is dominated by fuel oil, of which gasoline and diesel are the major components, from the transportation sector [13]. Gasoline and diesel has become the primary sources of energy for most light duty vehicles (LDVs) for passenger and heavy duty vehicles (HDVs) for goods transportation. Jet fuel, residual fuel oil, and non-oil based fuel (e.g., natural gas and electricity) accounted for 12%, 9%, and 1% of energy consumption in the transportation sector, respectively [14]. More than 75% of these sources are used in road transport, while the remaining fuels are consumed by railways and ships, and jet fuel is used for aircraft energy supply.
Road transport consists of passenger car, Light duty vehicle (LDV), Heavy duty vehicle (HDV), buses, and others. The classification of types of vehicle under road transport is divided into the followings.
  • Passenger car:
    • A motor vehicle including all sedans, coupes, and primarily manufactured to carry passengers including car pulling recreational and light trailers [15].
    • A passenger car other than motorcycle that intends to carry passenger with not more than nine designated seats including the driver. For instance, taxis, micro cars, hired passenger cars, and also may include pick-ups [16].
  • Light duty vehicle (LDV): Includes any vehicle maximum gross weight rating (GVWR) which is less than 8500 lbs such as passenger cars [17].
  • Heavy duty vehicle (HDV): Includes any commercial medium to heavy duty vehicle or a work truck. For instance, pick-up trucks, vans, vocational vehicles, truck tractors with GVWR >26,000 lbs [18,19].
  • Buses: All types of buses with two, three, or more axles (six tires or more) including, conventional buses and school buses that carry passengers. However, modified buses should be considered as truck or to be classified appropriately [20].
  • Trucks/Trailers: It consists of light duty and heavy duty pick-ups as follows [15].
    • Two- or three-axle, six-tire, single unit truck (with dual rear wheels)—Single frame vehicle plus transport-trucks, vehicles for camping and recreational (RV) or caravan, mobile home, etc.
    • More or less than four axles, single truck or trailer truck—All vehicles with four or fewer axles that consists tractor or straight truck power unit.
  • Railways/Locomotive: It refers to the land transport of passengers and goods on long railways or railroads. This system employs parallel rail tracks that provide support and direction for vehicles carried on flanged wheels.
Studies indicate that drivers’ attitudes toward traffic laws, particularly with regard to speed limits, have led to increased fuel consumption. This was applicable to light-duty drivers. Additionally, studies have shown that diesel vehicles consume the most fuel compared to other types of fuel. Therefore, driving style due to inherent drivers’ attitudes was one of the major issues of concern [21,22,23,24]. Haworth et al. [25] and Majid et al. [26] stated that complying with traffic speed limits could lower vehicle fuel consumption. Therefore, good training and educating of motorists to influence the driving pattern of individuals has the potential to curtail this situation and reduce consumption by up to 40% [27,28]. Carrese et al. [29] expressed that 27% of fuel could be saved due to driving style, and fuel consumption was increased by 26% due to vehicle load, and doubled as a result of moving on ascending grades.

2.2. Emissions and Driving Behaviour

Traffic-related emissions, such as CO2, CO, NOx and HC have negatively affected the environment and always lead to poor air quality. Consequently, this increases health hazards, particularly respiratory diseases [30]. Among them, CO2 was reported to have the most significant impact [31]. On the other hand, these emissions are difficult to predict, let alone to measure. In this regard, Jamriska and Morawska [32] stated that the assessment of traffic emission has become a complex process, which largely depends on local conditions. According to Clark et al. [33], the most significant factors that affect the quantity of emissions generated by diesel-fuelled vehicles include the weight and the class of the engine. Likewise, the effect of the age of the vehicles and the terrain on which the vehicle is moving cannot be ignored. Studying these factors could be useful in determining the appropriate method for reducing these emissions. To quantify and evaluate the impact of these emissions on the environment, several approaches have been proposed. Among them is the in situ measurement of traffic particle emission for both petrol- and diesel-fuelled vehicles [34]. In this approach, particle concentration and exhaust are simultaneously measured based on the typical speed profile at a roundabout, signalized intersection, and other points within the traffic [35]. Additionally, Kholod et al. [36] developed a computer program for computing emissions from the diesel-fuelled on-road vehicles. Using this method, 11.7 tons of black carbon was found to be emitted in Russia in the year 2014. The result indicated that 55% of this emission was contributed due to operating vehicles without control emission devices. They also stated that the structure of a vehicle fleet is another factor influencing motorists’ emissions. Recently, Sun et al. [31] asserted that common occurrences of congestion in an urban road network is another important factor affecting traffic emission and air temperature. Consequently, this accelerates climate change as well as impacts of global warming in the cities [37]. According to Rodriguez et al. [38], driving behaviour can limit the annual emission of CO2 by 12%, CO and HC by 13% each, and NOx emission by 24%. Likewise, the effect of vehicle type and quality of fuel in mitigating climate change was investigated [39]. This is probably due to differences in engine operating conditions [40,41,42], although the frequency of carbon dioxide emission varies from one class of road to another.
The frequency of carbon dioxide emission varies from one class of road to another. The most significant health hazard effect was found to be more pronounced in some local streets [43,44]. In this regard, Yu et al. [45] attempted to investigate the influence of passenger load on the emission and fuel consumption. The result indicated that emission and fuel consumption were strongly related to speed and acceleration behaviour of motorists. However, as the passenger load increases, per-passenger fuel consumption and emission decrease proportionately. In general, higher quality fuel resulted in the lower emission of toxic products. Emissions were estimated and quantified by many researchers [46]. It was therefore the objective of this study to analyse various approaches to mitigation of climate changes in transportation sector from the perspective of drivers’ behaviour.

2.3. Safety and Driving Behaviour

Passenger safety has been strongly correlated with the on-road driving style. In this regard, Alam and McNabola [27] stated that training and educating drivers on the implication of an aggressive driving style has the potential to reduce accident rates by up to 40%. Bachoo et al. [47] conducted a survey in Greece among motorists: the aim was to evaluate their attitude toward compliance with traffic laws, such as stopping at stop signs, wearing seatbelts, and obeying the speed limit. The results showed that more than 35% of the 207 participants in a survey conducted did not comply with the traffic speed limit. In this regard, only 70% of them have the perception that compliance with the speed limit could reduce the frequency of accident. The results further indicate that most of the drivers were in a hurry and, thus, underestimate the driving risk at high speed. Consequently, this type of traffic attitude was found to influence driving behaviour and, thus, involvement in an accident [48]. Furthermore, Ulleberg and Rundmo [49] stated that personality traits are a major factor influencing risky driving behaviour, such as illegal overtaking and wrong assessment of passing distance. This was confirmed by Iversen [50] and Chen [51]. On the other hand, Oltedal and Rundmo [52] asserted that gender and personality traits are strongly correlated, which in turn influence risky driving behaviour. In addition to gender, relative difference in age was found to influence strict compliance with traffic laws [53]. In this respect, older drivers are more traffic law-compliant than younger ones, due to a sense of obligation to obey the traffic laws and perception of the danger of traffic violations [54]. This was supported by Rhodes and Pivik [55] and Ambrosio et al. [56].
Additionally, drivers’ distractions negatively affect driving behaviour and, thus, are unsafe due to potential hazard as a result of an irrational driving style [57,58]. These distracters could be child-related and cellular phone-related. In this regard, Mezanko et al. [59] investigated the relationship between driving attitude and behaviour among aged American drivers. The results indicated that drivers of at least 64 years of age were advocates of traffic safety culture. Consequently, speeding and phone-related distractions were extensively avoided due to safety concerns. Likewise, Papakostopoulos et al. [21] stated that self-rating in a questionnaire survey does not always reflect the actual performance of drivers in real-world situations. Therefore, inferring actual behaviour with self-rated driving characteristics has to be done with care. Eco-driving concept has limited references on driver attributes; thus, there is a possibility for researchers to develop, extend, or enhance the existing driving behaviour studies (see Figure 1). As mentioned earlier, psychological factor in driving behaviour are often neglected; subsequently, this study focused on the types of drivers through relevant psychological assessments: personalities [60], attitudes [61], cognition [62], or risk taking [63].

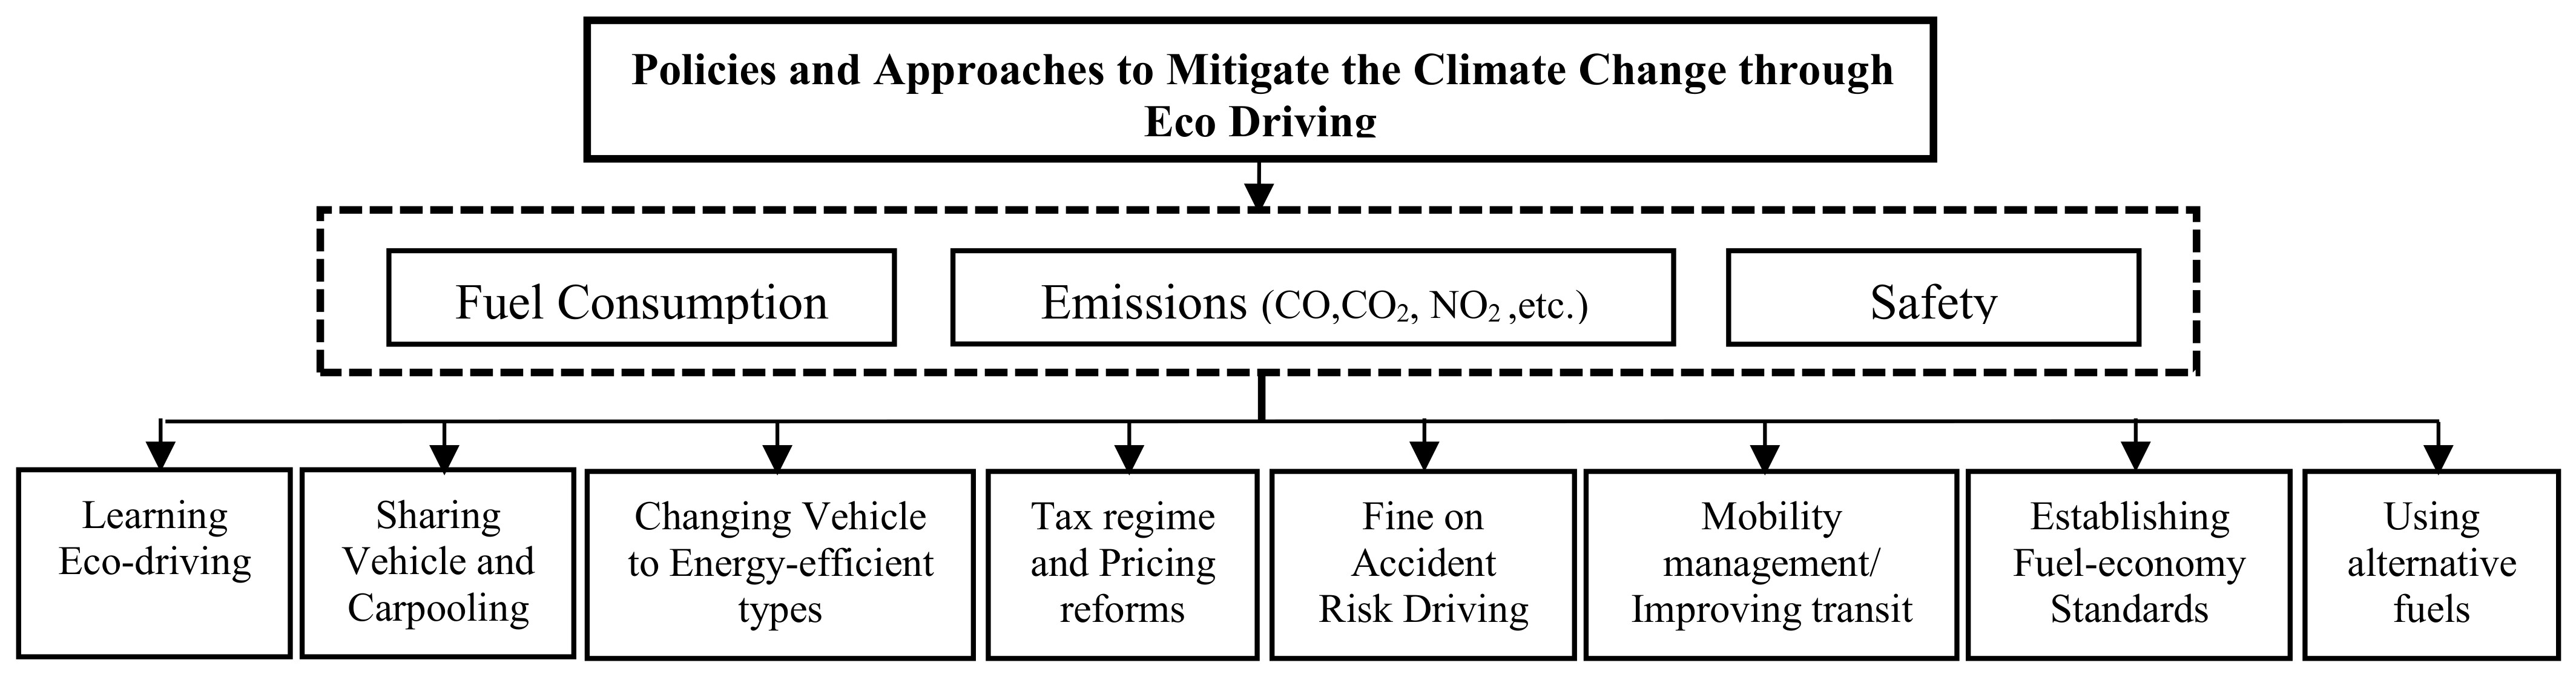
3. Climate Change Mitigation and Driving Behaviour

Figure 2 indicates the taxonomy of policies and approaches adopted to mitigate climate change from the perspective of driving behaviour. In the policies, regulations are made in an attempt to reduce vehicle operation cost and ensure environmental friendliness. To achieve this, policies, programs, and other regulations are imposed in many countries with a view to curtailing energy consumption and, perhaps, carbon emission [65,66].
Most governments nowadays invest substantially in the transportation sector. Some countries tried to impose policies with a view to regulating the fuel consumption, as well as GHG emission. A decreased rate of CO2 emission varies according to the economic and population growth of a nation. The mitigation policies implemented to regulate CO2 emission appeared to be effective over recent years in countries such as Canada and Australia, but not in China and Russia.
To further maximize the benefit of decreased fuel consumption, others have introduced a tax regime on oil, and other carbon-based fuels [67]. Consequently, fuel economy is promoted in a new automobile; it also discourages frequent driving by owners of new vehicles. In Texas, the influence of fuel price increases on traffic speed was investigated. The result indicated that, due to the increased price of gasoline, most drivers, in an attempt to save fuel, decreased their speed by up to 5.5% [68]. According to Greene and Rebound [69], a combination of multiple policies is likely to be more effective than a single one in operation. In this regard, new vehicle owners would prefer to use commercial transportation. Therefore, this approach has the potential to reduce vehicle fuel consumption in the USA by up to 5% in the next 30 years. However, this policy did not maximally reduce the fuel consumption based on the set fuel economy target.
Additionally, accident risk was regulated by introducing fines on reckless driving, particularly beyond traffic speed limits and non-compliance with traffic laws. In this regard, drivers are left with an option of either traveling according to the designated speed limit or violate the traffic laws. However, the policy appears to be less effective due to growing number of vehicle owners with different driving attitudes. To this effect, the world vehicle fleet is predicted to be tripled by the year 2050, and a substantial amount of this growth will take place in developing and other transition nations [70]. The growth in these nations was also predicted to account for over 90% of the global increase. Consequently, vehicle fuel consumption and related emissions would increase accordingly.
Furthermore, by the year 2050, the growth of vehicle per 1000 people in Eastern Europe and the former Soviet states is projected to be higher than that of the Organization for Economic Corporation and Development of Pacific and Europe, respectively. Likewise, the growth in China seems to be increasing exponentially. This is evident in the ever-increasing number of vehicles and distance covered. Therefore, fuel consumption, as well as greenhouse emissions, will continue to increase across the globe. To this effect, GHG from North America will reach a maximum of 3 gigatons/year in 2050. However, Asia will increase from 4 gigatons/year in 2000 to more than 8 gigatons per year in 2050. On the other hand, the Middle East is projected to be the largest contributor to GHG, to about 14 gigatons/year in 2050. For this reason, many countries focused on the rate of vehicle carbon dioxide emission as a measure to mitigate climate change and, perhaps, to address health-related issues [71].
Other policies include reduced traffic congestion to ensure free flow and reducing surplus speed. Additionally, policies relating to driver error, traffic violations, and other distractions, among others, were made. In the Middle East, fuel standards, public transportation, and periodic vehicle inspections were implemented. However, lack of enforcement, among other factors, have limited successes recorded in an effort to reduce GHG in the transportation sector [72]. Additionally, Egypt imposed another policy that encourages vehicle replacement and improves air quality by banning the operation of passenger cars that are at least 20 years old [73]. Furthermore, 100 taxi vehicles that are at least 35 years old were also replaced by new and more energy efficient vehicles. The program was later expanded as a structured private–public partnership between government agencies and other private establishments. The efficiency of this approach was measured by determining the percentage decrease in fuel consumption due to the replacement of old vehicles. The estimated fuel efficiency for an old vehicle was 13.16 L/100 km. On the other hand, fuel consumption of energy-efficient vehicles was 9.39 L/100 km. This implies a 28% decrease in fuel consumption due to this policy. Furthermore, another policy was enacted to progressively remove fuel subsidies. However, new vehicle ownership remained unaffected. In 2010, Canada set a target to reduce fuel consumption of motorists by up to 20% through aggressive implementation of policies on the use of energy efficient vehicles in 2016 [74]. According to the literature available to this study, Canada has not yet disclosed whether the set target was achieved. Additionally, the EU has set a target of achieving 95 gCO2/km in 2020 and is currently working hard to implement such policies necessary to achieve said target. However, fuel consumption, as well as GHG emissions, are still increasing. An annual car ownership tax was also introduced as an additional policy to regulate fuel consumption in the EU. The result of this policy indicated 0% savings in fuel consumption. Consequently, the policy was not successful in curtailing fuel consumption. This is probably due to an increased number of light-duty vehicles and a lack of coordinated programs to influence the behavioural attitude of the driving style of motorists. Recently, Russia, in addition to a vehicle replacement policy, encouraged advanced emission control facilities to be installed in most of the newly-acquired energy-efficient vehicles. The policy is, however, least effective due to the relative proportion of old light-duty vehicles [75,76,77]. Furthermore, the Russian government introduced a policy of vehicle inspections and maintenance programs. In this regard, testing of vehicles older than seven years is enforced, in which buses and taxis must be tested twice per year. Likewise, the policy is expected to reduce the cost of fuel by up to 40%.

3.1. Learning Eco-Driving

Drivers have an inherently eco-driving model, which they do not use unless there is a system to support it [78,79,80,81,82,83]. In this regard, Johansson et al. [84] confirmed that motivation and training largely influence driving style. To date, training and educating motorists are the common learning approaches to induce eco-driving on the motorist. However, other studies have developed systems to support driving behaviour and, to this effect, automated devices were used to influence drivers’ perception and practice of eco-driving. Another approach was to offer simple advice to motorists, with a view to inculcating the eco-driving concept in their mind-set. Likewise, following an eco-driving car can change the driving behaviours of some drivers [79]. Consequently, a fuel saving of up to 18.4% can be achieved [85]. Despite its benefits, eco-driving is associated with a slight increase in travel time [85,86]. Zarkadoula et al. [87], on the contrary, reported a decrease in travel time. Thus, the implication of this study is that it is not necessary to record an increase of travel time due to eco-driving. The essence of eco-driving is to change the overall driving behaviour and style of the individual, which shall be aggregated to induce savings and perhaps reduce emission for the benefits of the planet.

3.1.1. Training and Education of Eco-Driving

Information as to when and how drivers should change their behaviours is very critical to effect changes in their driving style with an eventual decrease in fuel consumption and fewer emissions [88]. Therefore, eco-driving training was promoted by both government and private establishments [89]. In this regard, such training was made to be readily and widely available to the public in the USA. Additionally, the US government engaged in a mass public campaign and awareness program on the potential of eco-driving to induce major savings in the cost of fuel [90]. However, different drivers have different perceptions and understanding of eco-driving [91]. Some have understood it to be just a technique, thus concentrated on fuel saving. Others have perceived it to be tactical and strategic, therefore focusing more on the choice of vehicle and route. In this regard, some bus drivers were subjected to a relatively short-term training on eco-driving. They were intensively educated on how and when to accelerate, decelerate, and how to apply the brake. The result has shown a significant saving of fuel and reduction in carbon emission as compared to the other set of drivers who did not acquire any form of training regarding eco-driving [92,93]. In another study, a group of young and elderly persons were subjected to eco-driving training. A positive effect of the training on drivers was acknowledged and, perhaps, more effective than offering simple advice to drivers on eco-driving tips. In this regard, a reduction in fuel consumption was induced by up to 20% [94]. However, Gaines et al. [95] asserted that the training was more effective on elderly motorists as compared to young drivers. Likewise, Jeffreys et al. [96] conducted a study where the vehicle fuel consumption was compared and assessed, after subjecting drivers to eco-driving training. The results indicated that fuel consumption was reduced by 4.6% (0.51 per 100 km) due to the eco-driving education. Stillwater and Kurani [97] and Ruty et al. [98] asserted that eco-driving had successfully reduced the energy consumption cost by 20% and led to average emission decrease of 1.7 kg of CO2 per vehicle per day.
In another study, 29 bus drivers were subjected to the eco-driving course, and the extent of the application of the learned techniques by the drivers was investigated [99]. The results have shown significant improvement in the fuel economy at the rate of 16.9% as compared to the fuel consumption prior to eco-driving. However, the major challenge is that some drivers find it difficult to put into practice their intention to eco-drive [100]. Consequently, these drivers need to be motivated to ensure compliance with eco-driving education. To this effect, the influence of motivation and incentive on drivers’ performance with respect to fuel consumption were studied by many studies [84,101,102,103,104]. It was found that fuel savings up to 5% was achieved due to non-monetary reward. Others have reported savings of 10% due to the application of a monetary reward system [105]. Chung and Wu asserted that drivers need to be motivated by ensuring the balance between effort and reward [106]. Despite the effect of training on the eco-driving, some passengers were not comfortable with the driving style of some commercial bus drivers who underwent eco-driving training. This is probably due to stressing on one aspect in an attempt to save fuel [107].

3.1.2. Automated Device to Support Driver’s Behaviour

Recent advances in telecommunication have led to several innovations in traffic engineering [108]. In this respect, automated devices are installed in some vehicles which provide information about the traffic situation and thus, suggest to the driver the optimum operating speed. Likewise, this influences drivers’ practice of eco-driving with a view to reducing both fuel consumption and air pollutants emission. This ensures driving behaviour with the least emission and perhaps most fuel-efficient acceleration, deceleration and gear shift [109]. According to Zhao et al. [110], these devices have the potential to influence driving style with the eventual decrease of carbon emission and fuel consumption by 5.37% and 5.45%, respectively. Further, in this regard, Jamson et al. [111] studied the best type of eco-driving information applied based on advice by different drivers. They found that, regardless of the information, safety was prioritized in high-density traffic to the eco-driving tips. This was supported by another study [98]. However, Ahlstrom and Kircher [112] stated that using a device that requires visual interface have always distracted driver’s attention. Alternatively, Zhao et al. [110] investigated the influence of a static device that provides voice prompt. The device support was able to advise drivers on the appropriate acceleration. Alternatively, Larsson and Ericson [113] investigated the effects of a device which offers a mechanical resistance to rapid acceleration. It was found that slow acceleration with an improved passenger comfort and provides a significant reduction in the emissions as well. However, it had little influence on fuel consumption. This was confirmed by Mensing et al. [114]. Thus, to ensure an optimal vehicle operation, participants in the training need to focus on all other aspects while practicing eco-driving rather than concentrating on only one part. Another aspect of eco-driving include; slow deceleration, early and quick gear shift, compliance to speed limit and other traffic laws, avoidance of vehicle idling, appropriate choice of route, etc. In addition, most of these applications did not take into account the effects of curves and crossing, thus cannot advise appropriately in such a situation. Consequently, Staubach et al. [85] incorporated a device that considered the effect of curves and advised on the appropriate gear shift for environmentally friendly driving. However, it was found to be associated with an increased travel time. Fors et al. [115], stated that a device that provides very simple, clear and concise information to drivers has more potential to induce behavioural as well as driving pattern changes. Otherwise, unclear information was found to cause a hard brake and acceleration [116]. In addition, Ciarla et al. [117] proposed a model that took into account the effects of intersection, roundabout and other traffic conditions to optimize the travel time. Caulfield et al. [93] recently reported on the success of the use of an on-board device in reducing emission. The device provides real-time fuel consumption and suggests an alternative route if the current one is congested.

3.1.3. Simple Advice to Motorists

An alternative approach to reducing fuel consumption and greenhouse gas emission was to advise drivers on the eco-driving tips using the Internet and other media. In this regard, Martin et al. [118] tried educating the public on eco-driving via the Internet. They sampled the opinion of 100 respondents. It was found driving behaviour of some people was influenced due to exposure to the eco-driving information. Thus, 57% of the participant in the survey had their driving behaviour improved. However, simple advice has always been inefficient with respect to smooth deceleration [94]. On the other hand, a positive effect was found regarding gearshift, steady speed and thus, reduces CO2 emission by up to 14% while NOx emission by 40% [119]. In addition, simple advice for a cold start against hot start engine on the emission of Methane, Benzene, and Alkylbenzene was analysed and compared [120]. The results indicated that cold start emissions could on average reduce Methane, Benzene, and Alkylbenzene by 91%, 81%, and 85%, respectively.

3.2. Changing Vehicle

An alternative approach to the mitigation of climate change in the transportation sector, using electric vehicles, has recently been introduced. The positive effects and benefits of these types of vehicles regarding fuel consumption and emissions have been reported [121]. In this type of vehicle, electrical energy is used as a main source of energy for their mobility. Rolim et al. [116] stated that this vehicle could decrease CO2 emissions at the rate of 63 g/km. Likewise, the least consumption over time and distance horizons has been achieved among other benefits [122,123]. On the other hand, electric vehicles are expensive to obtain. Likewise, consumer resistance to this new technology constitute an additional obstacle to the adoption of this alternative [124]. The major challenge is the energy source used for these types of vehicles [125]. In this regard, the design of energy-efficient vehicles is encouraged by some governments to reduce fuel consumption and, perhaps, gas emissions [65]. This reduces the overdependence on oil markets. For example, in the USA, a program called Corporate Average Fuel Economy (CAFÉ) was deliberately initiated in 1975. The aim of this program was to curtail fuel consumption in the entire transportation sector, particularly road transport. In this regard, automakers were obliged to design car fleets with weighted average consumption of 18 miles per gallon (mpg). However, the increased population coupled with the driving style of car owners raised the average consumption to 27.7 mpg in 1985. On the other hand, 16 mpg was earmarked for the light truck in 1980, which also increased to 22.5 mpg in 1980. However, this policy was observed to be less effective over the years. Consequently, another policy was made in 2009, with a view to pursuing fuel economy programs aggressively between 2011 and 2016. The focus of this new policy was to limit fuel consumption, as well as CO2 emission. In this regard, use of vehicles with a gearshift indicator necessary to achieve maximum fuel saving was introduced [49].

3.3. Sharing Vehicle

Alternatively, the car-sharing concept, which is based on collaborative consumption, is currently being investigated to establish its effect on sustainable mobility. This approach deals with a faster, comfortable, and more environmentally-friendly mobility with fewer private cars. Car-sharing considers other issues that failed to be addressed by conventional public transports, taxis, and car rental. In this concept, necessary associated fixed costs, as well as other obligations, are eliminated. According to Furnier et al. [126], car-sharing integrated with electric vehicles contribute to a more sustainable mobility when solar and wind are the major energy sources for the operation of such vehicles. However, securing such a renewable energy source is necessary for successful sustainable operation. Additionally, car-sharing practices can substantially reduce traffic congestion as it provides stations where vehicles can be picked up and returned at different stations. On the other hand, this approach requires very large investment, as well as many vehicles to meet the demand of prospective customers. To date, there are a limited number of young adult drivers ready to adopt car-sharing integrated with electric vehicles [126]. Furnier et al. [127] stated that car-sharing integrated with electric vehicles was found to reduce energy consumption by up to 67%. Furthermore, the study revealed a 40% saving potential in the carbon dioxide emission due to car-sharing integrated with electric vehicles.
Carpooling is an alternative mobility management approach in which groups of participants travel together in one common vehicle. In this regard, all the associated costs are shared by all the participants. An assessment survey in Portugal by Correia and Viegas [128] revealed that carpooling systems can potentially reduce the number of private vehicles in urban cities. This is due to common work schedules and activity sectors of the potential participants [129]. Therefore, a high-level application of carpooling is currently commonly found in manufacturing, construction, and other less readily accessible areas. However, it is obvious that such a system could not consider a trip schedule of a member different from the usual one and, thus, is apparently inflexible. Moreover, riding with strangers poses a psychological barrier to a successful implementation of the approach in other areas of a metropolis. Consequently, these limit the number of participants in carpooling, as asserted by Teal [130]. In this regard, the influence of carpooling on carbon emissions, and other sustainable mobility parameters, as well as driving behaviour, cannot be significantly established. Song et al. [131] proposed a network-based carpooling scheme that considers traffic issues integrating route matching for sustainable mobility. The main focus of the study was, however, to decongest traffic during peak hours. Therefore, the potential of network-based carpooling to curtail fuel consumption and traffic emissions cannot be guaranteed.

3.4. Fine and Tax on Risky Driving

Accident risk was regulated by introducing fine on the reckless driving, particularly beyond traffic speed limit and non-compliance with traffic laws. In this regard, drivers are left with an option of either traveling according to designed speed limit or violation of traffic law. However, the policy appears to be less effective due to growing number of vehicle owners with different driving attitude. To this effect, the world vehicle fleet is predicted to be tripled by 2050, and substantial amount of this growth will take place in developing and other transition nations [70]. The growth in these nations was also predicted to account for over 90% of the global increase. Consequently, vehicle fuel consumption and related emission would increase accordingly.
In addition, by 2050, the growth of vehicle per 1000 people in Eastern Europe and Former Soviet is projected to be higher that of the Organization for Economic Corporation and Development (OECD) of Pacific and Europe, respectively. Likewise, the growth in China seems to be increasing exponentially. This is evident in the ever-increasing number of vehicles and distance covered. Therefore, fuel consumption as well as greenhouse emission will continue to increase across the globe. To this effect, GHG from North America will reach maximum of 3 gigaton/year in 2050, while Asia will increase from 4 gigaton/year in 2000 to more than 8 gigaton/year in 2050. The Middle East is projected to be the largest contributor GHG to about 14 gigaton/year in 2050. For this reason, many countries focused on rate of vehicle carbon dioxide emission as a measure to mitigate climate change and perhaps to address health-related issues [71].
Carbon (or Fuel) taxes encourage energy conservation in transportation sector. This approach can assist the government to achieve sustainable development via multiple planning; for instance, via traffic congestion reduction. Numerous advantages such as road and parking cost saving, enhancement in traffic safety and mobility, health and fitness, energy conservations, and reduction of emission are identified [132]. Subsidised fuels should be eliminated to reduce current emissions levels [133] along with imposed taxes or by increasing tax rate upon carbon-based fuels used [134]. In Norway, the implementation of a carbon tax did not show significant reduction due to the economic growth in the production of oil and gas in that country. Furthermore, the Swedish government claimed that its emission level increased 20% without carbon taxing in 1991. Meanwhile, in Australia, the carbon tax policy was revoked in 2014 corresponding to a desire to lower costs for Australian businesses and ease the cost of living for households [135]. Transport pricing reforms is operated based on fuel taxation, registration and parking fees, and distance-based insurance. In the U.S., 2–4 cents/veh.km of user fees are imposed, including 6.12 cents/veh.km and 6–8 cents/veh.km of parking and registration fees and other fuel taxes upon greater production of pollution in the transportation sector [136,137].

3.5. Mobility Management

Mobility management includes reducing total vehicle travel through car free planning and vehicle restrictions, commuter trip reduction programs, distance based vehicle insurance and registration fees, distance based emission fees, freight transport management, fuel tax increases, mobility management marketing, non-motorized transportation improvements, ridesharing improvement and incentives, road pricing, smart growth development policies, tele-work encouragement, and transit improvements and incentives. Despite the difficulties of mobility management implementation, major benefits in terms of congestion reduction, road savings, parking savings, road safety, environmental protection, and efficient and liveability of land use can be seen through reductions of travel trips, car ownership, travel time, and traffic speeds. In addition, this method allows for effective choice of transportation and cost savings for consumers [137]. Globally, public transportation improvement is claimed to be a non-efficient strategy to reduce CO2 emissions because of the high expenses required, estimated at approximately 83.8 cents/kg CO2. It is estimated that about $1 million is needed to improve existing facilities, including frequency of service, speed, travel rates, and comfort for users to commute without hassle. On average, a 0.15 kg g of CO2 per kilometre reduction will cost at least 100 cents/kg CO2 annually. Moreover, it is predicted that, in 2016, fuel-economy standards (FES) would be burdensome to consumer, adding at least 3800 USD per car as the average price of a new car would rise 6200 USD [138]. In any case, it is expected that the FES/CAFE standards will increase to 46.60 mpg in 2025 [139], and higher prices will force millions of low income earners out of the new car market.

3.6. Alternative Fuels

Fuels substitution has always been an encouraging strategy to reduce fuel consumption and emissions through production of alternative fuels in the market, including LPG (liquefied petroleum gas), biofuel (methanol, ethanol, etc.), hydrogen, and electricity [140,141]. Mixed fuels that contain 85% cellulosic ethanol mixed with 15% gasoline will produce 5456.978 mpg GHG emissions, which is lower than the GHG level in compressed natural gas (CNG) and diesel vehicles. In Europe, biofuels account for 4.7% of the energy consumption in road transport. Belgium consumed 7% biofuels (bio-ethanol) in conventional gasoline, while Brazil is recorded among the highest users of bio-ethanol with conventional fuel at about 25% [142]. Bio-ethanol is a green fuel categorized under biofuels. It is equivalently sustainable to gasoline made from organic material. Bio-ethanol has better anti-knock properties compared to gasoline and fewer emissions of CO2 and unburned hydrocarbons. Furthermore, bio-ethanol is partially oxidized and has a high flash point and auto ignition temperature [141]. Biodiesel is also in the family of biofuels and is made from soy bean or other feed stocks. The advantages of biodiesel in conventional engines include that it can be safely used without engine modification; it produces less GHG emissions; it is biodegradable, non-toxic, and economical; and it reduces foreign oil dependence. The use of compressed natural gas (CNG) also resulted in reduced emissions of NOx and PM, with most heavy duty vehicles, such as trucks and lorries. Running an electric powered vehicle emits zero emission, but the electricity needs to be produced. Subsequently, researchers have predicted the global reduction would be as much as 59–71% in real world driving in 2050; however, this depends on the electricity grid carbon intensity [143]. Table 1 presents the quantitative estimation of environmental benefits indicated by the driving behaviour studies.

4. Discussion

The research was conducted using the content analysis method with three stages: identification, screening, and synthesizing. Identification stage involved the process of collecting articles using relevant keywords, included “driving behaviour”, “mitigation policies”, “vehicle fuel consumption”, “vehicle tailpipe emission”, “safety”, and “climate change”. Many articles were found in association with these keywords. To be current, the articles included and reviewed for this study were published between 2000 and 2018. The identified literature was screened in terms of the consistency and quality of the findings. Low quality articles were dropped. Through the content analysis method, the remaining articles were analysed based on the codes (i.e., keywords). The content analysis method evaluated the articles qualitatively, meaning it traced all those codes (i.e., keywords) in the articles and then marked in the matrix tables via reference citation and/or tick (√). In this research, the content analysis method synthesized the articles regarding diverse aspects, including the frequency aggregation on individual approach, considering the scope, study type as case study area, variables influencing driving behaviour, and the techniques for measuring dependant and independent variables influencing driving behaviour. The results of synthesized articles were tabulated in the form of matrix tables presented in the following sections (Table 2, Table 3, Table 4 and Table 5).

4.1. Frequency Aggregation on Climate Change Mitigation Policies

Table 2 enlisted the frequency of citations in respect of various approaches adopted to mitigate climate change. In this regard, Table 2 indicates that the most frequently adopted approach is learning eco-driving, followed by eco-vehicle design, and car-sharing. Table 2 further indicates that training and education, use of the automated devices on the vehicles, and simple advice on eco-driving tips are the common learning methods of eco-driving. In this regard, training and educating drivers to inculcate changes to their driving behaviour and style, and, thus, to adapt to fuel-efficient driving behaviours, appeared to be the most frequent learning method. This seems to be very effective regarding its positive influence on drivers’ behaviour. Consequently, this led to driving behaviour and styles characterized by the least fuel consumption and lowest emission, with increased safety of both driver and passengers. The next most frequently-applied learning method is the use of automated devices installed in the vehicle. These devices captured information from traffic data and offered advice to motorists as appropriate with respect to their driving style. Moreover, Table 2 shows that the least and, perhaps, moderately less effective learning method was the use of simple advice to motorists on eco-driving tips. On the other hand, tax and fine regime is the least adopted approach. In Table 2, car-sharing is among the approaches adopted; however, it is the least implemented approach due to significant capital requirements coupled with people resistant to change.
Moreover, Table 2 shows that most of the policies advocated by many governments focused on replacement of old vehicles with new ones, regulations to ensure periodic inspections of vehicles, and fines on risky driving. Furthermore, Table 2 indicates that the use of energy-efficient vehicle is the frequently imposed mitigation policy in driving behaviour studies. In this regard, automakers were mandated to design vehicles with lower fuel consumption, consistent with the set target of specific consumption over a unit mile [48]. In the beginning, the policy seems to be effective, however, due to the increased number of vehicles, coupled with the different driving style of motorists, the policy progressively becomes ineffective over the years.
Consequently, the fuel consumption was raised beyond the set target. Table 2 further indicates that the next most frequently implemented approach was the use of alternative policies. Such policies include a program to ensure periodic vehicle inspections, fuel standards, use of vehicles with advanced emission control facilities, and the replacement of old vehicles with new ones. Additionally, a tax regime on the price of fuel was an option advocated to complement the previous policy. However, due to ineffective control mechanisms to properly coordinate the implementation of these policies, as well as the lack of other polices to induce a change in behavioural attitudes coupled with the increased number of both light and diesel fuel vehicles, increased fuel consumption remains an issue in the transportation sector.

4.2. Frequency Aggregation in Respect of the Scope, Study Type as Cases Study Area

Table 3 enlistes the type of studies, scope of the studies, as well as study area. To this effect, simulation studies, experimental investigations, and surveys are the typical studies conducted. In this regard, frequency aggregation has shown that the majority of the studies were experimental, in which special tools were installed in the vehicles to collect such information as fuel consumption and emission data in relation to driving style. Moreover, it can be seen in Table 3 that the survey was the next most frequent type of study conducted. In this regard, perceptions of individual drivers regarding safe driving, environment-friendly, and economical driving patterns were assessed and analysed. Additionally, the relationships among driving behaviour, fuel consumption, emissions, and safety were modelled. Furthermore, as can be seen in Table 3, instead of real-world data, simulation studies were conducted to represent the real-world driving scenario and traffic conditions. Consequently, fuel consumption, emissions and safety were analysed based on the assessed driving style.
Moreover, Table 3 shows that, irrespective of the study, diesel-fuelled private and public transports were the typical types of vehicles investigated. However, the majority of the studies were conducted based on the public vehicle fleet. Likewise, a heavy-duty vehicle fleet was the next most frequent type of vehicle investigated. Additionally, private vehicles were also among the motorists studied, with eco-vehicles being the least frequent type of motorist evaluated. This is probably due to the high cost of acquisition; hence, it is not readily affordable to most motorists and, thus, not frequently used on the street and other arterial roads.
Table 3 indicates that urban area/city and other places such as street, inter-urban roads, rural roads and freeways are common locations where these studies are conducted. In this regard, city/urban areas are the most frequently investigated case studies. However, this is followed by a simultaneous investigation of urban areas and another areas. The next most frequently-investigated study areas were freeways.
Table 3 enlistes the drivers’ characteristics, dependent variables, and driving behaviours. In this regard, young and elderly and male and female motorists were investigated. Likewise, driving behaviours, such as compliance with speed limits and acceleration and deceleration styles, are the common driving style investigated. Other driving styles, such as gear shifting, braking, engine idling, work pressure, pre-trip vehicle inspection, choice of route, overtaking, and compliance to traffic rules were among the driving behaviours investigated. Furthermore, fuel consumption; emissions of CO2, NOx, and CO; and safety appeared to be the common variables studied to establish the influence of such driving behaviour.
Table 3 further indicates that compliance with speed limits was the most frequently studied driving behaviour with respect to its influence on safety, fuel consumption, and emissions. This was followed by acceleration/deceleration behaviour. On the other hand, the simultaneous influence of acceleration/deceleration behaviour, compliance to speed limits, and other behaviours were among the least frequent studied. Likewise, the simultaneous influence of deceleration, compliance to speed limits, and other driving behaviours was not well acknowledged by many researchers. However, effects of adhering to speed limits, gear shifting behaviour, and breaking style was among the frequently investigated studies. In this regard, early gear shifting, compliance to the speed limit, and steady application of the brake were found to reduce fuel consumption, and emissions of NOx, CO, and CO2. Moreover, Table 3 shows that the effect of acceleration/deceleration alone on vehicle fuel consumption was the least frequently investigated driving behaviour. As can be seen in Table 3, the influence of gender and age variation was acknowledged by a substantial number of studies. The majority of them were overwhelmed by the influence of sex and age on safe driving behaviours. In this regard, young male and female drivers were the most frequently investigated group. This was followed by both young and elderly men and women motorists. To this effect, the results indicated that elderly male drivers have more sense of obligation to obey traffic rules and, thus, are characterized by the least risky driving behaviour. Table 3 further indicates that the majority of the studies in this subject area were conducted to establish the influence of driving behaviour on vehicle fuel consumption. In this regard, fuel savings of up to 20% was achieved. On the other hand, the next frequent study was the influence of driving behaviour on the safety of motorist and other passengers. To this effect, elderly drivers were found to better comply with traffic rules than younger ones. Consequently, they are more involved in less risky driving. This was followed by other studies where the influence of driving behaviour on both fuel consumption and CO2 emission was investigated and established.

4.3. Frequency Aggregation of Variables Influencing driving Behaviour

Table 4 shows that significant numbers of studies have been conducted to establish the effect of driving style on both fuel consumption and the emission of other gasses. In this regard, compliance with speed limits and slow acceleration have greatly minimized emissions of NOx and CO. Likewise, Table 4 indicates that few studies were conducted to establish the effect of noncompliance to speed limits on the emissions of NOx, CO, and CO2. The result shows that emission of NOx, CO, and CO2 increases with speeding. Moreover, it can be seen in Table 4 that limited studies exist where the influence of driving behaviour on fuel consumption and emissions of CO2 and other gasses was investigated at the same time. Additionally, there are few studies on the effect of a slow rate of acceleration/deceleration and compliance to speed limits on fuel consumption, CO2 emission, and safety of passengers, as well as motorists.
Table 4 has two rows called “Frequency” and “Depth of Citation”. The frequency determines times of citations for each factor by summing up the citations, and the depth of citation indicates the rate of citation for each factor by dividing the frequency of the factor to the total (i.e., 28 citations). For example, CO emission has been cited 4 times out of 28, so Frequency for the CO emission is 4, and Depth of Citation is 14.2%. According to Table 4, 96.2% of eco driving researchers have studied fuel consumption. In addition, all researchers have studied CO2 emission, while few have investigated the PM emission in eco driving (7.1%). Indeed, Table 4 can show how much eco driving researchers have focused on different factors of this topic.

4.4. Frequency Aggregation of Measurement Techniques in Driving Behaviour Studies

Table 5 enlistes the measurement techniques for the dependent variables. Table 5 indicates that common techniques adopted are the use of on-board equipment and other methods for measuring the fuel consumption; CO2 emission; and NOx, CO, and CH emissions. On the other hand, safe driving was assessed by the accident risk. On-board equipment includes tools usually mounted on the vehicle to capture the data on fuel consumption and gaseous emissions. Other techniques for measuring vehicle fuel consumption involved the use of an on-board diary, simple numerical computation, and the use of on-board fuel flow meter information from drivers about the vehicle fuel tank level per day, monthly vehicle-kilometres of a driver, and microscopic emission models. Likewise, traffic emissions were measured using a flexible rubber tube laid out on the road surface, using an emission equation model and analytical method.
Furthermore, Table 5 presents the factors that influence such driving behaviours as acceleration/deceleration, compliance to speed limits and traffic laws, gear shifting style, idling, and choice of route. It can be seen in Table 5 that acceleration/deceleration behaviour and compliance with speed limits are commonly influenced by drivers’ aggression and anxiety. This is probably due to some drivers being in a hurry for an appointment and natural impatience. Additionally, other factors, such as motivation to save fuel, environmental consciousness, drowsiness, and drinking and driving, largely influence driving speed and acceleration/deceleration behaviour. Moreover, Table 5 shows that gender and age are the common characteristics that influence drivers’ compliance with traffic laws, such as stopping at stop signs and wearing of seat belts, among others. Likewise, drivers’ distractions and workplace pressure were among the influencing factors. In this regard, females and elderly drivers were found to have more enthusiasm to obey traffic laws. Consequently, they showed a less risky driving style than young male drivers. However, the influence of gender and age on acceleration/deceleration behaviour has not been extensively investigated and reported.

4.5. Vehicle Light-Weighting and Life Cycle Assessment

Vehicle factors such as types of engine, fuels, engine capacity, maintenance, air conditioned, maintenance, and tire pressure have shown significant impact on vehicle fuel consumption and tailpipe emission. Besides, high engine performance, lightweight, small engine size, and automatic engine stopping system have made almost negligible emissions and lower fuel consumption [157]. This is because the engine will be used in an operating area that corresponds to better efficiency [158]. According to Alessandrini et al. [159], a conventional car consumes 12.6 L/100 km fuel with average CO2 emissions around 260 g/km while a hybrid car consumes 8.23 L/100 km fuel with average CO2 emissions of 180 g/km.
The policies resulting in using smaller or lightweight vehicles can change the end-of-life performance of the vehicle, and reduce the fuel consumption of the vehicle [160,161], while maximize the life-time energy consumption [162,163]. Paulino et al. [161] stateed that lightweight vehicles “have a reduced impact on the current infrastructures of fuel production and vehicle maintenance in opposition to the vehicles that use alternative energy sources”. Koffler and Rohde-Brandenburger [164] expressed that “lightweight design has been recognized as one of the key measures for reducing vehicle fuel consumption, along with power train efficiency, aerodynamics and electrical power management”. Indeed, using lightweight materials for vehicle manufacturing has been significantly successful compared to using biofuels (5%) [161]. The light-weighting policy unanimously has fewer trade-offs in adoption of novel and new materials and technologies [160,165]. Lightweight vehicles use aluminium, magnesium alloy, carbon-fibre reinforced polymer (CFRP) and other materials, which have lower GHG and CO2 emissions over vesicle’s life-cycle than iron and steel [165,166,167]. For example, replacing steel Mg has led to 5.7% weight reduction that decreases the vehicle fuel consumption and life cycle emissions by 1.3% and 0.8%, respectively. US Federal Test Procedure driving cycles (United States Environmental Protection Agency [168]) and the United Nations Economic Commission for Europe [169] are evaluating the lightweight LCA based on Fuel Reduction Value (FRV) coefficient. The FRV should be in the range 0.02–1.00 L/100 km.

5. Conclusions

Transport sector is meant for passenger and goods movements through land, air, and water carriers. Rapid urbanization and ever-increasing population growth are the major factors increase vehicle ownership and mobility demand, which further leads to CO2 and GHG emissions and energy sources consumption. In addition, growth in personal income allows an individual to purchase more than one car. As a result, the individual may own two or three cars that increases indirectly the vehicle travelled mileage (VTM), and, substantially, CO2 emission and fuel consumption. Logically, the more we travel, the higher the number of trips generated, and, subsequently, more fuel will be burnt.
In this study, various approaches that were adopted to mitigate climate change in transportation sectors from the perspective of driving behaviour of motorists were analysed and compared.
(a)
Based on the previous studies, common approaches adopted to mitigate climate change in transportation sectors are learning eco-driving, using eco-vehicles, and car-sharing. Additionally, car-sharing/carpooling is among the approaches with the potential to mitigate climate change, however was least investigated. Likewise, vehicle fuel consumption, and emissions of CO2, NOx, CO, and CH, coupled with safe driving, were the common evaluation criteria for each approach. However, economic motivation to reduce fuel consumption appeared to be the most frequently adopted criteria. In this regard, eco-driving was found to be the most frequently adopted approach due to its potential to induce a behavioural change that can lead to new adaptive driving behaviours and, thus, cause a significant decrease of vehicle fuel consumption and CO2 emissions, as well as NOx, CO, CH.
(b)
Acceleration/deceleration and compliance to speed limits are the most frequent driving behaviours investigated by many studies. However, other driving behaviours, such as compliance with traffic laws, gear shifting, braking style, idling of the vehicle, and choice of route were among the driving behaviours investigated. In this regard, positive effects of a slow acceleration/deceleration style and compliance to the speed limit, on vehicle fuel consumption have been established. To this effect, fuel saving was increased to 18%. On the other hand, annual emission of CO2 was decreased by 12%, CO by 13%, and NOx by 24%. Additionally, an average reduction of 1.7 kg of CO2 per vehicle per day was achieved due to a decrease of engine idling. Likewise, compliance with speed limits and early gear shifting led to fuel savings of up to 16.9%.
(c)
Anxiety, aggression, motivation, and incentive were found to be the common factors influencing driving behaviours. Furthermore, gender, age, stress, drowsiness, distraction, and drinking and driving were among the influencing factors that led to unsafe driving behaviours.
(d)
It is observed that most mitigation policies adopted were based on target limits with respect to fuel saving and carbon emissions set to be achieved over time. However, many countries could not realize the set within the targeted period. This is probably due to increased number of light-duty vehicles and a lack of coordinated programs to influence the behavioural attitude of the driving style of motorists.
(e)
Tax and fine regime did not receive considerable attention due to the high cost of acquisition and natural human resistance to change.
(f)
The influence of gender and age on driving behaviours that led to a more fuel-efficient driving style with the least GHG emission has not been extensively investigated.

Acknowledgments

The authors would like to thank the Malaysia Ministry of Science Technology and Innovation (MOSTI) grant vote No. R.J130000.7922.4S123. In addition, the authors appreciate these organizations for their supports and contributions and Research Management Center at Universiti Teknologi Malaysia.

Author Contributions

Ali Keyvanfar, Arezou Shafaghat, Nasiru Zakari Mohammad, and M. Salim Ferwati contributed to preparing this manuscript.

Conflicts of Interest

The authors declare no conflict of interest.

References

  1. Muslim, N.H.; Keyvanfar, A.; Shafaghat, A.; Abdullahi, M.A.M.; Khorami, M. Green Driver: Travel Behaviors Revisited on Fuel Saving and Less Emission. Sustainability 2018, 10, 325. [Google Scholar] [CrossRef]
  2. Shafaghat, A.; Keyvanfar, A.; Zakaria, W.Z.; Zaimi, M.Z.A.; Lamit, H.; Ali Kh, N.; Ahmad, M.H.; Iskandar Ariffin, S.A. Investigation of Future Building Performance Factors Towards Energy Efficient Travel Plan in Regional Development. J. Teknol. 2014, 70, 77–81. [Google Scholar]
  3. Yan, X.; Crookes, R.J. Energy demand and emissions from road transportation vehicles in China. Prog. Energy Combust. Sci. 2010, 36, 651–676. [Google Scholar] [CrossRef]
  4. Lamit, H.B.; Majid, M.Z.A.; Shafaghat, A.; Keyvanfar, A. Sidewalk Design Decision Making Model Based on Walking Behaviour Pattern Recognition: Proposal Validation. OIDA Int. J. Sustain. Dev. 2012, 4, 27–34. [Google Scholar]
  5. Annual European Union Greenhouse Gas Inventory 1990–2012 and Inventory Report 2016. Eurpopean Energy Agency, UNFCCC Secretariat: Bonn, Germany. Available online: https://www.eea.europa.eu/publications/european-union-greenhouse-gas-inventory-2014 (accessed on 10 April 2018).
  6. Ando, R.; Nishihori, Y. A Study on Factors Affecting the Effective Eco-driving. Procedia-Soc. Behav. Sci. 2012, 54, 27–36. [Google Scholar] [CrossRef]
  7. Hsu, C.Y.; Yang, C.S.; Yu, L.C.; Lin, C.F.; Yao, H.H.; Chen, D.Y.; Lai, K.R.; Chang, P.C. Development of a cloud-based service framework for energy conservation in a sustainable intelligent transportation system. Int. J. Prod. Econ. 2015, 64, 454–461. [Google Scholar] [CrossRef]
  8. Wang, Y.; Yan, X.; Zhou, Y.; Xue, Q. Influencing Mechanism of Potential Factors on Passengers’ Long-Distance Travel Mode Choices Based on Structural Equation Modeling. Sustainability 2017, 9, 1943. [Google Scholar] [CrossRef]
  9. Ariens, G.A.M.; Vanmechelen, W.; Bongers, P.M.; Bouter, L.M.; Vanderwal, G. Psychosocial risk factors for neck pain: A systematic review. Am. J. Ind. Med. 2001, 39, 180–193. [Google Scholar] [CrossRef]
  10. Lievense, A.M.; Bierma-Zeinstra, S.M.A.; Verhagen, A.P.; Verhaar, J.A.N.; Koes, B.W. Prognostic factors of progress of hip osteoarthritis: A systematic review. Arthritis Care Res. 2002, 47, 556–562. [Google Scholar] [CrossRef] [PubMed]
  11. C2ES- the Center for Climate and Energy Solutions. Transportation Overview. 2016. Available online: http://www.c2es.org/energy/use/transportation (accessed on 1 January 2018).
  12. Zholudeva, N. Transport Fuels. 2016. Available online: https://www.studentenergy.org/topics/transport-fuels (accessed on 1 January 2018).
  13. US Department pf Energy (DOE). Transportation Fuels: The Future Is Today. 2006. Available online: http://www.formula-hybrid.org/wp-content/uploads/DOE-Alternative-Fuels-Teacher-Guide.pdf (accessed on 15 December 2017).
  14. US Energy Information Administration. Energy Information Administration. International Energy Outlook; US Energy Information Administration: Washington, DC, USA, 2011.
  15. US Department of Transportation (USDOT). Traffic Monitoring Guide. 2014. Available online: https://www.fhwa.dot.gov/policyinformation/tmguide/tmg_2013/vehicle-types.cfm (accessed on 1 March 2018).
  16. United Nations Economic Commission for Europe (UNECE). Glossary for Transport Statistics-Passenger car. 2013. Available online: http://epp.eurostat.ec.europa.eu/cache/ITY_OFFPUB/KS-BI-03-002/EN/KS-BI-03-002-EN.PDF (accessed on 15 December 2017).
  17. Blumberg, K. US: Vehicle Definitions. 2015. Available online: http://transportpolicy.net/index.php?title=US:_Vehicle_Definitions (accessed on 15 December 2017).
  18. Legal Information Institute (LII). 49 CFR 523.6-Heavy-Duty Vehicle. 2011. Available online: https://www.law.cornell.edu/cfr/text/49/523.6 (accessed on 15 December 2017).
  19. Global Facilitation Partnership (GFP). Maritime Transport. 2013. Available online: http://www.gfptt.org/node/67 (accessed on 15 December 2017).
  20. TxDOT- the Texas Department of Transportation Federal Highway Administration (FHWA) 13-Vehicle Classes with Definitions—MAG Internal Truck Travel Survey and Truck Model Development Study. 2013. Available online: http://onlinemanuals.txdot.gov/txdotmanuals/tri/classifying_vehicles.htm (accessed on 15 December 2017).
  21. Papakostopoulos, V.; Marmaras, N.; Nathanael, D. The “field of safe travel” revisited: Interpreting driving behaviour performance through a holistic approach. Transp. Rev. 2017, 1–20. [Google Scholar] [CrossRef]
  22. Shafaghat, A.; Keyvanfer, A.; Muslim, N.H.B. Drivers’ adaptive travel behaviors towards green transportation development: A critical review. Arch. Transp. 2016, 38, 49–70. [Google Scholar] [CrossRef]
  23. McGordon, A.; Poxon, J.E.; Cheng, C.; Jones, R.P.; Jennings, P.A. Development of a driver model to study the effects of real-world driver behaviour on the fuel consumption. Proc. Inst. Mech. Eng. Part D J. Automob. Eng. 2011, 225, 1518–1530. [Google Scholar] [CrossRef]
  24. Li, S.E.; Peng, H. Strategies to minimize the fuel consumption of passenger cars during car-following scenarios. Proc. Inst. Mech. Eng. Part D J. Automob. Eng. 2012, 226, 419–429. [Google Scholar] [CrossRef]
  25. Haworth, N.; Symmons, M. Driving To Reduce Fuel Consumption And Improve Road Safety. Monash University Accident Research Centre. Available online: http://acrs.org.au/files/arsrpe/RS010036.pdf (accessed on 3 March 2018).
  26. Majid, M.Z.A.; Bigah, Y.; Keyvanfar, A.; Shafaghat, A.; Mirza, J.; Kamyab, H. Green Highway Development Features to Control Stormwater Runoff Pollution. J. Environ. Treat. Tech. 2015, 4, 173–175. [Google Scholar]
  27. Alam, M.S.; McNabola, A. A critical review and assessment of Eco-Driving policy & technology: Benefits & limitations. Transp. Policy 2014, 35, 42–49. [Google Scholar]
  28. Wills, A.R.; Watson, B.; Biggs, H.C. Comparing safety climate factors as predictors of work-related driving behavior. J. Saf. Res. 2006, 37, 375–383. [Google Scholar] [CrossRef] [PubMed] [Green Version]
  29. Carrese, S.; Gemma, A.; La Spada, S. Impacts of Driving Behaviours, Slope and Vehicle Load Factor on Bus Fuel Consumption and Emissions: A Real Case Study in the City of Rome. Procedia-Soc. Behav. Sci. 2013, 87, 211–221. [Google Scholar] [CrossRef]
  30. Shafaghat, A.; Keyvanfar, A.; Manteghi, G.; Lamit, H. Environmental-conscious factors affecting street microclimate and individuals’ respiratory health in tropical coastal cities. Sustain. Cities Soc. 2016, 21, 35–50. [Google Scholar] [CrossRef]
  31. Sun, L.; Karwan, M.H.; Kwon, C. Incorporating driver behaviors in network design problems: Challenges and opportunities. Transp. Rev. 2016, 36, 454–478. [Google Scholar] [CrossRef]
  32. Jamriska, M.U.; Morawska, L. A model for determination of motor vehicle emission factors from on-road measurements with a focus on submicrometer particles. Sci. Total Environ. 2001, 264, 241–255. [Google Scholar] [CrossRef]
  33. Clark, N.N.; Kern, J.M.; Atkinson, C.M.; Nine, R.D. Factors Affecting Heavy-Duty Diesel Vehicle Emissions. J. Air Waste Manag. Assoc. 2002, 52, 84–94. [Google Scholar] [CrossRef] [PubMed]
  34. Hak, C.S.; Hallquist, M.; Ljungström, E.; Svane, M.; Pettersson, J.B.C. A new approach to in-situ determination of roadside particle emission factors of individual vehicles under conventional driving conditions. Atmos. Environ. 2009, 43, 2481–2488. [Google Scholar] [CrossRef]
  35. Van Mierlo, J.; Maggetto, G.; Van De Burgwal, E.; Gense, R. Driving style and traffic measures - infuence on vehicle emissions and fuel consumption. Proc. Inst. Mech. Eng. Part D J. Automob. Eng. 2016, 218, 43–50. [Google Scholar] [CrossRef]
  36. Kholod, N.; Evans, M.; Gusev, E.; Yu, S.; Malyshev, V.; Tretyakova, S.; Barinov, A. A methodology for calculating transport emissions in cities with limited traffic data: Case study of diesel particulates and black carbon emissions in Murmansk. Sci. Total Environ. 2016, 547, 305–313. [Google Scholar] [CrossRef] [PubMed]
  37. Shafaghat, A.; Manteghi, G.; Keyvanfar, A.; Lamit, H.B.; Saito, K.; Ossen, D.R. Street Geometry Factors Influence Urban Microclimate in Tropical Coastal Cities: A Review. Environ. Clim. Technol. 2016, 17, 61–75. [Google Scholar] [CrossRef]
  38. Rodríguez, R.A.; Virguez, E.A.; Rodríguez, P.A.; Behrentz, E. Influence of driving patterns on vehicle emissions: A case study for Latin American cities. Transp. Res. Part D Transp. Environ. 2016, 43, 192–206. [Google Scholar] [CrossRef]
  39. Nelson, P.F.; Tibbett, R.A.; Day, S.J. Effects of vehicle type and fuel quality on real world toxic emissions from diesel vehicle. Atmos. Environ. 2008, 42, 5291–5303. [Google Scholar] [CrossRef]
  40. Ban-Weiss, G.A.; Lunden, M.M.; Kirchstetter, T.W.; Harley, R.A. Size-resolved particle number and volume emission factors for on-road gasoline and diesel motor vehicles. J. Aerosol Sci. 2010, 41, 5–12. [Google Scholar] [CrossRef]
  41. Soltic, P.; Weilenmann, M. NO2/NO emissions of gasoline passenger cars and light-duty trucks with Euro-2 emission standard. Atmos. Environ. 2003, 37, 5207–5216. [Google Scholar] [CrossRef]
  42. Karavalakis, G.; Short, D.; Vu, D.; Russell, R.L.; Asa-Awuku, A.; Jung, H.; Johnson, K.C.; Durbin, T.D. The impact of ethanol and iso-butanol blends on gaseous and particulate emissions from two passenger cars equipped with spray-guided and wall-guided direct injection SI (spark ignition) engines. Energy 2015, 82, 168–179. [Google Scholar] [CrossRef]
  43. Nesamani, K.S.; Subramanian, K.P. Impact of Real-World Driving Characteristics on Vehicular Emissions. JSME Int. J. Ser. B Fluid Therm. Eng. 2006, 49, 19–26. [Google Scholar] [CrossRef]
  44. Rosqvist, L.S.; Planning, T. Vehicular Emissions and Fuel Consumption for Street Characteristics in Residential Areas. Available online: https://pdfs.semanticscholar.org/3205/93dfa9eb1c082bb52d10bfd833e83789a00d.pdf (accessed on 3 March 2018).
  45. Yu, Q.; Li, T.; Li, H. Improving urban bus emission and fuel consumption modeling by incorporating passenger load factor for real world driving. Appl. Energy 2016, 161, 101–111. [Google Scholar] [CrossRef]
  46. De Blasiis, M.R.; Di Prete, M.; Guattari, C.; Veraldi, V. Traffic Emissions Estimation along a Road Infrastructure Using a Driving Simulator. Procedia-Soc. Behav. Sci. 2012, 53, 213–222. [Google Scholar] [CrossRef]
  47. Bachoo, S.; Bhagwanjee, A.; Govender, K. The influence of anger, impulsivity, sensation seeking and driver attitudes on risky driving behaviour among post-graduate university students in Durban, South Africa. Accid. Anal. Prev. 2013, 55, 67–76. [Google Scholar] [CrossRef] [PubMed]
  48. Iversen, H.; Rundmo, T. Attitudes towards traffic safety, driving behaviour and accident involvement among the Norwegian public. Ergonomics 2004, 47, 555–572. [Google Scholar] [CrossRef] [PubMed]
  49. Ulleberg, P.; Rundmo, T. Personality, attitudes and risk perception as predictors of risky driving behaviour among young drivers. Saf. Sci. 2003, 41, 427–443. [Google Scholar] [CrossRef]
  50. Iversen, H. Risk-taking attitudes and risky driving behaviour. Transp. Res. Part F Traffic Psychol. Behav. 2004, 7, 135–150. [Google Scholar] [CrossRef]
  51. Chen, C.F. Personality, safety attitudes and risky driving behaviors—Evidence from young Taiwanese motorcyclists. Accid. Anal. Prev. 2009, 41, 963–968. [Google Scholar] [CrossRef] [PubMed]
  52. Oltedal, S.; Rundmo, T. The effects of personality and gender on risky driving behaviour and accident involvement. Saf. Sci. 2006, 44, 621–628. [Google Scholar] [CrossRef]
  53. Yagil, D. Gender and age-related differences in attitudes toward traffic laws and traffc violations. Transp. Res. Part F Traffic Psychol. Behav. 1998, 1, 123–135. [Google Scholar] [CrossRef]
  54. Bates, L.J.; Davey, J.; Watson, B.; King, M.J.; Armstrong, K. Factors contributing to crashes among young drivers. Sultan Qaboos Univ. Med. J. 2014, 14, e297. [Google Scholar] [PubMed]
  55. Rhodes, N.; Pivik, K. Age and gender differences in risky driving: The roles of positive affect and risk perception. Accid. Anal. Prev. 2011, 43, 923–931. [Google Scholar] [CrossRef] [PubMed]
  56. D’Ambrosio, L.A.; Donorfio, L.K.M.; Coughlin, J.F.; Mohyde, M.; Meyer, J. Gender Differences in Self-Regulation Patterns and Attitudes toward Driving among Older Adults. J. Women Aging 2008, 20, 265–282. [Google Scholar] [CrossRef] [PubMed]
  57. Macy, M.L.; Carter, P.M.; Bingham, C.R.; Cunningham, R.M.; Freed, G.L. Potential distractions and unsafe driving behaviors among drivers of 1- to 12-year-old children. Acad. Pediatr. 2014, 14, 279–286. [Google Scholar] [CrossRef] [PubMed]
  58. Chung, Y.S. Seemingly irrational driving behavior model: The effect of habit strength and anticipated affective reactions. Accid. Anal. Prev. 2015, 82, 79–89. [Google Scholar] [CrossRef] [PubMed]
  59. Mizenko, A.J.; Tefft, B.C.; Arnold, L.S.; Grabowski, J.G. The relationship between age and driving attitudes and behaviors among older Americans. Inj. Epidemiol. 2015, 2, 9. [Google Scholar] [CrossRef] [PubMed]
  60. Jovanović, D.; Lipovac, K.; Stanojević, P.; Stanojević, D. The effects of personality traits on driving-related anger and aggressive behavior in traffic among Serbian drivers. Transp. Res. F Traffic 2011, 14, 43–53. [Google Scholar] [CrossRef]
  61. Lucidi, F.; Mallia, L.; Lazuras, L.; Violani, C. Personality and attitudes as predictors of risky driving among older drivers. Accid. Anal. Prev. 2014, 72, 318–324. [Google Scholar] [CrossRef] [PubMed]
  62. Mathias, J.L.; Lucas, L.K. Cognitive predictors of unsafe driving in older drivers: A meta-analysis. Int. Psychogeriatr. 2009, 21, 637–653. [Google Scholar] [CrossRef] [PubMed]
  63. Cai, X.; Lu, J.J.; Xing, Y.; Jiang, C.; Lu, W. Analyzing driving risks of roadway traffic under adverse weather conditions: In case of rain day. Proc. Soc. Behav. 2013, 96, 2563–2571. [Google Scholar] [CrossRef]
  64. Ecowill. Eco Drive; Intelligent Energy Europe: Brussels, Belgium, 2010. [Google Scholar]
  65. Jia, H.; Appolloni, A.; Wang, Y. Green Travel: Exploring the Characteristics and Behavior Transformation of Urban Residents in China. Sustainability 2017, 9, 1043. [Google Scholar] [CrossRef]
  66. Penz, E.; Hofmann, E.; Hartl, B. Fostering Sustainable Travel Behavior: Role of Sustainability Labels and Goal-Directed Behavior Regarding Touristic Services. Sustainability 2017, 9, 1056. [Google Scholar] [CrossRef]
  67. Anas, A.; Lindsey, R. Reducing urban road transportation externalities: Road pricing in theory and in practice. Rev. Environ. Econ. Policy 2011, 5, 66–88. [Google Scholar] [CrossRef]
  68. Levinson, D. Equity effects of road pricing: A review. Transp. Rev. 2010, 30, 33–57. [Google Scholar] [CrossRef]
  69. Greene, D.L. Rebound 2007: Analysis of US light-duty vehicle travel statistics. Energy Policy 2012, 41, 14–28. [Google Scholar] [CrossRef]
  70. Global Fuel Economy Initiative, Cleaner, More Efficient Vehicles: Reducing Emissions in Central and Eastern Europe Cleaner, More Efficient Vehicles: Reducing Emissions in Central and Eastern Europe. 2010. Available online: https://www.globalfueleconomy.org/media/44071/wp3-cleaner-more-efficient-vehicles.pdf (accessed on 3 March 2018).
  71. Fetene, G.M.; Kaplan, S.; Mabit, S.L.; Jensen, A.F.; Prato, C.G. Harnessing big data for estimating the energy consumption and driving range of electric vehicles. Transp. Res. Part D Transp. Environ. 2017, 54, 1–11. [Google Scholar] [CrossRef]
  72. Series, S. Sustainable Transportation in the Arab World: International Benchmarking on Sustainable Transport Policies and Their Impacts. 2015. Available online: http://website.aub.edu.lb/ifi/publications/Documents/working_papers/20150217_Kaysi_Chaaban_CC.pdf (accessed on 3 March 2018).
  73. El-dorghamy, A. Fuel Economy and CO2 Emissions of Light-Duty Vehicles in Egypt. 2015. Available online: http://www3.cedare.int/images/gfei_egypt_report_jan-28_final__english.pdf (accessed on 3 March 2018).
  74. An, F.; Earley, R.; Green-weiskel, L. Global Overview on Fuel Efficiency and Motor Vehicle Emission Standards: Policy Options and Perspectives for International Cooperation. 2011. Available online: http://www.un.org/esa/dsd/resources/res_pdfs/csd-19/Background-paper3-transport.pdf (accessed on 3 March 2018).
  75. Kholod, N.; Evans, M. Environmental Science & Policy Reducing black carbon emissions from diesel vehicles in Russia: An assessment and policy recommendations. Environ. Sci. 2016, 56, 1–8. [Google Scholar]
  76. Kok, R.; Annema, J.A.; van Wee, B. Cost-effectiveness of greenhouse gas mitigation in transport: A review of methodological approaches and their impact. Energy Policy 2011, 39, 7776–7793. [Google Scholar] [CrossRef]
  77. Schweitzer, L.; Brodrick, C.J.; Spivey, S.E. Truck driver environmental and energy attitudes—An exploratory analysis. Transp. Res. Part D Transp. Environ. 2008, 13, 141–150. [Google Scholar] [CrossRef]
  78. Muslim, N.H.; Mohamed, M.I.; Amin, Z.M.; Shafaghat, A.; Ismail, M.; Keyyanfar, A. Ground Penetrating Radar’s (GPR) Imaging and Applications to Pavement Structural Assessment: A Case of Malaysia. Arch. Transp. 2017, 42, 39–51. [Google Scholar]
  79. Ando, R.; Nishihori, Y. How does driving behavior change when following an eco-driving car? Procedia-Soc. Behav. Sci. 2011, 20, 577–587. [Google Scholar] [CrossRef]
  80. Rakotonirainy, A.; Haworth, N.; Saint-Pierre, G.; Delhomme, P. Research Issues in Eco-Driving. Queensland University of Technology and French Institute in Science and Technology of Transport, 2011. Available online: https://www-esv.nhtsa.dot.gov/Proceedings/22/files/22ESV-000146.pdf (accessed on 3 March 2018).
  81. Tolouei, R.; Titheridge, H. Vehicle mass as a determinant of fuel consumption and secondary safety performance. Transp. Res. Part D Transp. Environ. 2009, 14, 385–399. [Google Scholar] [CrossRef]
  82. Smit, R.; Rose, G.; Symmons, M. Assessing the Impacts of Ecodriving on Fuel Consumption and Emissions for the Australian Situation. In Proceedings of the 33th Australasian Transport Research Forum, Canberra, Australia, 29 September–1 October 2010. [Google Scholar]
  83. Pampel, S.M.; Jamson, S.L.; Hibberd, D.L.; Barnard, Y. How I reduce fuel consumption: An experimental study on mental models of eco-driving. Transp. Res. Part C Emerg. Technol. 2015, 58, 669–680. [Google Scholar] [CrossRef]
  84. Johansson, H.; Gustafsson, P.; Henke, M.; Rosengren, M. Impact of EcoDriving on emissions. Transport and Air Pollution. In Proceedings of the 12th Symposium, Avignon, France, 16–18 June 2003. [Google Scholar]
  85. Staubach, M.; Schebitz, N.; Köster, F.; Kuck, D. C eco-driving support system. Transp. Res. Part F Traffic Psychol. Behav. 2014, 27, 11–21. [Google Scholar] [CrossRef]
  86. Barth, M.; Boriboonsomsin, K. Energy and emissions impacts of a freeway-based dynamic eco-driving system. Transp. Res. Part D Transp. Environ. 2009, 14, 400–410. [Google Scholar] [CrossRef]
  87. Zarkadoula, M.; Zoidis, G.; Tritopoulou, E. Training urban bus drivers to promote smart driving: A note on a Greek eco-driving pilot program. Transp. Res. Part D Transp. Environ. 2007, 12, 449–451. [Google Scholar] [CrossRef]
  88. Jamson, S.L.; Brouwer, R.; Seewald, P. Supporting eco-driving. Transp. Res. Part C Emerg. Technol. 2015, 58, 629–630. [Google Scholar] [CrossRef]
  89. Thijssen, R.; Hofman, T.; Ham, J. Ecodriving acceptance: An experimental study on anticipation behavior of truck drivers. Transp. Res. Part F Traffic Psychol. Behav. 2014, 22, 249–260. [Google Scholar] [CrossRef]
  90. Barkenbus, J.N. Eco-driving: An overlooked climate change initiative. Energy Policy 2010, 38, 762–769. [Google Scholar] [CrossRef]
  91. Strömberg, H.; Karlsson, I.C.M.; Rexfelt, O. Eco-driving: Drivers’ understanding of the concept and implications for future interventions. Transp. Policy 2015, 39, 48–54. [Google Scholar] [CrossRef]
  92. af Wåhlberg, A.E. Long-term effects of training in economical driving: Fuel consumption, accidents, driver acceleration behavior and technical feedback. Int. J. Ind. Ergon. 2007, 37, 333–343. [Google Scholar] [CrossRef]
  93. Caulfield, B.; Brazil, W.; Ni Fitzgerald, K.; Morton, C. Measuring the success of reducing emissions using an on-board eco-driving feedback tool. Transp. Res. Part D Transp. Environ. 2014, 32, 253–262. [Google Scholar] [CrossRef]
  94. Andrieu, C.; Saint Pierre, G. Comparing Effects of Eco-driving Training and Simple Advices on Driving Behavior. Procedia-Soc. Behav. Sci. 2012, 54, 211–220. [Google Scholar] [CrossRef]
  95. Gaines, J.M.; Burke, K.L.; Marx, K.A.; Wagner, M.; Parrish, J.M. Enhancing older driver safety: A driving survey and evaluation of the CarFit program. J. Saf. Res. 2011, 42, 351–358. [Google Scholar] [CrossRef] [PubMed]
  96. Jeffreys, I.; Graves, G.; Roth, M. Evaluation of eco-driving training for vehicle fuel use and emission reduction: A case study in Australia. Transp. Res. Part D Transp. Environ. 2016. [Google Scholar] [CrossRef]
  97. Stillwater, T.; Kurani, K.S. Drivers discuss ecodriving feedback: Goal setting, framing, and anchoring motivate new behaviors. Transp. Res. Part F Traffic Psychol. Behav. 2013, 19, 85–96. [Google Scholar] [CrossRef]
  98. Rutty, M.; Matthews, L.; Andrey, J.; Del Matto, T. Eco-driver training within the City of Calgary’s municipal fleet: Monitoring the impact. Transp. Res. Part D Transp. Environ. 2013, 24, 44–51. [Google Scholar] [CrossRef]
  99. Sullman, M.J.M.; Dorn, L.; Niemi, P. Eco-driving training of professional bus drivers—Does it work? Transp. Res. Part C Emerg. Technol. 2015, 58, 749–759. [Google Scholar] [CrossRef]
  100. Lauper, E.; Moser, S.; Fischer, M.; Matthies, E.; Kaufmann-Hayoz, R. Psychological predictors of eco-driving: A longitudinal study. Transp. Res. Part F Traffic Psychol. Behav. 2015, 33, 27–37. [Google Scholar] [CrossRef]
  101. Schall, D.L.; Mohnen, A. Incentives for Energy-efficient Behavior at the Workplace: A Natural Field Experiment on Eco-driving in a Company Fleet. Energy Procedia 2015, 75, 2626–2634. [Google Scholar] [CrossRef]
  102. Liimatainen, H. Utilization of Fuel Consumption Data in an Ecodriving Incentive System for Heavy-Duty Vehicle Drivers. IEEE Trans. Intell. Transp. Syst. 2011, 12, 1087–1095. [Google Scholar] [CrossRef]
  103. Mansfield, L.R.; Guros, F.; Truxillo, D.M.; MacArthur, J. Individual and contextual variables enhance transfer for a workplace eco-driving interventionn. Transp. Res. Part F Traffic Psychol. Behav. 2016, 37, 138–143. [Google Scholar] [CrossRef]
  104. Schall, D.L.; Wolf, M.; Mohnen, A. Do effects of theoretical training and rewards for energy-efficient behavior persist over time and interact? A natural field experiment on eco-driving in a company fleet. Energy Policy 2016, 97, 291–300. [Google Scholar] [CrossRef]
  105. Lai, W.T. The effects of eco-driving motivation, knowledge and reward intervention on fuel efficiency. Transp. Res. Part D Transp. Environ. 2015, 34, 155–160. [Google Scholar] [CrossRef]
  106. Chung, Y.S.; Wu, H.L. Stress, strain, and health outcomes of occupational drivers: An application of the effort reward imbalance model on Taiwanese public transport drivers. Transp. Res. Part F Traffic Psychol. Behav. 2013, 19, 97–107. [Google Scholar] [CrossRef]
  107. af Wåhlberg, A.E. Short-term effects of training in economical driving: Passenger comfort and driver acceleration behavior. Int. J. Ind. Ergon. 2006, 36, 151–163. [Google Scholar] [CrossRef]
  108. Orfila, O.; Saint Pierre, G.; Messias, M. An android based ecodriving assistance system to improve safety and efficiency of internal combustion engine passenger cars. Transp. Res. Part C Emerg. Technol. 2015, 58, 772–782. [Google Scholar] [CrossRef]
  109. Themann, P.; Uhrner, T.; Kuck, D.; Müller, M.; Klubal, M. EcoDriving Support based on cooperative prediction models. In Proceedings of the 19th ITS World Congress, Wien, Austria, 22–26 October 2012. [Google Scholar]
  110. Zhao, X.; Wu, Y.; Rong, J.; Zhang, Y. Development of a driving simulator based eco-driving support system. Transp. Res. Part C Emerg. Technol. 2015, 58, 631–641. [Google Scholar] [CrossRef]
  111. Jamson, S.L.; Hibberd, D.L.; Jamson, A.H. Drivers’ ability to learn eco-driving skills; effects on fuel efficient and safe driving behaviour. Transp. Res. Part C Emerg. Technol. 2015, 58, 657–668. [Google Scholar] [CrossRef]
  112. Ahlstrom, C.; Kircher, K. Changes in glance behaviour when using a visual eco-driving system—A field study. Appl. Ergon. 2017, 58, 414–423. [Google Scholar] [CrossRef] [PubMed]
  113. Larsson, H.; Ericsson, E. The effects of an acceleration advisory tool in vehicles for reduced fuel consumption and emissions. Transp. Res. Part D Transp. Environ. 2009, 14, 141–146. [Google Scholar] [CrossRef]
  114. Mensing, F.; Bideaux, E.; Trigui, R.; Tattegrain, H. Trajectory optimization for eco-driving taking into account traffic constraints. Transp. Res. Part D Transp. Environ. 2013, 18, 55–61. [Google Scholar] [CrossRef]
  115. Fors, C.; Kircher, K.; Ahlström, C. Interface design of eco-driving support systems—Truck drivers’ preferences and behavioural compliance. Transp. Res. Part C Emerg. Technol. 2015, 58, 706–720. [Google Scholar] [CrossRef]
  116. Rolim, C.; Baptista, P.; Duarte, G.; Farias, T.; Shiftan, Y. Quantification of the Impacts of Eco-driving Training and Real-time Feedback on Urban Buses Driver’s Behaviour. Transp. Res. Procedia 2014, 3, 70–79. [Google Scholar] [CrossRef]
  117. Ciarla, V.; Chasse, A.; Moulin, P.; Ojeda, L.L. Compute Optimal Travel Duration in Eco-Driving applications. IFAC-PapersOnLine 2016, 49, 519–524. [Google Scholar] [CrossRef]
  118. Martin, E.; Chan, N.; Shaheen, S. How Public Education on Ecodriving Can Reduce Both Fuel Use and Greenhouse Gas Emissions. Transp. Res. Rec. J. Transp. Res. Board 2012, 2287, 163–173. [Google Scholar] [CrossRef]
  119. Fonseca, N.; Casanova, J.; Espinosa, F. Influence of driving style on fuel consumption and emissions in diesel-powered passenger car. In Proceedings of the Transport and Air Pollution 18th International Symposium TAP, Dübendorf, Switzerland, 18–19 May 2010. [Google Scholar]
  120. Heeb, N.V.; Forss, A.V.; Saxer, C.J.; Wilhelm, P. Methane, benzene and alkyl benzene cold start emission data of gasoline-driven passenger cars representing the vehicle technology of the last two decades. Atmos. Environ. 2003, 37, 5185–5195. [Google Scholar] [CrossRef]
  121. Sovacool, B.K.; Hirsh, R.F. Beyond batteries: An examination of the benefits and barriers to plug-in hybrid electric vehicles (PHEVs) and a vehicle-to-grid (V2G) transition. Energy Policy 2009, 37, 1095–1103. [Google Scholar] [CrossRef]
  122. Dib, W.; Chasse, A.; Moulin, P.; Sciarretta, A.; Corde, G. Optimal energy management for an electric vehicle in eco-driving applications. Control Eng. Pract. 2014, 29, 299–307. [Google Scholar] [CrossRef]
  123. Hu, J.; Shao, Y.; Sun, Z.; Wang, M.; Bared, J.; Huang, P. Integrated optimal eco-driving on rolling terrain for hybrid electric vehicle with vehicle-infrastructure communication. Transp. Res. Part C Emerg. Technol. 2016, 68, 228–244. [Google Scholar] [CrossRef]
  124. Weiss, M.; Patel, M.K.; Junginger, M.; Perujo, A.; Bonnel, P.; van Grootveld, G. On the electrification of road transport—Learning rates and price forecasts for hybrid-electric and battery-electric vehicles. Energy Policy 2012, 48, 374–393. [Google Scholar] [CrossRef]
  125. Toledo, T. Driving behaviour: Models and challenges. Transp. Rev. 2007, 27, 65–84. [Google Scholar] [CrossRef]
  126. Fournier, G.; Seign, R.; Goehlich, V.; Bogenberger, K. Car-sharing with electric vehicles: A contribution to sustainable mobility? In Interdisziplinäre Managementforschung XI; Josip Juraj Strossmayer University of Osijek, Faculty of Economics: Opatija, Croatia, 2015. [Google Scholar]
  127. Fournier, G.; Pfeiffer, C.; Baumann, M.; Wörner, R. Individual mobility by shared autonomous electric vehicle fleets: Cost and CO2 comparison with internal combustion engine vehicles in Berlin, Germany. In Proceedings of the 2017 International Conference on Engineering, Technology and Innovation (ICE/ITMC), Madeira Island, Portugal, 27–29 June 2017; pp. 368–376. [Google Scholar]
  128. Correia, G.; Viegas, J.M. Carpooling and carpool clubs: Clarifying concepts and assessing value enhancement possibilities through a Stated Preference web survey in Lisbon, Portugal. Transp. Res. Part A 2011, 45, 81–90. [Google Scholar] [CrossRef]
  129. Vanoutrive, T.; Vijver, E.; Malderen, V.D.; Jourquin, V.; Thomas, B.; Verhetsel, L.; Witlox, F. What determines carpooling to workplaces in Belgium: Location, organisation, or promotion? J. Transp. Geogr. 2012, 22, 77–86. [Google Scholar] [CrossRef] [Green Version]
  130. Teal, R.F. Carpooling: Who, how and why. Transp. Res. Part A Gen. 2017, 79, 3–4. [Google Scholar] [CrossRef]
  131. Song, F.; Li, R.; Zhou, H. Feasibility and issues for establishing network-based carpooling. Pervasive Mob. Comput. 2015, 24, 4–15. [Google Scholar] [CrossRef]
  132. Grant, M.; Siwek, S.; O’Rourke, L.; Rose, E.; O’Connell, J. A Performance-Based Approach to Addressing Greenhouse Gas Emissions through Transportation Planning; Report No. FHWA-HEP-14-020; States Department of Transportation: Washington, DC, USA, 2013.
  133. Koplow, D.; Kretzmann, S. G20 Fossil Fuel Subsidy Phase-Out: A Review of Current Gaps and Needed Changes to Achieve Success; Oil Change International: Washington, DC, USA, 2010. [Google Scholar]
  134. Litman, T. Comprehensive Evaluation of Transport Energy Conservation and Emission Reduction Policies. Transp. Res. Part A Policy Prac. 2013, 47, 153–166. [Google Scholar] [CrossRef]
  135. Nunez, C. What’s a Carbon Tax, and How Does it Reduce Emissions? Nat Geo: Washington, DC, USA, 2016. [Google Scholar]
  136. Parry, I.W.; Walls, M.; Harrington, W. Automobile externalities and policies. J. Econ. Lit. 2007, 45, 373–399. [Google Scholar] [CrossRef]
  137. Litman, T. Efficient vehicles versus efficient transportation. Comparing transportation energy conservation strategies. Transp. Policy 2005, 12, 121–129. [Google Scholar] [CrossRef]
  138. Furth, S.; Kreutzer, D.W. Fuel Economy Standards Are a Costly Mistake, 20002(3096). 2016. Available online: http://www.heritage.org/research/reports/2016/03/fuel-economy-standards-are-a-costly-mistake (accessed on 1 January 2018).
  139. Wagner, T. Regional traffic impacts of logistics-related land use. Transp. Policy 2010, 17, 224–229. [Google Scholar] [CrossRef]
  140. Salvi, B.L.; Subramanian, K.A. Sustainable development of road transportation sector using hydrogen energy system. Renew. Sustain. Energy Rev. 2015, 51, 1132–1155. [Google Scholar]
  141. Neupane, B.; Rubin, J. Implications of US biofuels policy for sustainable transportation energy in Maine and the Northeast. Renew. Sustain. Energy Rev. 2017, 70, 729–735. [Google Scholar] [CrossRef]
  142. Alternative Fuels for Road Transport—Green Trends and an Overview of Viable Alternatives; Sia Partners: Brussels, Belgiium, 2016; Available online: http://transport.sia-partners.com/sites/default/files/alternative_fuels_for_road_transport.pdf (accessed on 9 April 2018).
  143. NRDC. Environmental Assessment of a Full Electric Transportation Portfolio; NRDC: New York, NY, USA, 2015. [Google Scholar]
  144. Moore, A.T.; Staley, S.R.; Poole, R.W. The role of VMT reduction in meeting climate change policy goals. Transp. Res. Part A Policy Prac. 2010, 44, 565–574. [Google Scholar] [CrossRef]
  145. Vilchez, J.G. Mobility Management and Commuting: Inputs and Examples of Best Practices in German Firms; Case Studies in Sustainable Urban Transport; Federal Ministry for Economic Cooperation and Development: Bonn, Germany, 2011; Available online: http://www.sutp.org/files/contents/documents/resources/C_Case-Studies/GIZ_SUTP_CS_Mobility-Management-Commuting-EN.pdf (accessed on 9 April 2018).
  146. Bohler-Baedeker, S.; Jansen, U. Final Report—Climate Protection Concept for the City of Cologne-Sub-Division Transport. 2011. Available online: https://wupperinst.org/en/p/wi/p/s/pd/259/ (accessed on 9 April 2018).
  147. Ryden, C.; Morin, E. Mobility Services for Urban Sustainability: Environmental Assessment; Moses Report WP6; Trivector Traffic AB: Stockholm, Sweden, 2005. [Google Scholar]
  148. Communauto. CO2 Emissions Reduced by 168,000 Tons per Year Thanks to Car-Sharing; Communauto: Montreal, QC, Canada, 2007. [Google Scholar]
  149. Stockholm Action Plan on Climate and Energy 2010–2020; Environment and Health Administration: Stockholms Sweden, 2005; Available online: http://projects.centralbaltic.eu/images/files/result_pdf/COMBAT_result2_Stockholm.pdf (accessed on 9 April 2018).
  150. TFL. Central London Congestion Charging Impacts Monitoring: Fourth Annual Report; TFL: London, UK, 2006. [Google Scholar]
  151. Muriel Beser Hugosson AS. City of Stockholm. Facts and Results from the Stockholm Trials; Muriel Beser Hugosson AS: Stockholm, Sweden, 2006. [Google Scholar]
  152. Gillingham, K. Identifying the elasticity of driving: Evidence from a gasoline price shock in California. Reg. Sci. Urban Econ. 2014, 47, 13–24. [Google Scholar] [CrossRef]
  153. McCubbin, D.R.; Delucchi, M.A. The Social Cost of the Health Effects of Motor-Vehicle Air Pollution; University of California Transportation Center: Berkeley, CA, USA, 1996. [Google Scholar]
  154. US Department pf Energy (DOE). 2016 Annual Merit Review Report. Available online: https://www.energy.gov/eere/vehicles/downloads/2016-annual-merit-review-report (accessed on 1 January 2017).
  155. Delucchi, M. A Lifecycle Emissions Model (LEM): Lifecycle Emissions from Transportation Fuels, Motor Vehicles, Transportation Modes, Electricity Use, Heating and Cooking Fuels, and Materials; Institute of Transportation Studies: Berkeley, CA, USA, 2003. [Google Scholar]
  156. Conserve Energy Future. What Is Green Transport. CEE. Available online: https://www.conserve-energy-future.com/ (accessed on 15 December 2017).
  157. Dhingra, R.; Das, S. Life Cycle energy and environmental evaluation of downsized vs. lightweight material automotive engines. J. Clean. Prod. 2014, 85, 347–358. [Google Scholar] [CrossRef]
  158. Lajunen, T.; Karola, J.; Summala, H. Speed and acceleration as measures of driving style in young male drivers. Percept. Mot. Skills 1997, 85, 3–16. [Google Scholar] [CrossRef] [PubMed]
  159. Alessandrini, A.; Filippi, F.; Orecchini, F.; Ortenzi, F. A new method for collecting vehicle behaviour in daily use for energy and environmental analysis. Proc. Inst. Mech. Eng. Part D J. Automob. Eng. 2006, 220, 1527–1537. [Google Scholar] [CrossRef]
  160. Delogu, M.; Del Pero, F.; Romoli, F.; Pierini, M. Life cycle assessment of a plastic air intake manifold. Int. J. Life Cycle Assess. 2015, 20, 1429–1443. [Google Scholar] [CrossRef]
  161. Paulino, F.; Pina, A.; Baptista, P. Evaluation of Alternatives for the Passenger Road Transport Sector in Europe: A Life-Cycle Assessment Approach. Environments 2018, 5, 21. [Google Scholar] [CrossRef]
  162. Du, J.; Han, W.; Peng, Y. Life cycle greenhouse gases, energy and cost assessment of automobiles using magnesium from Chinese Pidgeon process. J. Clean. Prod. 2010, 18, 112–119. [Google Scholar] [CrossRef]
  163. Del Pero, F.; Delogu, M.; Pierini, M. The effect of lightweighting in automotive LCA perspective: Estimation of mass-induced fuel consumption reduction for gasoline turbocharged vehicles. J. Clean. Prod. 2017, 154, 566–577. [Google Scholar] [CrossRef]
  164. Koffler, C.; Rohde-Brandenburger, K. On the calculation of fuel savings through lightweight design in automotive life cycle assessment. Int. J. Life Cycle Assess. 2010, 15, 128. [Google Scholar] [CrossRef]
  165. Delogu, M.; Del Pero, F.; Pierini, M. Lightweight design solutions in the automotive field: Environmental modelling based on fuel reduction value applied to diesel turbocharged vehicles. Sustainability 2016, 8, 1167. [Google Scholar] [CrossRef]
  166. Hakamada, M.; Furuta, T.; Chino, Y.; Chen, Y.; Kusuda, H.; Mabuchi, M. Life cycle inventory study on magnesium alloy substitution in vehicles. Energy 2007, 32, 1352–1360. [Google Scholar] [CrossRef]
  167. Kim, H.C.; Wallington, T.J. Life-Cycle Energy and Greenhouse Gas Emission Benefits of Lightweighting in Automobiles: Review and Harmonization. Environ. Sci. Technol. 2013, 47, 6089–6097. [Google Scholar] [CrossRef] [PubMed]
  168. United States Environmental Protection Agency (EPA) Home Page. Available online: http://www3.epa.gov/ (accessed on 5 March 2018).
  169. United Nations Economic Commission for Europe (UNECE) Home Page. Available online: http://www.unece.org/trans/welcome.html (accessed on 5 March 2018).
Figure 1. Eco driving concept (Source: Adopted from Ecowill (Honda: Hamamatsu, Japan) [64]).
Sustainability 10 01152 g001
Figure 2. Taxonomy of approaches to mitigation of climate change in transportation sectors.
Sustainability 10 01152 g002
Table 1. Quantitative estimation of environmental benefits achieved by mitigation policies and driving behaviour studies.
Policies/StrategiesEnvironmental Benefit
Cleaner Vehicle −31.2% Fuel consumption and CO2 emissions by 2030 from baseline 2011 [144].
Mobility ManagementVehicle trip reduction by 10–30% [145].
−23% CO2 emissions through car pooling, public transport. and cycling, changing driving behaviour and style, and using low-carbon fuels [146].
−13,608 kg/y CO2 emission by 2050 [147]
−40% to 50% CO2 emission per user by using the Electric vehicle or hybrid cars through carpooling [148].
−600 tons of CO2 emissions per year by 2050 by increasing the park and ride facilities [149].
−111,584 and 181,437 kg of CO2 emission by using a parking cash out program [132].
−28% CO2 emission by using alternative fuels, low resistance tires, high lubricant oils, and Eco-driving program [146].
Changing VehicleFES/CAFE standards will increase to 46.60 mpg in 2025 [139].
−7.2 million mile vehicle travelled distance which equals 1000 daily trips.
+$1 million subsidy amount [144].
Adding at least 380,000 cents per car as the average price of a new car would rise to 620,000 cents [138].
Tax and Fine on Risky driving−16% CO2 emission due to the congestion charging program conducted [150].
100 tons per weekday 24 h period CO2 emission reduction by improving the transit services and park and ride facilities) [151].
In the U.S, 2–4 cents/veh.km of user fees is imposed; including 6.12 cents/veh.km and 6–8 cents/veh.km of parking and registration fees upon greater pollution production [134]. As a result, the operating cost was increased twice (>14–24 cents per vehicle-kilometre), as well as, 20–40% vehicle travel [152].
In Denmark, the carbon tax per person decreased in 2005 by approximately 15% from the baseline year of 1992; while in Australia, the carbon tax policy was revoked in 2014.
Alternative fuels−10% CO2 emission correspond to vehicle travelled mileage at annual travel rate 3% [153].
−74% CO2 emission by biodiesel (B100) compared to petroleum diesel [154].
CNG vehicles offer a reduction of GHG emissions to only 186.411 g/km [155].
GHG emission levels, up to 310.686 g/km in fuel cell vehicles, 466.028 g/km in hybrid hydrogen combustion, and 608.944 g/km in non-hybrid hydrogen combustion [155].
Hydrogen based fuel increased GHG emission levels, up to 310.686 g/km in fuel cell vehicles, 466.028 g/km in hybrid hydrogen combustion, and 608.944 g/km in non-hybrid hydrogen combustion.
−20% CO2 emissions by natural gas, particularly liquefied natural gas (LNG) [154].
<−15% CO2 emissions per km by using compressed natural gas (CNG) [142].
−54% carbon emission by Plug-in electric vehicles (PEV) compared to conventional fuels [156].
Table 2. Taxonomy of driving behaviour studies associated with the climate change mitigation policies.
Tax and Fine RegimeEnergy Efficient Vehicle Design and ManufacturingUsing Alternative FuelsLearning Eco-DrivingEco-Vehicle Design and ManufacturingCar-Sharing/Carpooling
Training and EducationSimple Advice on Eco-TipsAutomated Device
[67,68][65,66,74,76,77][1,46,69,70,72,73][80,84,87,89,92,94,95,96,98,99][94,118][85,86,108,109,110,112,113,115,116][8,121,122,123,124][126,127,128,129,130,131]
Table 3. Taxonomy of driving behaviour study’s types, scopes, locations, conditions, and characteristics of driver.
Type of StudyScope of the StudyOn-Road MeasurementCountryDriving StyleGenderAgeDriving ExperienceTraining (Before Test)Research Sampling SizeWeather
ExperimentalSimulationsSurveyHeavy Duty Vehicle FleetLight DutyEco-
Vehicle
SportyEconomicSafe
PrivatePublic
[6,8,22,29,32,33,34,35,36,38,39,40,41,42,43,45,71,77,79,84,87,89,92,93,94,96,97,98,101,102,104,112,113,114,116,119,122][8,23,24,26,35,44,46,66,83,85,86,99,111,114,115,121,123][40,59,60,61,62,64,65,66,67,70,74,115,117,120,122,124][33,34,35,36,39,40,45,77,89,92,102,115,119][52,53,54,55,56,57,96,97,100][6,21,24,26,28,29,32,38,40,41,42,43,66,71,84,87,93,98,99,101,103,104,105,107,112,113,116][8,97,122,123][6,21,22,28,29,30,33,34,36,38,39,40,41,42,43,44,47,66,71,79,83,84,85,87,92,93,96,98,99,101,102,104,107,112,115,116,119,105,106]Australia [28,32,82,96],
Sweden [34,92,107,112,115],
Japan [6,79], France [94,108],
USA [90], Ireland [86], China [110], Germany [85]
[86][85,86][28,85,86,92,94,107][28,82,86,92,96,107,110][28,85,86,92,96,103,107][86,110][28,92,94,107,112]6 [6],
323 [28],
24 [82],
28 [92],
39 [94],
853 [96],
30 [102],
25 [107],
22 [110],
10 [112]
[94,108]
Table 4. Taxonomy of dependent and independent variables and drivers characteristics in driving behaviour studies.
Ref.Dependent VariablesIndependent VariablesDrivers CharacteristicResults
Fuel ConsumptionEmissionSafetyDriving BehaviourMaleFemale
CO2CONOxCHPMAccelerationDecelerationCompliance with Speed LimitOthersYoungElderYoungElder
[6]✓ ✓  ✓ ✓ ✓ ✓ ✓ ✓ ✓ ✓ ✓ Compliance with speed limit has significantly reduced CO2 emission.
[21]✓ ✓  ✓  Fuel consumption and CO2 were increased due to aggressive driving behaviour and noncompliance to traffic law, accident risk increased.
[23]✓ ✓  ✓ ✓ ✓ ✓ ✓ ✓ ✓ ✓ ✓ Fuel consumption largely depends on compliance with the speed limit.
[24]✓ ✓  ✓ ✓ ✓ ✓ ✓ ✓ ✓ ✓ ✓ Fuel consumption decreased due to following eco-driving car.
[28]✓ ✓  ✓ ✓ ✓ ✓ ✓ ✓ ✓ ✓ ✓ Compliance to speed limit reduce the accident risk significantly,
[29]✓ ✓  ✓  ✓ ✓ ✓ ✓ ✓ ✓ ✓ ✓ ✓ Driving behaviour has led to 27% fuel saving. On the other hand, emission of CO and NOx was minimized.
[33]✓ ✓ ✓ ✓ ✓ ✓ ✓ ✓ ✓ ✓ ✓ ✓ ✓ ✓ ✓ Emission of NOx increases with increase of rapid acceleration
[35]✓ ✓ ✓  ✓  Traffic emission was found to increase with over speeding
[38]✓ ✓ ✓ ✓ ✓  ✓  Reducing rapid acceleration was found to decrease annual emission of CO2 by 12%, CO, and HC by 13% each as well as NOx by 24%.
[44]✓ ✓  ✓  ✓ ✓ ✓ ✓ ✓ ✓ ✓ ✓ ✓ Traveling at a reduced speed in urban street decreases emission and fuel consumption.
[46]✓ ✓  ✓ ✓  Emission was in good correlation with drivers’ speed
[47]✓ ✓ ✓  ✓ ✓ ✓ ✓ ✓ ✓ ✓ ✓ ✓ Safety of passenger decreases with over speeding
[48]✓ ✓  ✓ ✓ ✓ ✓ ✓ ✓ ✓ ✓ ✓ Risky driving behaviour increased with violation of traffic rule and over speeding.
[49]✓ ✓  ✓ ✓ ✓ ✓ ✓ ✓ ✓ ✓ ✓ Risky driving style increases with drivers’ aggression.
[54]✓ ✓  ✓ ✓ ✓ ✓ ✓ ✓ ✓ ✓ ✓ Risky driving behaviour or increases with increase of traffic law violation by younger drivers.
[66]✓ ✓  ✓ ✓ ✓ ✓ ✓ ✓ ✓ ✓ ✓ Many gear changes and the predominant use of lower gears increases fuel saving increases up to 9%.
[71]✓ ✓  ✓ ✓  CO2 emission and fuel consumption increase with speed;
[77]✓ ✓  ✓ ✓ ✓ ✓ ✓ ✓ ✓ ✓ ✓ Fuel saving and emission increase with the increase of environmental consciousness of drivers due to their level of education. On the other hand, vehicle owners emphasize on fuel saving only.
[79]✓ ✓  ✓  Fuel saving and CO2 emission were found to decrease when following an eco-driving car.
[83]✓ ✓  ✓ ✓ ✓ ✓ ✓ ✓ ✓ ✓  Improving drivers’ mental model by instructing them to comply with speed limit, slow rate of acceleration and deceleration was found to significantly reduce fuel consumption, CO2 emission and improve passenger safety.
[84]✓ ✓  ✓ ✓  ✓  Emission results indicated no difference between trained and untrained drivers. However, CO2 emission and fuel consumption have comparatively decreased with respect to trained drivers.
[85]✓ ✓  ✓ ✓ ✓ ✓ ✓ ✓ ✓ ✓ ✓ Early gear shift coupled with slow rate of acceleration/deceleration increased fuel saving by up to 18% regardless of drivers sex/age.
[86]✓ ✓  ✓ ✓ ✓  Compliance with speed limit coupled with the slow rate of acceleration/deceleration decreased fuel consumption and CO2 emission by up to 20% respectively.
[87]✓ ✓  ✓  Compliance with speed limit decreases fuel consumption and CO2 emission by up to 4.3%.
[92]✓ ✓  ✓ ✓ ✓ ✓ ✓ ✓ ✓ ✓ ✓ Slow rate of acceleration reduced fuel consumption by up to 1.7%
[98] ✓  ✓  Decrease of idling of engine led to average reduction in the emission of 1.7 kg of CO2 per vehicle per day.
[99]✓ ✓  ✓ ✓ ✓ ✓ ✓ ✓ ✓ ✓ ✓ Compliance to speed limit and early gear shift have led to 16.9% fuel saving.
[119]✓ ✓ ✓ ✓ ✓ ✓ ✓ ✓ ✓ ✓ ✓ ✓ ✓ ✓ ✓ Over speeding due to aggressive behaviour increases fuel consumption and emission by up to 40% respectively. On the other hand, compliance with speed limit reduces fuel consumption and emission by 14% respectively.
Frequency *27284632222420232319181917* Frequency; is the sum of citations.
Depth of Citation (%) **96.2 %100 %14.2 %21.4 %10.7 %7.1 %78.5 %85.7 %71.4 %82.1 %82.1 %67.8 %64.2 %67.8 %60.7 %** Depth of Citation; is the frequency divided to the total citation.
(Total citation is 28).
Table 5. Taxonomy of Measurement techniques in Driving Behaviour Studies.
Mitigation Aspects in Driving Behaviour StudiesOn Board EquipmentAccident riskAggressive DrivingFollowing Eco-Driving RulesSpeed Acceleration/Decelerationengine IdlingTravelled Time and DistanceTraffic Calming DevicesTraffic VolumeTraffic ViolationEngine CapacityVehicle’s Routing SystemVehicle’s Transmission System
Fuel Consumption and CO2 Emission[66,83,84,87,89,92,119]-[67,82,83,92,112,119,120][68,82,83,118,120,127][67,99,101,107,127][98,99,101][114,119,120,123][97,104][83,86,97,104,118,119][119][120,121,118][100,117][83,105,110,118]
Safety-[25,28,47,48,49,50,51,52,53,54,55,57,59][67,82,83,92,112,119,120]-[46,83,85,86,89,92,109,110,113][48,50,55,57,59,77,84,85,87,93,94,98,99,101,104,105,109]-[49,52][49,50,52,53,55][49,50,52,53,54,59,116]---

