The Selected Method and Tools for Performance Measurement in the Green Supply Chain—Survey Analysis in Poland


Abstract
:1. Introduction
2. State of the Art
2.1. Green Supply Chain Management (GSCM)
2.2. SSCM—Sustainable Supply Chain Management
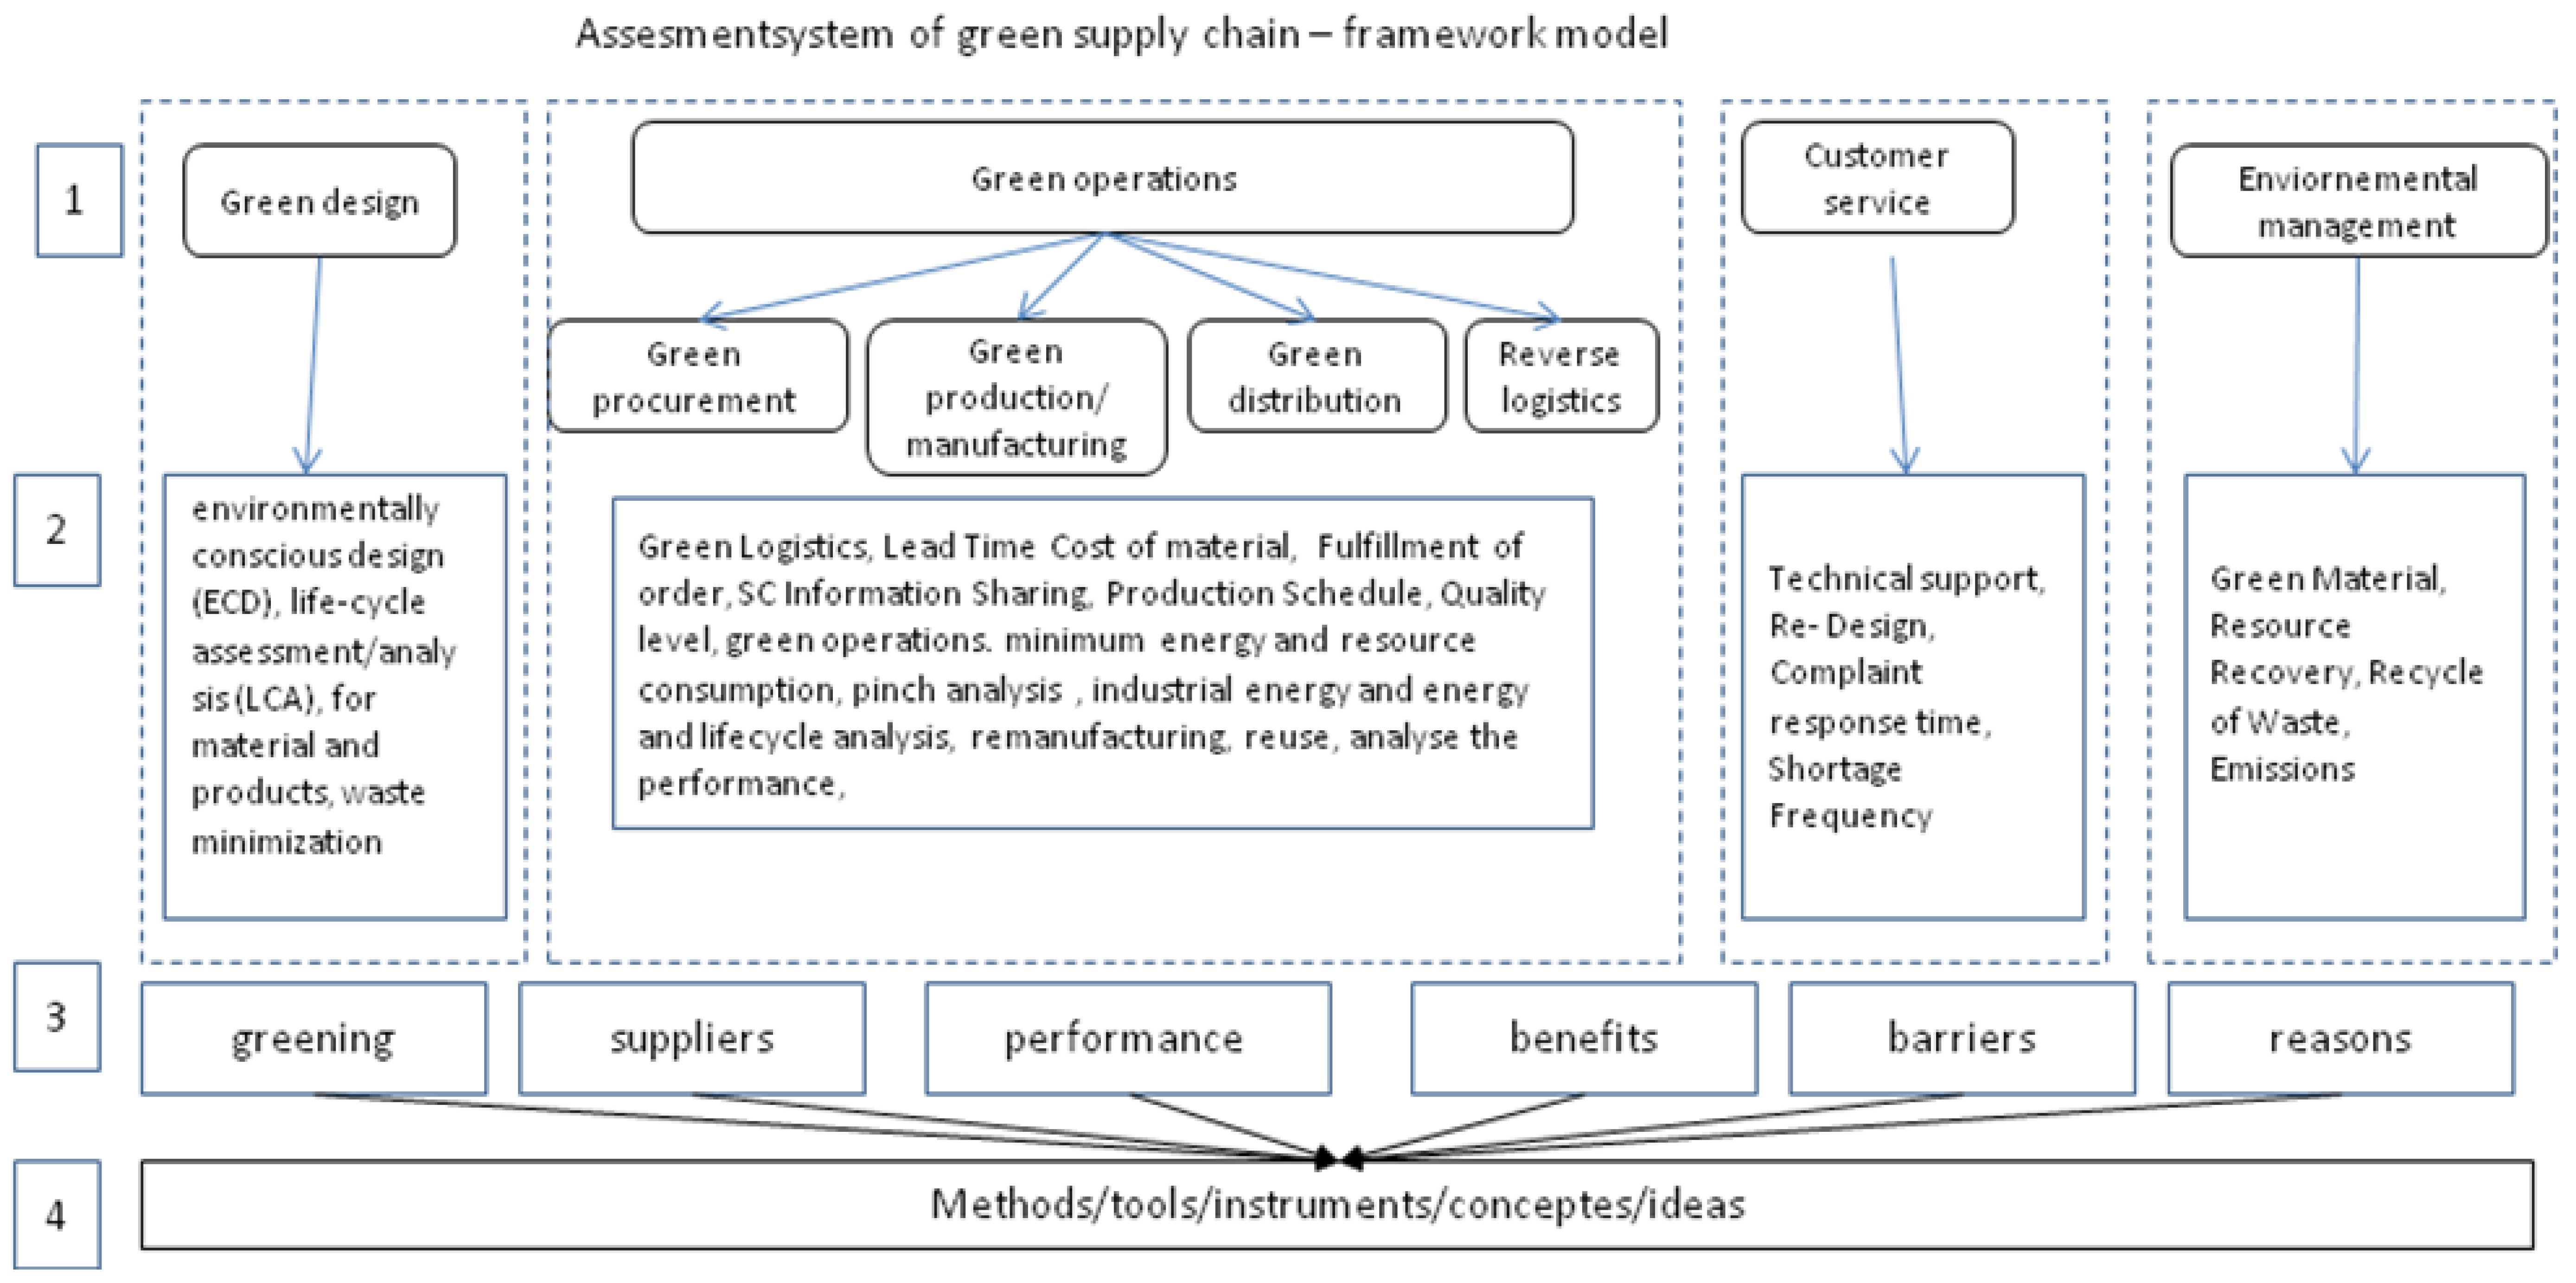
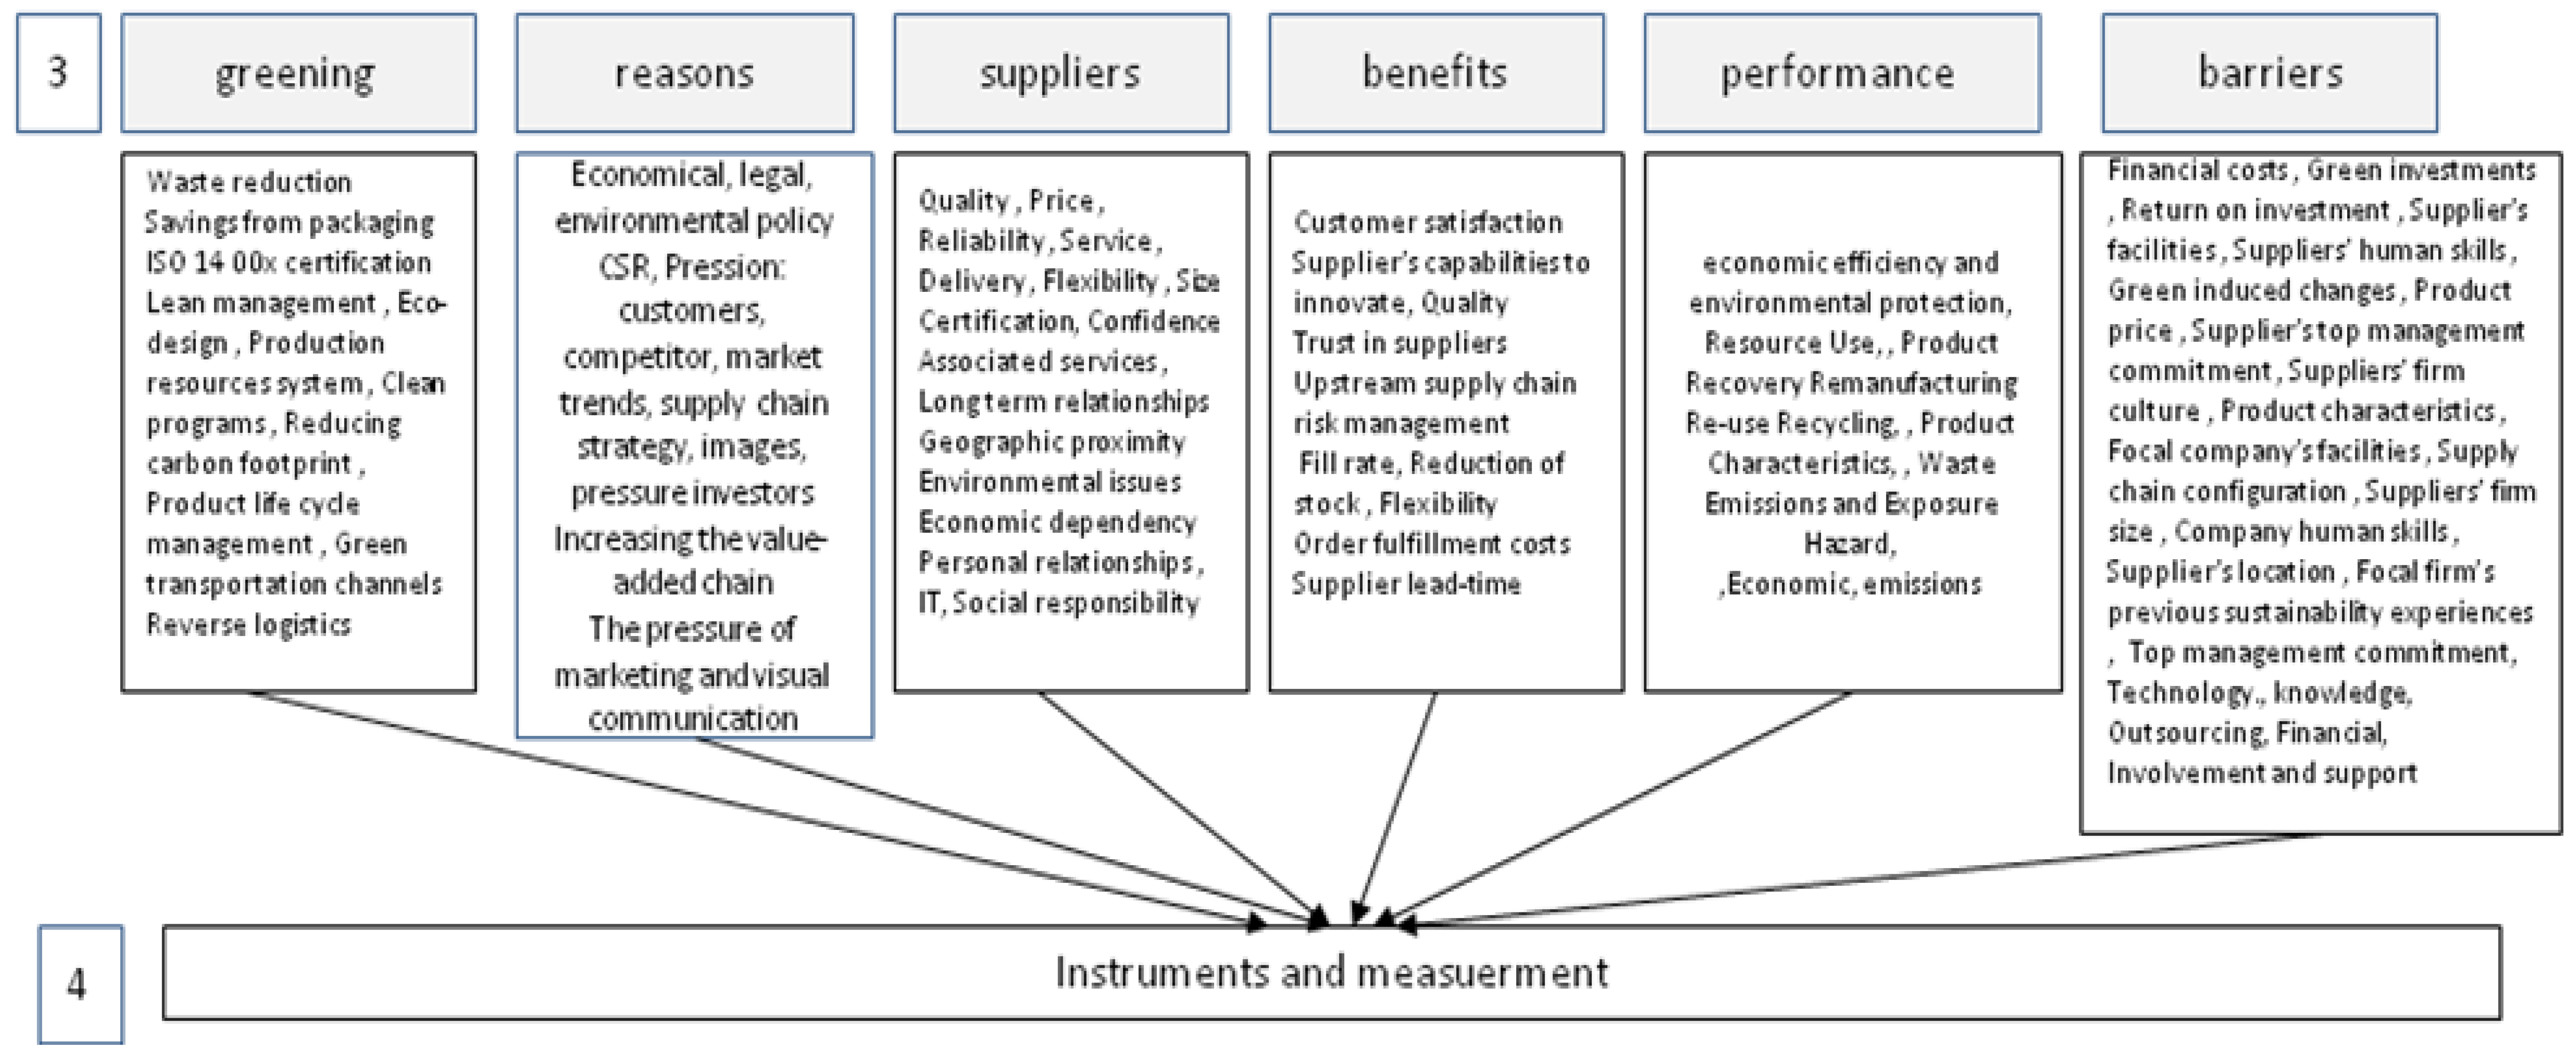
2.3. Performance Measurement and Indicators in the Green and Sustainable Supply Chain
2.3.1. Selected Tools
2.3.2. Environmental Performance Measurements in Supply Chain
2.3.3. Selected Measurement Instruments of the Green Supply Chain
3. Field Analysis—Preparing of the Empirical Research
4. Results
4.1. Data Collection
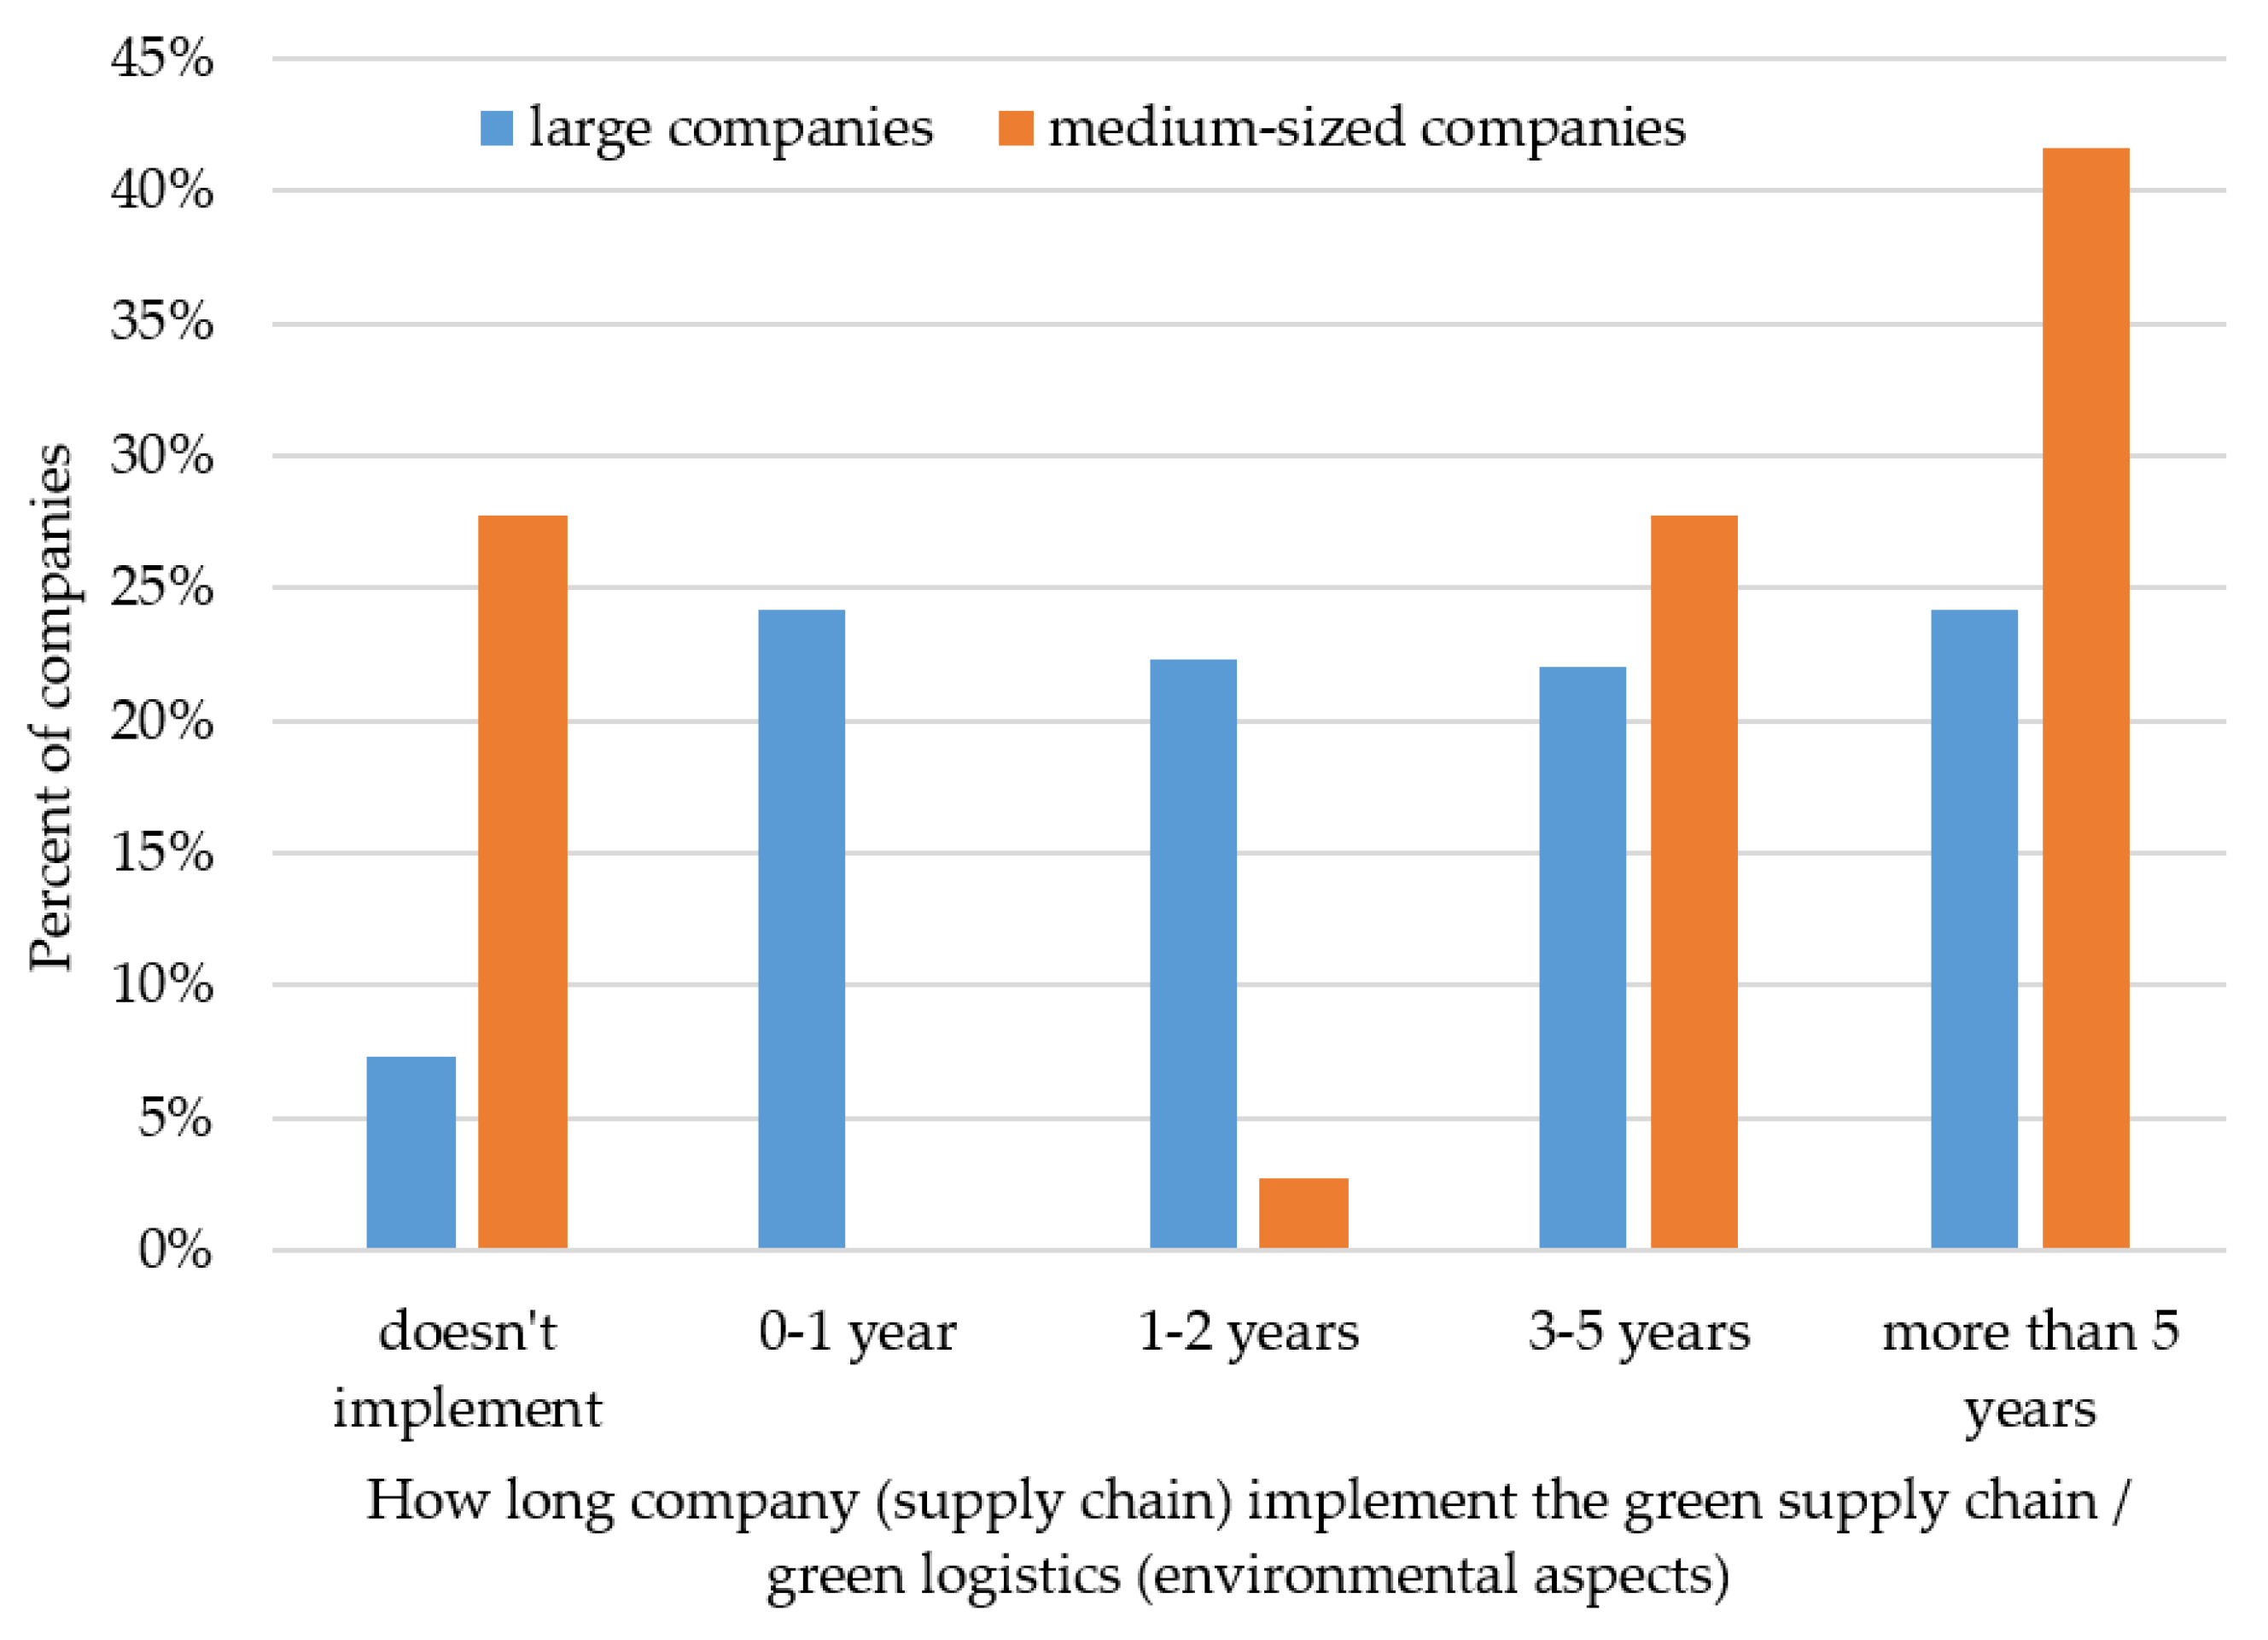
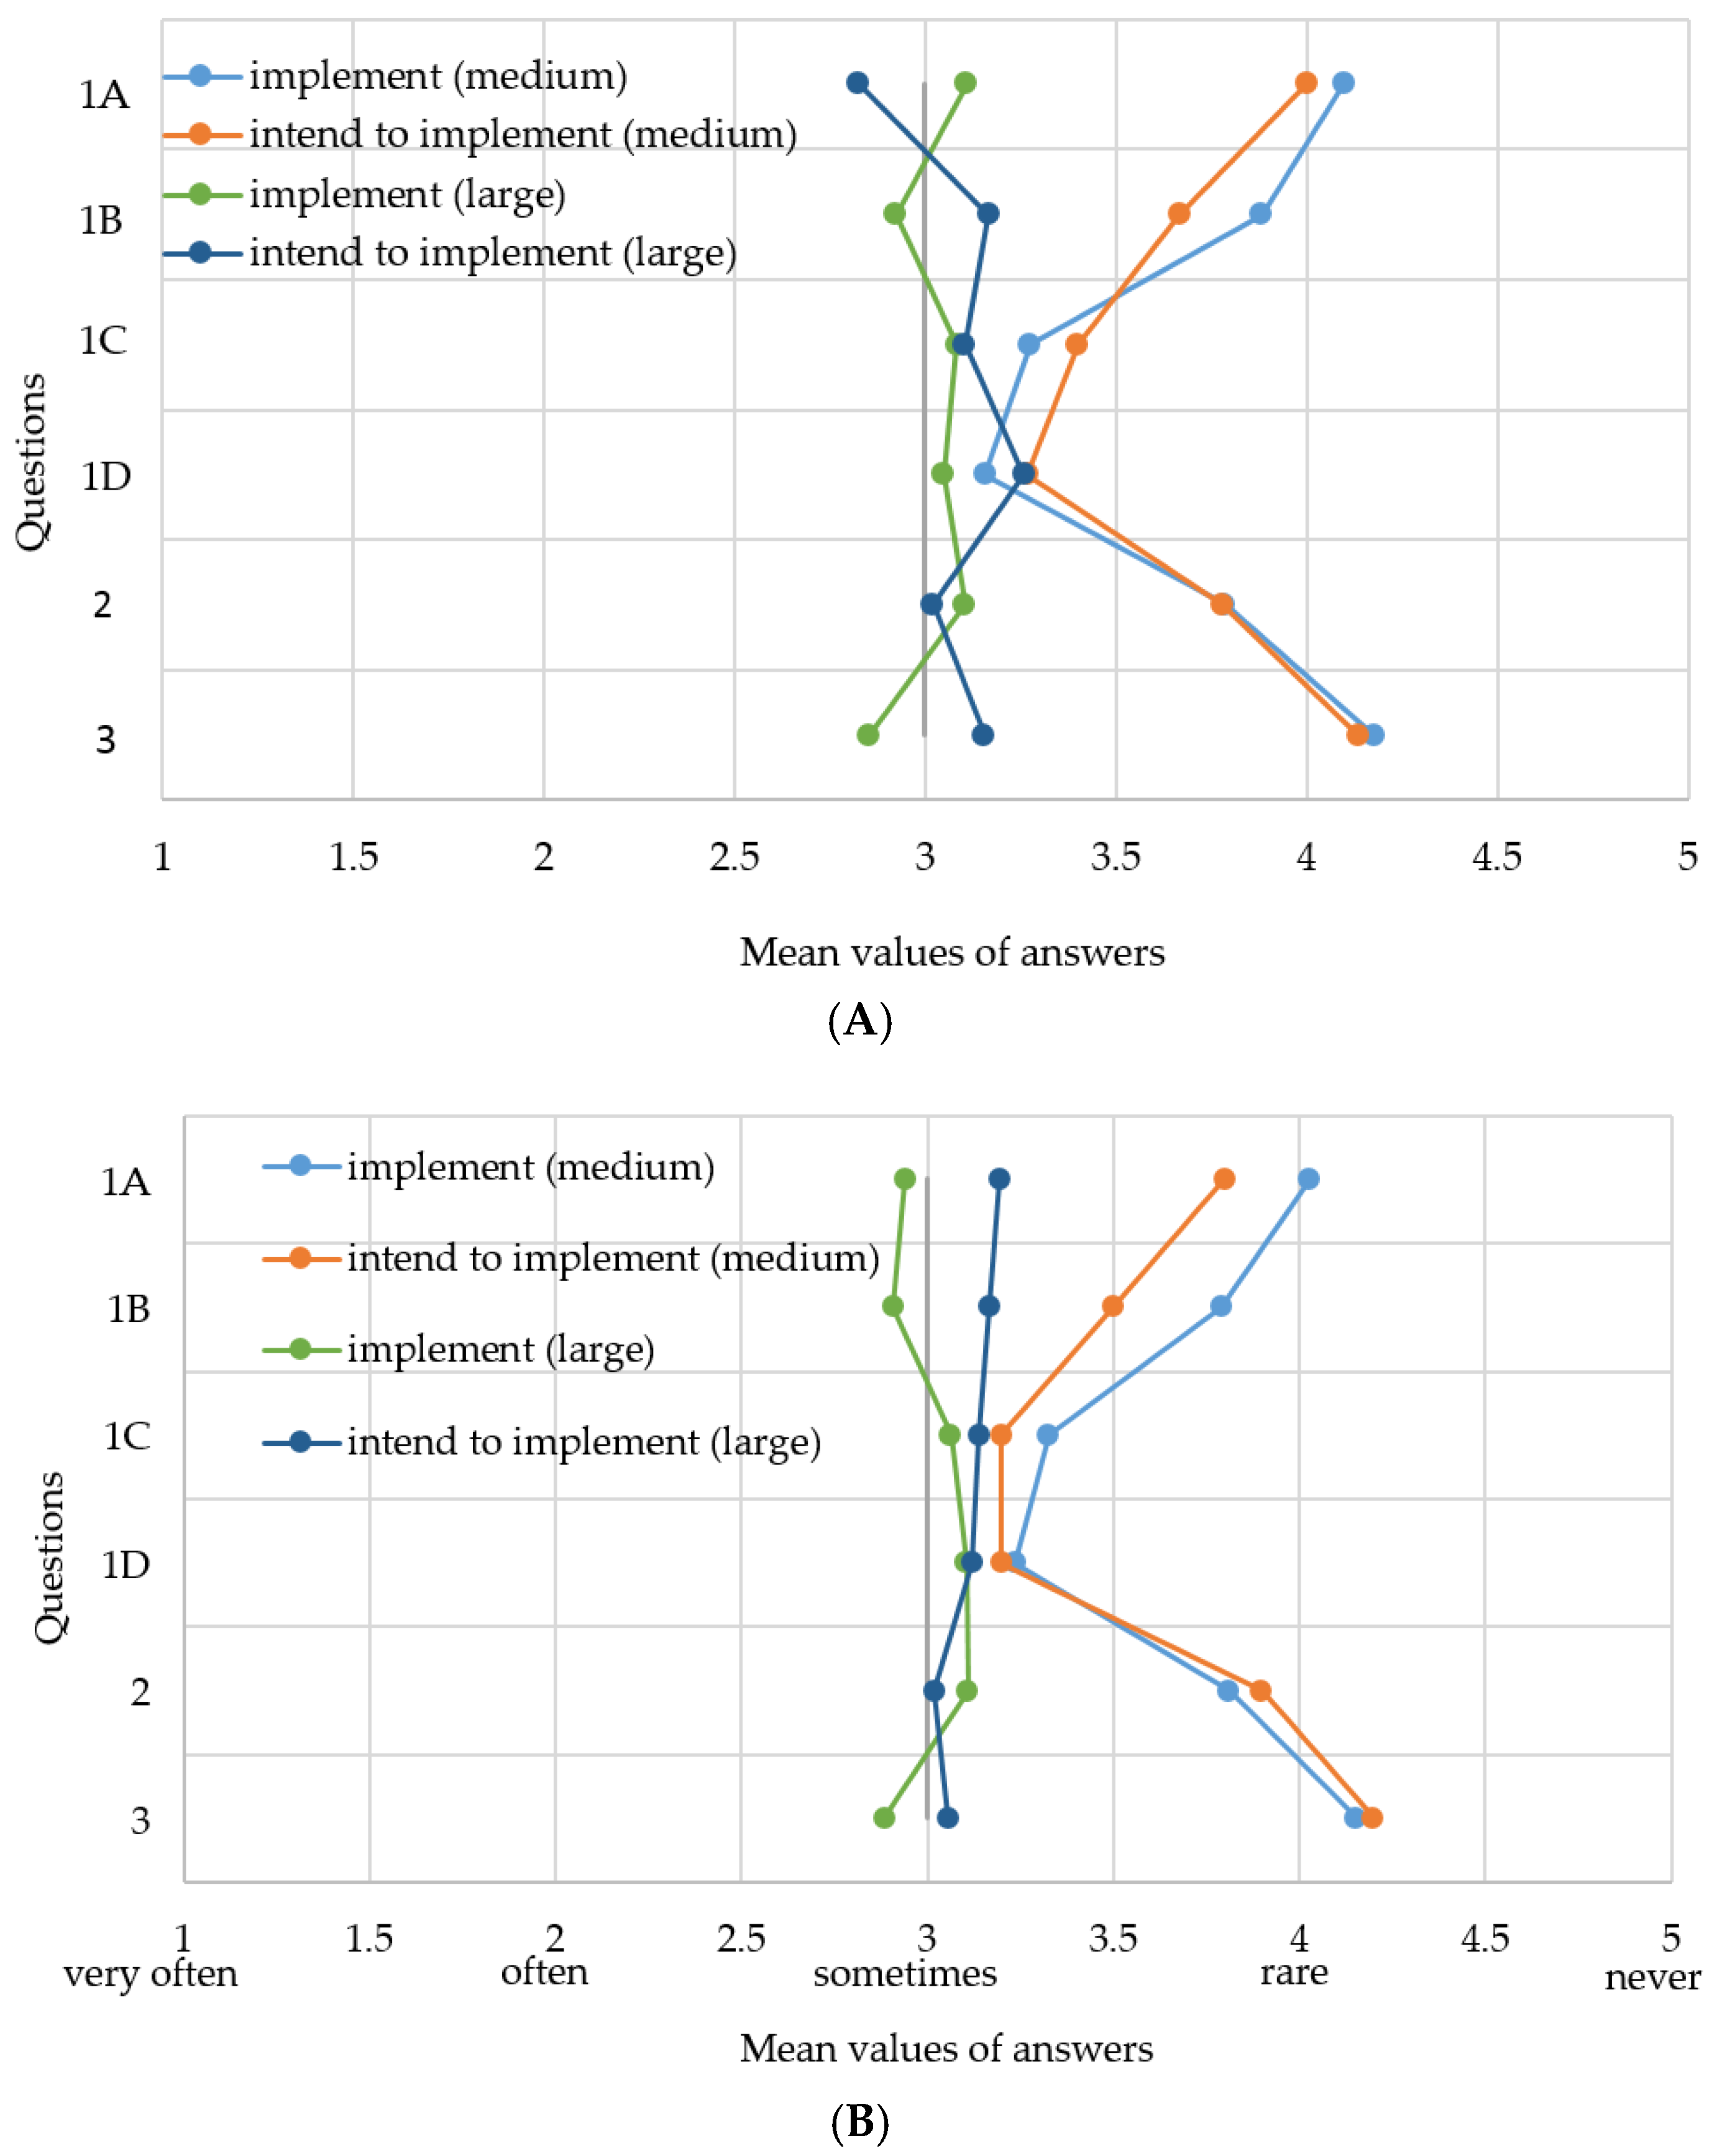
4.2. Empirical Findings
5. Discussion and Conclusions
Acknowledgments
Author Contributions
Conflicts of Interest
Appendix A
- (1)
- In assessing the efficiency of the supply chain, environmental aspects are taken into account:
- (A)
- At the chain level
- (B)
- Only in selected areas
- (C)
- Only in selected units
- (D)
- Only to evaluate selected processes
- (2)
- Dedicated environmental management instruments are used to assess the efficiency and performance of the supply chain.
- (3)
- Scientific assessment methods (including ecological efficiency, management methods, modern concepts) are used to assess the efficiency and effectiveness of the supply chain.
- (4)
- Is one of the selection criteria (e.g., supplier, partner) an environmental requirement? Please evaluate how often this criterion is used.
- (5)
- How often is the aspect of “green” image taken into account when selecting a supplier/partner? Please assess the grade to be taken into account.
- (6)
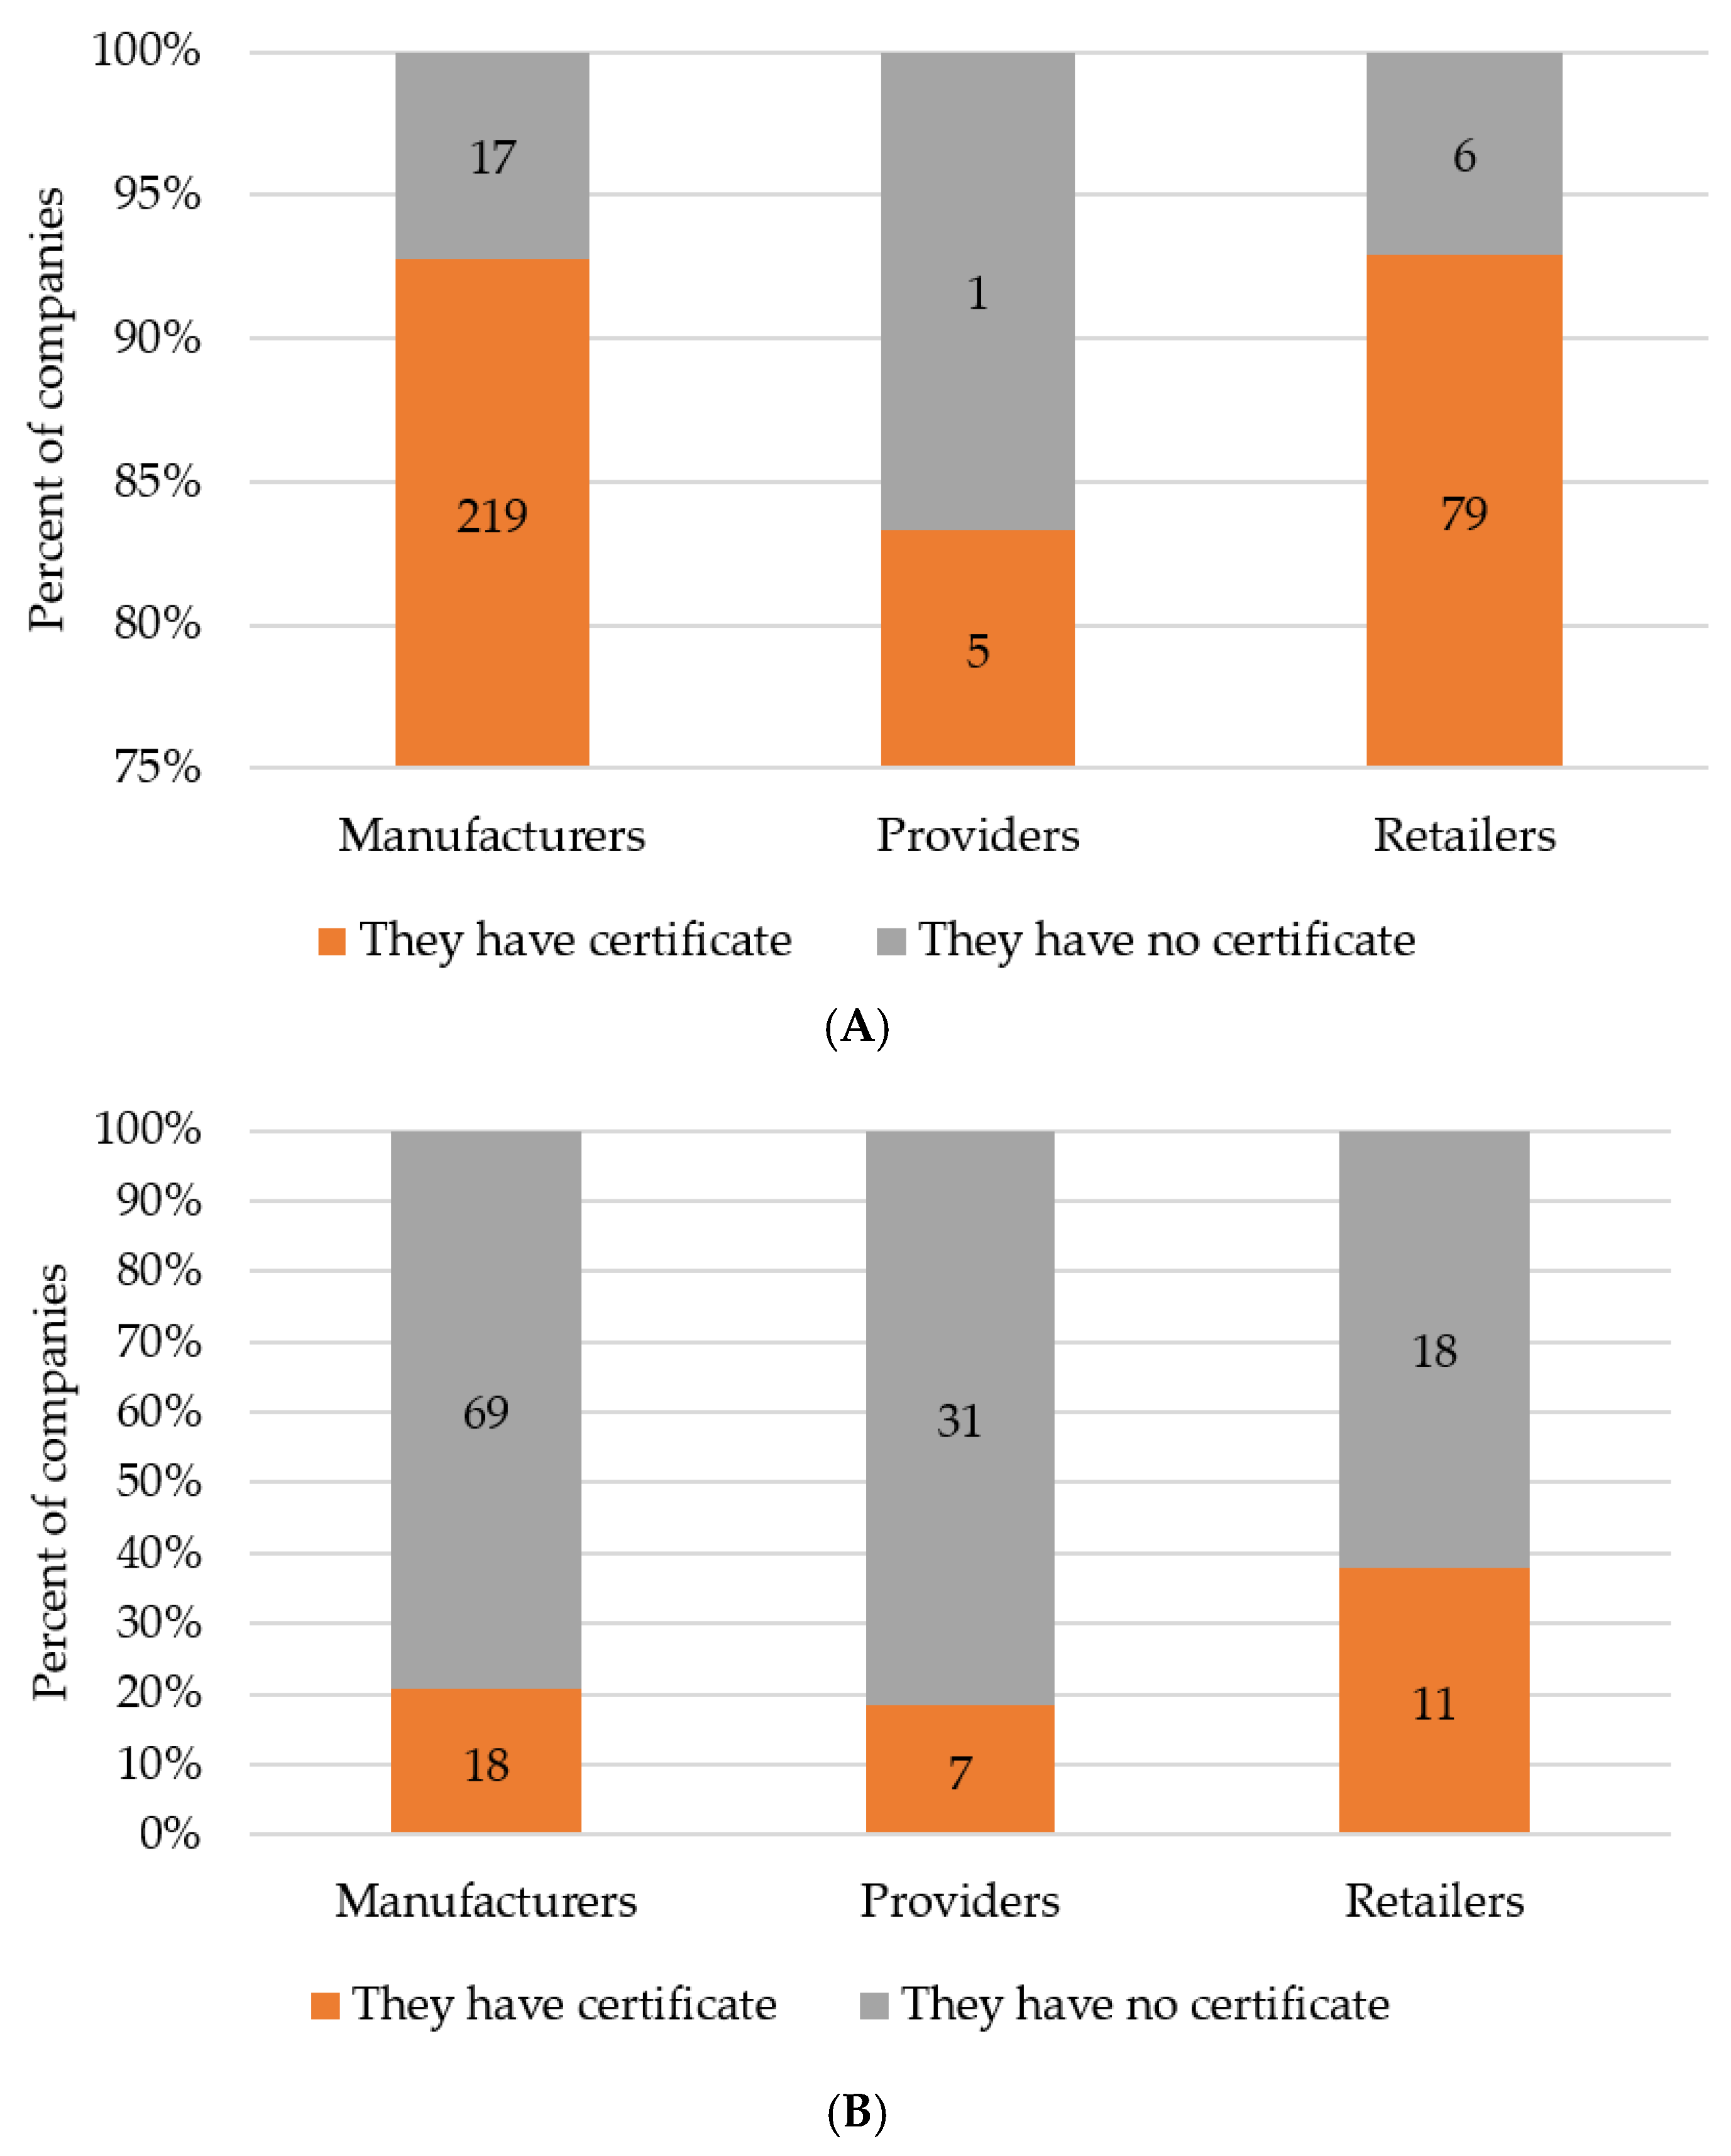
- Does your company have environmental certificates:
- (a)
- ISO 1400x
- (b)
- EMAS
- (c)
- other …
- (d)
- does not have
- (7)
- What is the role of your company in the supply chain:
- (a)
- manufacturer
- (b)
- provider
- (c)
- retailer
- (8)
- How long does your company (supply chain) implements the principles of green supply chain/green logistics (environmental aspects):
- (a)
- less than one year
- (b)
- 1–2 years
- (c)
- 3–5 years
- (d)
- over 5 years
- (e)
- does not implement
- (9)
- If your company analyzes the environmental impact of your operations: yes/no?
- (10)
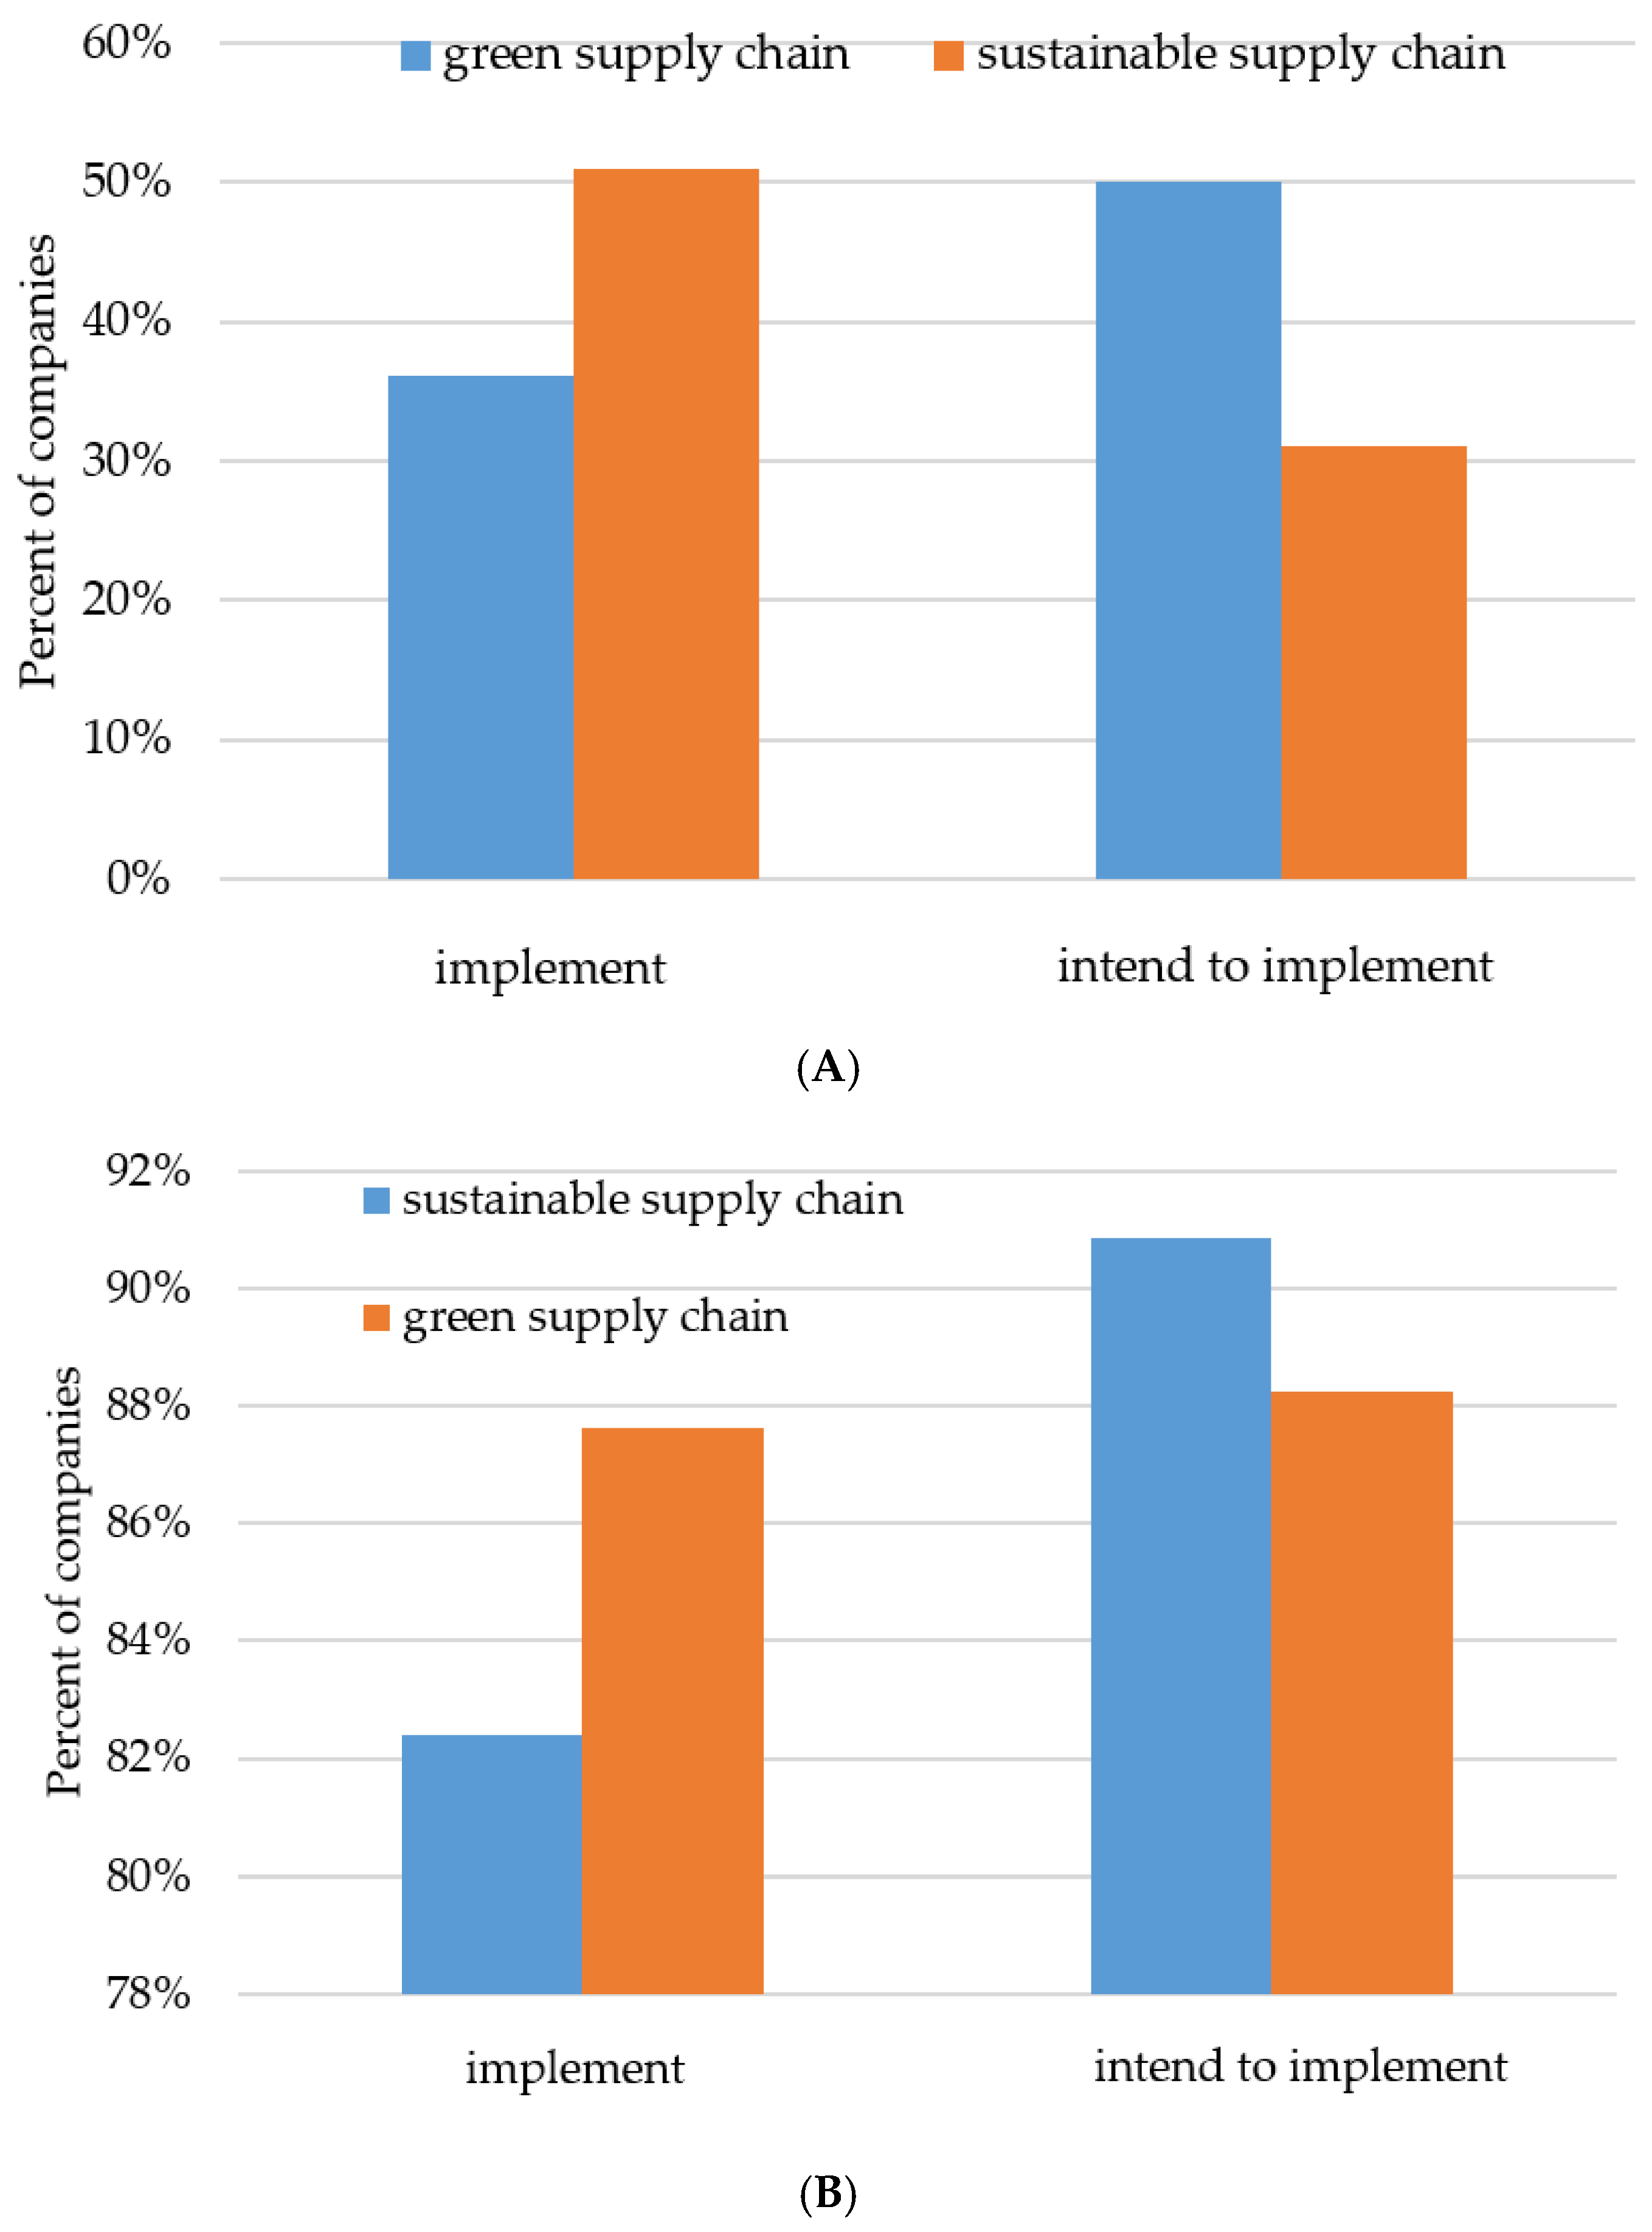
- Which concept of your company/supply chain implements or intends to implement in the future:
- (a)
- green supply chain
- (b)
- sustainable supply chain
- (11)
- To assess of the green supply chain, are used (yes/no);
- KPI (in general, without indicating which elements are included),
- BSC—Balanced scorecard,
- Eco effectiveness,
- LCA—Life Cycle Assessment,
- Others…
- (12)
- What type of business do you represent
- Industry:
- food—conventional,
- food—organic,
- clothing apparel,
- home appliance.
- Retailer:
- sales network of grocery and general merchandise,
- sales network of home appliances,
- sales network of retail-clothing.
References
- Kassenberg, A.; Karaczun, Z.; Owczarek, D. Securing Means of Implementation in Poland; Asia-Europe Foundation (ASEF): Singapore, 2015. [Google Scholar]
- Estampe, D.; Lamouri, S.; Paris, J.L.; Brahim-Djelloul, S. A framework for analysing supply chain performance evaluation models. Inter. J. Prod. Econ. 2013, 142, 247–258. [Google Scholar] [CrossRef]
- Zhu, Q.; Sarkis, J.; Lai, K.H. Confirmation of a measurement model for green supply chain management practices implementation. Inter. J. Prod. Econ. 2008, 111, 261–273. [Google Scholar] [CrossRef]
- Malviya, R.K.; Kant, R. Green supply chain management (GSCM): A structured literature review and research implications. BIJ 2015, 22, 1360–1394. [Google Scholar] [CrossRef]
- Govindan, K.; Soleimani, H. A review of reverse logistics and closed-loop supply chains: A Journal of Cleaner Production focus. J. Clean. Prod. 2017, 142, 371–384. [Google Scholar] [CrossRef]
- Van Hoek, R.I. “Measuring the unmeasurable”—Measuring and improving performance in the supply chain. Supply Chain Manag. 1998, 3, 187–192. [Google Scholar] [CrossRef]
- Hervani, A.A.; Helms, M.M.; Sarkis, J. Performance measurement for green supply chain management. BIJ 2005, 12, 330–353. [Google Scholar] [CrossRef]
- King, A.A.; Lenox, M.J. Lean and green? An empirical examination of the relationship between lean production and environmental performance. Prod. Oper. Manag. 2001, 10, 244–256. [Google Scholar] [CrossRef]
- Varsei, M.; Soosay, C.; Fahimnia, B.; Sarkis, J. Framing sustainability performance of supply chains with multidimensional indicators. Supply Chain Manag. 2014, 19, 242–257. [Google Scholar] [CrossRef]
- Maestrini, V.; Luzzini, D.; Maccarrone, P.; Caniato, F. Supply chain performance measurement systems: A systematic review and research agenda. Int. J. Prod. Econ. 2017, 183, 299–315. [Google Scholar] [CrossRef]
- Centobelli, P.; Cerchione, R.; Esposito, E. Environmental sustainability in the service industry of transportation and logistics service providers: Systematic literature review and research directions. Transp. Res. D 2017, 53, 454–470. [Google Scholar] [CrossRef]
- Srivastava, S.K. Green supply-chain management: A state-of-the-art literature review. Int. J. Manag. Rev. 2007, 9, 53–80. [Google Scholar] [CrossRef]
- Beamon, B.M. Designing the green supply chain. Logist. Infor. Manag. 1999, 12, 332–342. [Google Scholar] [CrossRef]
- Davies, J.; Hochman, S. The greening of the supply chain. Supply Chain Manag. Rev. 2007, 11, 13–14. [Google Scholar]
- Rettab, B.; Ben Brik, A. Green supply chain in Duba; Dubai Chamber Centre for Responsible Business: Dubai, UAE, 2008. [Google Scholar]
- Zhu, Q.; Sarkis, J. An inter-sectoral comparison of green supply chain management in China: Drivers and practices. J. Clean. Prod. 2006, 14, 472–486. [Google Scholar] [CrossRef]
- Gilbert, S. Greening Supply Chain: Enhancing Competitiveness through Green Productivity; Asian Productivity Organization: Tapei, Taiwan, 2001. [Google Scholar]
- Hwa, T.J. Green productivity and supply chain management. In Proceedings of the Conference on Enhancing Competitiveness Through Green Productivity, Taipei, Taiwan, 25–27 May 2000; Asian Productivity Organization: Tokyo, China, 2000; pp. 25–27. [Google Scholar]
- Rao, P.; Holt, D. Do green supply chains lead to competitiveness and economic performance? Int. J. Oper. Prod. Man. 2005, 25, 898–916. [Google Scholar] [CrossRef]
- Vachon, S.; Klassen, R.D. Environmental management and manufacturing performance: The role of collaboration in the supply chain. Int. J. Prod. Econ. 2008, 111, 299–315. [Google Scholar] [CrossRef]
- Zsidisin, G.A.; Siferd, S.P. Environmental purchasing: A framework for theory development. Eur. J. Purch. Supply Manag. 2001, 7, 61–73. [Google Scholar] [CrossRef]
- Skjoett-Larsen, T. Third party logistics-from an interorganizational point of view. Int. J. Phys. Distr. Log. 2000, 30, 112–127. [Google Scholar] [CrossRef]
- 13 Beamon, B.M. Sustainability and the future of supply chain management. Oper. Supply Chain Manag. 2008, 1, 4–18. [Google Scholar]
- Chiou, T.Y.; Chan, H.K.; Lettice, F.; Chung, S.H. The influence of greening the suppliers and green innovation on environmental performance and competitive advantage in Taiwan. Transp. Res. E Logist. 2011, 47, 822–836. [Google Scholar] [CrossRef]
- Centobelli, P.; Cerchione, R.; Esposito, E. Developing the WH2 framework for environmental sustainability in logistics service providers: A taxonomy of green initiatives. J. Clean. Prod. 2017, 165, 1063–1077. [Google Scholar] [CrossRef]
- Lintukangas, K.; Kähkönen, A.K.; Ritala, P. Supply risks as drivers of green supply management adoption. J. Clean. Prod. 2016, 112, 1901–1909. [Google Scholar] [CrossRef]
- Khaksar, E.; Abbasnejad, T.; Esmaeili, A.; Tamošaitienė, J. The effect of green supply chain management practices on environmental performance and competitive advantage: A case study of the cement industry. Technol. Econ. Dev. Econ. 2016, 22, 293–308. [Google Scholar] [CrossRef]
- Govindan, K.; Kaliyan, M.; Kannan, D.; Haq, A.N. Barriers analysis for green supply chain management implementation in Indian industries using analytic hierarchy process. Int. J. Prod. Econ. 2014, 147, 555–568. [Google Scholar] [CrossRef]
- Govindan, K.; Sarkis, J.; Jabbour, C.J.C.; Zhu, Q.; Geng, Y. Eco-efficiency based green supply chain management: Current status and opportunities. Eur. J. Oper. Res. 2014, 233, 293–298. [Google Scholar] [CrossRef]
- Mathiyazhagan, K.; Govindan, K.; NoorulHaq, A.; Geng, Y. An ISM approach for the barrier analysis in implementing green supply chain management. J. Clean. Prod. 2013, 47, 283–297. [Google Scholar] [CrossRef]
- Muduli, K.; Govindan, K.; Barve, A.; Geng, Y. Barriers to green supply chain management in Indian mining industries: A graph theoretic approach. J. Clean. Prod. 2013, 47, 335–344. [Google Scholar] [CrossRef]
- Mudgal, R.K.; Shankar, R.; Talib, P.; Raj, T. Modelling the barriers of green supply chain practices: An Indian perspective. Int. J. Logist. Syst. Manag. 2010, 7, 81–107. [Google Scholar] [CrossRef]
- Xia, X.; Govindan, K.; Zhu, Q. Analyzing internal barriers for automotive parts remanufacturers in China using grey-DEMATEL approach. J. Cleaner Prod. 2015, 87, 811–825. [Google Scholar] [CrossRef]
- Rauer, J.; Kaufmann, L. Mitigating External Barriers to Implementing Green Supply Chain Management: A Grounded Theory Investigation of Green-Tech Companies’ Rare Earth Metals Supply Chains. J. Supply Chain Manag. 2015, 51, 65–88. [Google Scholar] [CrossRef]
- Perotti, S.; Zorzini, M.; Cagno, E.; Micheli, G.J.L. Green supply chain practices and company performance: The case of 3PLs in Italy. Int. J. Phys. Distrib. Logist. Manag. 2012, 45, 640–672. [Google Scholar] [CrossRef]
- Azevedo, S.G.; Carvalho, H.; Machado, V.C. The influence of green practices on supply chain performance: A case study approach. Trans. Res. Part E: Logist. Trans. Rev. 2011, 47, 850–871. [Google Scholar] [CrossRef]
- Diabat, A.; Govindan, K. An analysis of the drivers affecting the implementation of green supply chain management. Resour. Conserv. Recycl. 2011, 55, 659–667. [Google Scholar] [CrossRef]
- Wang, Z.; Mathiyazhagan, K.; Xu, L.; Diabat, A. A decision making trial and evaluation laboratory approach to analyze the barriers to Green Supply Chain Management adoption in a food packaging company. J. Clean. Prod. 2016, 117, 19–28. [Google Scholar] [CrossRef]
- Miranda-Ackerman, M.A.; Azzaro-Pantel, C.; Aguilar-Lasserre, A.A. A green supply chain network design framework for the processed food industry: Application to the orange juice agrofood cluster. Comput. Ind. Eng. 2017, 109, 369–389. [Google Scholar] [CrossRef]
- Garg, C.; Sharma, A.; Goyal, G. A hybrid decision model to evaluate critical factors for successful adoption of GSCM practices under fuzzy environment. Uncertain Supply Chain Manag. 2017, 5, 59–70. [Google Scholar] [CrossRef]
- Chang, R.D.; Zhang, Y.; Chen, Y.L. The implementation of green supply chain management in chinese food industry: A multi-case study. In Proceedings of 2012 3rd International Asia Conference on Industrial Engineering and Management Innovation (IEMI2012); Dou, R., Ed.; Springer: Berlin/Heidelberg, Germany, 2013; pp. 379–387. [Google Scholar] [CrossRef]
- Nema, N.; Soni, S.R.; Talankar, A.; Nougriaya, S. Green Supply Chain Management Practices in Textile and Apparel Industries: Literature Review. Int. J. Eng. Technol. Manag. Res. 2013, 1, 330–336. [Google Scholar]
- Zhou, F. Study on the implementation of green supply chain management in textile enterprises. J. Sus. Dev. 2009, 2, 75–79. [Google Scholar] [CrossRef]
- Shen, B.; Li, Q.; Dong, C.; Perry, P. Sustainability issues in textile and apparel supply chains. Sustainability 2017, 9, 1592. [Google Scholar] [CrossRef]
- Scur, G.; Barbosa, M.E. Green supply chain management practices: Multiple case studies in the Brazilian home appliance industry. J. Clean. Prod. 2017, 141, 1293–1302. [Google Scholar] [CrossRef]
- Ai, X.; Xiangpei, H.; Shufeng, G. A three-player game model for the green supply chain in the home appliance industry. In Proceedings of the 8th International Conference on Innovation & Management, Wuhan, China, 30 November–2 December 2011; pp. 578–583. [Google Scholar]
- Vanalle, R.M.; Ganga, G.M.D.; Godinho Filho, M.; Lucato, W.C. Green supply chain management: An investigation of pressures, practices, and performance within the Brazilian automotive supply chain. J. Clean. Prod. 2017, 151, 250–259. [Google Scholar] [CrossRef]
- Caniëls, M.C.; Gehrsitz, M.H.; Semeijn, J. Participation of suppliers in greening supply chains: An empirical analysis of German automotive suppliers. J. Purch. Supply Manag. 2013, 19, 134–143. [Google Scholar] [CrossRef]
- Sanghavi, P.; Rana, Y.; Shenoy, S.; Yadav, R. A Review on Green Supply Chain Management in Automobile Industry. Int. J. Curr. Eng. Technol. 2015, 5, 3697–3702. [Google Scholar]
- Feng, W.; Sifeng, L.; Haibin, L.; Yanping, L.; Weizhao, L. A Demonstrative Study for Risk Factors of Green Supply Chain Management–with the Automobile Manufacturing Industry of Guangxi as an Example. In Proceedings of the 2nd China Energy Scientist Forum, Xuzhou, China, 18–19 October 2010; pp. 211–217. [Google Scholar]
- Zhao, R.; Liu, Y.; Zhang, N.; Huang, T. An Optimization Model for Green Supply Chain Management by Using a Big Data Analytic Approach. J. Clean. Prod. 2016, 142, 1085–1097. [Google Scholar] [CrossRef]
- Green, K.W., Jr.; Zelbst, P.J.; Meacham, J.; Bhadauria, V.S. Green supply chain management practices: Impact on performance. Supply Chain Manag. 2012, 17, 290–305. [Google Scholar] [CrossRef]
- Sharma, V.; Chandna, P.; Bhardwaj, A. Green supply chain management related performance indicators in agro industry: A review. J. Clean. Prod. 2016, 141, 1195–1208. [Google Scholar] [CrossRef]
- Carter, C.R.; Rogers, D.S. A framework of sustainable supply chain management: moving toward new theory. Int. J. Phys. Distr. Logist. 2008, 38, 360–387. [Google Scholar] [CrossRef]
- Paksoy, T.; Bektaş, T.; Özceylan, E. Operational and environmental performance measures in a multi-product closed-loop supply chain. Trans. Res. Part E: Logist. Trans. Rev. 2011, 47, 532–546. [Google Scholar] [CrossRef]
- Seuring, S.; Müller, M. From a literature review to a conceptual framework for sustainable supply chain management. J. Clean. Prod. 2008, 16, 1699–1710. [Google Scholar] [CrossRef]
- Ansari, Z.N.; Kant, R. A state-of-art literature review reflecting 15 years of focus on sustainable supply chain management. J. Clean. Prod. 2017, 142, 2524–2543. [Google Scholar] [CrossRef]
- Beske, P.; Seuring, S. Putting sustainability into supply chain management. Supply Chain Manag. 2014, 19, 322–331. [Google Scholar] [CrossRef]
- Ahi, P.; Searcy, C. A comparative literature analysis of definitions for green and sustainable supply chain management. J. Clean. Prod. 2013, 52, 329–341. [Google Scholar] [CrossRef]
- Carter, C.R.; Easton, L.P. Sustainable supply chain management: Evolution and future directions. Int. J. Phys. Distr. Log. 2011, 41, 46–62. [Google Scholar] [CrossRef]
- Rajeev, A.; Pati, R.K.; Padhi, S.S.; Govindan, K. Evolution of sustainability in supply chain management: A literature review. J. Clean. Prod. 2017, 162, 299–314. [Google Scholar] [CrossRef]
- Chen, I.J.; Kitsis, A.M. A research framework of sustainable supply chain management: The role of relational capabilities in driving performance. Int. J. Logist. Manag. 2017, 28, 1454–1478. [Google Scholar] [CrossRef]
- Dubey, R.; Gunasekaran, A.; Papadopoulos, T.; Childe, S.J.; Shibin, K.T.; Wamba, S.F. Sustainable supply chain management: framework and further research directions. J. Clean. Prod. 2017, 142, 1119–1130. [Google Scholar] [CrossRef]
- Bendul, J.C.; Rosca, E.; Pivovarova, D. Sustainable supply chain models for base of the pyramid. J. Clean. Prod. 2017, 162, S107–S120. [Google Scholar] [CrossRef]
- Wu, J.Z.; Santoso, C.H.; Roan, J. Key factors for truly sustainable supply chain management: An investigation of the coal industry in Indonesia. Int. J. Logist. Manag. 2017, 28, 1196–1217. [Google Scholar] [CrossRef]
- Hong, J.; Zhang, Y.; Ding, M. Sustainable supply chain management practices, supply chain dynamic capabilities, and enterprise performance. J. Clean. Prod. 2017, in press. [Google Scholar] [CrossRef]
- Frostenson, M.; Prenkert, F. Sustainable supply chain management when focal firms are complex: A network perspective. J. Clean. Prod. 2015, 107, 85–94. [Google Scholar] [CrossRef]
- Song, W.; Ming, X.; Liu, H.C. Identifying critical risk factors of sustainable supply chain management: A rough strength-relation analysis method. J. Clean. Prod. 2017, 143, 100–115. [Google Scholar] [CrossRef]
- Gopalakrishnan, K.; Yusuf, Y. Y.; Musa, A.; Abubakar, T.; Ambursa, H.M. Sustainable supply chain management: A case study of British Aerospace (BAe) Systems. Int. J. Prod. Econ. 2012, 140, 193–203. [Google Scholar] [CrossRef]
- Chaudhary, T.; Chanda, A. Evaluation and measurement of performance, practice and pressure of green supply chain in Indian manufacturing industries. Uncertain Supply Chain Manag. 2015, 3, 363–374. [Google Scholar] [CrossRef]
- Chiarini, A. (Ed.) Sustainable Operations Management: Advances in Strategy and Methodology; Springer: Cham, Switzerland, 2015. [Google Scholar]
- Dekker, R.; Fleischmann, M.; Inderfurth, K.; van Wassenhove, L.N. (Eds.) Reverse Logistics: Quantitative Models for Closed-Loop Supply Chains; Springer Science & Business Media: Berlin/Heidelberg, Germany, 2013. [Google Scholar]
- Faruk, A.C.; Lamming, R.C.; Cousins, P.D.; Bowen, F.E. Analyzing, mapping, and managing environmental impacts along supply chains. J. Ind. Ecol. 2001, 5, 13–36. [Google Scholar] [CrossRef]
- Ahi, P.; Searcy, C. An analysis of metrics used to measure performance in green and sustainable supply chains. J. Cleaner Prod. 2015, 86, 360–377. [Google Scholar] [CrossRef]
- Rebitzer, G. Integrating life cycle costing and life cycle assessment for managing costs and environmental impacts in supply chains. In Cost Management in Supply Chains; Physica: Berlin/Heidelberg, Germany, 2002; pp. 127–146. [Google Scholar]
- Schrödl, H.; Simkin, P. A SCOR perspective on Green SCM. In Proceedings of CONF-IRM, Natal, Brazil, 22–24 May 2013; p. 7. [Google Scholar]
- Bai, C.; Sarkis, J.; Wei, X.; Koh, L. Evaluating ecological sustainable performance measures for supply chain management. Supply Chain Manag. Int. J. 2012, 17, 78–92. [Google Scholar] [CrossRef]
- Lee, J.; Kim, I.; Kwon, E.; Hur, T. Comparison of simplified LCA and matrix methods in identifying the environmental aspects of products. In Proceedings of the 2003 EcoDesign 3rd International Symposium on Environmentally Conscious Design and Inverse Manufacturing, Tokyo, Japan, 8–11 December 2003; pp. 682–686. [Google Scholar]
- Moriguchi, Y.; Hashimoto, S. Material flow analysis and waste management. In Taking Stock of Industrial Ecology; Springer: Cham, Switzerland, 2016; pp. 247–262. [Google Scholar]
- Pusporini, P.; Abhary, K.; Luong, L. Integrating environmental requirements into quality function deployment for designing eco-friendly product. Int. J. Mater. Mech. Manuf. 2013, 1, 80–84. [Google Scholar] [CrossRef]
- Reefke, H.; Trocchi, M. Balanced scorecard for sustainable supply chains: Design and development guidelines. Int.J. Prod. Perfor. Manag. 2013, 62, 805–826. [Google Scholar] [CrossRef]
- Sundarakani, B.; De Souza, R.; Goh, M.; Wagner, S.M.; Manikandan, S. Modeling carbon footprints across the supply chain. Int. J. Prod. Econ. 2010, 128, 43–50. [Google Scholar] [CrossRef]
- Gurel, O.; Acar, A.Z.; Onden, I.; Gumus, I. Determinants of the green supplier selection. Procedia-Soc. Behav. Sci. 2015, 181, 131–139. [Google Scholar] [CrossRef]
- Tyagi, M.; Kumar, P.; Kumar, D. Parametric selection of alternatives to improve performance of green supply chain management system. Procedia-Soc. Behav. Sci. 2015, 189, 449–457. [Google Scholar] [CrossRef]
- Galankashi, M.R.; Chegeni, A.; Soleimanynanadegany, A.; Memari, A.; Anjomshoae, A.; Helmi, S.A.; Dargi, A. Prioritizing green supplier selection criteria using fuzzy analytical network process. Procedia CIRP 2015, 26, 689–694. [Google Scholar] [CrossRef]
- Chen, C.C.; Shih, H.S.; Shyur, H.J.; Wu, K.S. A business strategy selection of green supply chain management via an analytic network process. Comput. Math. Appl. 2012, 64, 2544–2557. [Google Scholar] [CrossRef]
- Srivastava, S.K. Green supply-chain management: A state-of-the-art literature review. Int. J. Manag. Rev. 2007, 9, 53–80. [Google Scholar] [CrossRef]
- Sarkis, J.; Zhu, Q.; Lai, K.H. An organizational theoretic review of green supply chain management literature. Int. J. Prod. Econ. 2011, 130, 1–15. [Google Scholar] [CrossRef]
- Belvedere, V.; Grando, A. Sustainable Operations and Supply Chain Management; John Wiley & Sons: Pondicherry, India, 2017. [Google Scholar]
- Grzybowska, K. Sustainability in the supply chain: Analysing the enablers. In Environmental Issues in Supply Chain Management; Springer: Berlin/Heidelberg, Germany; pp. 25–40.
- Galve, J.E.; Elduque, D.; Pina, C.; Javierre, C. Sustainable supply chain management: The influence of disposal scenarios on the environmental impact of a 2400 L waste container. Sustainability 2016, 8, 564. [Google Scholar] [CrossRef]
- Grant, D.B.; Wong, C.Y.; Trautrims, A. Sustainable Logistics and Supply Chain Management: Principles and Practices for Sustainable Operations and Management; Kogan Page Publishers: London, UK, 2017. [Google Scholar]
- Walton, S.V.; Handfield, R.B.; Melnyk, S.A. The green supply chain: Integrating suppliers into environmental management processes. J. Supply Chain Manag. 1998, 34, 2–11. [Google Scholar] [CrossRef]
- Sisco, C.; Chorn, B.; Pruzan-Jorgensen, P.M. Supply Chain Sustainability: A Practical Guide for Continuous Improvement; United Nations Global Compact, 2011; Available online: https://www.bsr.org/reports/BSR_UNGC_SupplyChainReport.pdf.
- EU-Regulations. Available online: http://eur-lex.europa.eu/homepage.html (accessed on 25 November 2017).
- Horbach, J.; Rammer, C.; Rennings, K. Determinants of eco-innovations by type of environmental impact—The role of regulatory push/pull, technology push and market pull. Eco. Econ. 2012, 78, 112–122. [Google Scholar] [CrossRef]
- Kemp, R.; Pearson, P. Final Report MEI Project about Measuring Eco-Innovation; UM Merit: Maastricht, The Netherlands, 2007; p. 10. [Google Scholar]
- El Saadany, A.M.A.; Jaber, M.Y.; Bonney, M. Environmental performance measures for supply chains. Manag. Res. Rev. 2011, 34, 1202–1221. [Google Scholar] [CrossRef]
- Kafa, N.; Hani, Y.; El Mhamedi, A. Sustainability performance measurement for green supply chain management. IFAC Proc. Volumes 2013, 46, 71–78. [Google Scholar] [CrossRef]
- Acquaye, A.; Ibn-Mohammed, T.; Genovese, A.; Afrifa, G.A.; Yamoah, F.A.; Oppon, E. A Quantitative Model for Environmentally Sustainable Supply Chain Performance Measurement. Eur. J. Oper. Res. 2017, (in press). [Google Scholar] [CrossRef]
- Mishra, D.; Gunasekaran, A.; Papadopoulos, T.; Hazen, B. Green supply chain performance measures: A review and bibliometric analysis. Sus. Prod. Consum 2017, 10, 85–99. [Google Scholar] [CrossRef]
- Balfaqih, H.; Nopiah, Z.M.; Saibani, N.; Al-Nory, M.T. Review of supply chain performance measurement systems: 1998–2015. Comput. Ind. 2016, 82, 135–150. [Google Scholar] [CrossRef]
- Lima-Junior, F.R.; Carpinetti, L.C.R. Quantitative models for supply chain performance evaluation: A literature review. Comput. Ind. Eng. 2017, 113, 333–346. [Google Scholar] [CrossRef]
- Zhu, Q.; Sarkis, J.; Lai, K. Examining the effects of green supply chain management practices and their mediations on performance improvements. Int. J. Prod. Res. 2012, 50, 1377–1394. [Google Scholar] [CrossRef]
- Golicic, S.L.; Smith, C.D. A Meta-Analysis of Environmentally Sustainable Supply Chain Management Practices and Firm Performance. J. Supply China Manag. 2013, 49, 78–95. [Google Scholar] [CrossRef]
- Laari, S.; Töyli, J.; Solakivi, T.; Ojala, L. Firm performance and customer-driven green supply chain management. J. Clean. Prod. 2016, 112, 1960–1970. [Google Scholar] [CrossRef]
- Dubey, R.; Gunasekaran, A.; Chakrabarty, A. World-class sustainable manufacturing: Framework and a performance measurement system. Int. J. Prod. Res. 2015, 53, 5207–5223. [Google Scholar] [CrossRef]
- Schrettle, S.; Hinz, A.; Scherrer-Rathje, M.; Friedli, T. Turning sustainability into action: Explaining firms’ sustainability efforts and their impact on firm performance. Int. J. Prod. Econ. 2014, 147, 73–84. [Google Scholar] [CrossRef]
- Das, D. Development and validation of a scale for measuring Sustainable Supply Chain Management practices and performance. J. Clean. Prod. 2017, 164, 1344–1362. [Google Scholar] [CrossRef]
- Cottrell, S. Critical Thinking Skills: Developing Effective Analysis and Argument; Palgrave Macmillan: Basingstoke, UK, 2011. [Google Scholar]
- Lydeard, S. The questionnaire as a research tool. Fam. Pract. 1991, 8, 84–91. [Google Scholar] [CrossRef] [PubMed]


| Tools, Instruments | Activities | Others |
|---|---|---|
| KPI (Key Performance Index) [71] | Carbon Assessments and Footprinting [83] | EU Directives and Guidelines, Recommendations, Accreditations, Certifications (ISO) [94] |
| End of life Inventory Management [72] | ||
| Packaging Assessments (Packaging Environmental Assessment Tool—PEAT [73] | Green vendor selection [84] | Engaging with Suppliers on Sustainability (TESS) [95] |
| Eco-performance measuring [85,86] | ||
| Life Cycle Analysis (LCA) [74] | Environmental rules of suppliers selections [87] | Executive opinion on environmental regulation [96] |
| Life Cycle Costing (LCC) [75] | Waste management [87] | Demand for eco-innovative products [97] |
| ESCOR [76,77] | Remanufacturing [88] | |
| Environmentally Responsible Product Assessment (ERPA) [78] | Financial support for eco-innovation from public programmers [89] | Seed and start-up venture capital for eco-innovative firms (investment per 1000 GDP), [97] |
| Material Flow Analysis(MFA) [79] | ||
| Environmental Quality Function Deployment (EQFD) [80] | Purity of recyclable materials recovered [90] | Ratio of eco-start-ups to incumbents in the market [97] |
| Sustainable Balanced scorecard [81] | Eco cooperation’s form [91] | Emission from in/outbound logistics [97] |
| VSM—Value stream mapping [82] | Waste management costs (landfill tariff, etc.) [92] | Emission from raw material sourcing, [97] |
| Concentrations of hazardous materials in products and by-products [93] | ‘Green Tax’ as a percentage of government budget [97] | |
| Share of eco-innovative firms as a percentage of all firms [97] | ||
| Useful product operating life [97] | ||
| Indicators (based on: [7,71,97]) | ||
| % of orders receives with eco-packing, regulations, certifications, green procurement,) | % recyclable/reusable materials (volume or weight) available at end of product life | Total energy consumed |
| Total mass of products produced | ||
| Total material consumed (e.g., water, timber, steel, etc.), | ||
| % of returned products | % product volume or weight recovered and re-used | Total toxic or hazardous materials used |
| % of firms with EMAS or ISO 14001 | The ratio of wastes to all outputs | Total toxic or hazardous waste generated |
| % of firms with environmental mission statements | % recycled materials (weight or volume) used as input to manufacturing | Direct material input(DMI), |
| Physical trade balance(PTB), | ||
| Solid waste emissions % product (weight or volume) disposed in landfills | % product disposed or incinerated Fraction of packaging or containers | Total domestic output(TDO), |
| Domestic Material Consumption (DMC) | ||
| Emission of greenhouse gases per unit of GDP, reduce of greenhouse gases | Number of purchase of hybrids, electric cars, flex-fuel vehicles | Domestic extraction used (DEU) |
| Recycled Material Recovery rate (MRR) | ||
| Time required for product recovery | Average energy use per square foot of office space | Core Return Rate (CRR) |
| Material productivity of eco innovative firms | Number of eco-investment, eco-innovation, eco-patents | |
| Ratio of materials recycled to materials potentially recyclable | Average total life-cycle cost savings associated with design improvements | |
| Economic output per unit of material input | Estimated annual risk of adverse effects in humans and biota | |
| Purchase and operating cost incurred by the consumer | Average life-cycle cost incurred by the manufacturer | |
| The amount of energy cost | ||
| compliance cost, non-compliance cost | ||
| Companies Implement or Intend to Implement | χ2 | p-Value | V Cramer | |
|---|---|---|---|---|
| Medium-sized companies | Green supply chain | 4.5170 | 0.04132 | 0.37412 |
| Sustainable supply chain | 8.3221 | 0.04211 | 0.34216 | |
| Large companies | Green supply chain | 7.2361 | 0.03825 | 0.41732 |
| Sustainable supply chain | 6.0548 | 0.04413 | 0.38329 |
| Source of Variation | F0 | p-Value | F0 | p-Value | |
|---|---|---|---|---|---|
| Companies | Middle-Sized | Large | |||
| Criterion 1—one of the selection criteria (e.g., supplier, partner) are environmental requirements | Manufacturers | 0.877 | 0.3516 | 4.668 | 0.047 |
| Providers | 1.043 | 0.3146 | 12.259 | 0.0025 | |
| Retailers | 13.83 | 0.0009 | 5.277 | 0.039 | |
| Criterion 2—“green” image is taken into account | Manufacturers | 2.281 | 0.1346 | 0.212 | 0.645 |
| Providers | 1.865 | 0.1828 | 6.670 | 0.018 | |
| Retailers | 0.229 | 0.6357 | 0.569 | 0.452 | |
| n = 481 | % | |
|---|---|---|
| Not Use | Use | |
| KPI | 19.67 | 80.33 |
| LCA | 45.72 | 54.28 |
| BSC | 28.23 | 71.77 |
| Eco-effectiveness | 50.09 | 49.91 |
| LCA Implementations | |||||||||
|---|---|---|---|---|---|---|---|---|---|
| Industry | Retailer/Sales Network | ||||||||
| Emp. | Food Conventional | Food Organic | Wearing Apparel | Home Appliance | Grocery and General Merchandise | Home Appliance | Wearing Apparel | ||
| 50–99 | 12.71% | 2.68% | 3.34% | 2.01% | 2.34% | 2.34% | 1.67% | ||
| 100–199 | 4.35% | 2.34% | 1.67% | 1.34% | 0.33% | 1.67% | 1.34% | ||
| 200–249 | 7.36% | 1.67% | 1.67% | 1.34% | 2.34% | 0.67% | 0.67% | ||
| 250–499 | 6.02% | 1.34% | 0.33% | 1.00% | 0.67% | 1.67% | 0.67% | ||
| 500–999 | 8.03% | 2.01% | 1.67% | 1.67% | 2.01% | 2.01% | 0.67% | ||
| ≥1000 | 5.35% | 1.67% | 1.67% | 1.67% | 1.34% | 1.67% | 1.00% | ||
| BSC Implementation | |||||||||
| 50–99 | 26.14% | 2.28% | 10.66% | 2.03% | 1.78% | 1.52% | 1.27% | ||
| 100–199 | 3.55% | 1.52% | 1.27% | 0.76% | 0.25% | 0.76% | 0.76% | ||
| 200–249 | 4.82% | 1.52% | 1.27% | 1.02% | 1.52% | 0.51% | 0.25% | ||
| 250–499 | 4.31% | 0.76% | 0.25% | 0.51% | 0.76% | 1.52% | 0.51% | ||
| 500–999 | 7.36% | 1.02% | 1.52% | 0.76% | 1.52% | 1.02% | 0.76% | ||
| ≥1000 | 4.82% | 1.52% | 1.02% | 1.02% | 1.27% | 1.78% | 0.76% | ||
| KPI Implementation | |||||||||
| 50–99 | 30.39% | 2.55% | 19.71% | 2.92% | 2.92% | 2.19% | 1.46% | ||
| 100–199 | 5.84% | 2.55% | 1.46% | 1.09% | 0.73% | 1.46% | 1.09% | ||
| 200–249 | 8.03% | 1.82% | 1.82% | 1.46% | 2.19% | 0.73% | 0.36% | ||
| 250–499 | 6.93% | 1.82% | 0.36% | 0.73% | 1.09% | 2.19% | 0.73% | ||
| 500–999 | 9.49% | 2.19% | 2.19% | 1.09% | 2.19% | 1.82% | 1.09% | ||
| ≥1000 | 6.20% | 1.82% | 1.82% | 1.46% | 1.82% | 1.82% | 1.09% | ||
| Eco-effectiveness indicators | |||||||||
| 50–99 | 9.12% | 2.19% | 2.19% | 2.55% | 2.92% | 1.82% | 1.46% | ||
| 100–199 | 5.11% | 2.55% | 2.19% | 1.09% | 0.73% | 1.82% | 1.46% | ||
| 200–249 | 8.03% | 2.92% | 1.82% | 1.46% | 2.92% | 0.36% | 0.73% | ||
| 250–499 | 6.57% | 1.46% | 0.36% | 0.73% | 0.73% | 1.82% | 0.36% | ||
| 500–999 | 9.12% | 2.19% | 1.82% | 1.46% | 2.19% | 1.82% | 0.73% | ||
| ≥1000 | 5.47% | 1.82% | 1.46% | 1.09% | 1.82% | 1.46% | 0.36% | ||
| General in % | |||||||
|---|---|---|---|---|---|---|---|
| Emp. | Leader | Initiator | Imitator | Adapting Changes | Continuer | Innovator | Uncommitted |
| 50–99 | 0.55 | 7.29 | 32.24 | 18.76 | 27.14 | 8.74 | 15.85 |
| ≥100 | 1.46 | 21.13 | 36.25 | 9.11 | 16.94 | 22.40 | 18.40 |
| 50–249 | 1.09 | 15.85 | 49.00 | 23.32 | 34.06 | 19.31 | 23.13 |
| ≥250 | 0.91 | 12.57 | 19.49 | 4.55 | 10.02 | 11.84 | 11.11 |
© 2018 by the authors. Licensee MDPI, Basel, Switzerland. This article is an open access article distributed under the terms and conditions of the Creative Commons Attribution (CC BY) license (http://creativecommons.org/licenses/by/4.0/).
Share and Cite
Tundys, B.; Wiśniewski, T. The Selected Method and Tools for Performance Measurement in the Green Supply Chain—Survey Analysis in Poland. Sustainability 2018, 10, 549. https://doi.org/10.3390/su10020549
Tundys B, Wiśniewski T. The Selected Method and Tools for Performance Measurement in the Green Supply Chain—Survey Analysis in Poland. Sustainability. 2018; 10(2):549. https://doi.org/10.3390/su10020549
Chicago/Turabian StyleTundys, Blanka, and Tomasz Wiśniewski. 2018. "The Selected Method and Tools for Performance Measurement in the Green Supply Chain—Survey Analysis in Poland" Sustainability 10, no. 2: 549. https://doi.org/10.3390/su10020549
APA StyleTundys, B., & Wiśniewski, T. (2018). The Selected Method and Tools for Performance Measurement in the Green Supply Chain—Survey Analysis in Poland. Sustainability, 10(2), 549. https://doi.org/10.3390/su10020549