1. Introduction
With continuing urbanization and global warming, thermal environments in cities have become a serious issue within the last decades [
1,
2,
3]. In recent years, summer air temperatures have been constantly increasing. Moreover, more and more citizens are threatened by urban heat island (UHI) effects and the tropical night phenomenon [
4]. These phenomena not only negatively impact the thermal comfort of people, they also affect their life satisfaction, social life, and potentially their mobility [
5,
6,
7]. In this context, many scholars from different parts of the world have tried to solve the issues mentioned above using UHI mitigation strategies to lower urban air temperatures directly or indirectly using urban physical elements to achieve shading effects and create better walking environments [
8,
9,
10,
11,
12].
Even though a number of studies on UHI effects in densely built-up areas have been carried out, most of the studies conducted have used thermal simulation tools and focused primarily on buildings [
13,
14,
15,
16] in Korea. In other words, only a few studies have measured the thermal characteristics of the urban street elements using a thermal imaging camera.
This study investigates the effects of urban street elements including street trees, pavement materials, building use types, and building materials on road surface temperatures in Seoul, the capital of Korea, using a thermal imaging camera. Temperature differences caused by the amount of solar radiation reaching the ground surface across time are also addressed by analyzing both daytime and nighttime data. Thus, the aim of this study is not only to examine better street forms and materials for buildings and pavement with regard to thermal environments in cities, but also to propose implications for improving the outdoor thermal comfort of pedestrians by analyzing the thermal characteristics of urban street elements.
2. Literature Review
The effects of urban morphology (that is, the fundamental elements of urban structures such as buildings, streets, and other features) on thermal environments in cities have been analyzed in previous studies [
17,
18,
19,
20,
21,
22]. However, few studies have analyzed urban surface temperatures using a thermal imaging camera. In addition, a few studies have explored the thermal environment of urban street elements using thermal cameras, particularly at the pedestrian level, which is a relatively micro-scale analysis.
Yamazaki et al. [
23] carried out research on UHI effects in Tokyo, Japan, using thermal images. The results showed that the surface temperatures of asphalt roads were significantly higher than those of other types of pavement. The study also found that areas with roadside trees and road-center plants were cooler than areas of pavement or building walls. The authors used airborne thermal sensors to investigate the mitigation effects of urban rooftop greening. The results indicated that the highest temperature of a tiled roof was 46.4 °C, whereas vegetated roof surfaces were significantly cooler. Furthermore, the study addresses the mitigation effects of different vegetation types. For example, vegetated rooftops covered with cactus were observed to have high temperatures, despite having a high normalized difference vegetation index (NDVI). The study concludes that the dry surface of the cactus negatively affected the thermal environment, unlike other vegetation.
In addition, Hwang et al. [
24] investigated urban elements that potentially negatively affect thermal environments using a thermal imaging camera. According to their results, urban surfaces—for example, road pavement, green areas, shading effects, building façades, and signboard materials—play an important role in UHI effects. In most cases, dark-colored pavement types, such as asphalt, concrete, or granolith paved surfaces, were shown to contribute to high temperatures, whereas paved roads with vegetation were significantly cooler by 10 °C than other paved roads or structures nearby, because of trees shielding the direct solar radiation. Construction materials were also addressed. The surface temperatures of building façades made of artificial construction materials are generally higher than those of building façades in green areas, because artificial construction materials have lower albedo values, and building façades are exposed to direct solar radiation during the day. The authors identified several major factors causing UHI effects, including paved roads, signboards, and building walls. However, that study addresses thermal behavior in only a few construction materials.
Yoon [
25] investigated thermal environments in a medium-sized city in Korea, across differing seasons of autumn and winter. In accordance with the findings of previous studies on urban surface temperatures, the results of that study showed that the surface temperatures of asphalt pavement were higher than the surface temperatures of vegetated areas or sidewalk blocks around an artificial fountain during both seasons. The study also found a strong relationship between urban surface temperature and ambient air temperature. For example, a high surface temperature causes warmer air temperature in most cases. Despite such findings, the study has limitations insofar as it only considered limited urban surfaces that were found in the immediate area of study.
In addition, Ahn et al. [
26] monitored UHI effects and explored the relationship between building surface temperature and ambient air temperature using thermal imaging cameras installed at five different locations in the Seoul metropolitan area. Analyzing climate data collected from a representative sample of the hottest time of a summer day—14 August 2009, at 14:00—the air temperature in Seoul was 32.4 °C, while surface temperatures observed at the five locations varied from 46.0 °C to 62.1 °C. The results showed that the building surface temperature was significantly higher (by 22 °C) than air temperature during a hot summer day. The authors concluded that the low albedo values of building materials, such as concrete, and the anthropogenic heat generated by the use of air conditioning increased building surface temperatures. Even though the study analyzed surface temperatures at five locations in Seoul, the authors addressed only a few factors affecting urban surface temperatures. Therefore, a greater variety of factors should be considered in further research.
Nam [
27] explored thermal environments in environment-friendly apartment complexes to analyze the mitigation effects of vegetation, bodies of water, and albedo values, based on surface temperature measurements obtained from a thermal imaging camera. Measurements were performed at 14:00, the hottest time of day. The results showed that concrete blocks had the highest surface temperature (37.4 °C), followed by vegetation (27.9 °C), and bodies of water (27 °C). However, this study focused on mitigation strategies in only these three limited urban surfaces (i.e., concrete blocks, vegetation, and bodies of water). In a similar study conducted in Seoul, Korea, Cho and Lim [
28] analyzed the mitigation effects of urban road vegetation on road surface temperatures. The study found that roadside land use impacts road surface temperatures. For example, if roadside land is used for green areas or open spaces (as opposed to other types of land-use patterns), then road temperatures tend to be lower. Similarly, the surface temperatures of artificial pavement (e.g., concrete, interlocking blocks) are higher than those of natural pavements (e.g., green spaces, bare soil). This observation was shown to be true in both daytime and nighttime analysis. However, their research has limitations, in that various types of pavement were not addressed.
A study by Elhinnawy [
29] conducted on a building at Arizona State University evaluated the thermal behavior of the building envelope. The study found that the surface temperature of the east façade varied depending on the albedo value. For example, a surface temperature reduction of 3 °C was observed for every 0.05 rise in albedo at 9:00, when the highest temperature values were measured. Therefore, surface albedo values can be effectively applied to urban planning processes as a powerful UHI mitigation strategy. However, despite these findings, the study has limitations insofar as it only focused on one specific building, which prohibits generalization to temperature changes in building façades constructed of the same material at different locations.
In addition to albedo values, a few studies have addressed the thermal properties of various types of building materials (e.g., specific heat capacity, emittance) to analyze their thermal behaviors [
30,
31,
32]. These studies addressed the role of specific heat capacity. For example, a material with a high heat capacity, such as a concrete ground surface, tends to emit more heat energy, especially at night, when compared to materials with lower heat capacity. As a result, materials with high heat capacities can cause an uncomfortable thermal environment for pedestrians. The heat release of the material may also be very critical to the surface temperatures [
33]. A material with low thermal emittance can have a high surface temperature because of less heat emissivity and less heat loss due to convection.
Reviewing the previous studies, we develop the current study as follows. First, we consider a greater variety of construction materials to investigate their effects on an urban thermal environment. Moreover, the thermal behaviors of urban elements with and without shading are also addressed. Second, the current study analyzes thermal environments of three adjacent urban streets in Seoul in order to investigate how the thermal behaviors of urban elements differ across varying urban street patterns under controlled climate conditions. Third, the majority of previous studies give only a very simple understanding of thermal images, because thermal imaging cameras are generally used to prove reliability in the results of certain simulations developed by the authors. In contrast, we analyze the thermal images of urban streets in a more detailed way to suggest better urban street structures that could improve thermal comfort at the pedestrian level.
3. Materials and Methods
3.1. Description of Study Areas
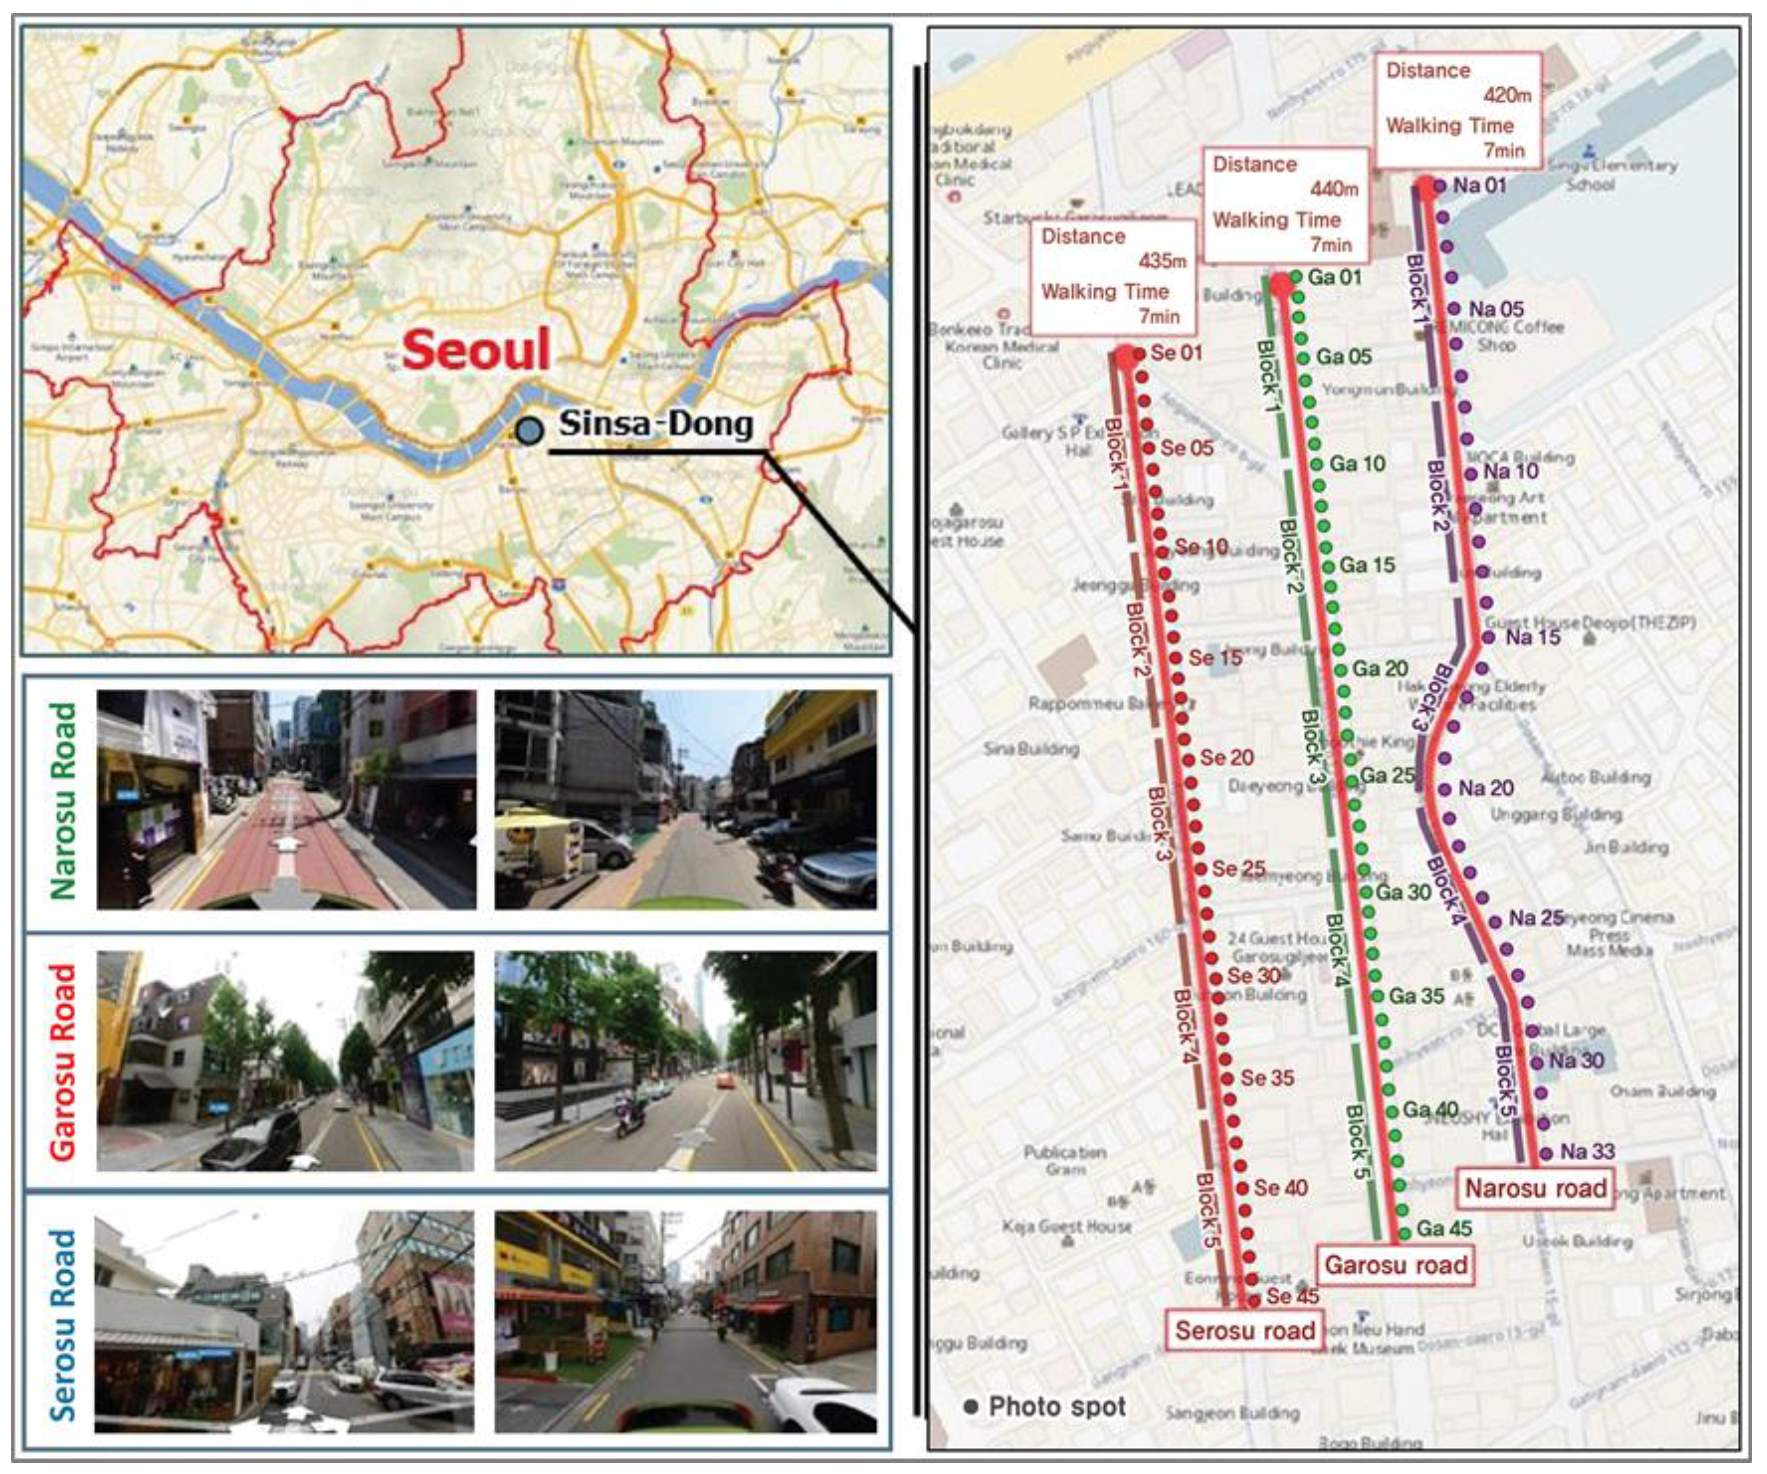
Three major commercial streets—Garosu road, Narosu road, and Serosu road, located in Sinsa-dong in the Gangnam district of Seoul, the capital of Korea—were selected as study areas. These streets are adjacent, so they are considered as experiencing the same climate conditions. Various characteristics are found on each street, even though they are all commercial streets. More specifically, various building use types (e.g., restaurants, coffee shops, cosmetic/clothing stores, residential buildings), density of street trees, road width, and building shapes comprise the distinctive characteristics of each street (
Figure 1).
Garosu road, a main commercial street in Sinsa-dong, Gangnam-gu, Seoul, has sidewalks along a two-lane road, and is famous for its characteristic features. There are street trees and a lot of stores, such as art galleries, designer boutiques, and small coffee shops, which give the street a very unique atmosphere. Compared to the other streets in our area of study, Garosu road has more art galleries and retail shops. Its two-lane structure also enables driving at relatively higher speeds than on the other roads. Regarding building configurations, different construction materials and building heights offer interesting variations on building design. Almost no buildings are set back from the road; therefore, a consistent building line is identified for this study area, and sidewalk width is constant as well.
With the expansion of Garosu road, Serosu road, with relatively fewer stores, has also been developed over the past years. Small clothing stores, restaurants, and offices are mainly located in the street. Unlike Garosu road, almost no street trees are present, and people drive cars at much lower speeds because of the narrow, one-lane road. In most cases, multipurpose buildings (with offices at upper stories and retail shops at lower stories) are found in this area of study. Some of the stores have designed public open spaces for pedestrians by setting buildings back from the road.
Similarly, Narosu road has grown in popularity as a result of the huge success of Garosu road. Newly opened small shops and existing buildings, which are mostly used for residential and educational purposes, coexist on Narosu road, forming the distinctive characteristics of the street. Even though trees are not seen along the road, there is a small amount of vegetation near the residential and educational buildings. Regarding the car traffic, the narrow width of Narosu road’s one lane ensures lower driving speeds. In addition, only a few cars are observed in this study area because of its residential features.
To analyze the surface temperatures of urban elements such as building use types, construction materials, road widths street trees, and other features under controlled climate conditions, three adjacent commercial streets were selected for the study. Even though the streets are approximately 700 m long, we chose a 400-m length of each street as the study area of focus in order to avoid any influence from two eight-lane roads, Dosan road and Apgujeong road, which are connected to our streets of focus.
3.2. Methodology
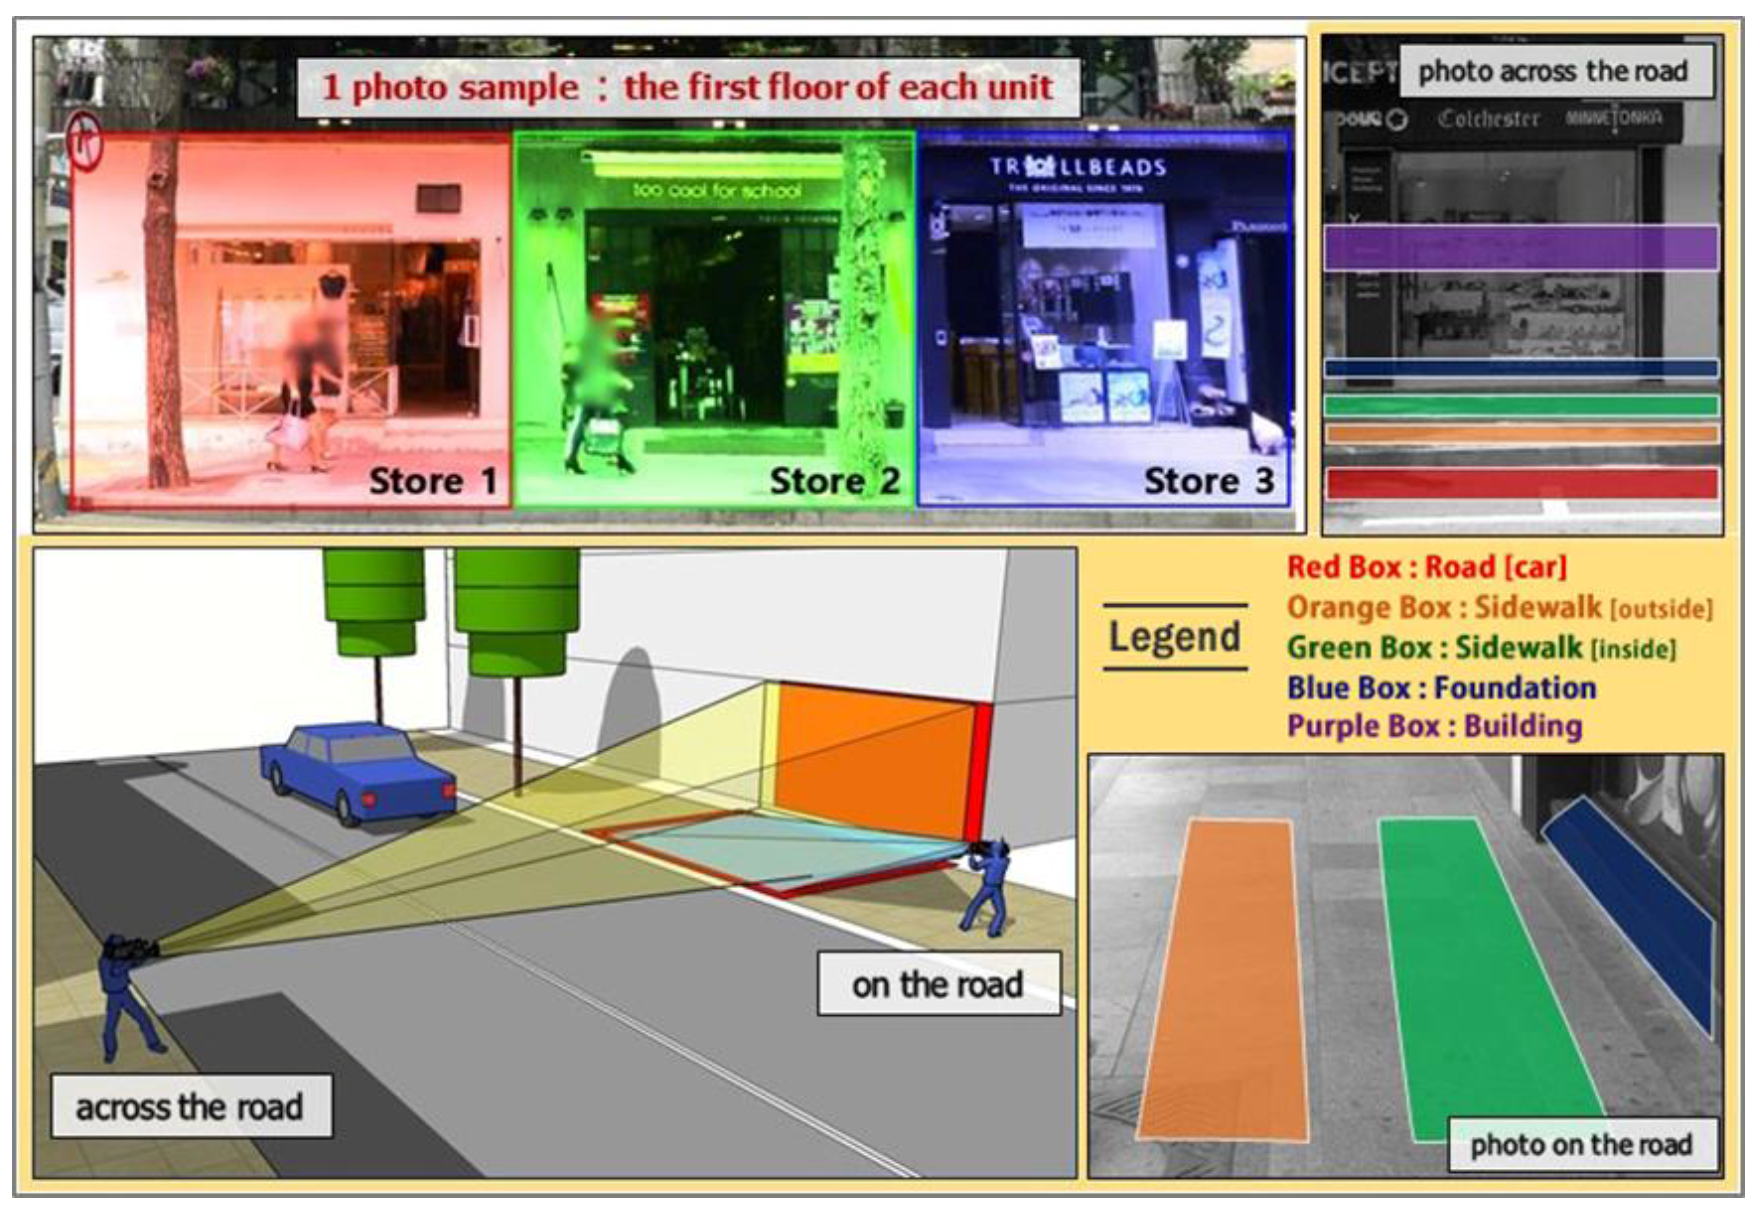
High-resolution, forward looking infrared (FLIR) thermal imaging cameras, the FLIR T430sc and FLIR T440 (FLIR Systems: Wilsonville, OR, USA), were used to measure urban surface temperatures. The camera receives radiation from the target object, plus radiation from its surroundings that has been reflected onto the object’s surface. The surface temperature was calculated with emission from the object, reflected emission from ambient sources, and emission from the atmosphere. The FLIR T430sc and T440 cameras both have a field of view (FOV) of 25° × 18.8°. The minimum distance to obtain accurate thermal images is 15 cm, and the images are automatically calibrated with the distance.
Using FLIR-specific analysis software (ResearchIR Max + HSDR) collected thermal images from each study area were analyzed. Climate data from the Korea Meteorological Administration and K-Weather database were used as input data for the thermal imaging cameras. The pilot test was conducted from 13:00–14:00 on 5 June 2017, in order to see if temperature differences were recorded between the two cameras. Based on the results, the surface temperature from the T430sc, the latest camera model with better data reliability, was used as a standard to calibrate results from the T440. Thermal images were taken from the frontal direction, because it offered more accurate thermal data and was less blocked by pedestrians.
Field measurements were performed on 16 June and 22 June 2017. In addition, measurements were carried out during daytime and nighttime hours, which were defined as 13:00–14:30 and 19:00–20:30, respectively. Accordingly, the characteristics of urban surface temperatures during both time periods were addressed by analyzing average values at each time (13:00: mean temperature (MT) of 29.1 °C, average humidity (AH) of 44%, average wind speed (WS) of 0.8 m/s, average wind direction (WD) of south; 19:00: MT of 27.7 °C, AH of 42%, WS of 1.9 m/s, WD of south).
Two thermal imaging cameras were used for each street (
Figure 2). Images of every building on the street were obtained, including images of the sidewalks adjacent to the buildings. In order to obtain more accurate surface temperatures of sidewalks, the second camera was simultaneously used to collect thermal images of the area at a short distance away. As we illustrated in
Figure 2, we analyzed the surface temperature of five spots, including at the middle height of the exterior wall of the first floor, the bottom part of the building façade, the sidewalk adjacent to the building, the sidewalk adjacent to the road, and the road. The spots were selected because they are considered to represent the major factors affecting pedestrian thermal comfort. Accordingly, the thermal characteristics of urban elements at five different spots were investigated.
4. Data Analysis
4.1. Comparative Analysis of Garosu Road, Narosu Road, and Serosu Road Temperatures
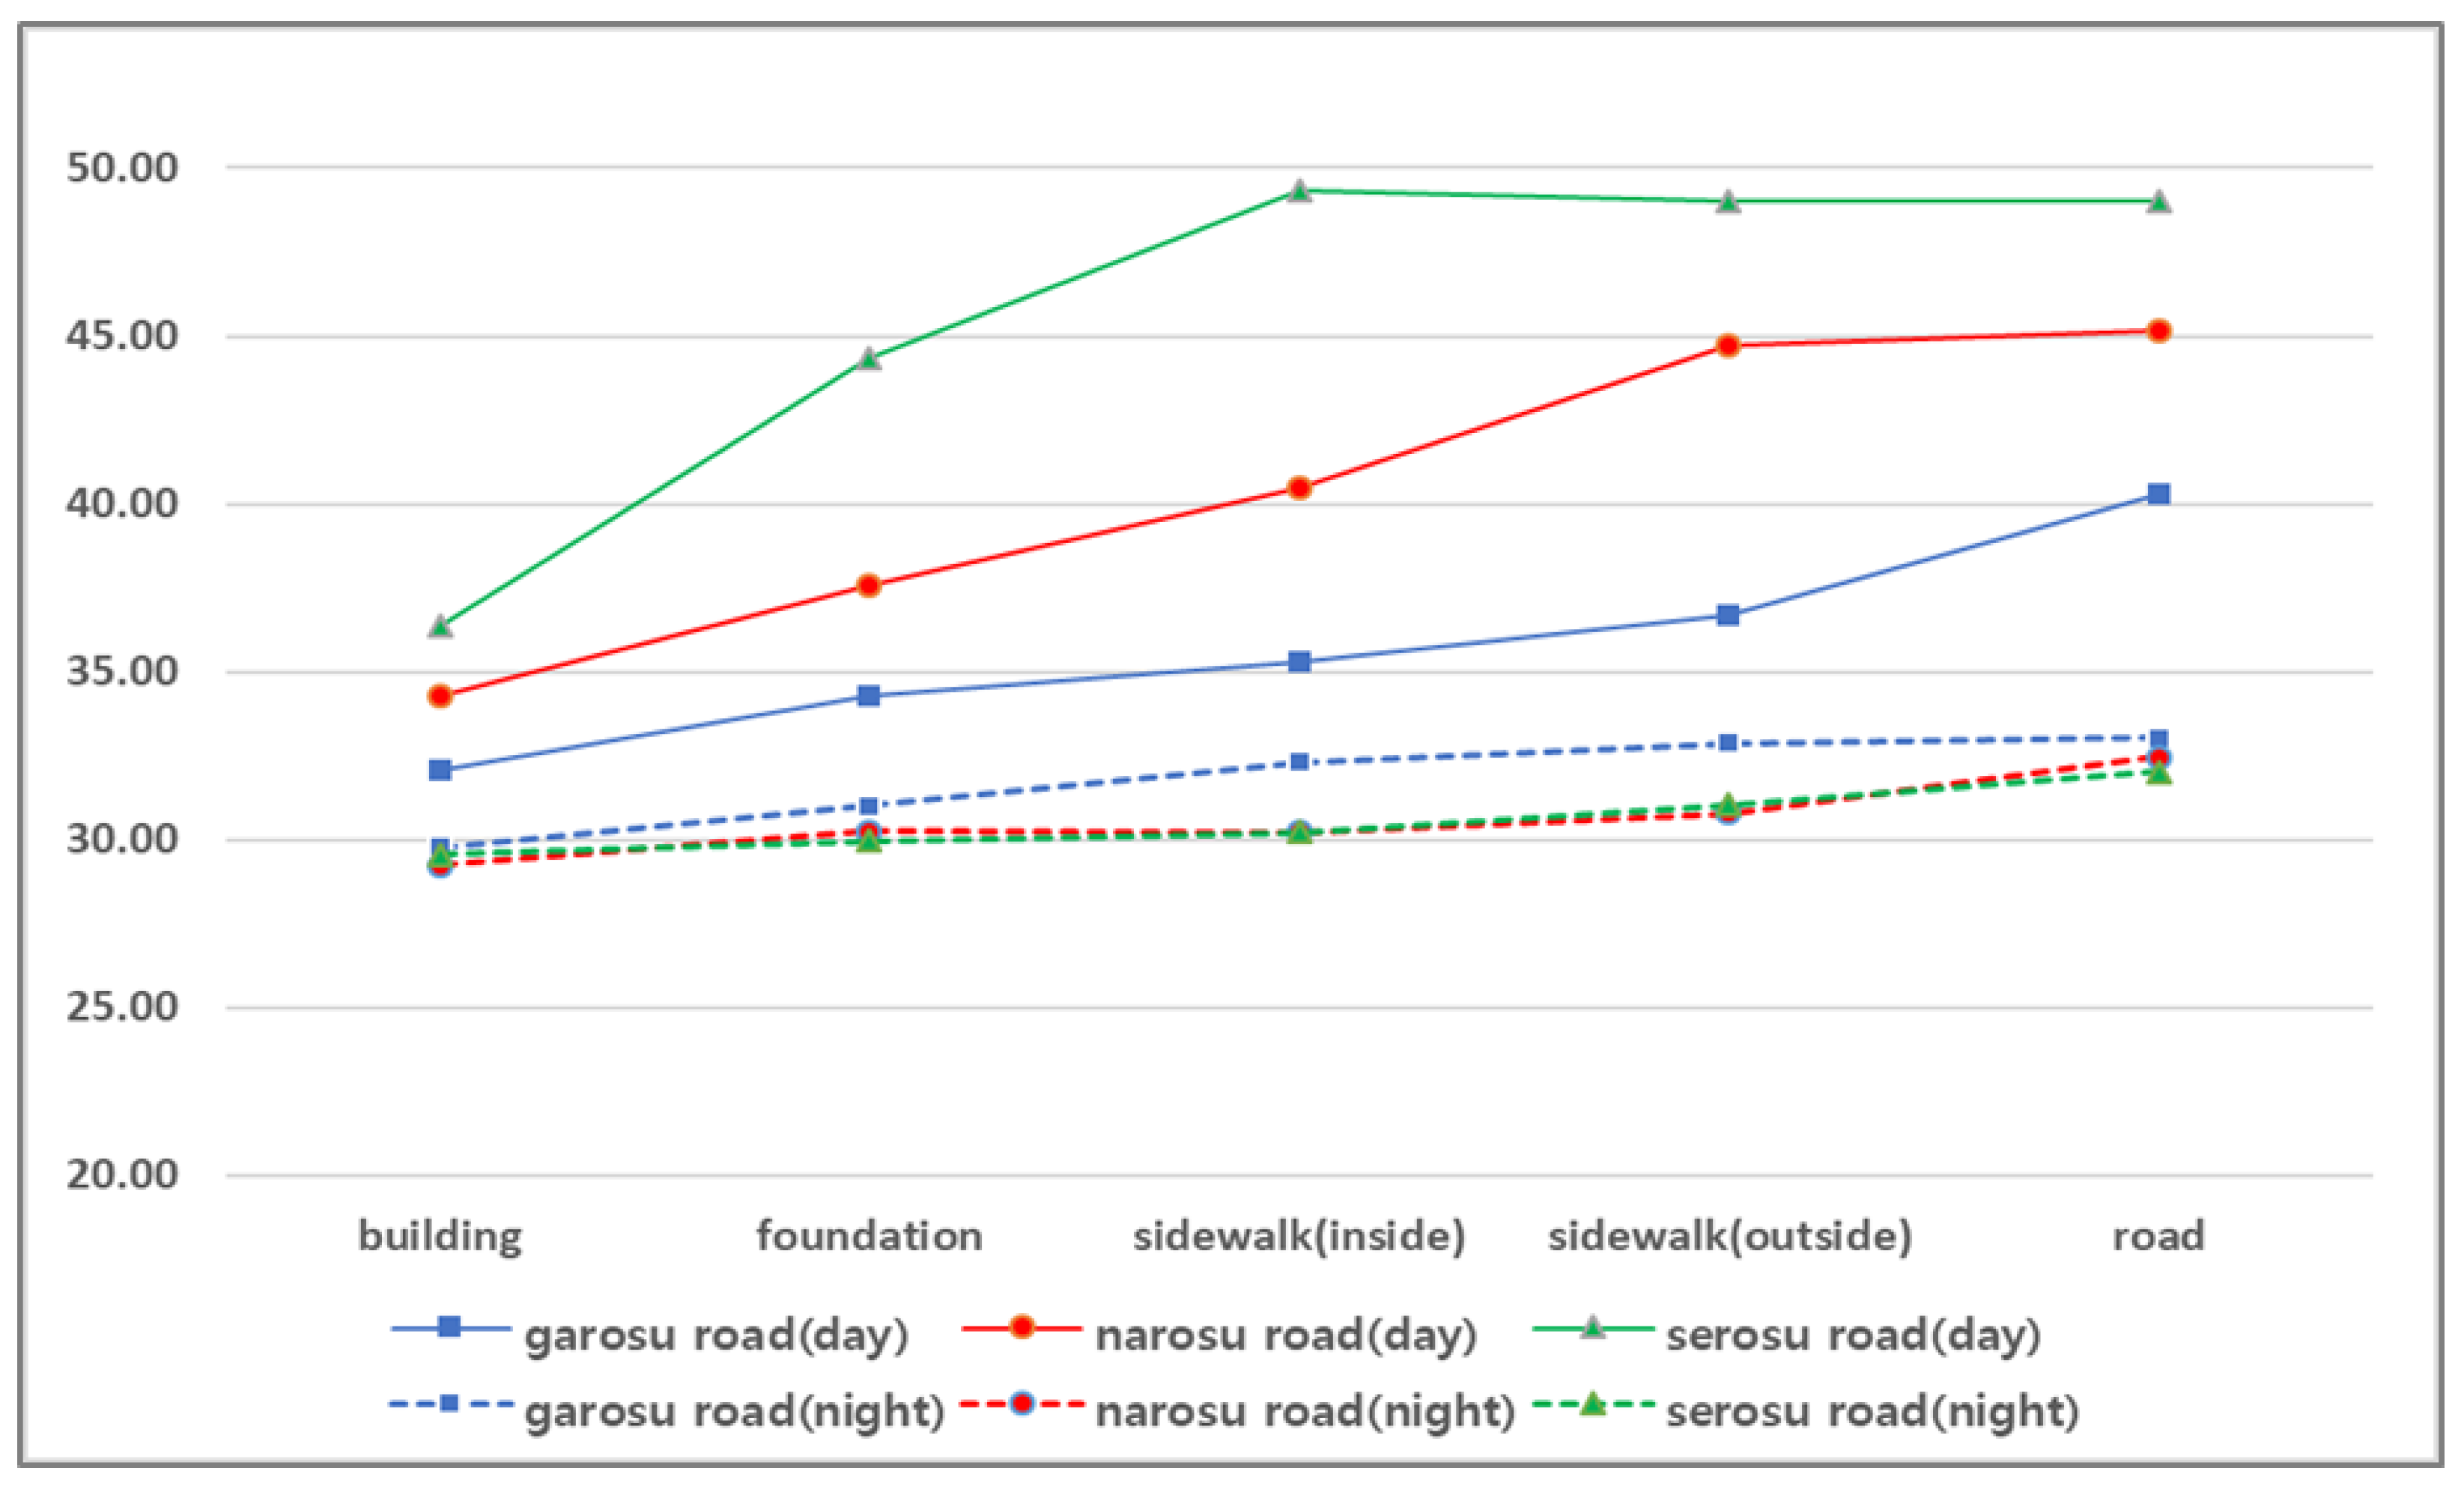
Figure 3 shows the mean surface temperatures of five different spots on each road during the day and night, which were measured using thermal imaging cameras. As we indicated, the five different spots are the middle height of the exterior wall of the first floor (building), the bottom part of the building façade (foundation), the sidewalk adjacent to the building (inside of sidewalk), and the sidewalk adjacent to the road (outside of sidewalk).
The highest surface temperature was mainly observed on the road. In contrast, the lowest temperature was measured on the building façade. The reason for the lower surface temperature of the building façade is due to the material of the façade. Glass façades are mainly found on each street, and glass is easily affected by chilled indoor air. In other words, air conditioning systems cool the indoor air, eventually lowering the surface temperatures of the glass façades. Besides that, the solar elevation angle mainly describes the highest surface temperatures measured on the road. According to the Korea Astronomy and Space Science Institute, the solar elevation angle was 74.50° on the field measurement, so the exposed solar radiation area is larger on the road than on the building façade.
In comparing the average daytime temperatures of the three roads, the lowest average road surface temperature was measured on Garosu road (40.26 °C), where most parts of the street were fully covered with the shadows of trees. The surface temperature of Narosu road (45.16 °C), where commercial and residential buildings coexist with small amounts of plants, was between the surface temperature of Garosu road and Serosu road. The highest surface temperature was measured on Serosu road (49.02 °C), due to a lack of street trees, and many restaurants that could emit large amounts of anthropogenic heat. In addition, road width can contribute to this surface temperature distribution. For example, Garosu road has a width of 11 m, with street trees that create shadows on the sidewalk during the day. In contrast, Serosu road has a narrow width of 6 m, with no trees, so there is no way to block sunlight. On the other hand, higher surface temperatures are observed at Garosu road, where more vehicles and people are observed (Garosu road: 33.05 °C; Narosu road: 32.48 °C; Serosu road: 32.02 °C) during the nighttime. Moreover, there are more anthropogenic heat emissions from retail shops on Garosu road. Interestingly, street trees show a negative impact on temperature at night, as the trees retained the heat generated during the day.
4.2. Analysis of Temperatures on Garosu Road
Among the three roads, the lowest average surface temperature was measured on Garosu road, which is a two-lane commercial road with street trees along its sidewalks, with 76.44% covered with tree shade. To explore temperature differences more efficiently, the road is divided into five different blocks as units of analysis, as shown in
Figure 1.
On Garosu road, the highest surface temperature is observed on the fifth block, which is shown in
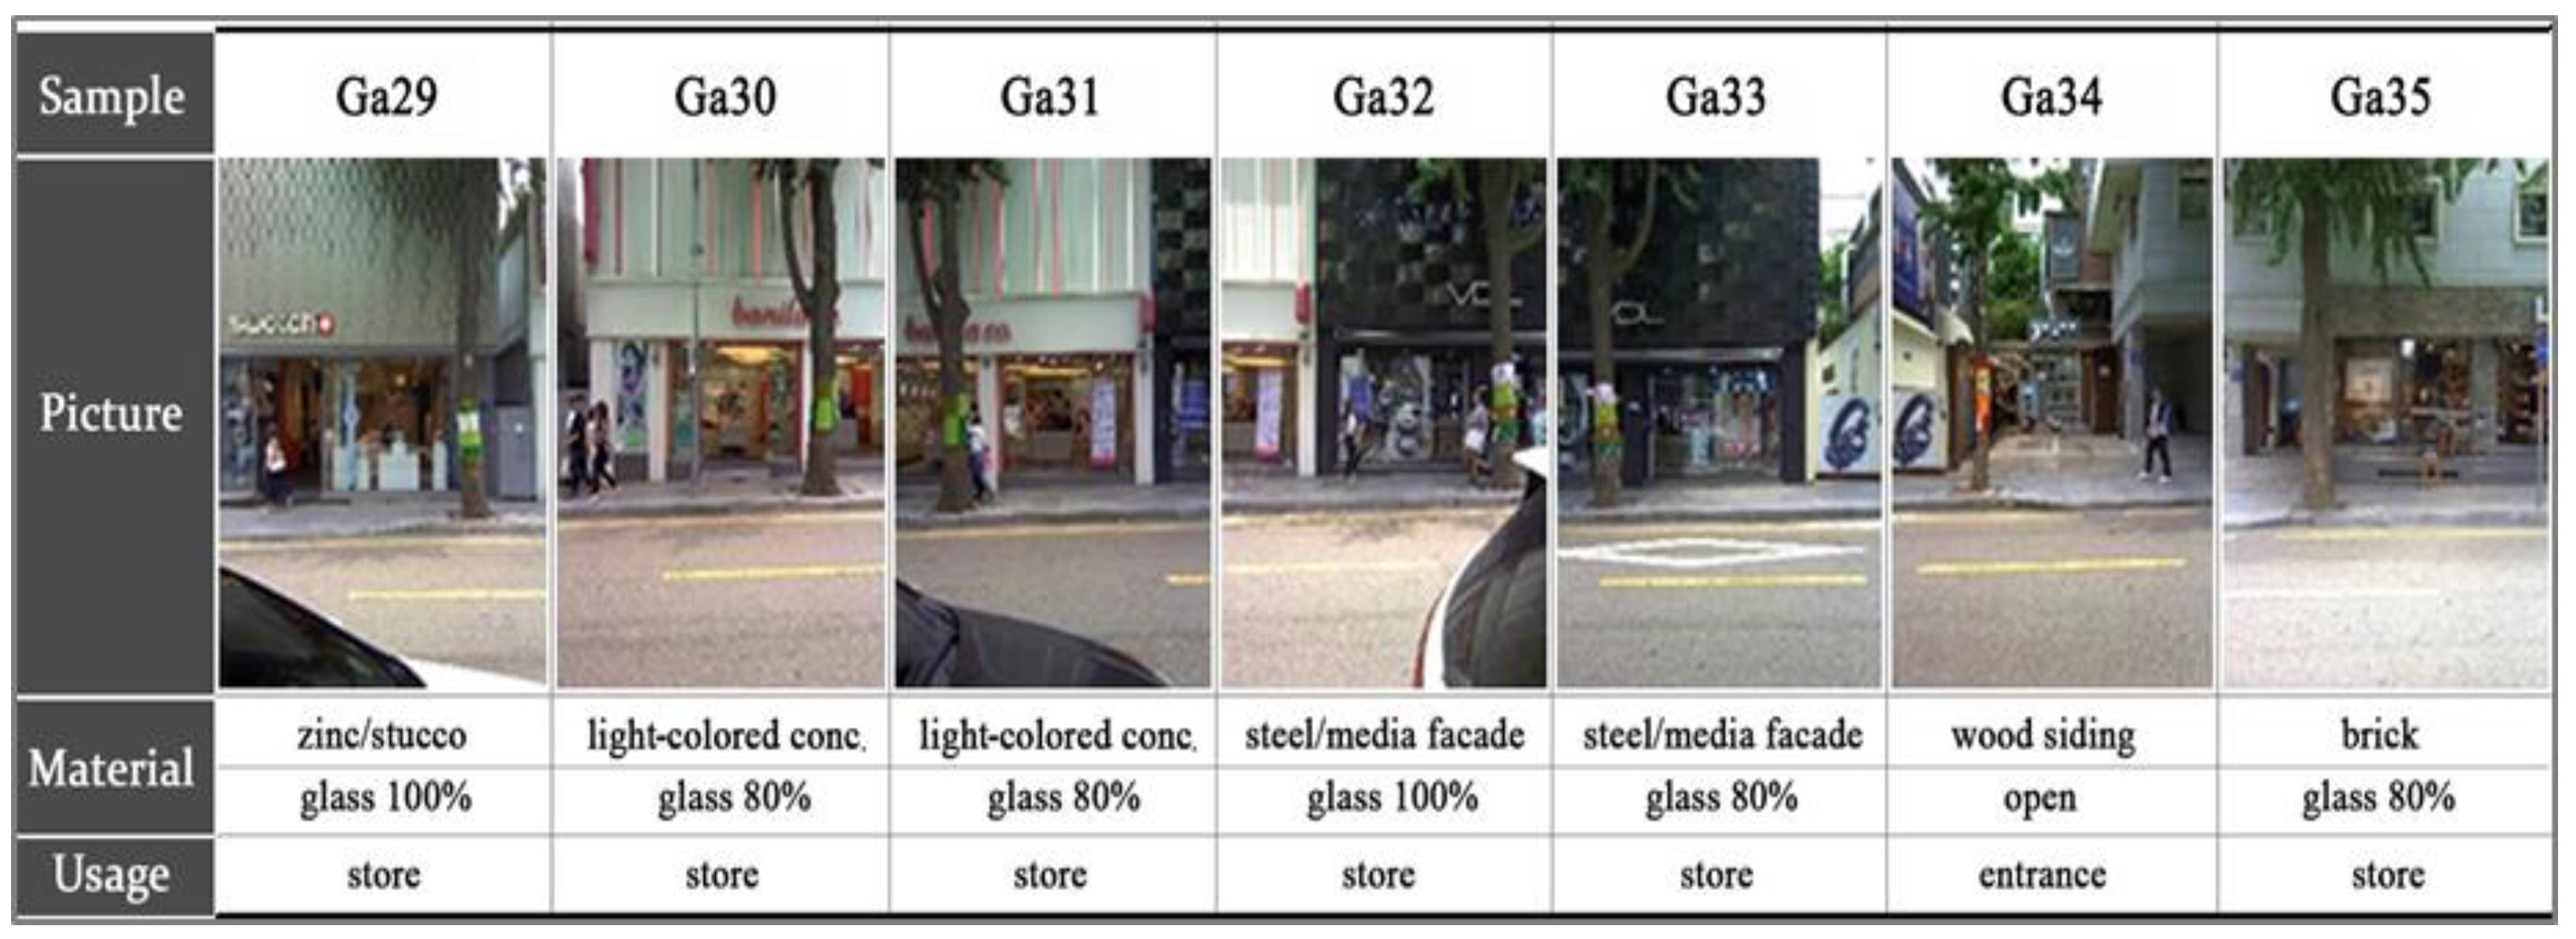
Figure 4. This block has the least amount of shade in comparison to the other blocks of Garosu road. Moreover, more than 60% of the building façades are covered with glass, and dark-colored construction materials are most common. The average surface temperature of the sidewalk on this block was 37.47 °C. The lowest temperature on Garosu road is observed on the fourth block (
Figure 5). The sidewalk on this block is 82.88% covered by shadow, which is higher than the average of all of the blocks. Glass is applied to more than 80% of the building façades, and colored construction materials are the most common. The average surface temperature of the sidewalk was 33.35 °C, which was 4.12 °C lower than the block with the highest temperature on Garosu road.
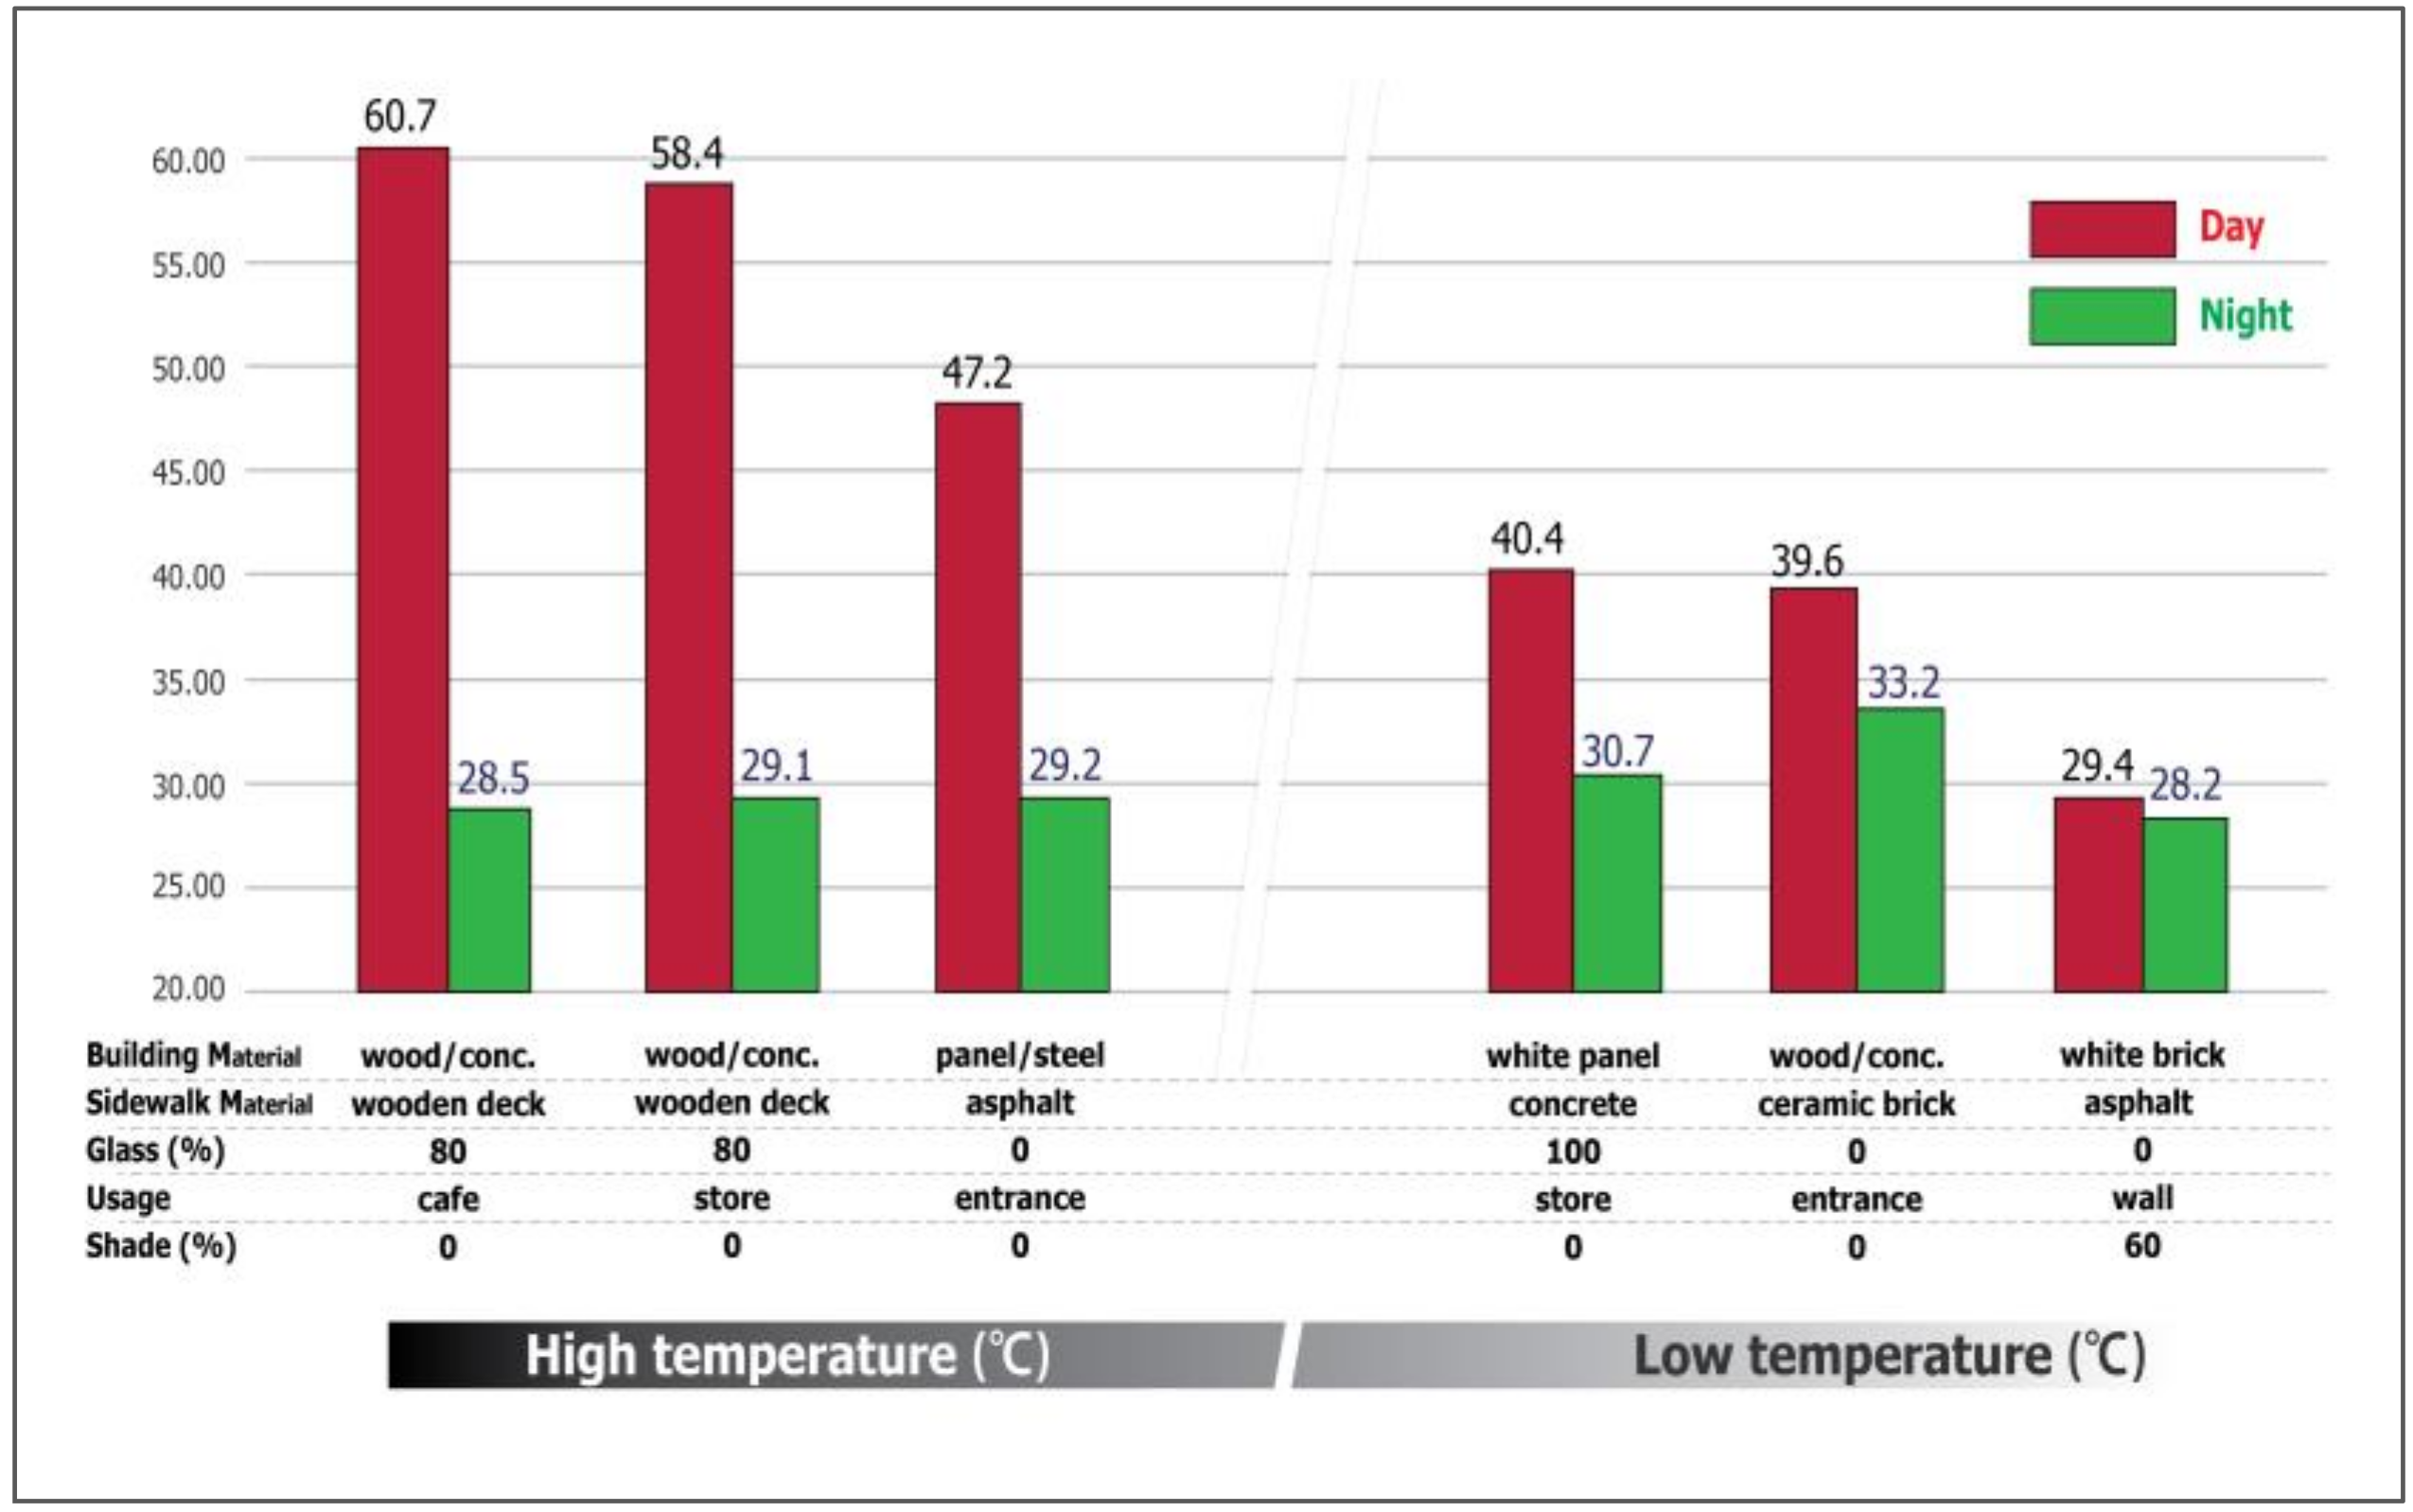
We also analyzed the thermal environments of each road based on building use type. Data from the highest and lowest three surface temperatures of the roads are shown in
Table 1 and
Table 2. More detailed data of the sidewalk adjacent to the building is also shown in
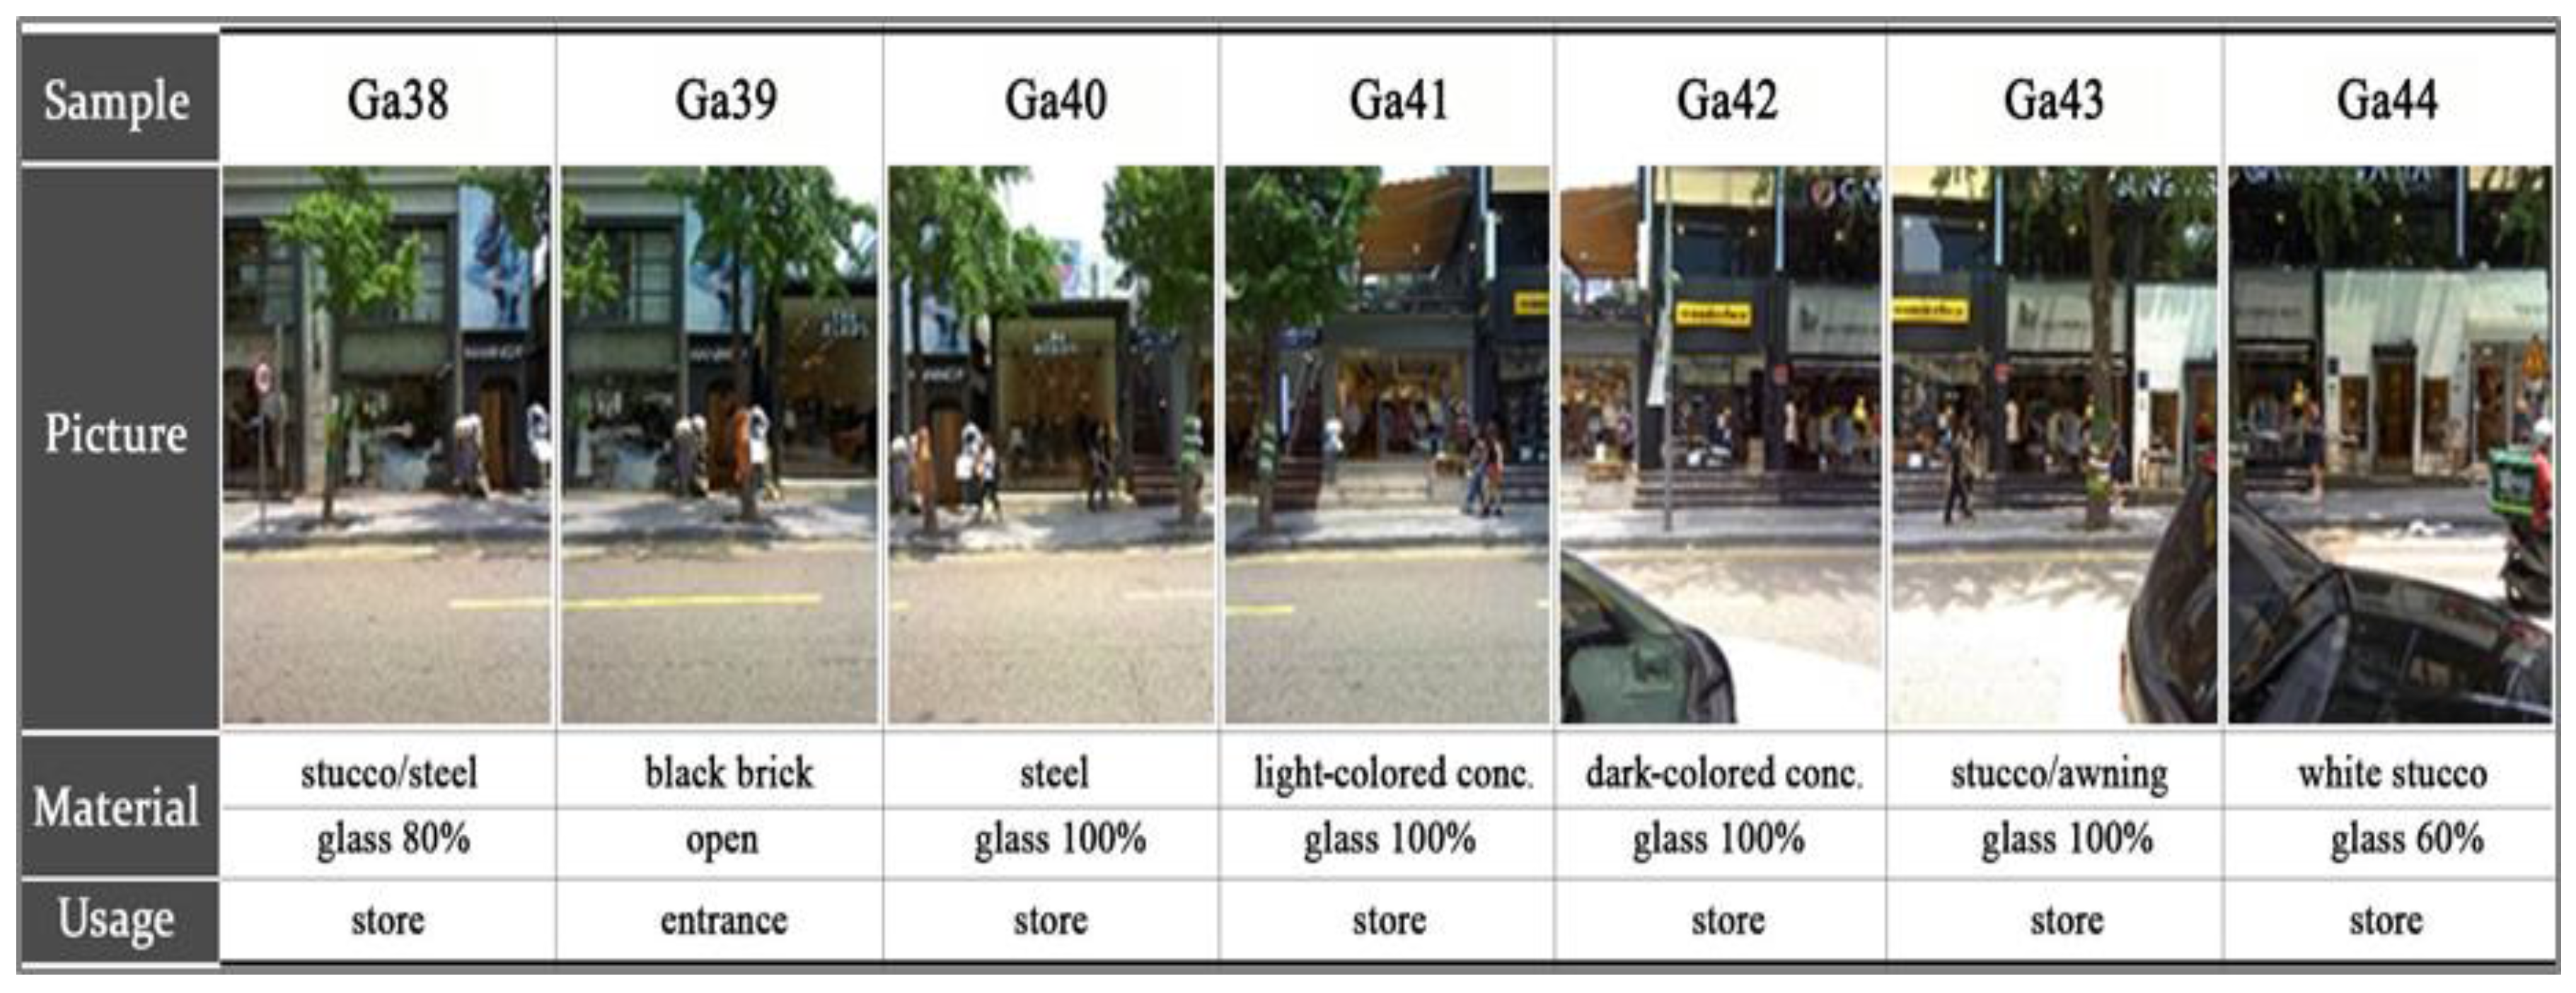
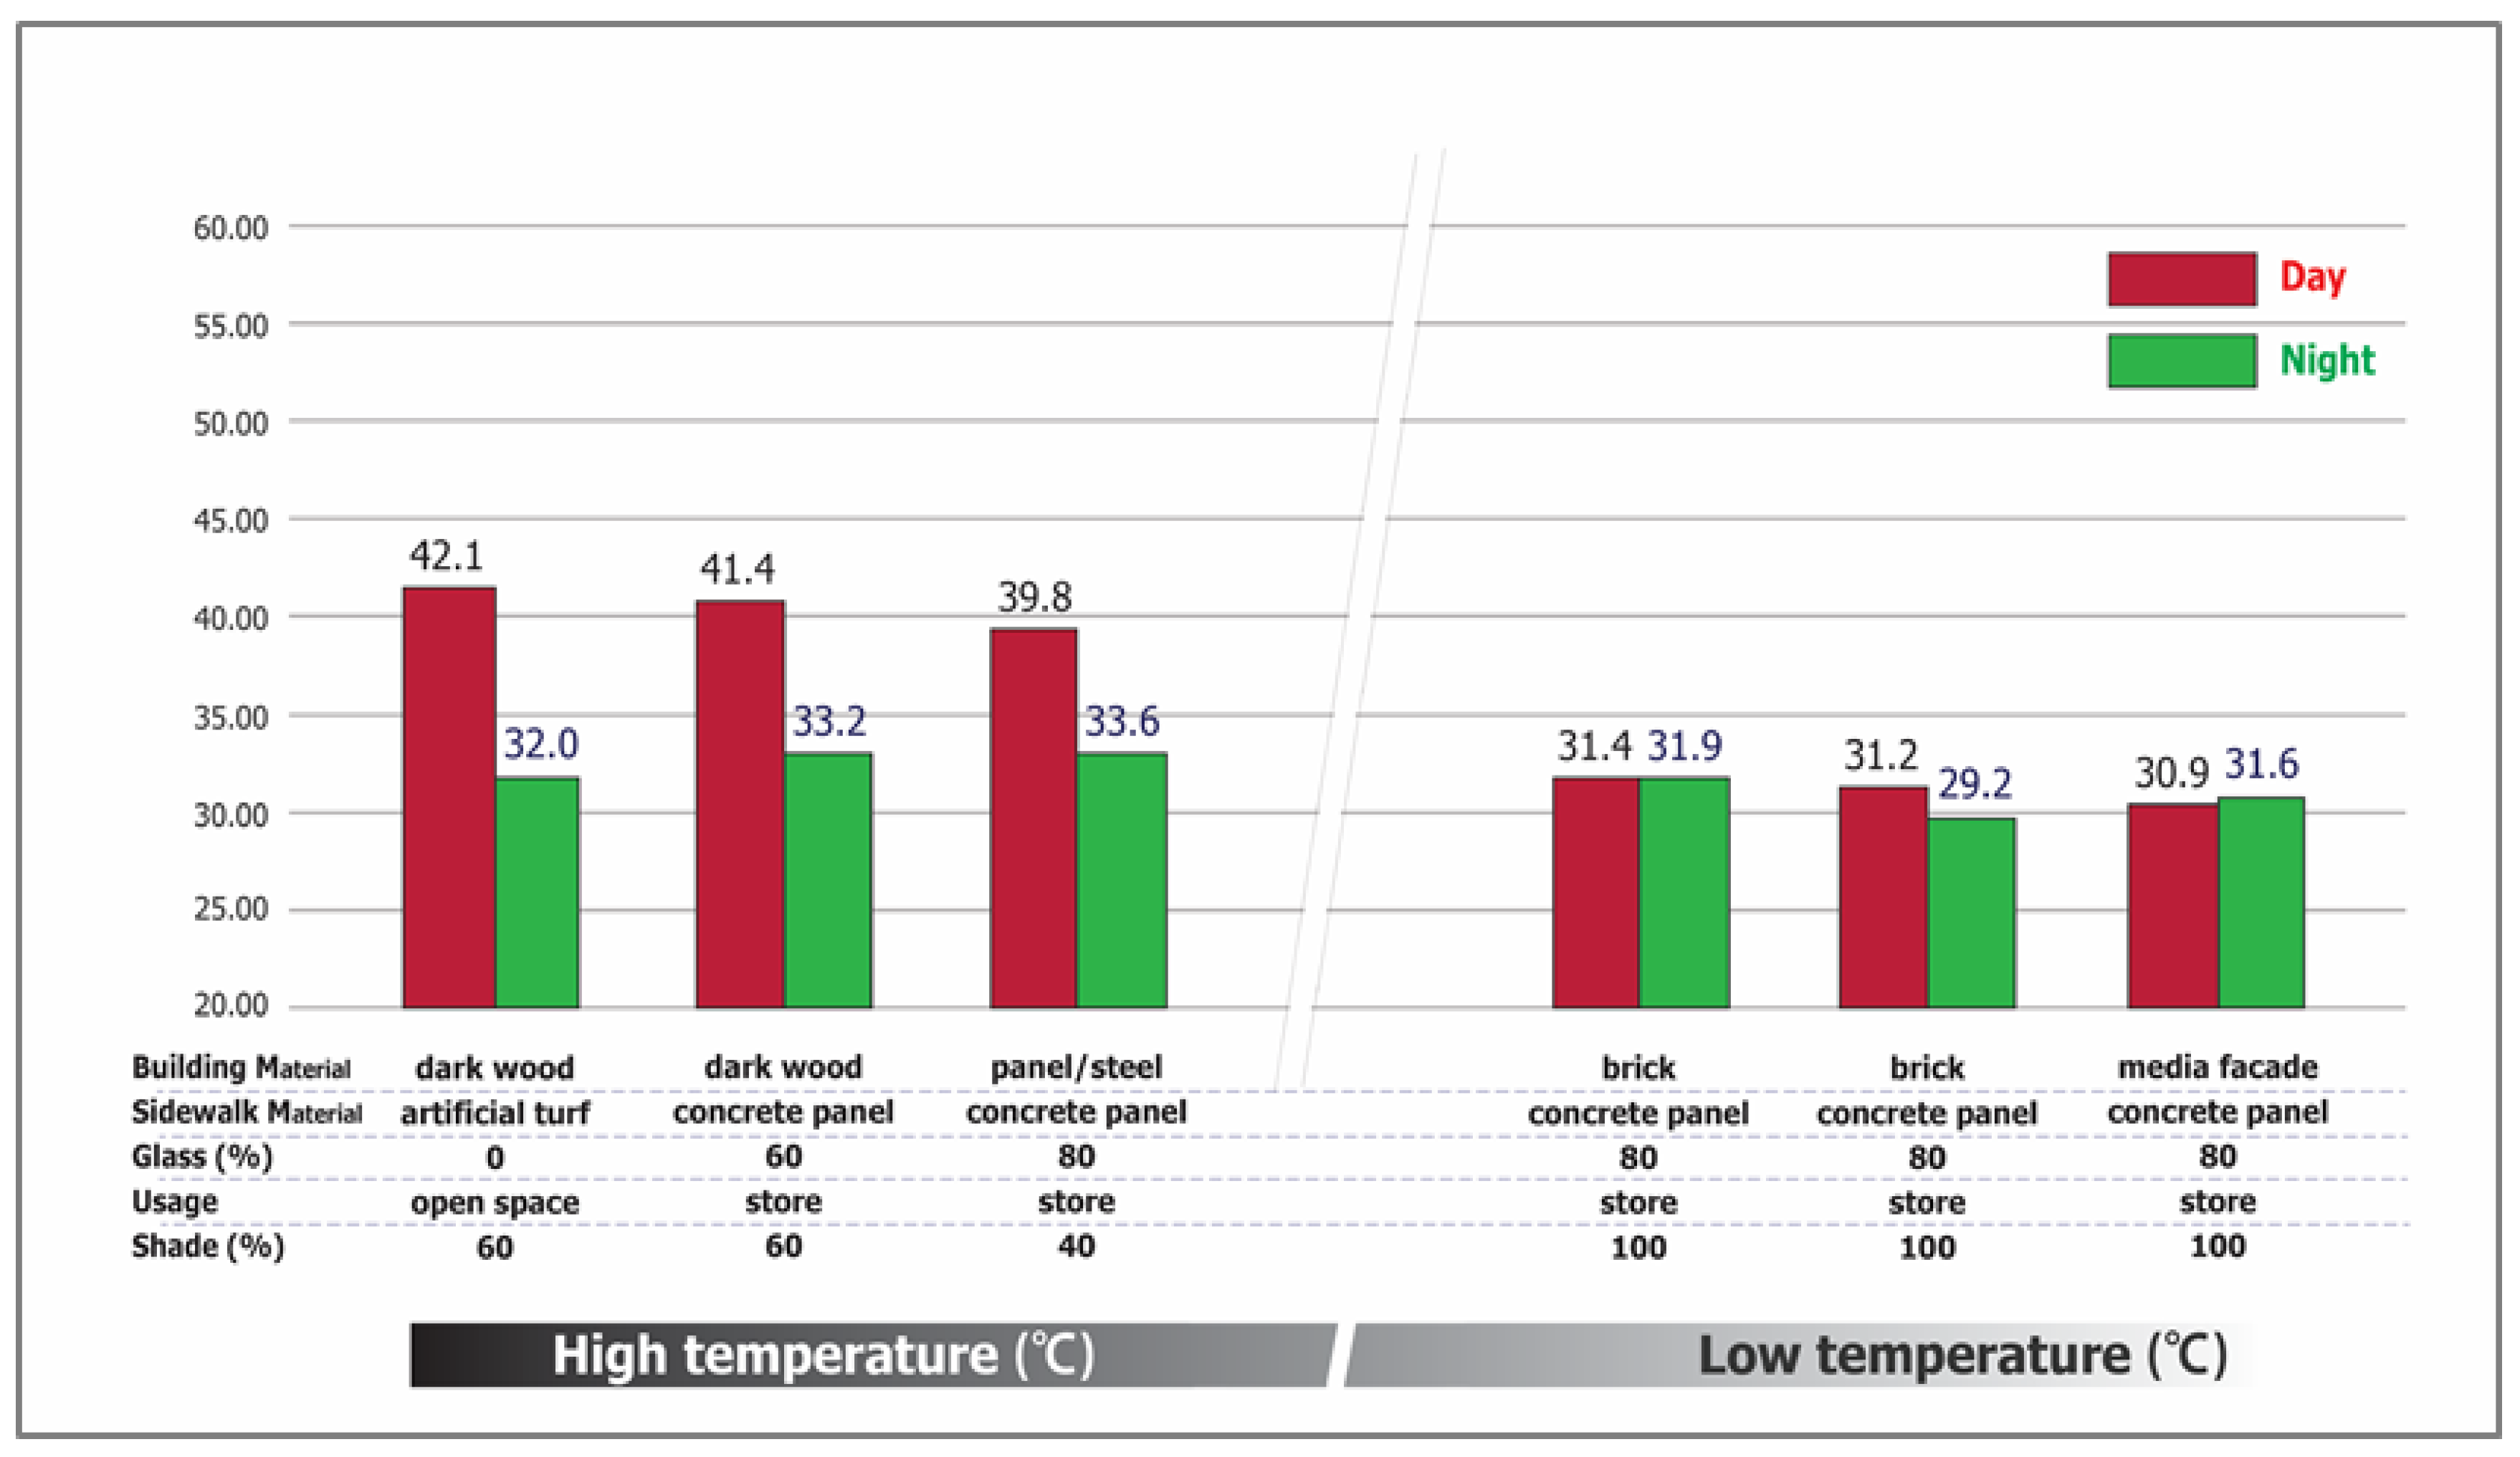
Figure 6. The sample area with the highest temperature (where open spaces and retail shops are most common) has shadow coverage of less than 40% of the road area. Dark-colored building materials, such as metal and artificial turf, cause higher surface temperatures, even though there are open spaces and buildings with glass façades. Unlike open spaces covered with vegetation, artificial turf cannot reduce surface temperatures, and has even higher temperatures in comparison to other elements. In contrast, the sample area with the lowest temperature is fully covered with shade, and buildings with glass façades are most common.
The results of analyzing temperature differences over time are interesting. The sample area with the lowest surface temperature during the day reached the highest surface temperature at night. On the other hand, in the sample area with the highest surface temperature during the day, there was a huge decrease in temperatures measured after sunset. The reason behind this is that street trees capture and store heat during the day, the effects of which are felt at night.
4.3. Analysis of Surface Temperatures on Narosu Road
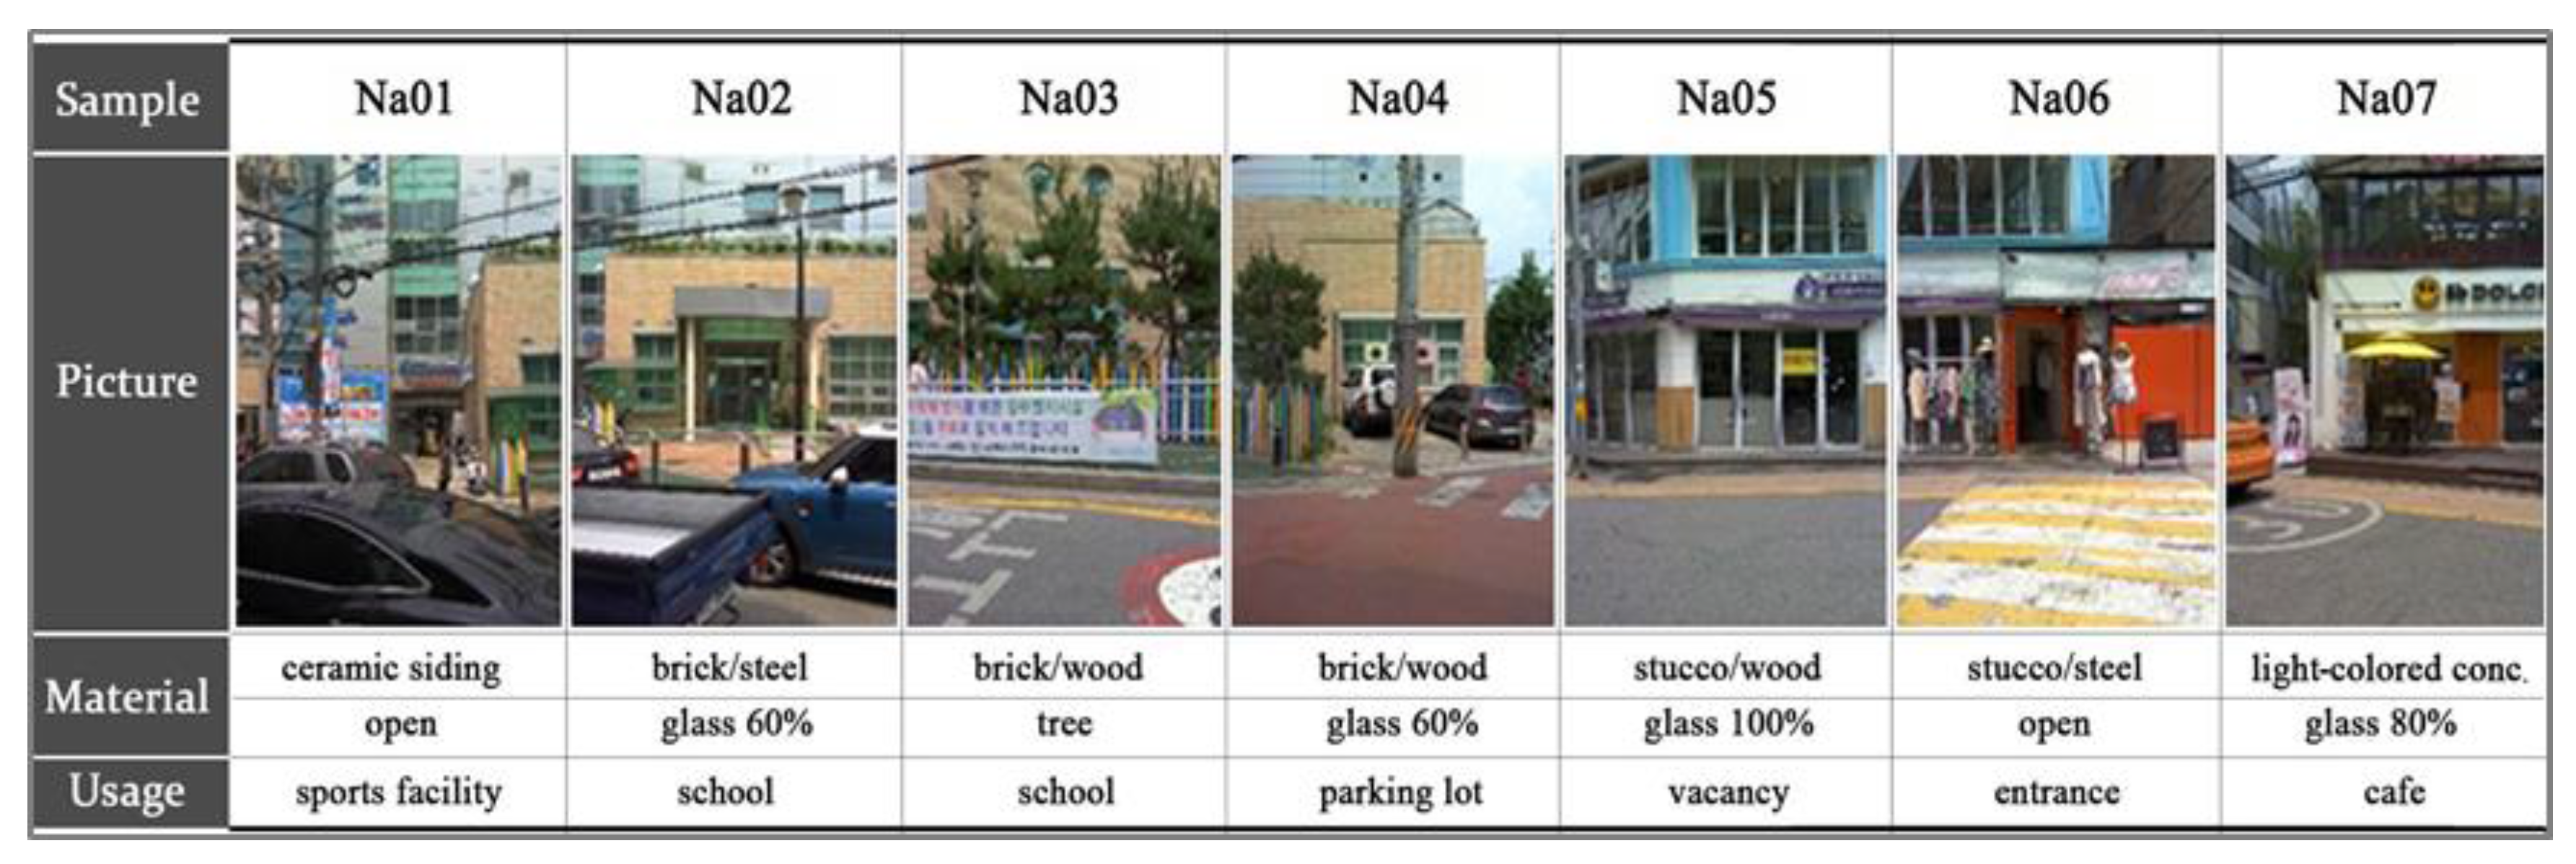
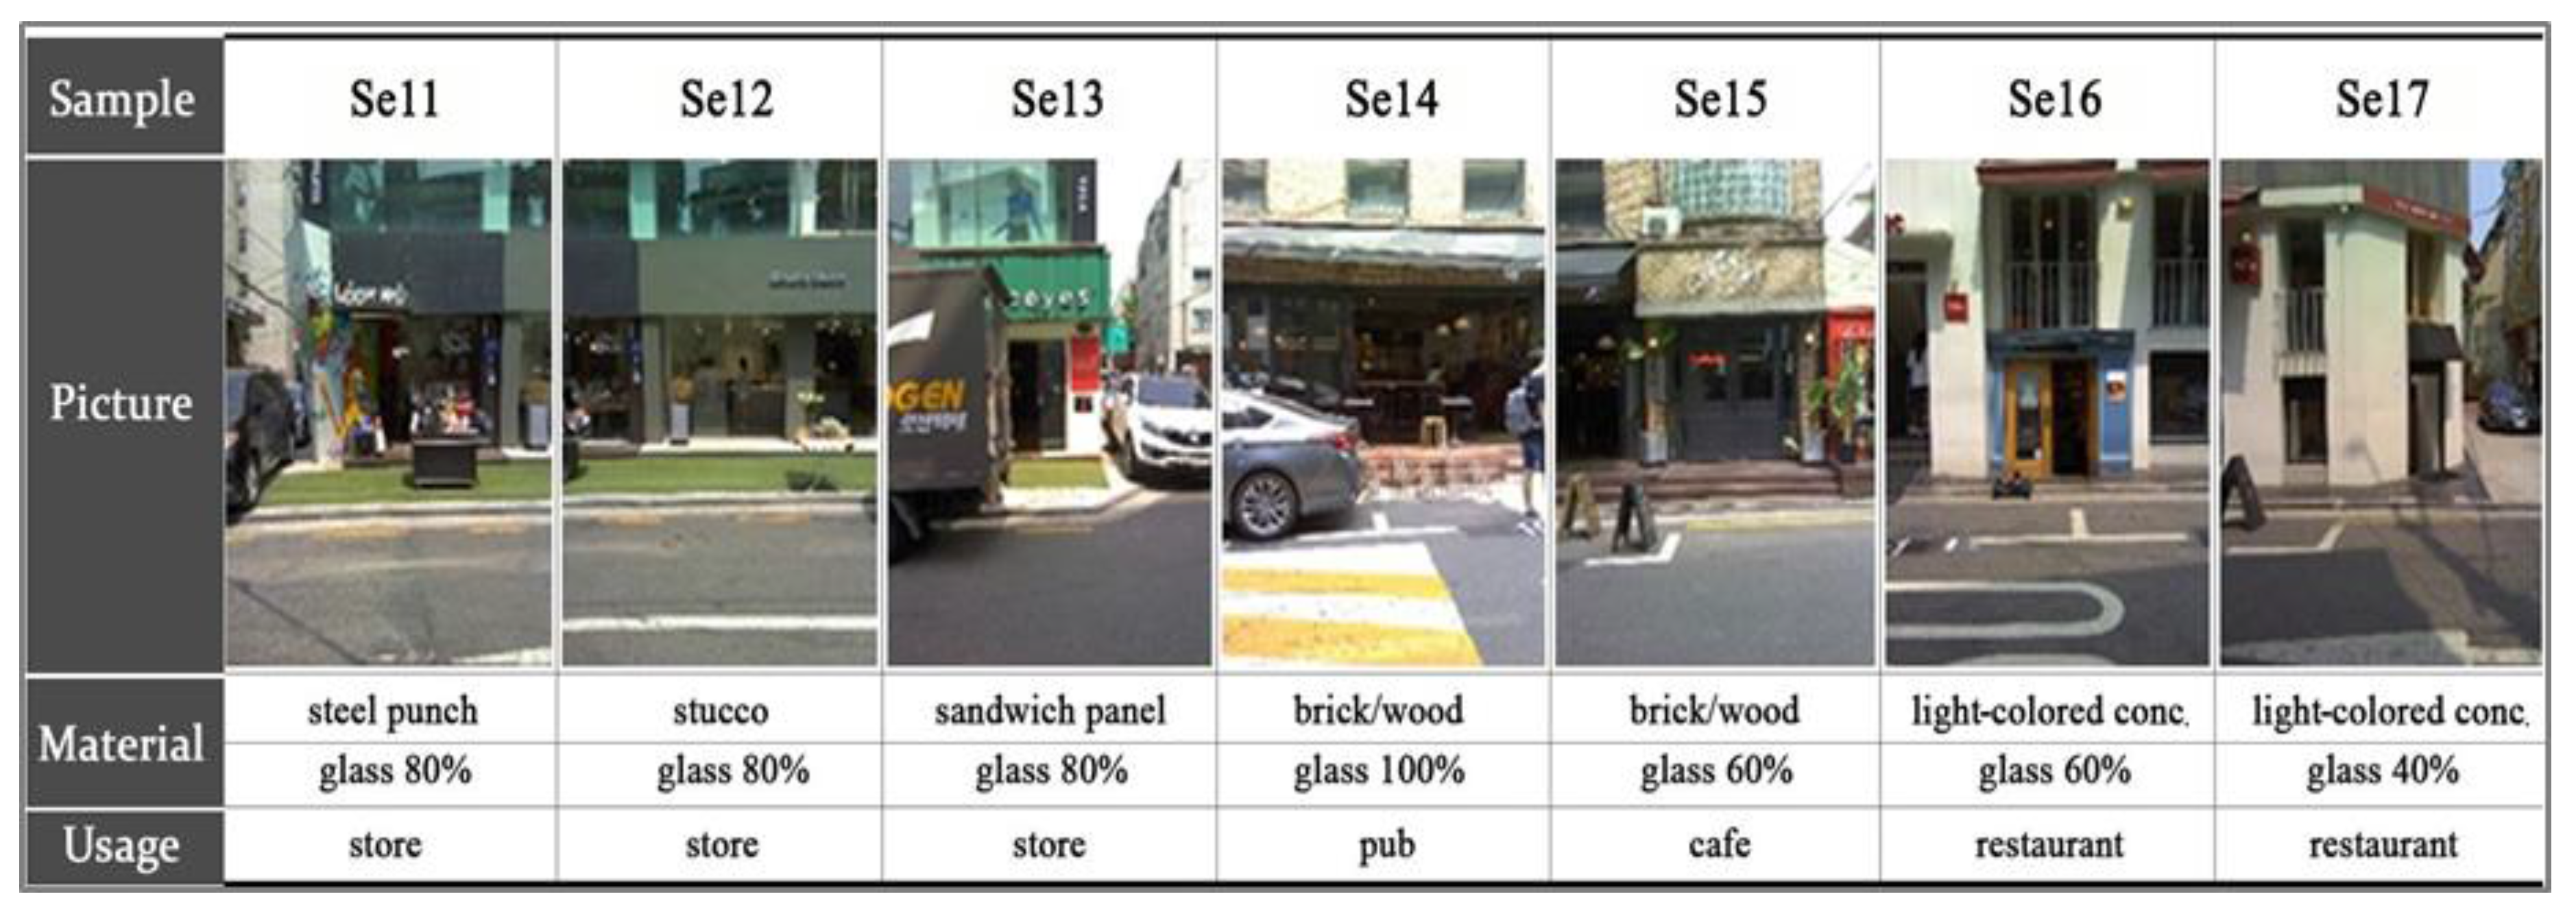
Moderate surface temperatures were measured on Narosu road in comparison to the surface temperatures of Garosu road and Serosu road. Narosu road is a one-lane road with partial vegetation, along which most of the buildings were designated for commercial and residential purposes. There was almost no shadow coverage on Narosu road sidewalks, because of a lack of street trees, even though some other types of vegetation were present. There was less shade on Narosu road than on Garosu road due to this of lack of street trees, but the vegetation that was present near residential buildings did generate shadows. Thirty-three thermal images were taken to fully cover the study area of road, which is 400 m long. The area of study was divided into five different blocks as units of analysis to facilitate our understanding of the thermal environments. The first block was observed to be the hottest, and sample images of the first block are shown in
Figure 7. In the commercial buildings on Narosu road, more than 80% of the building façades were covered with glass. Types of buildings included an elementary school and sports center, which comprised some open spaces for the school playground and/or parking lots for visitors. Wood and stucco were the main materials used for the commercial buildings. For the school and sports center, bricks and ceramic were used. The average surface temperature for the first block was 43.94 °C.
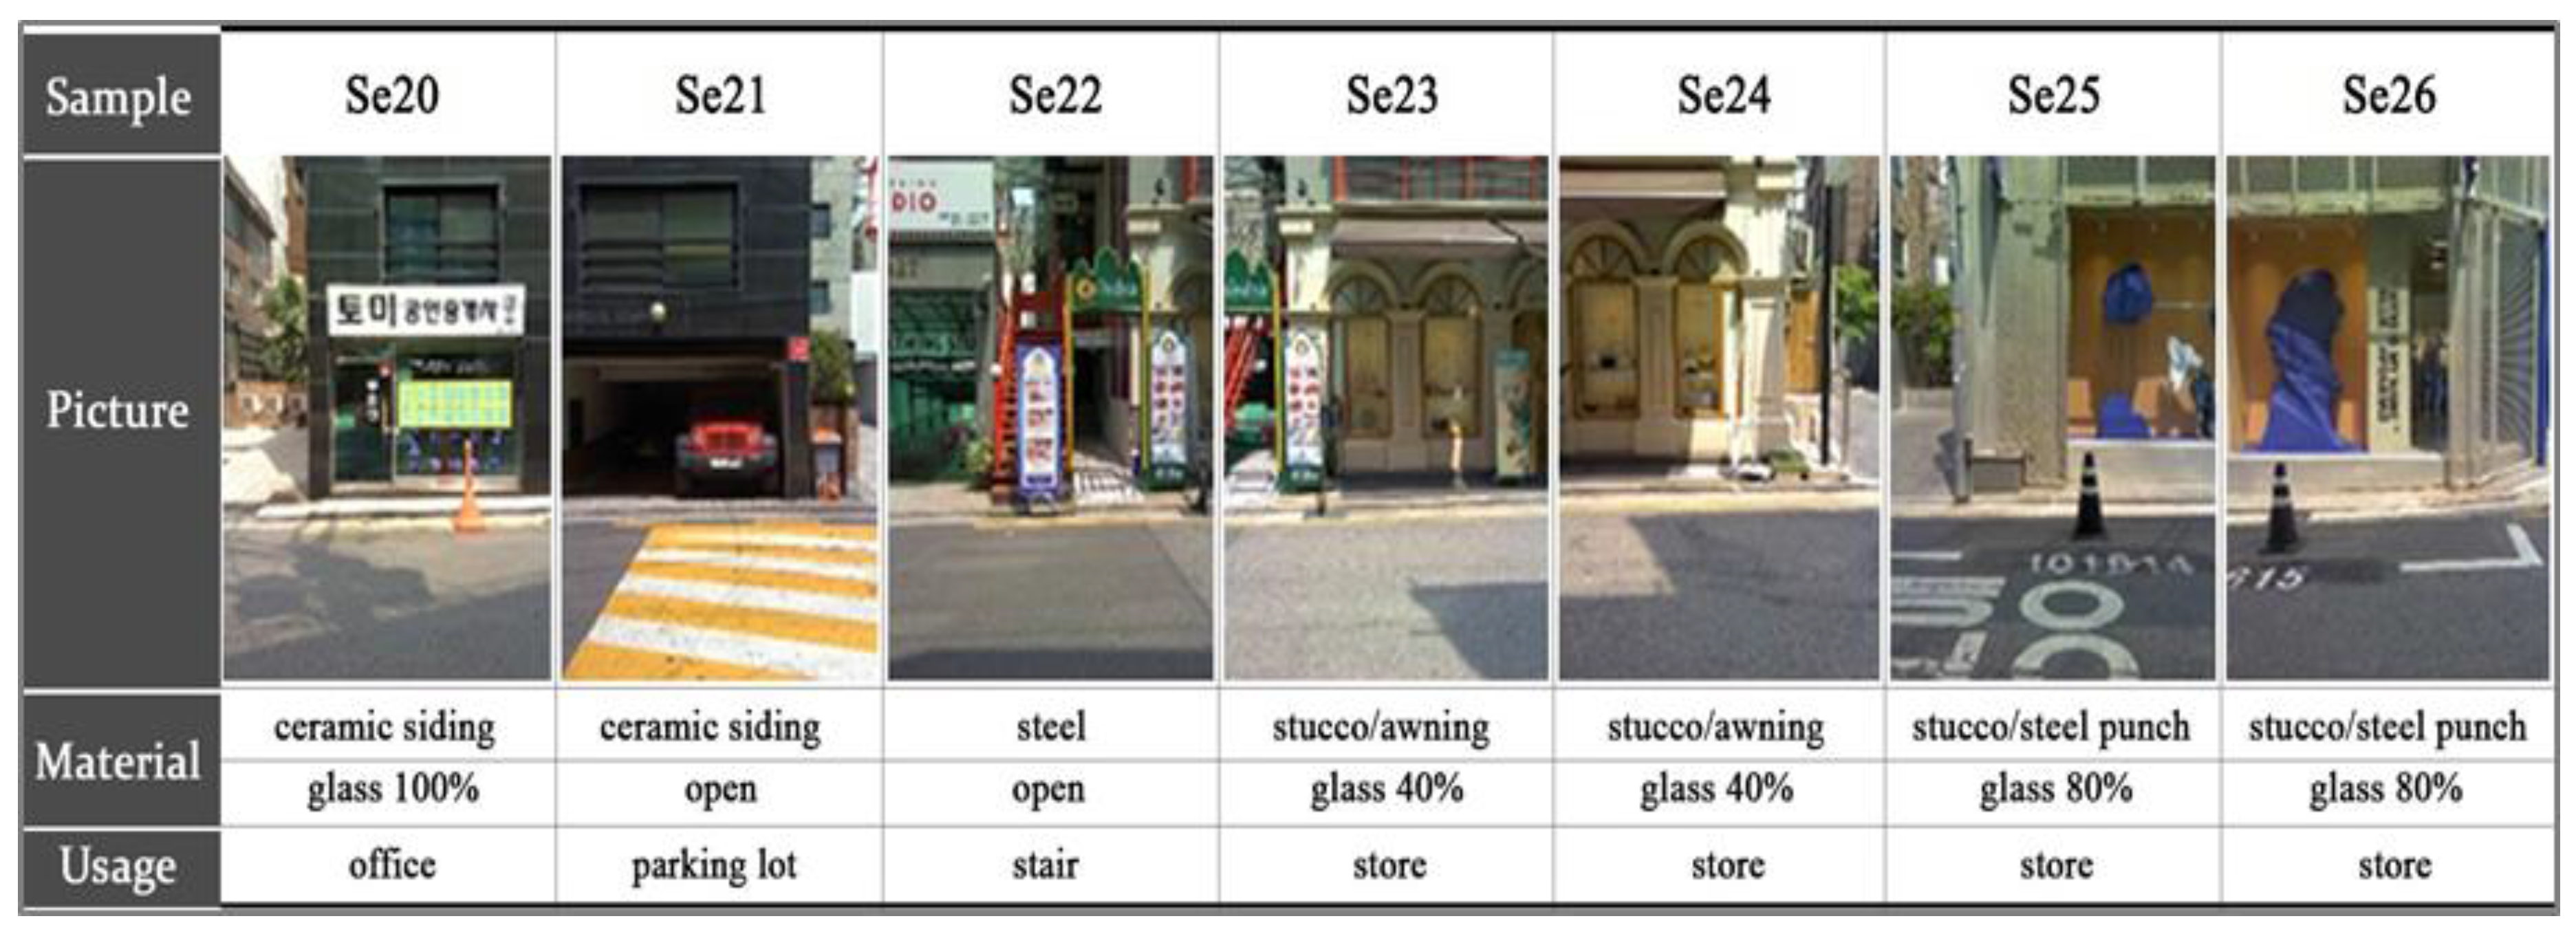
The block with the lowest temperature was the third block, which is shown in
Figure 8. The main types of buildings located at the third block were commercial and residential. In the commercial buildings, more than 60% of the building façades were covered with glass. Vegetation was mainly present around residential buildings. Bricks, stucco, and wood were the main building materials. The average surface temperature was 37.75 °C, which was 6.19 °C lower than that of the hottest block.
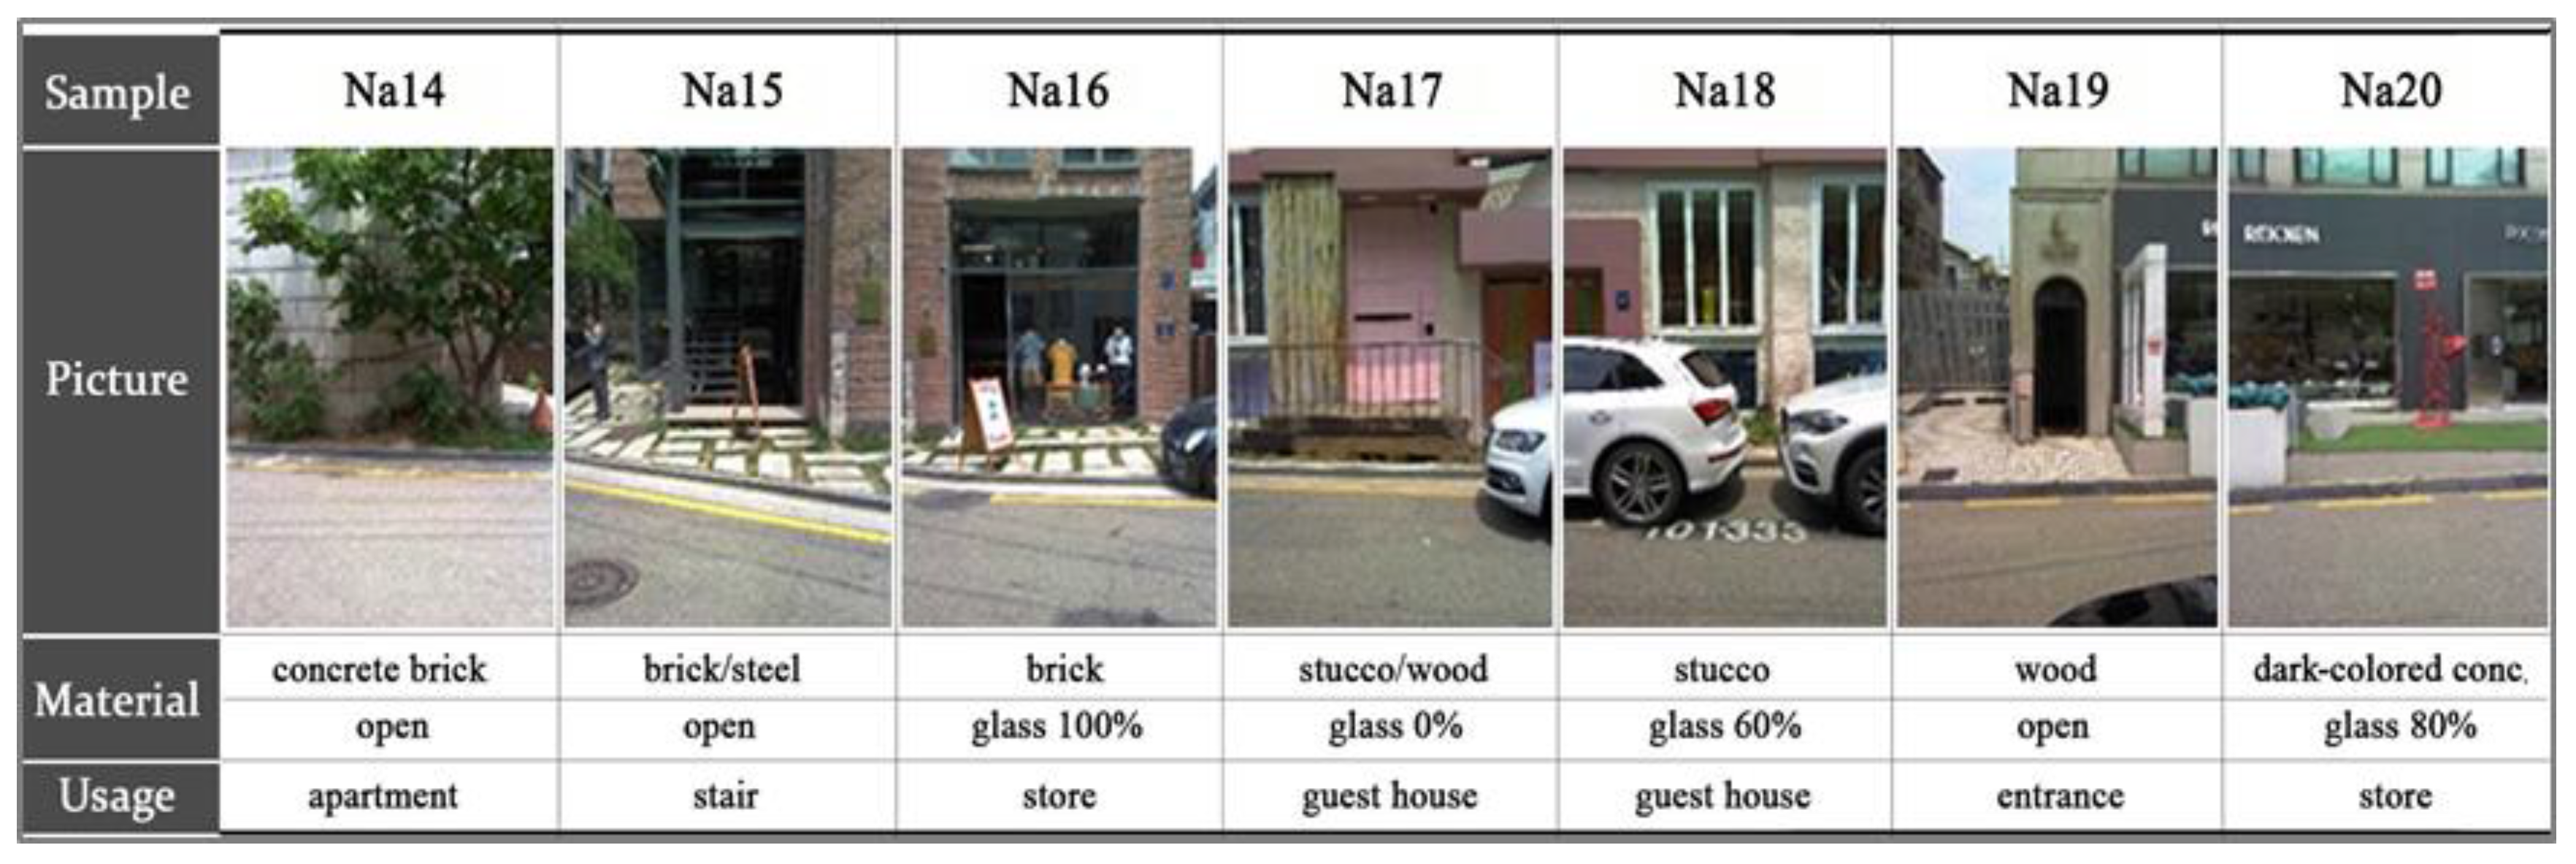
The thermal environments of Narosu road differed based on building use type. The thermal data from the highest and lowest three surface temperatures of the road are shown in
Table 3 and
Table 4. More detailed data of the sidewalk adjacent to the building is also shown in
Figure 9. Since the width of sidewalk in Narosu road was less than 2 m, the sidewalk adjacent to the building and to the road were not analyzed separately. Instead, they were combined and considered as the sidewalk. Commercial buildings with wooden decks were mainly located in the hottest sample area of Narosu road. The surface temperatures of wooden decks were abnormally high during the day. On the other hand, structures with bright-colored bricks and vegetation were observed to have the lowest surface temperatures. At night, the surface temperatures of wooden decks dropped sharply, which caused the hottest sample area during the day to be the coolest sample area during the night. A maximum temperature difference of 32.2 °C was observed on these wooden decks. The minimum temperature difference (1.2 °C) was found in vegetated areas. The temperature differences between night and day (6.4 °C) in structures with bright-colored bricks were not significant.
4.4. Analysis of Surface Temperatures on Serosu Road
Serosu road was observed to have the highest surface temperature among the three roads. There were many parked cars on the street, even though this one-lane road had very few moving vehicles. In addition, a lot of restaurants were located on Serosu road in comparison to the other roads. Unlike Garosu road, a small percentage of the sidewalks were covered with shadows, because there were almost no street trees on Serosu road. Forty-five thermal images were taken to cover the road, which is 350 m long. Similar to the other roads, Serosu road was divided into five blocks as units of analysis to best determine the thermal environments of the road. The second block was observed to have the highest surface temperature, and sample images of the block are shown in
Figure 10. It is a commercial road, containing mostly restaurants. Regarding building façades, 40–100% of building façades were covered with glass. Various building materials, such as bricks, painted panels, and other materials were applied to buildings located on Serosu road. The average surface temperature of the second block was 55.42 °C.
The block with the lowest temperature was the third block, as shown in
Figure 11. Serosu road is a commercial road, and more than 80% of building façades were covered with glass. There were parking lots under the piloti, which generated shaded areas. Ceramics and stucco were the main building materials. Several buildings with awnings cast shadows on the sidewalk. The average surface temperature of the sidewalk was 38.48 °C, which is 16.94 °C lower than that of the hottest block.
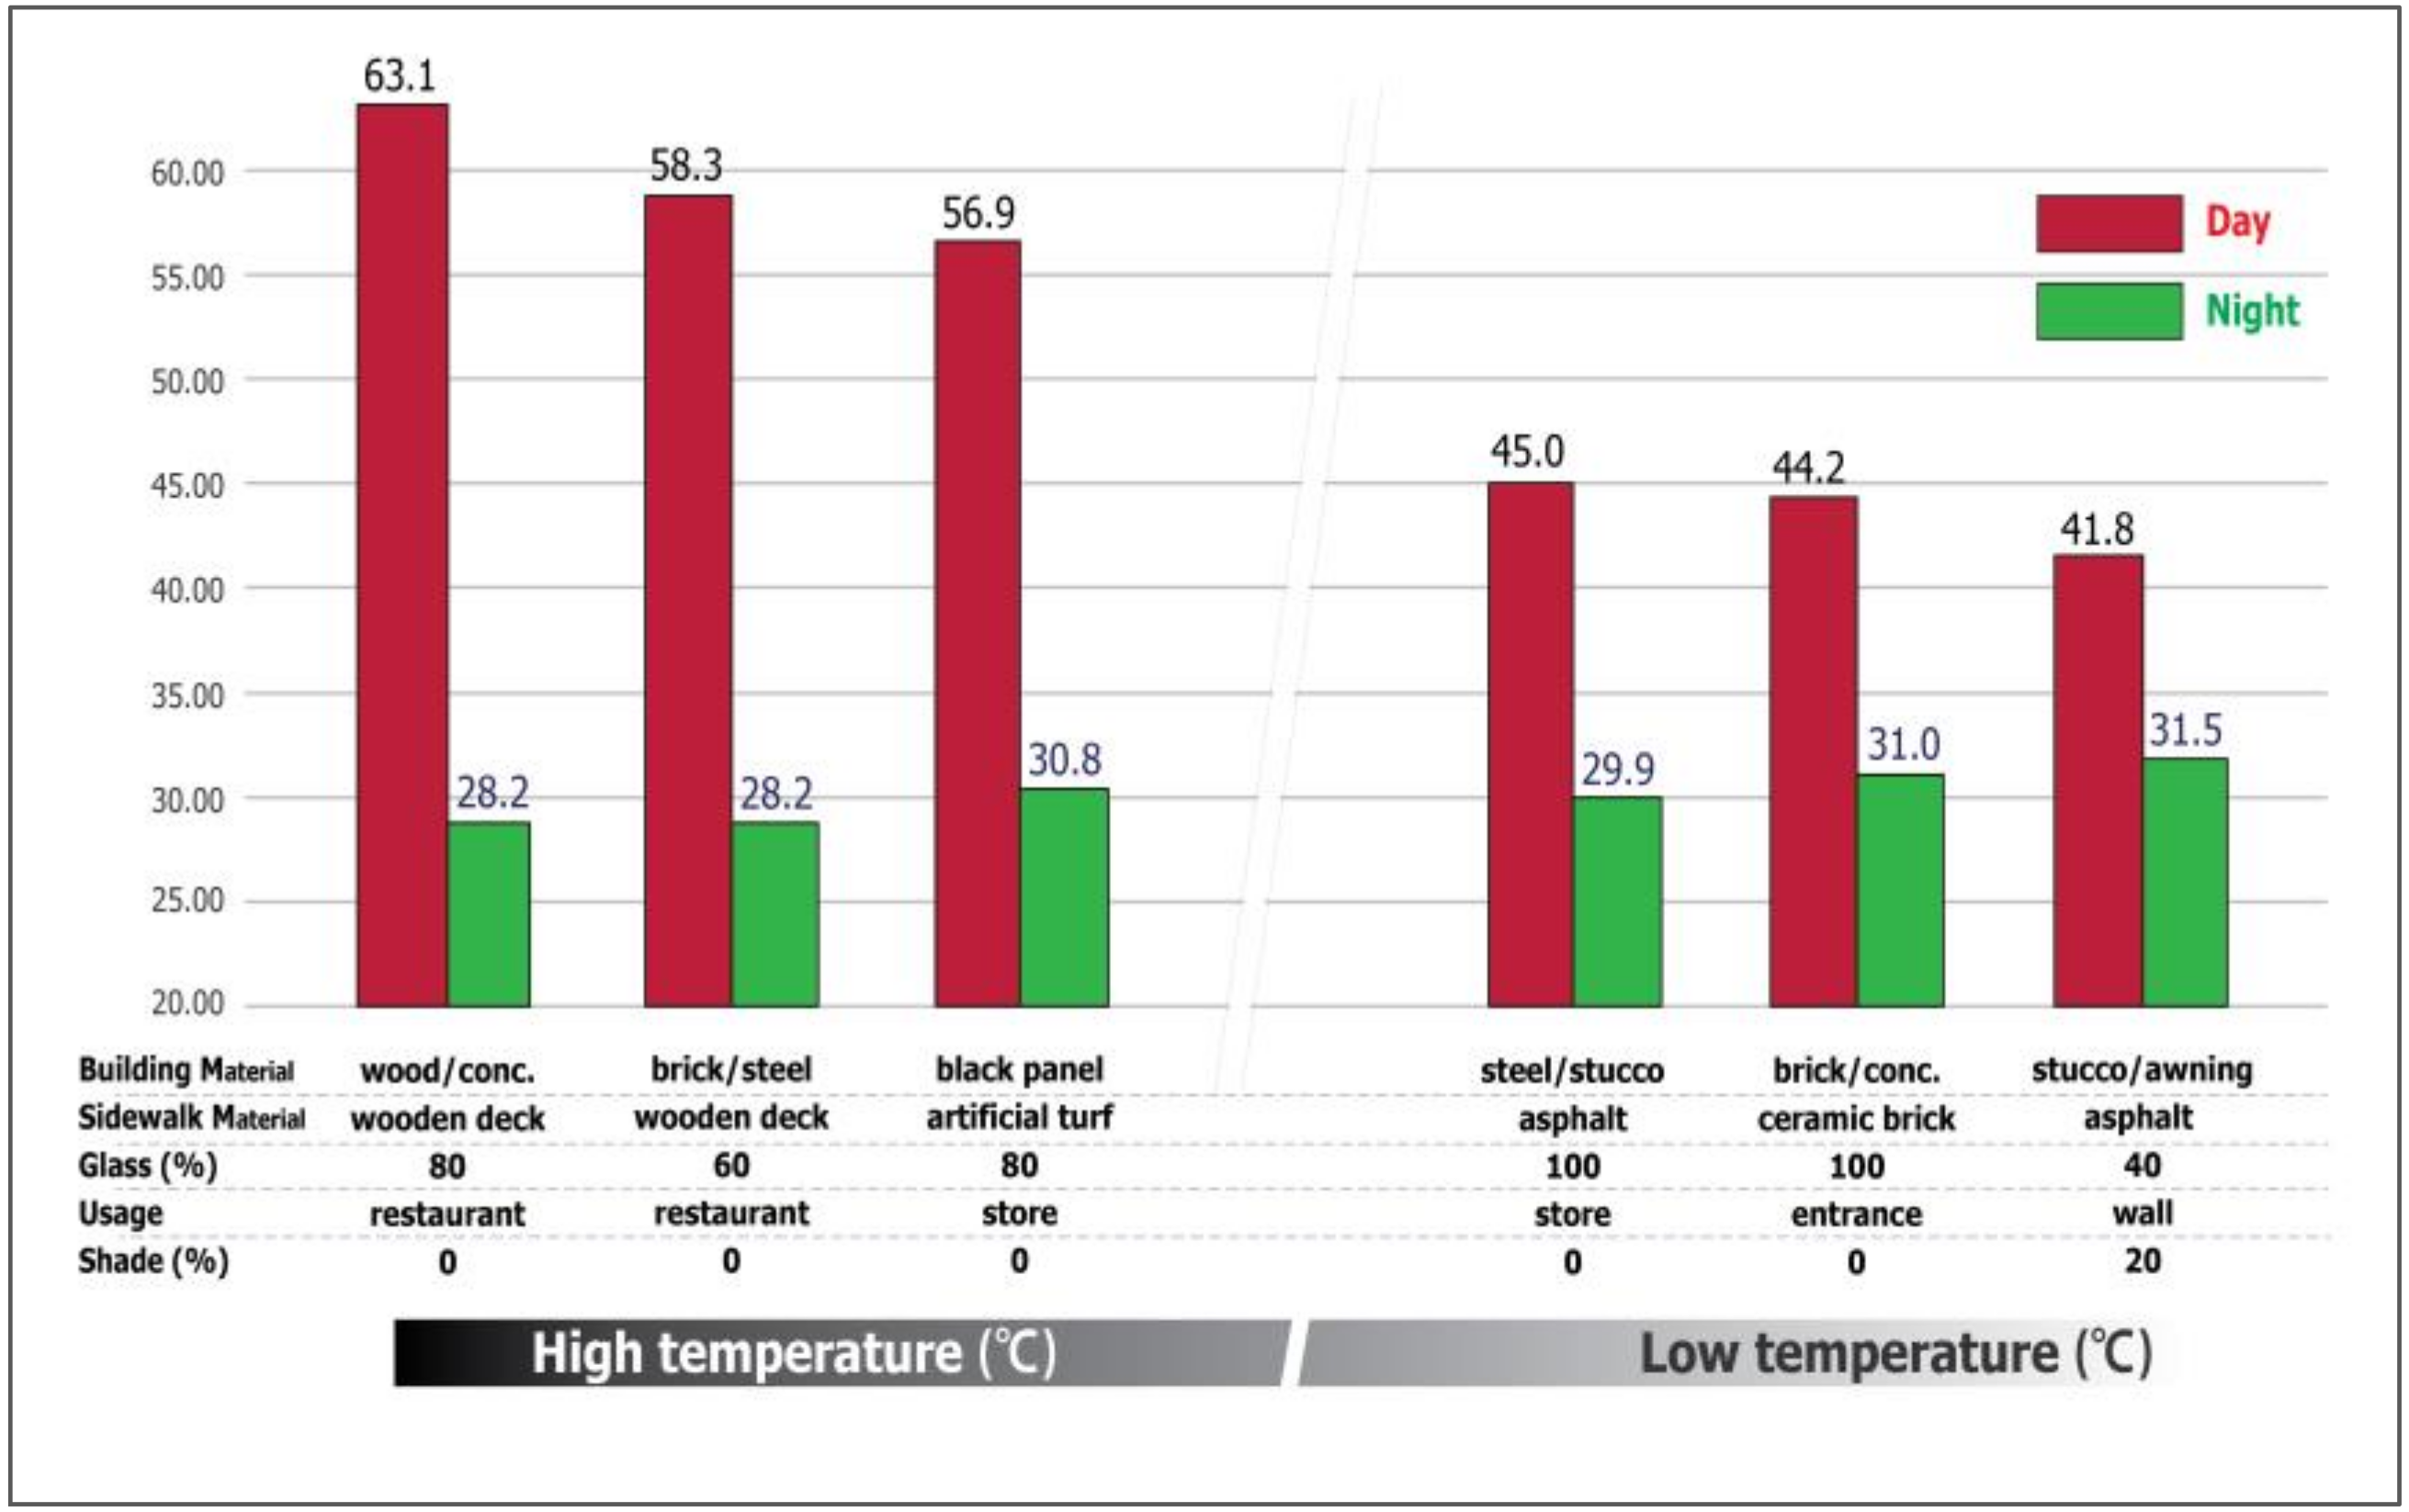
We analyzed the thermal environments of each road based on building use type. Data from the highest and lowest three surface temperatures of Serosu road are shown in
Table 5 and
Table 6. More detailed data of the sidewalk adjacent to the building is also shown in
Figure 12. Since the width of the sidewalk on Serosu road was less than 2 m, the sidewalk adjacent to the building and the road were not analyzed separately. Instead, they were combined and considered as the sidewalk. Restaurants and retail shops were located in the sample area with the highest temperature on Serosu road. Even though a large percentage of the façades of those buildings was covered with glass, dark-colored building materials and metal were also seen. Wooden decks and artificial turf, which negatively affect thermal environments, were located adjacent to the buildings. On the other hand, buildings located in the sample area with the lowest temperature were either fully covered with glass or generated shading effects via awnings. At night, the surface temperatures of wooden decks and artificial turf dropped dramatically. The maximum temperature differences observed over time in wooden decks and artificial turf were 26.1 °C and 34.9 °C, respectively. The minimum temperature difference over time, which is only 10.3 °C, was measured under an awning.
4.5. Comparison of the Factors Influencing Temperature on the Three Streets
To compare the effects of each material on the thermal environments of each street, factors observed from the highest and lowest three surface temperatures are shown in
Table 7. On Garosu road, street trees had the dominant influence on surface temperatures. Since trees can be used to block direct sunlight during the day and cast shadows to lower surface temperatures, trees should be planted at the right spot in the distance along the street. Regarding building materials, glass was observed to have the lowest surface temperatures, followed by bright-colored building materials. On the other hand, dark-colored building materials, such as steel or black bricks, were observed to have the highest surface temperatures. The highest surface temperatures of dark-colored building materials were due to the low albedo values or low emissivity values of dark building materials. Building materials with low emissivity values emitted only a small amount of thermal radiation, and ultimately reduced heat loss by convection [
33]. Sidewalks with wooden decks or artificial turf were shown to have the highest surface temperatures, and these results are in accordance with previous studies [
34].
5. Conclusions
This study analyzed the thermal characteristics of three different commercial streets using thermal imaging cameras. The findings indicated that the shading effects of street trees play a critical role in lowering surface temperatures during the daytime. Other factors (e.g., the albedo and emittance values of building materials, building use types) also affect street surface temperatures. High albedo and emittance contribute to lowering the surface temperatures of materials. Regarding building use types, this study identified that surface temperature was relatively high near restaurant buildings. This finding indicated that the emission of a huge amount of anthropogenic heat causes higher surface temperatures near restaurants.
Hence, it is necessary to consider the effects of various factors on thermal characteristics of urban street elements. More specifically, based on the findings of this study, in order to create better thermal environments of urban streets for pedestrians, shading effects from street trees should be optimized, construction materials with high albedo values or high emittance (especially at lower levels of buildings) should be used, and vegetated areas should be sought instead of artificial turf or wooden decks. These strategies should be considered primarily in urban areas where pedestrians are exposed to extreme heat stress.
A comparative case study with three different urban streets is implemented in the current research. Since limited urban street elements affecting urban thermal environments are found in the areas of study herein, expanding and conducting this study elsewhere to obtain more reliable information about the effects of certain urban elements is required. The results of the current study suggest several policy implications to improve the thermal environments of urban streets in the summer, and these findings can be used in the preliminary stages of further studies.


