Perceptions, Preferences, and Behavior Regarding Energy and Environmental Costs: The Case of Montreal Transport Users

Abstract
:1. Introduction
1.1. Perception of Travel-Related Fuel and Environmental Costs
1.2. System Design Preferences
1.3. Travel Information Systems’ Influence on Travel Behavior
1.4. Willingness to Pay for the Information
2. Materials and Methods
3. Results and Discussion
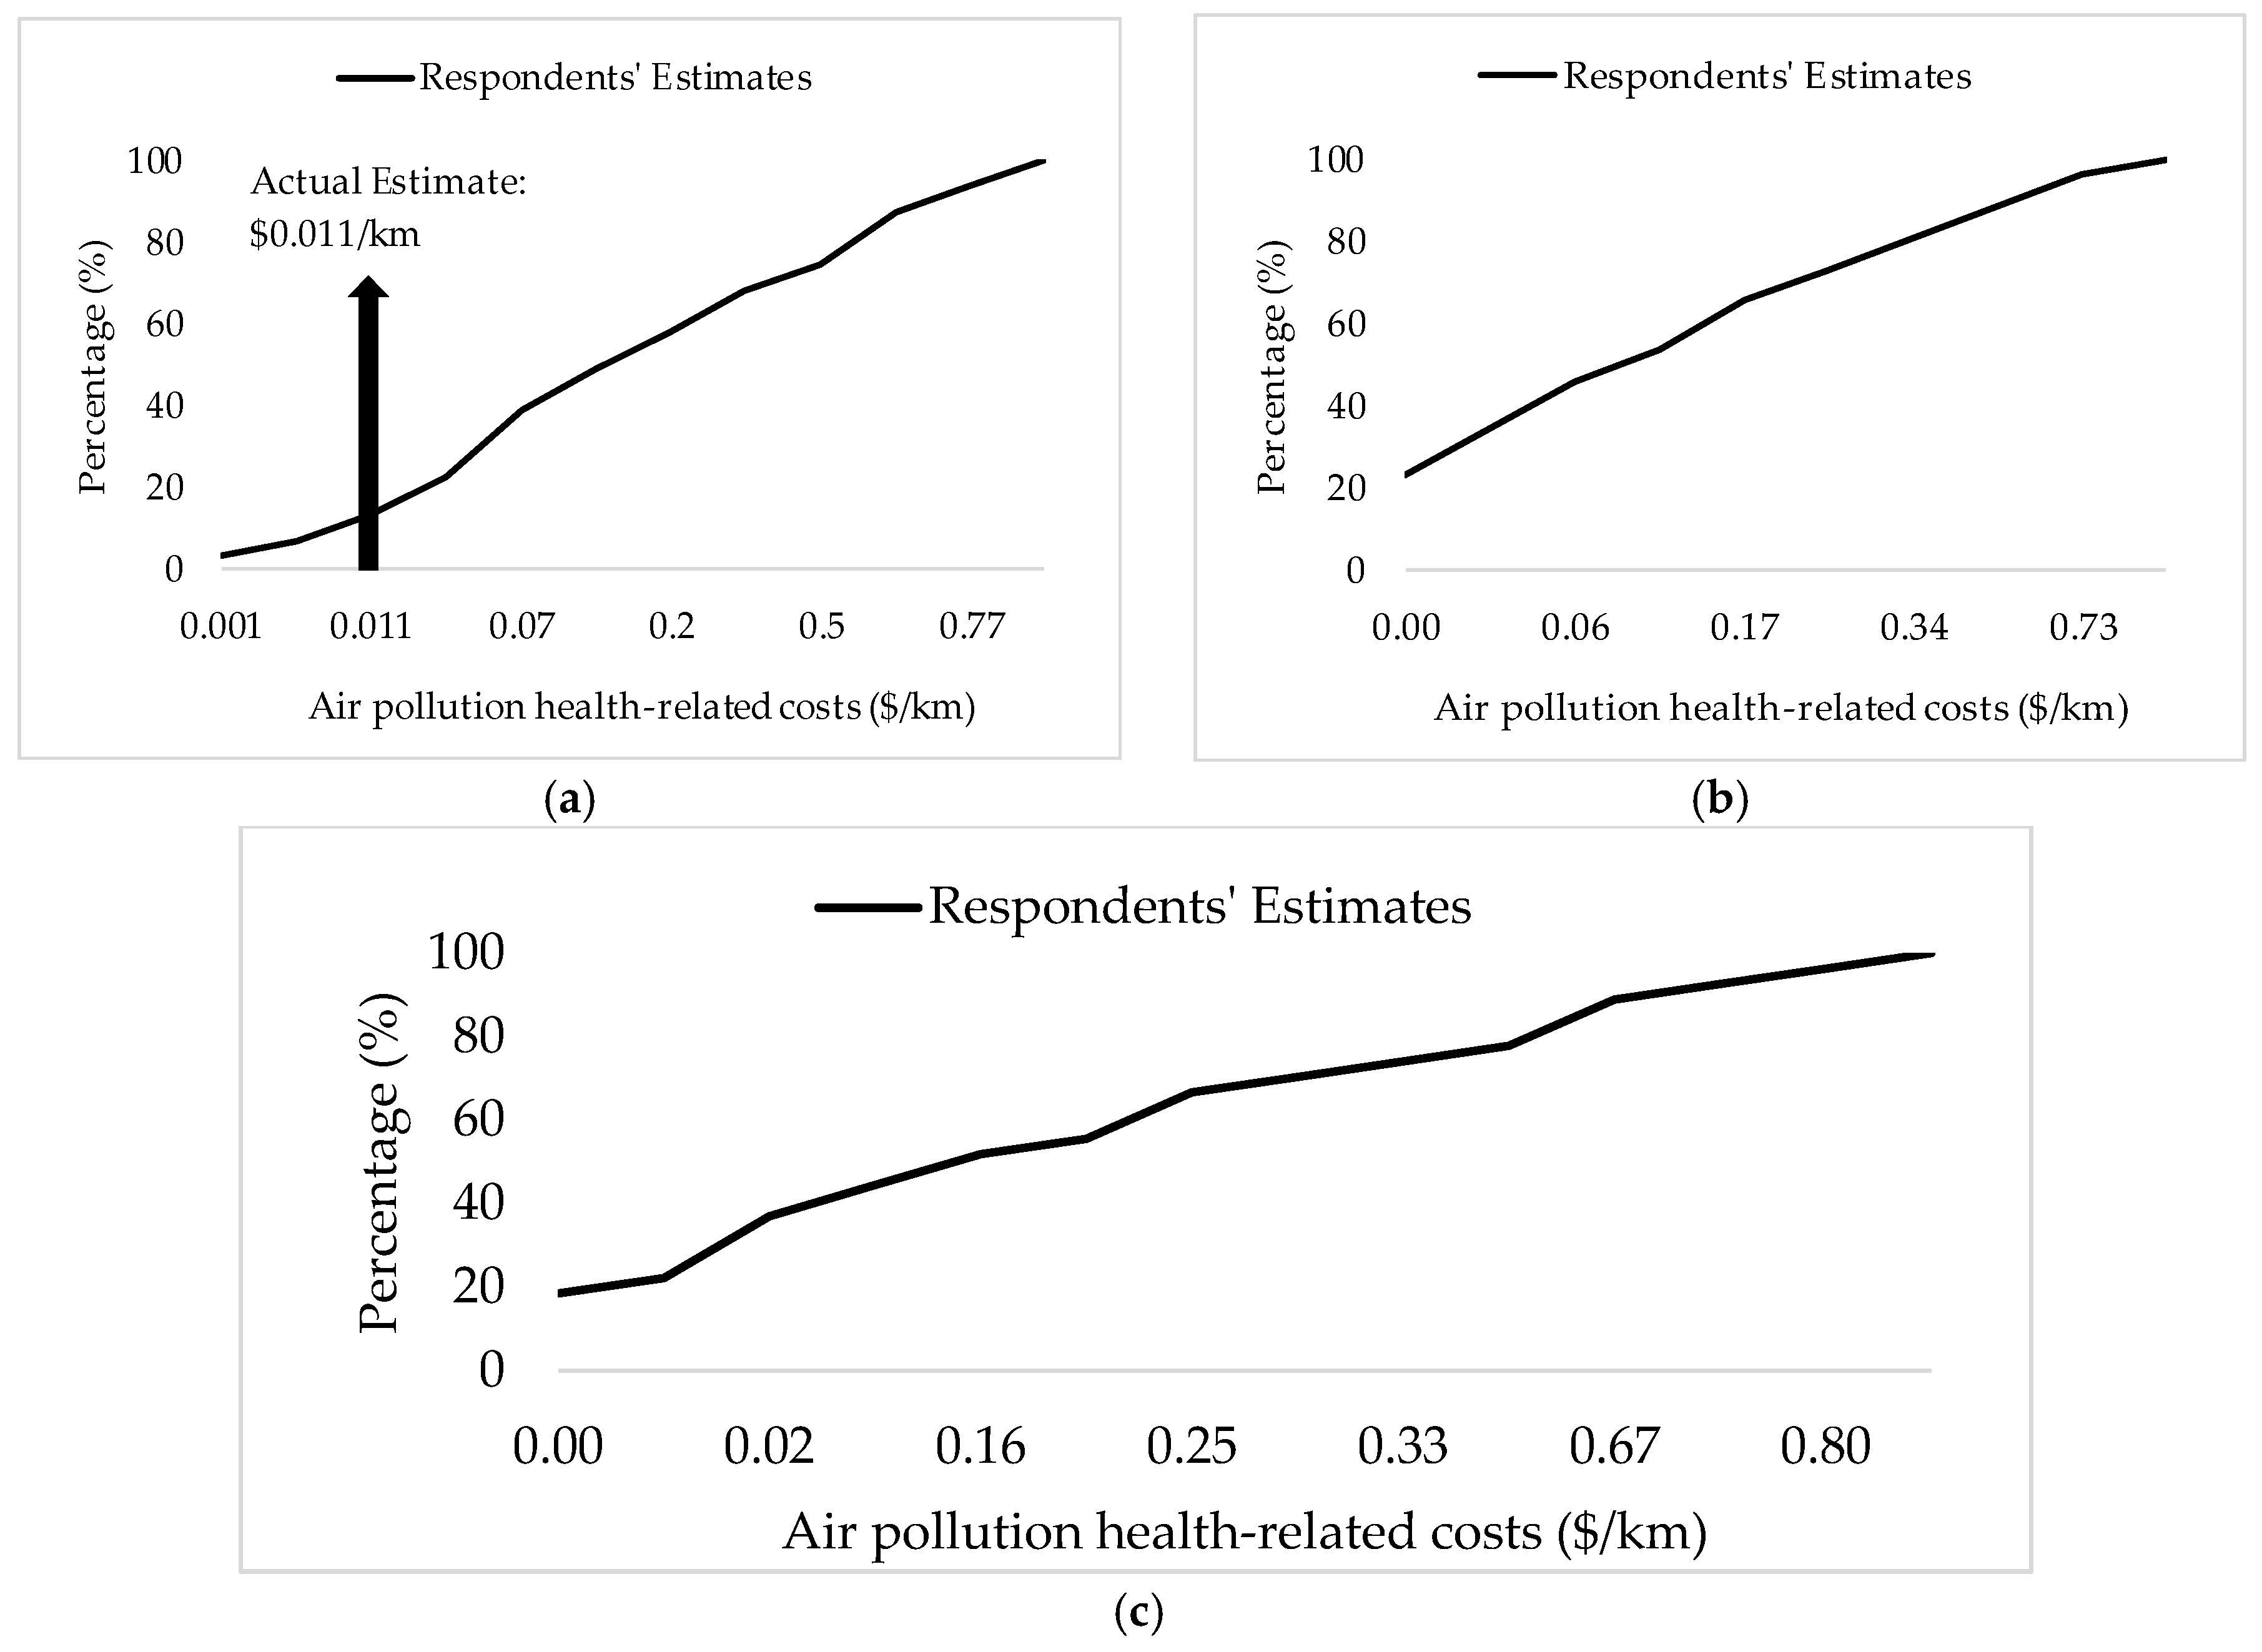
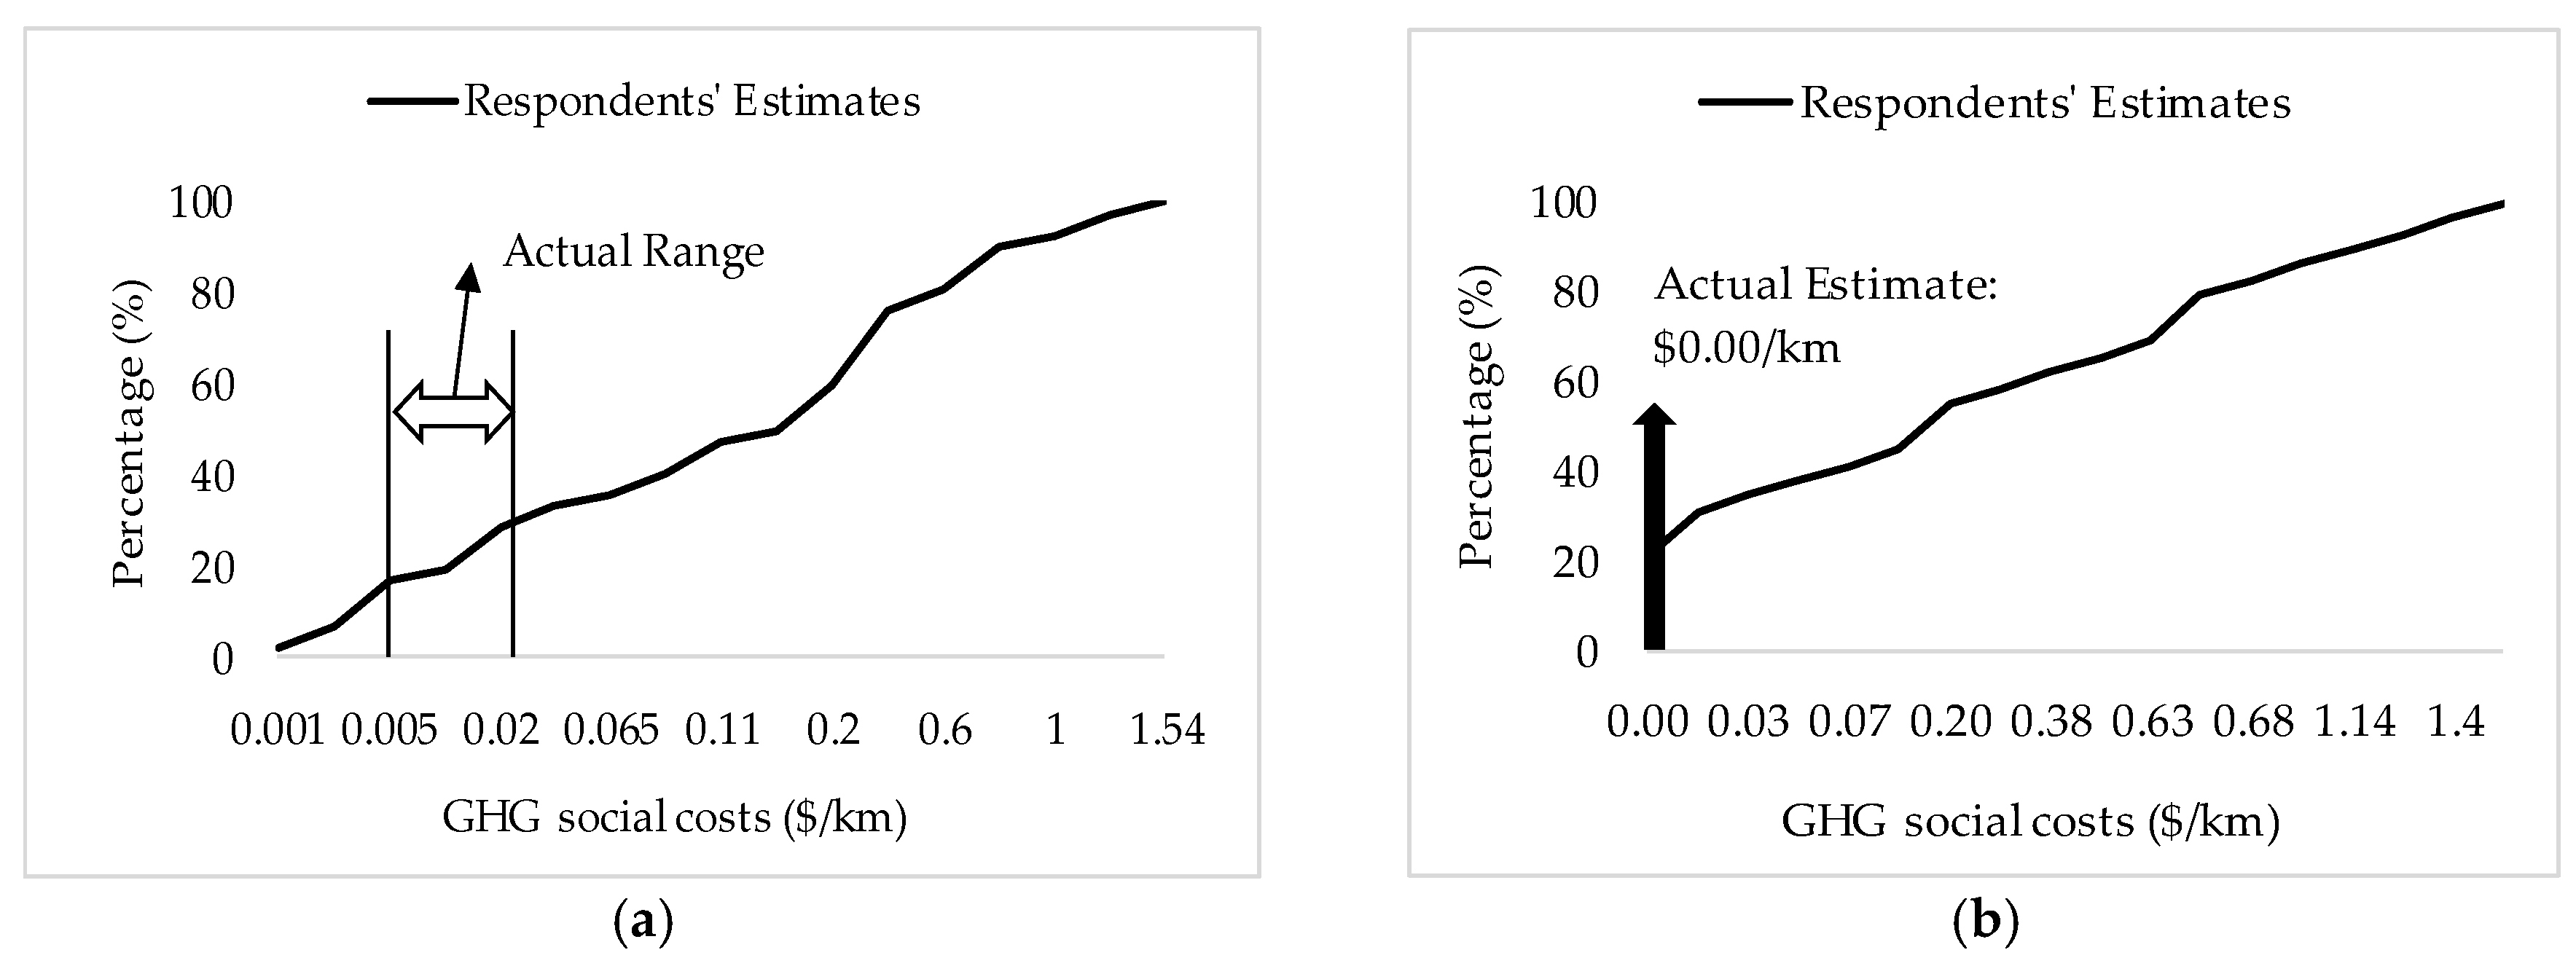
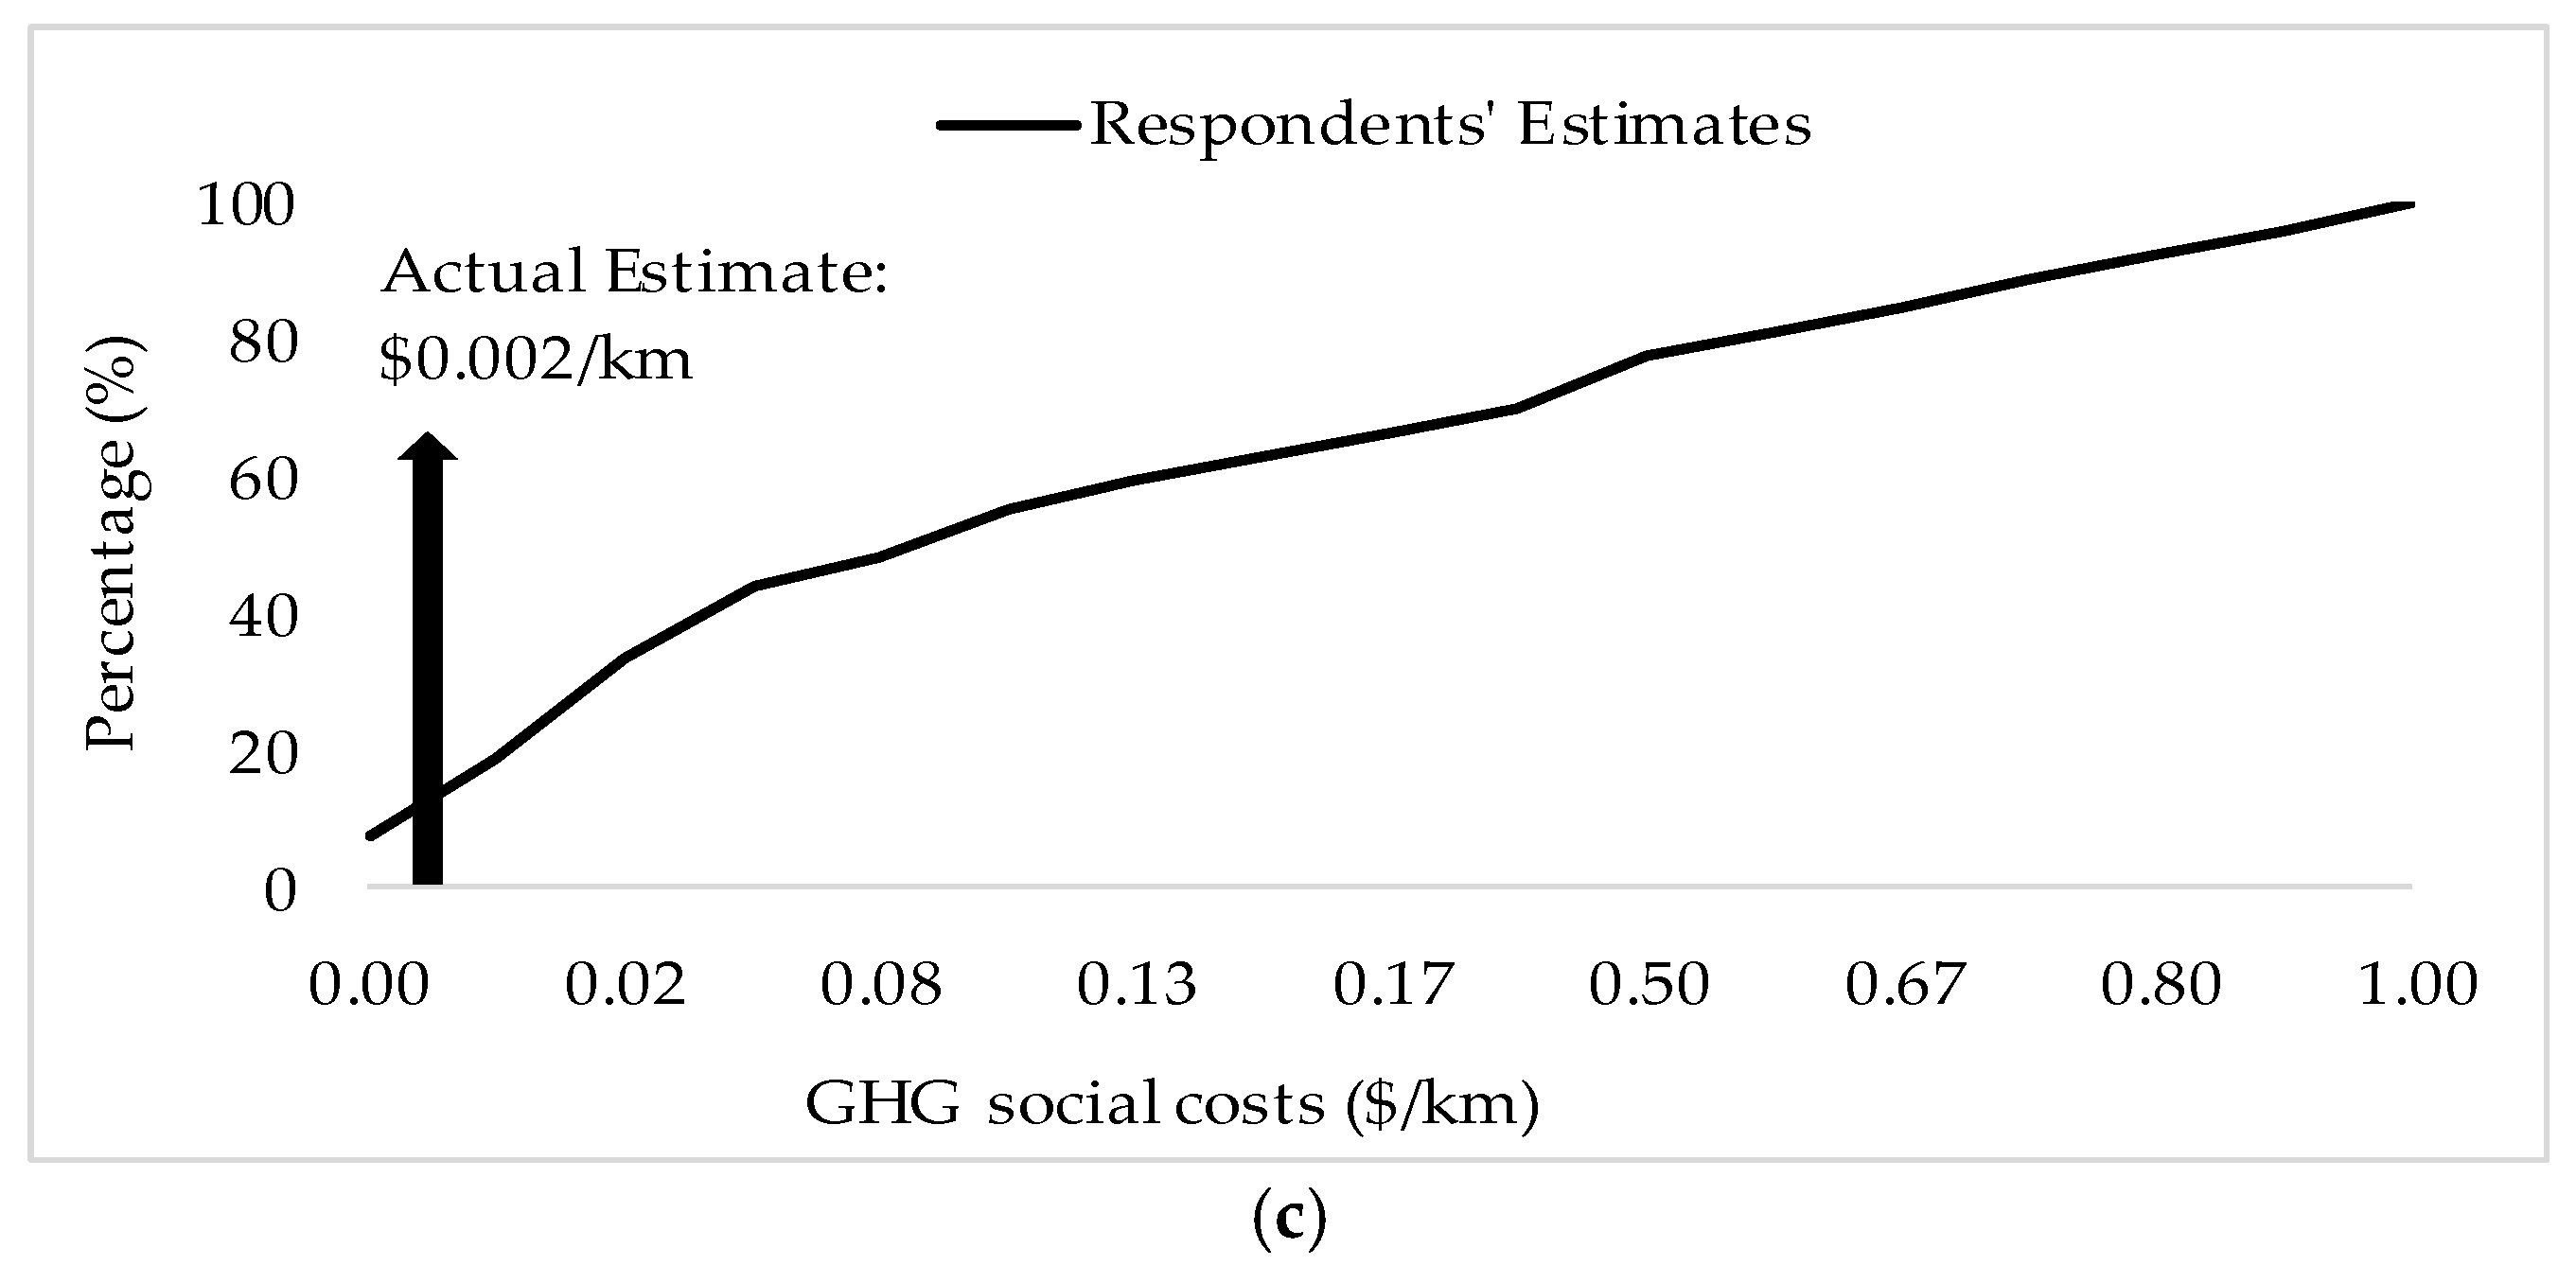
3.1. Perception of Travel-Related Fuel and Environmental Costs
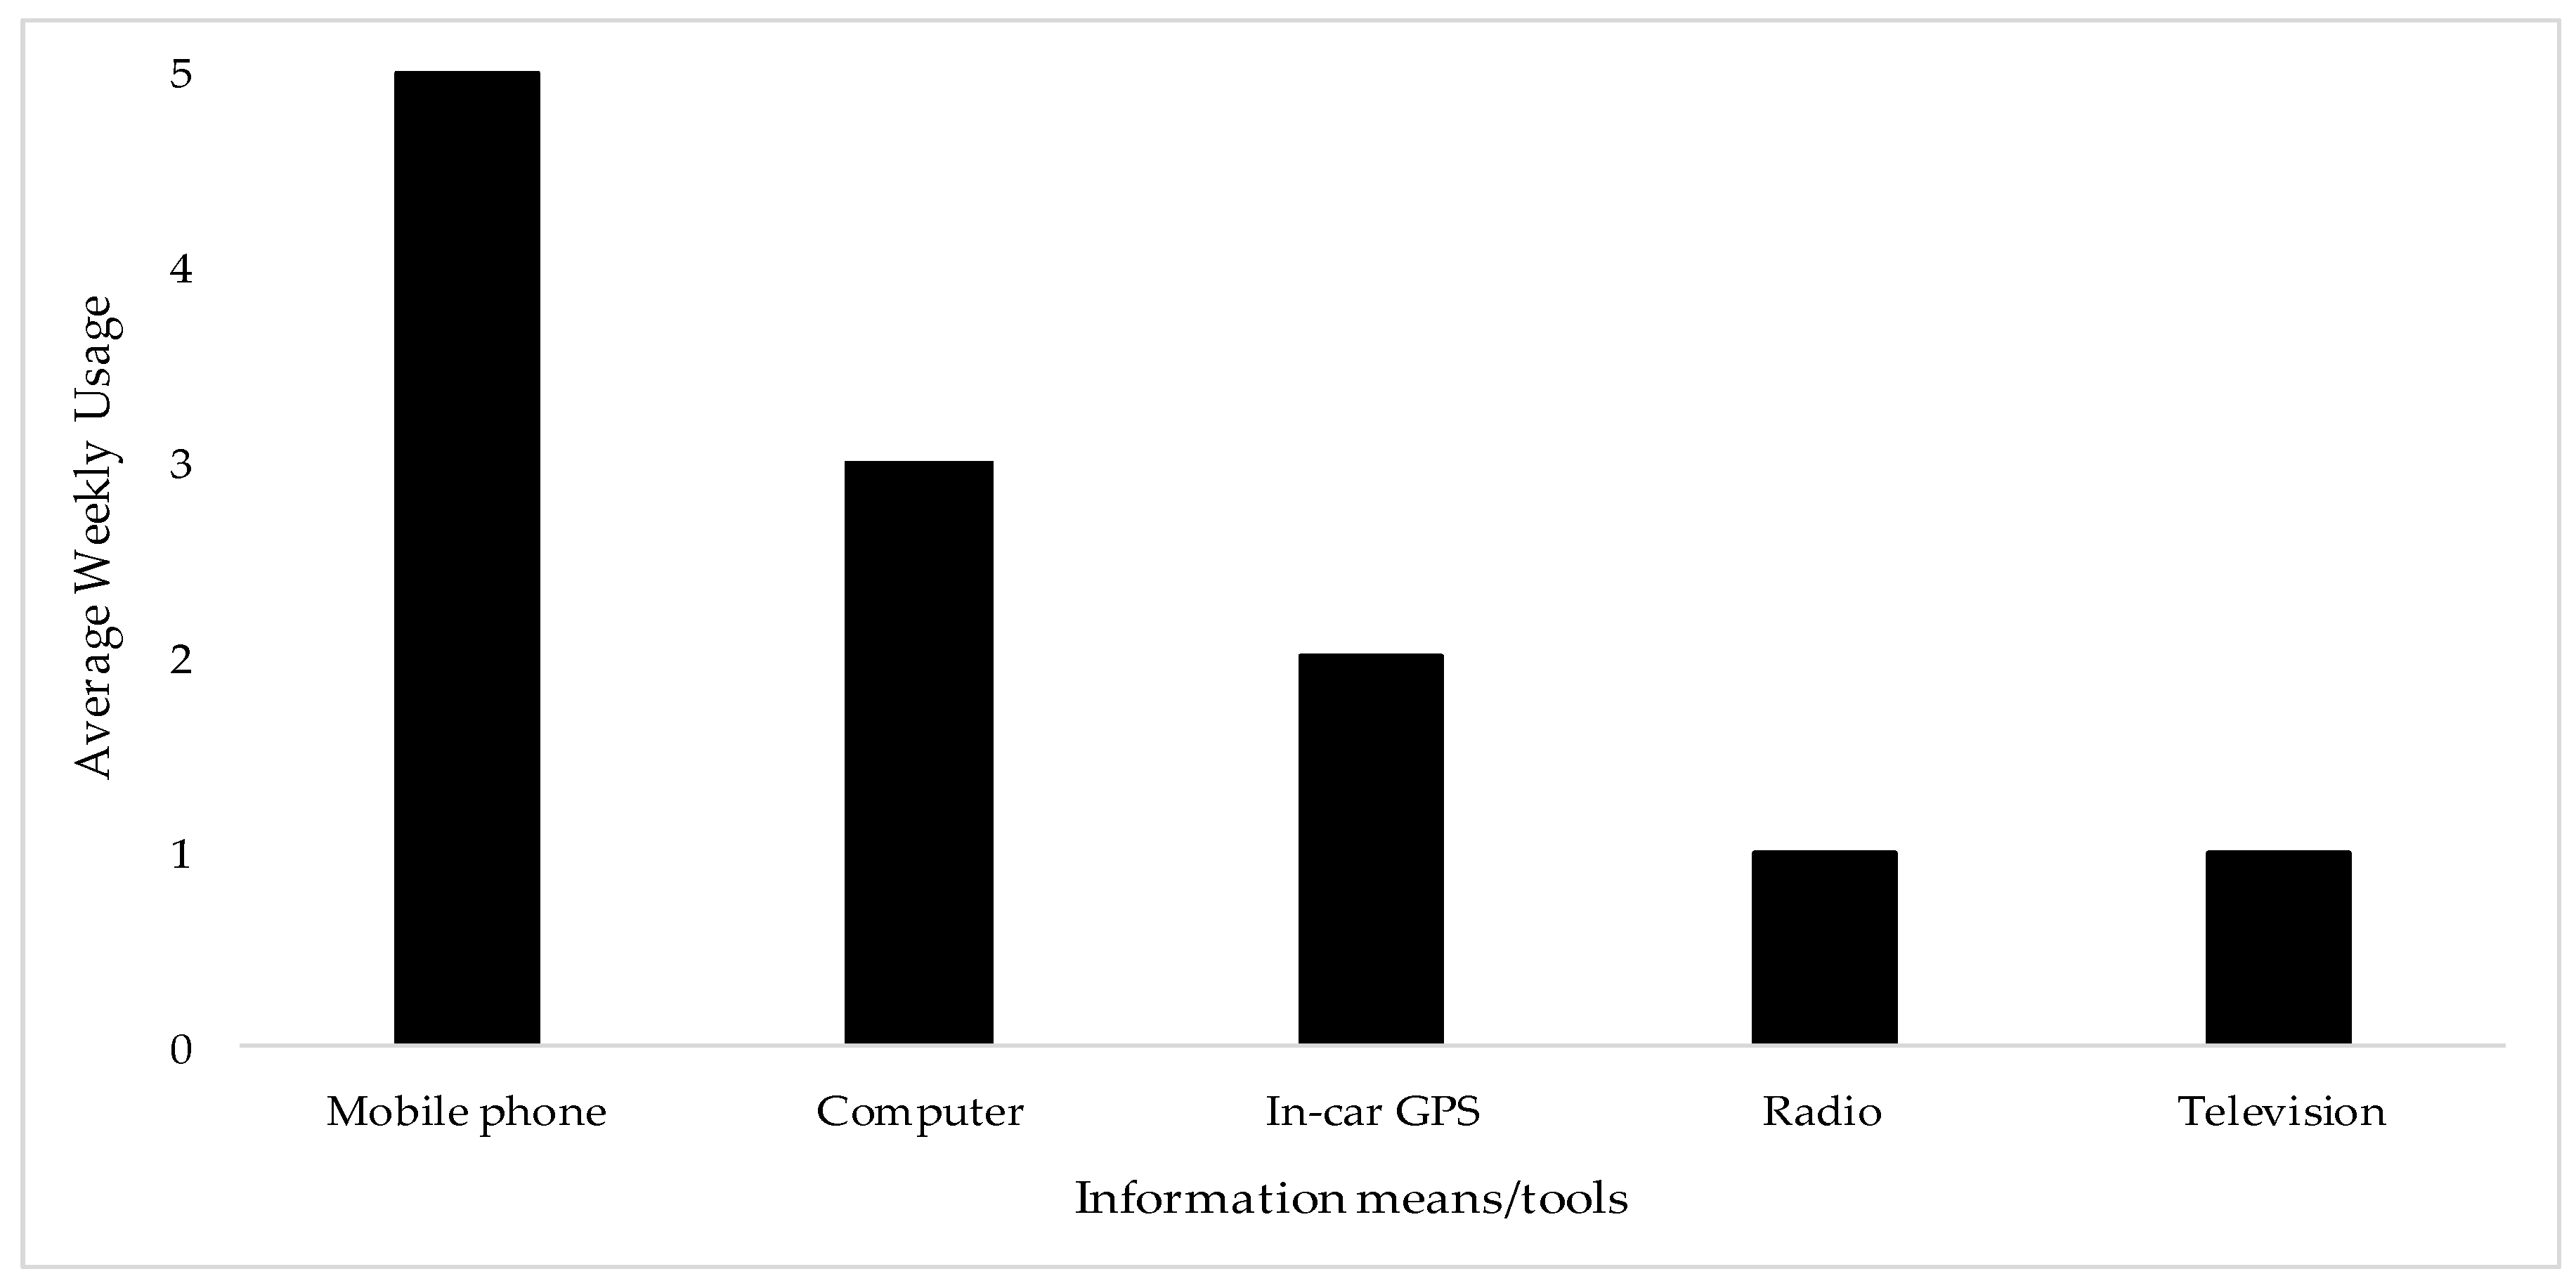
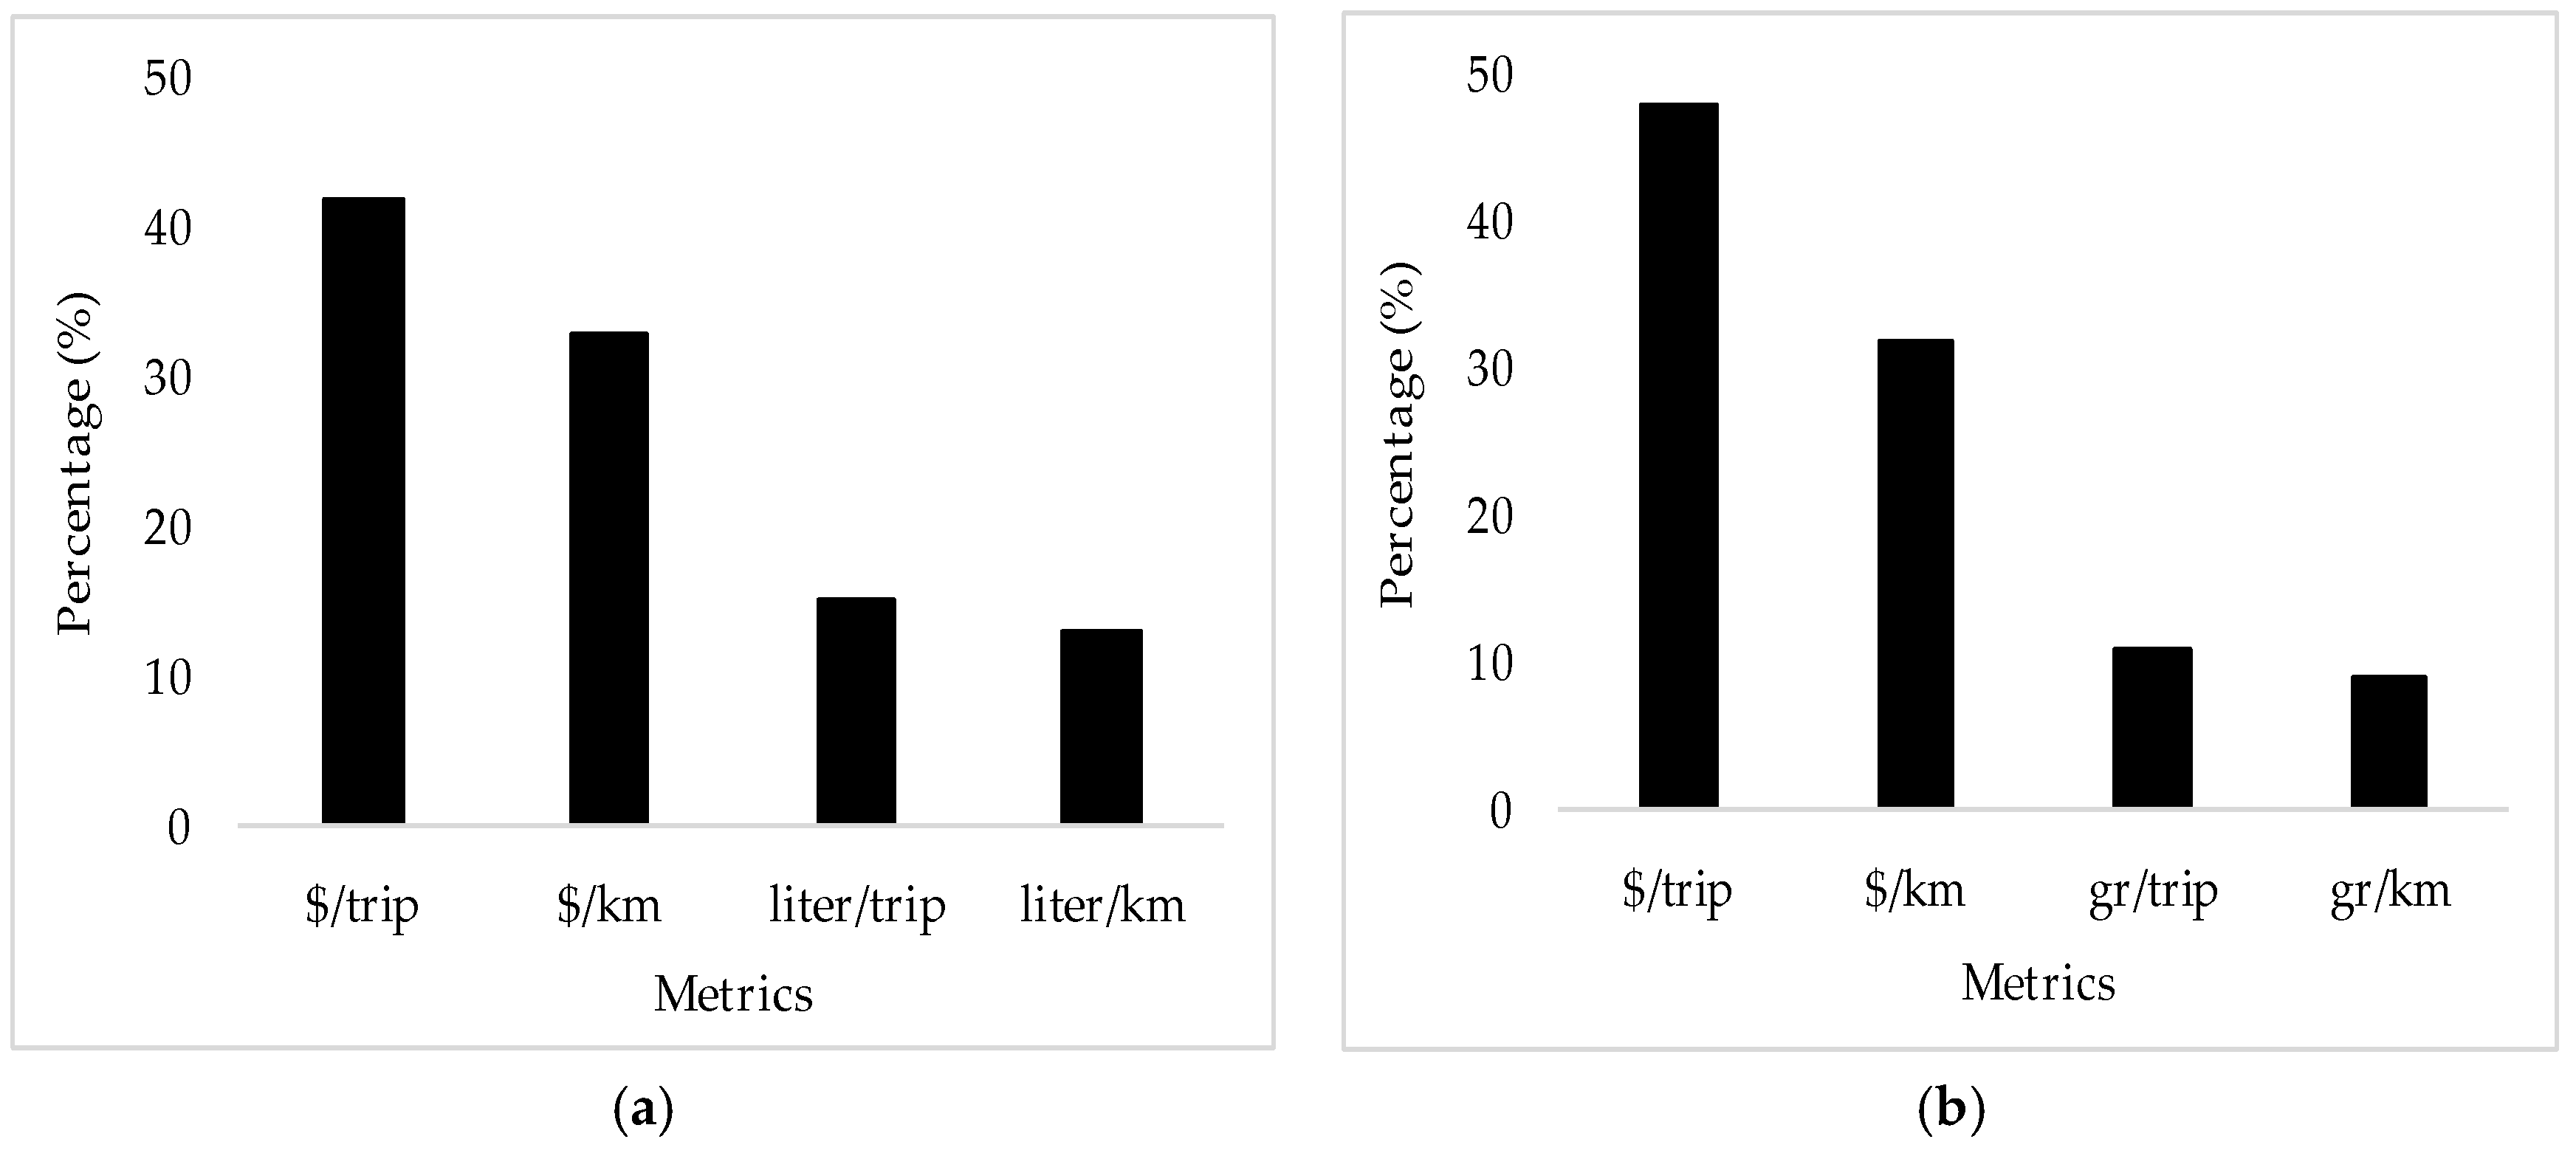
3.2. System Design Preferences
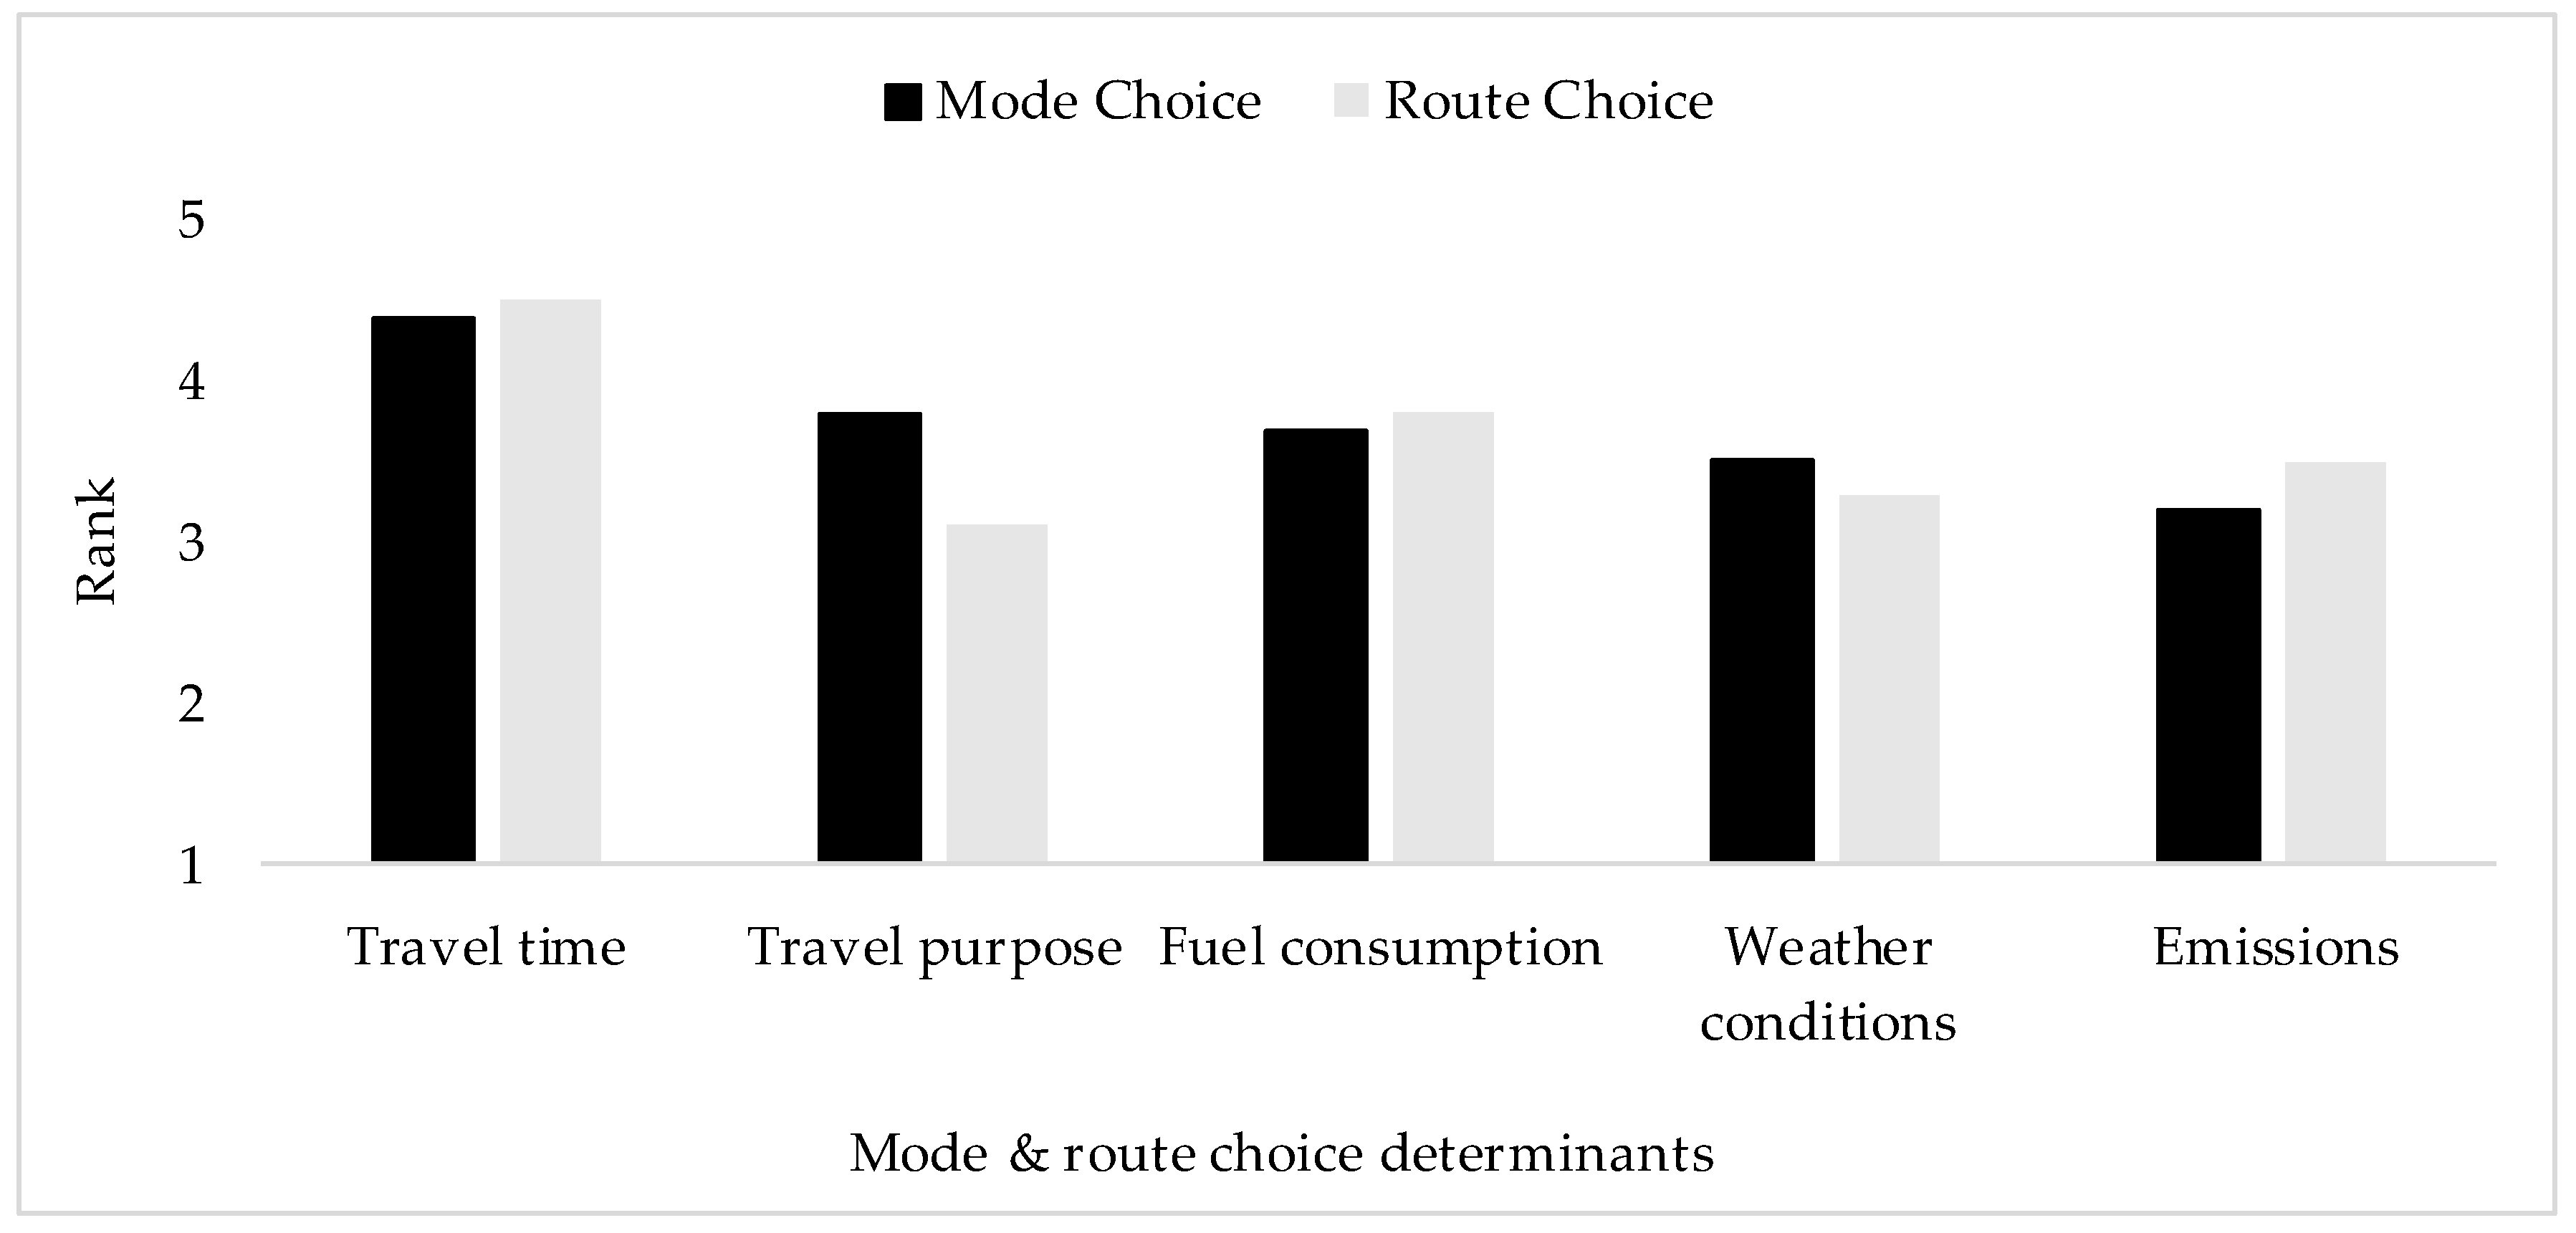
3.3. Travel Information Systems’ Influence on Travel Behavior
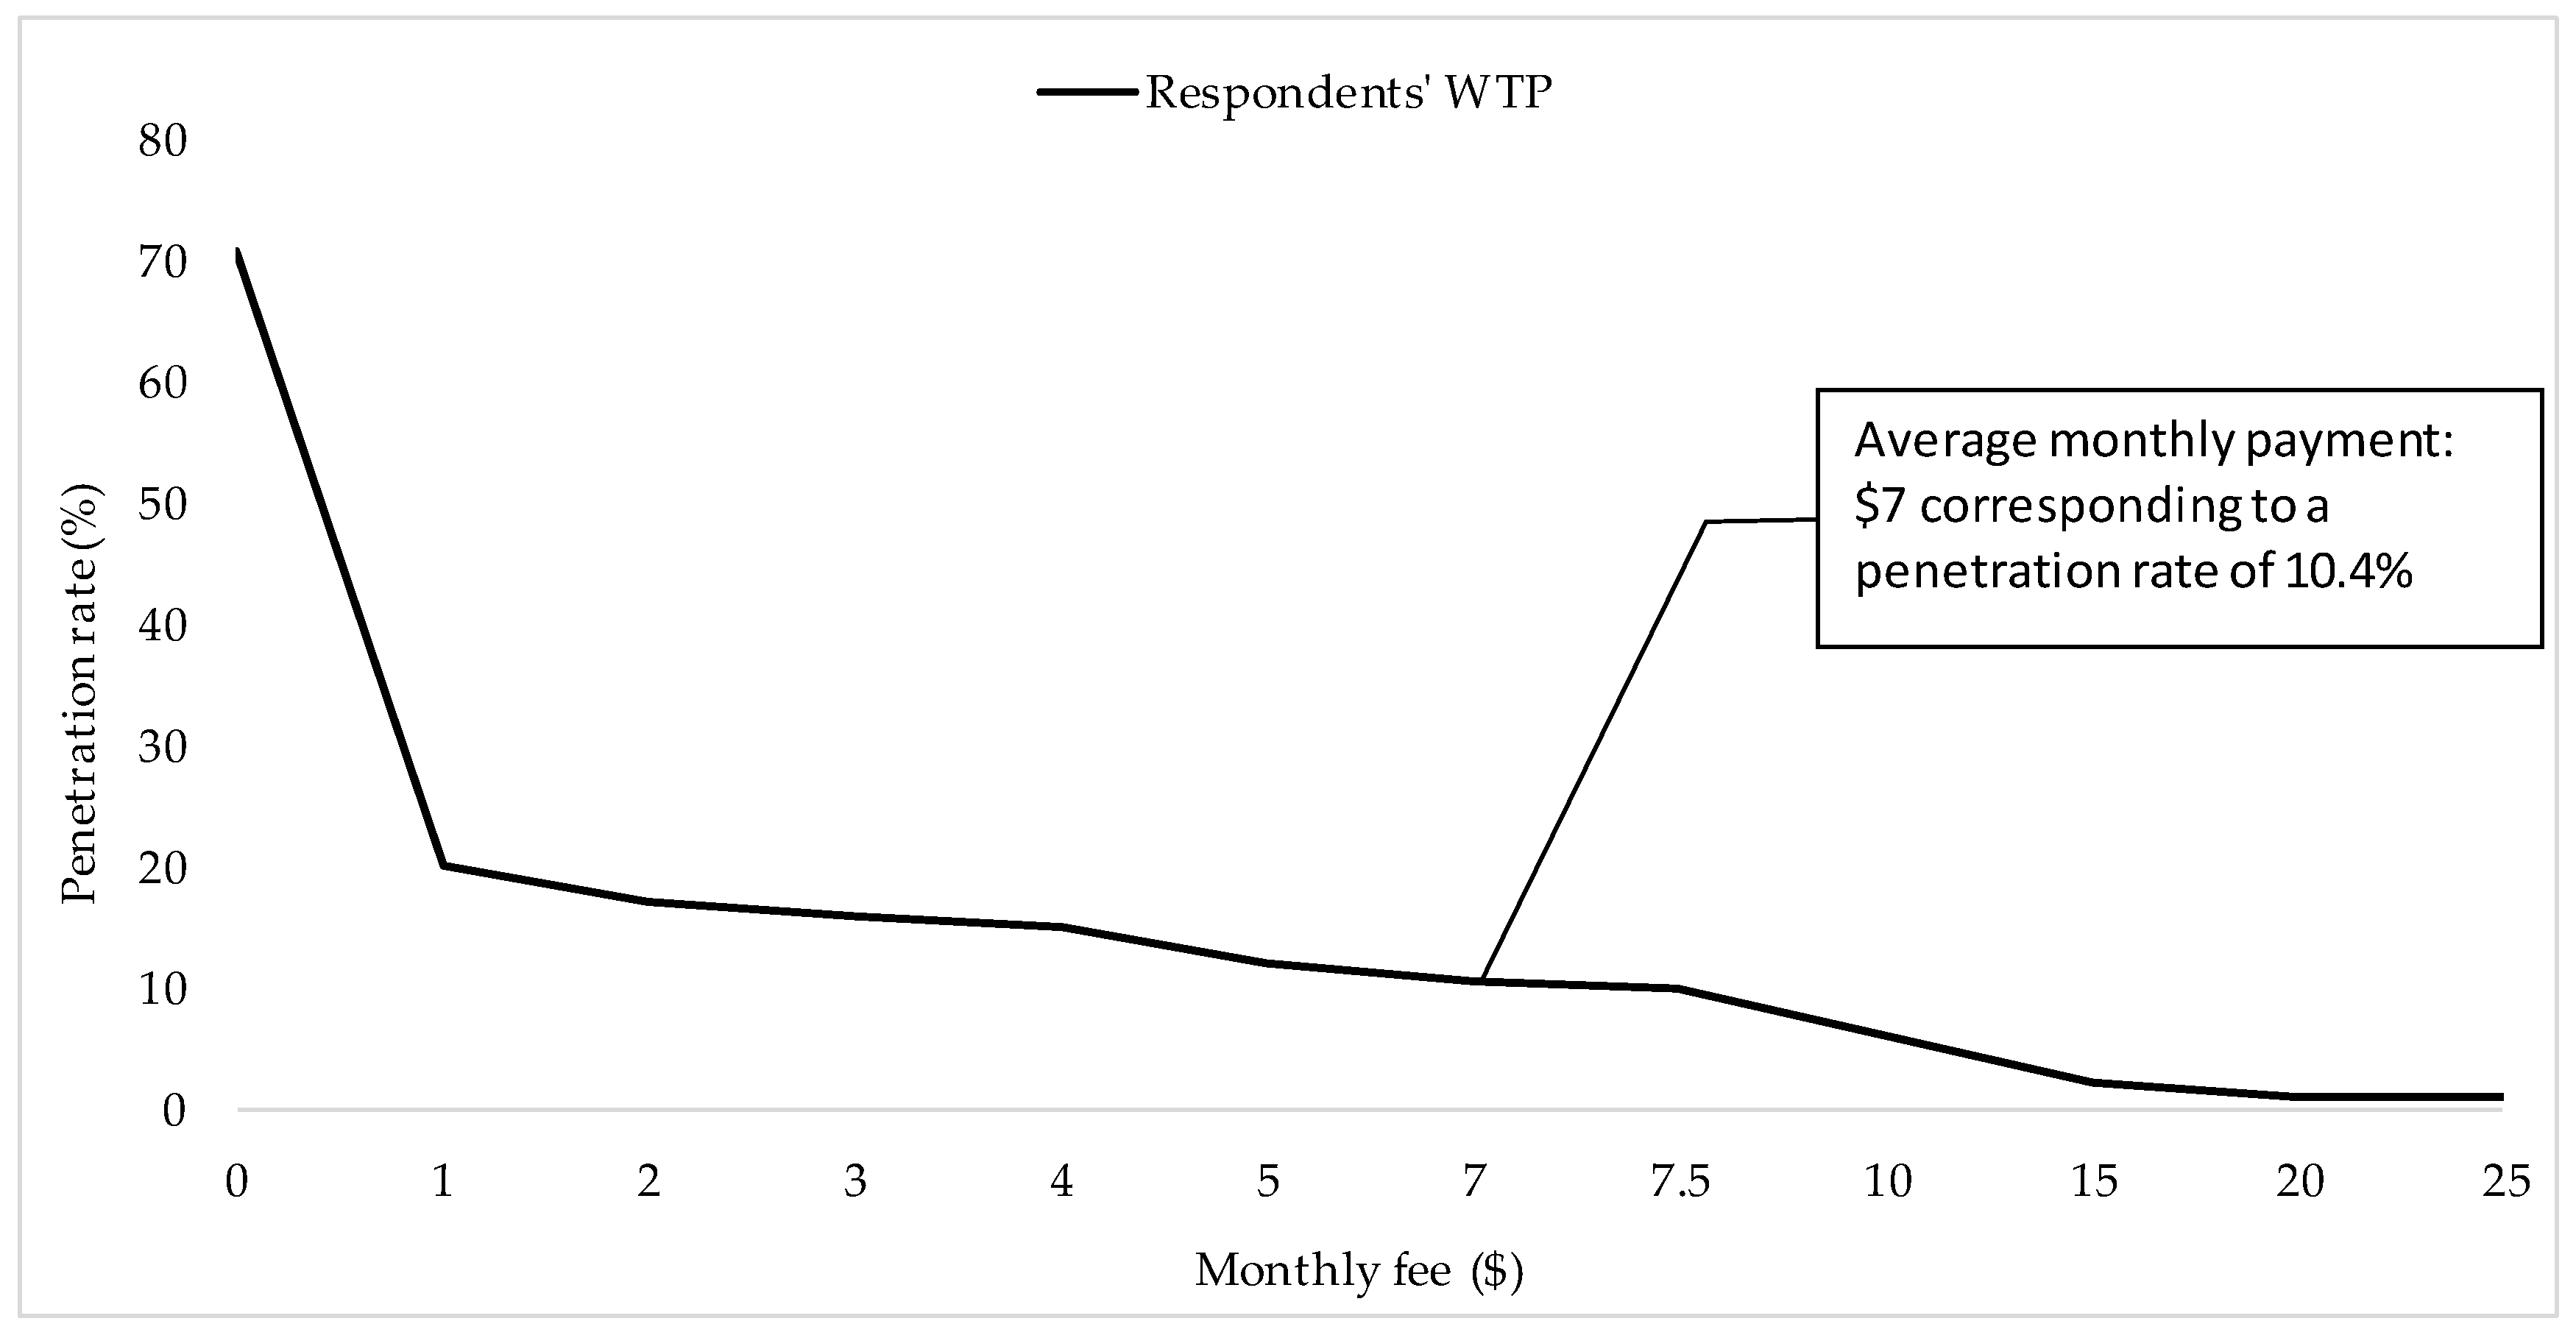
3.4. Willingness-to-Pay for the Information
3.5. Impacts of Socio-Demographic Characteristics on Results
4. Conclusions
Acknowledgments
Author Contributions
Conflicts of Interest
References
- Environment and Climate Change Canada. Canadian Environmental Sustainability Indicators: Greenhouse Gas Emissions; Environment and Climate Change Canada: Ottawa, ON, Canada, 2017; p. 8. [Google Scholar]
- Environment and Climate Change Canada. Canadian Environmental Sustainability Indicators: Air Pollutant Emissions; Environment and Climate Change Canada: Ottawa, ON, Canada, 2016; pp. 7–22. [Google Scholar]
- Raaschou-Nielsen, O.; Andersen, Z.J.; Beelen, R.; Samoli, E.; Stafoggia, M.; Weinmayr, G.; Hoffmann, B.; Fischer, P.; Nieuwenhuijsen, M.J.; Brunekreef, B. Air pollution and lung cancer incidence in 17 European cohorts: Prospective analyses from the European study of cohorts for air pollution effects (escape). Lancet Oncol. 2013, 14, 813–822. [Google Scholar] [CrossRef]
- Crouse, D.L.; Peters, P.A.; van Donkelaar, A.; Goldberg, M.S.; Villeneuve, P.J.; Brion, O.; Khan, S.; Atari, D.O.; Jerrett, M.; Pope, C.A., III. Risk of Nonaccidental and cardiovascular mortality in relation to long-term exposure to low concentrations of fine particulate matter: A Canadian national-level cohort study. Environ. Health Perspect. 2012, 120, 708. [Google Scholar] [CrossRef] [PubMed]
- Prillwitz, J.; Barr, S. Moving towards sustainability? Mobility styles, attitudes and individual travel behaviour. J. Transp. Geogr. 2011, 19, 1590–1600. [Google Scholar] [CrossRef]
- Brazil, W.; Caulfield, B. Does green make a difference: The potential role of smartphone technology in transport behaviour. Transp. Res. Part C 2013, 37, 93–101. [Google Scholar] [CrossRef]
- Rouhani, O.M.; Gao, H.O. An advanced traveler general information system for Fresno, California. Transp. Res. Part A 2014, 67, 254–267. [Google Scholar] [CrossRef]
- Avgerou, C. Information systems in developing countries: A critical research review. J. Inf. Technol. 2008, 23, 133–146. [Google Scholar] [CrossRef]
- Chatterton, T.J.; Coulter, A.; Musselwhite, C.; Lyons, G.; Clegg, S. Understanding how transport choices are affected by the environment and health: Views expressed in a study on the use of carbon calculators. PUHE Public Health 2009, 123, e45–e49. [Google Scholar] [CrossRef] [PubMed]
- Lorenzoni, I.; Pidgeon, N.F. Public views on climate change: European and USA perspectives. Clim. Chang. 2006, 77, 73–95. [Google Scholar] [CrossRef]
- Gaker, D.; Vautin, D.; Vij, A.; Walker, J.L. The power and value of green in promoting sustainable transport behavior. Environ. Res. Lett. 2011, 6, 034010. [Google Scholar] [CrossRef]
- Turrentine, T.S.; Kurani, K.S. Car buyers and fuel economy? Energy Policy 2007, 35, 1213–1223. [Google Scholar] [CrossRef]
- Brazil, W.; Caulfield, B. Testing individuals’ ability to compare emissions from public transport and driving trips. J. Public Transp. 2014, 17. [Google Scholar] [CrossRef]
- Carrel, A.; Ekambaram, V.; Gaker, D.; Sengupta, R.; Walker, J.L. The Quantified Traveler: Changing Transport Behavior with Personalized Travel Data Feedback; University of California Transportation Center, University of California: Berkeley, CA, USA, 2012. [Google Scholar]
- Combes, P.-P.; Lafourcade, M. Transport costs: Measures, determinants, and regional policy implications for France. J. Econ. Geogr. 2005, 5, 319–349. [Google Scholar] [CrossRef]
- Air pollution: Human health costs—Canada.ca. 2013. Available online: https://www.canada.ca/en/environment-climate-change/services/air-pollution/quality-environment-economy/economic-issues/human-health-costs.html (accessed on 22 January 2018).
- The true cost of carbon pollution. 2017. Environmental Defense Fund. Available online: https://www.edf.org/true-cost-carbon-pollution (accessed on 22 January 2018).
- Mannering, F.; Kim, S.-G.; Ng, L.; Barfield, W. Travelers’ preferences for in-vehicle information systems: An exploratory analysis. Transp. Res. Part C 1995, 3, 339–351. [Google Scholar] [CrossRef]
- Kim, K.; Vandebona, U. User requirements and willingness to pay for traffic information systems: Case study of Sydney, Australia. Trans. Res. Rec. 1999, 1694, 42–47. [Google Scholar] [CrossRef]
- Ng, L.; Barfield, W.; Mannering, F. A survey-based methodology to determine information requirements for advanced traveler information systems. Transp. Res. Part C 1995, 3, 113–127. [Google Scholar] [CrossRef]
- Brazil, W.; Caulfield, B.; Rieser-Schüssler, N. Understanding carbon: Making emissions information relevant. Transp. Res. Part D 2013, 19, 28–33. [Google Scholar] [CrossRef]
- Avineri, E.; Waygood, O. Catch Carbon-Aware Travel Choice in the City, Region and World of Tomorrow; Behavioural Inception Report; European Commission: Brussels, Belgium, 2010. [Google Scholar]
- Gaker, D.; Zheng, Y.; Walker, J. Experimental economics in transportation: Focus on social influences and provision of information. Transp. Res. Rec. 2010, 2156, 47–55. [Google Scholar] [CrossRef]
- Rouhani, O.M.; Zarei, H. Fuel consumption information: An alternative for congestion pricing? Road Transp. Res. 2014, 23, 52–64. [Google Scholar]
- Walker, J.L.; Ben-Akiva, M.E. Consumer response to traveler information systems: Laboratory simulation of information searches using multimedia technology. J. Intell. Transp. Syst. 1996, 3, 1–20. [Google Scholar] [CrossRef]
- Marans, R.W.; Yoakam, C. Accessing the acceptability of IVHS: Some preliminary results. In Proceedings of the Vehicle Navigation and Information Systems Conference, Troy, MI, USA, 20–23 October 1991; pp. 657–668. [Google Scholar]
- Polydoropoulou, A.; Gopinath, D.; Ben-Akiva, M. Willingness to pay for advanced traveler information systems: Smartraveler case study. Transp. Res. Rec. 1997, 1588, 1–9. [Google Scholar] [CrossRef]
- Politis, I.; Papaioannou, P.; Basbas, S.; Dimitriadis, N. Evaluation of a bus passenger information system from the users’ point of view in the city of thessaloniki, Greece. Res. Transp. Econ. 2010, 29, 249–255. [Google Scholar] [CrossRef]
- Zhang, L.; Levinson, D. Determinants of route choice and value of traveler information: A field experiment. Transp. Res. Rec. 2008, 2086, 81–92. [Google Scholar] [CrossRef]
- Molin, E.J.; Timmermans, H.J. Traveler expectations and willingness-to-pay for web-enabled public transport information services. Transp. Res. Part C 2006, 14, 57–67. [Google Scholar] [CrossRef]
- Fuel Consumption Ratings—Open Government Portal. 2018. Open.canada.ca. Available online: http://open.canada.ca/data/en/dataset/98f1a129-f628-4ce4-b24d-6f16bf24dd64 (accessed on 22 January 2018).
- Average retail prices for gasoline and fuel oil, by urban center. 2017. Statcan.gc.ca. Available online: http://www5.statcan.gc.ca/cansim/a47 (accessed on 22 January 2018).
- Mathez, A.; Manaugh, K.; Chakour, V.; El-Geneidy, A.; Hatzopoulou, M. How can we alter our carbon footprint? Estimating GHG emissions based on travel survey information. Transportation 2013, 40, 131–149. [Google Scholar] [CrossRef]
- Environment and Climate Change Canada. Technical Update to Environment and Climate Change Canada’s Social Cost of Greenhouse Gas Estimates; Environment and Climate Change Canada: Ottawa, ON, Canada, 2016; p. 27. [Google Scholar]
- National Research Council (US); Committee on Climate Change; US Transportation; Division on Earth and Life Studies. Potential Impacts of Climate Change on US Transportation; Transportation Research Board: Washington, DC, USA, 2008; Volume 290. [Google Scholar]
- United States Environmental Protection Agency. Average Annual Emissions and Fuel Consumption for Gasoline-Fueled Passenger Cars and Light Trucks Emission Facts; United States Environmental Protection Agency, Office of Transportation and Air Quality: Ann Arbor, MI, USA, 2008; p. 6. [Google Scholar]
- Holland, M.; Pye, S.; Watkiss, P.; Droste-Franke, B.; Bickel, P. Damages per Tonne Emission of PM2.5, NH3, SO2, NOx and VOCs from each EU25 Member State (Excluding Cyprus) and Surrounding Seas; AEA Technology Environment: Harwell, UK, 2005. [Google Scholar]
- Okazaki, S.; Hirose, M. Does gender affect media choice in travel information search? On the use of mobile internet. Tour. Manag. 2009, 30, 794–804. [Google Scholar] [CrossRef]
- Green, P.; Serafin, C.; Williams, M.; Paelke, G. What Functions and Features Should Be in Driver Information Systems of the Year 2000. In Proceedings of the Vehicle Navigation and Information Systems Conference, Troy, MI, USA, 20–23 October 1991; pp. 483–498. [Google Scholar]
- Llaneras, R.E.; Lerner, N.D. The effects of atis on driver decision making. ITS Q. 2000, 8, 53–63. [Google Scholar]
- Wolinetz, L.; Khattak, A.; Yim, Y. Why will some individuals pay for travel information when it can be free? Analysis of a bay area traveler survey. Transp. Res. Rec. 2001, 1759, 9–18. [Google Scholar] [CrossRef]
- McCubbin, D.R.; Delucchi, M.A. The health costs of motor-vehicle-related air pollution. J. Transp. Econ. Policy 1999, 33, 253–286. [Google Scholar]
- Small, K.A.; Kazimi, C. On the costs of air pollution from motor vehicles. J. Transp. Econ. Policy 1995, 29, 7–32. [Google Scholar]
- Krupnick, A.J.; Rowe, R.D.; Lang, C.M. Transportation and air pollution: The environmental damages. In The Full Costs and Benefits of Transportation; Springer: Berlin, Germany, 1997; pp. 337–369. [Google Scholar]
- Limtanakool, N.; Dijst, M.; Schwanen, T. The influence of socioeconomic characteristics, land use and travel time considerations on mode choice for medium-and longer-distance trips. J. Transp. Geogr. 2006, 14, 327–341. [Google Scholar] [CrossRef]
- Paulley, N.; Balcombe, R.; Mackett, R.; Titheridge, H.; Preston, J.; Wardman, M.; Shires, J.; White, P. The demand for public transport: The effects of fares, quality of service, income and car ownership. Transp. Policy 2006, 13, 295–306. [Google Scholar] [CrossRef]


| Socio-Demographic Characteristics | Number of Responses | Sample Percentage | General Population | |
|---|---|---|---|---|
| After eliminating “Prefer not to disclose” | 369 | |||
| Gender | Male Female | 178 191 | 48% 52% | 49% 51% |
| After eliminating “Prefer not to disclose” | 373 | |||
| Age groups | 18–24 25–34 35–44 45–54 55 or more | 121 114 78 34 26 | 32% 31% 21% 9% 7% | 12% 20% 18% 16% 34% |
| After eliminating “Prefer not to disclose” | 316 | |||
| Annual Income | Less than $30,000 $30,000–$50,000 $50,000–$70,000 $70,000–$100,000 $100,000–$150,000 $150,000–$200,000 $200,000 or more | 66 67 60 46 48 15 14 | 21% 21% 19% 15% 15% 5% 4% | 47% 23% 13% 10% 4% 1% 1% |
| Criteria Air Pollutant | Emission Rate (g/km) | Unit Emission Cost ($/g) | Health-Related Cost ($/km) |
|---|---|---|---|
| CO | 7.7 | 0.0004 | 0.0031 |
| NOx | 0.6 | 0.01 | 0.0060 |
| PM2.5 | 0.003 | 0.44 | 0.0013 |
| PM10 | 0.003 | 0.044 | 0.0001 |
| Total | 0.011 | ||
| Perceived GHG Costs ($/km) | |||||||||
|---|---|---|---|---|---|---|---|---|---|
| Socio-Demographics | Gender | Income | Travel Time | ||||||
| Travel Modes | Male | Female | <$50,000 | $50,000 to $100,000 | >$100,000 | <20 min | 20 min–30 min | >30 min | |
| Car | Sample size 1 | 23 | 20 | 15 | 14 | 14 | 12 | 15 | 14 |
| Average | 0.33 | 0.36 | 0.31 | 0.36 | 0.33 | 0.3 | 0.34 | 0.48 | |
| Median | 0.24 | 0.31 | 0.26 | 0.33 | 0.30 | 0.25 | 0.23 | 0.42 | |
| Standard dev. | 0.196 | 0.16 | 0.059 | 0.076 | 0.076 | 0.106 | 0.119 | 0.134 | |
| 95% CI 2 | 0.25–0.41 | 0.30–0.45 | 0.28–0.34 | 0.32–0.4 | 0.29–0.37 | 0.24–0.36 | 0.28–0.4 | 0.41–0.55 | |
| Metro | Sample size 1 | 23 | 18 | 15 | 13 | 13 | 13 | 16 | 12 |
| Average | 0.4 | 0.44 | 0.38 | 0.42 | 0.45 | 0.35 | 0.37 | 0.47 | |
| Median | 0.33 | 0.41 | 0.32 | 0.40 | 0.40 | 0.33 | 0.4 | 0.43 | |
| Standard dev. | 0.171 | 0.108 | 0.119 | 0.055 | 0.092 | 0.055 | 0.041 | 0.053 | |
| 95% CI 2 | 0.34–0.47 | 0.37–0.49 | 0.34–0.44 | 0.39–0.45 | 0.4–0.5 | 0.32–0.38 | 0.35–0.39 | 0.44–0.5 | |
| Bus | Sample size 1 | 16 | 18 | 13 | 10 | 9 | 9 | 11 | 14 |
| Average | 0.22 | 0.28 | 0.22 | 0.26 | 0.25 | 0.21 | 0.28 | 0.26 | |
| Median | 0.17 | 0.25 | 0.12 | 0.18 | 0.19 | 0.19 | 0.24 | 0.23 | |
| Standard dev. | 0.184 | 0.216 | 0.239 | 0.194 | 0.031 | 0.031 | 0.067 | 0.076 | |
| 95% CI 2 | 0.13–0.31 | 0.17–0.38 | 0.10–0.36 | 0.14–0.38 | 0.23–0.27 | 0.19–0.23 | 0.24–0.32 | 0.22–0.3 | |
| Perceived Air Pollution Health-Related Costs ($/km) | |||||||||
|---|---|---|---|---|---|---|---|---|---|
| Socio-Demographics | Gender | Income | Travel Time | ||||||
| Travel Modes | Male | Female | < $50,000 | $50,000 to $100,000 | > $100,000 | < 20 min | 20 min–30 min | > 30 min | |
| Sample size 1 | 20 | 18 | 12 | 14 | 12 | 13 | 14 | 11 | |
| Average | 0.29 | 0.32 | 0.27 | 0.35 | 0.34 | 0.19 | 0.28 | 0.32 | |
| Car | Median | 0.2 | 0.18 | 0.22 | 0.26 | 0.3 | 0.21 | 0.27 | 0.26 |
| Standard dev. | 0.114 | 0.086 | 0.106 | 0.172 | 0.071 | 0.037 | 0.038 | 0.023 | |
| 95% CI 2 | 0.24–0.34 | 0.28–0.36 | 0.21–0.33 | 0.26–0.44 | 0.3–0.38 | 0.17–0.21 | 0.26–0.3 | 0.23–0.41 | |
| Sample size 1 | 17 | 17 | 13 | 11 | 10 | 12 | 12 | 10 | |
| Average | 0.41 | 0.45 | 0.4 | 0.43 | 0.4 | 0.32 | 0.41 | 0.47 | |
| Metro | Median | 0.35 | 0.37 | 0.34 | 0.37 | 0.41 | 0.21 | 0.39 | 0.4 |
| Standard dev. | 0.126 | 0.084 | 0.092 | 0.068 | 0.032 | 0.106 | 0.053 | 0.113 | |
| 95% CI 2 | 0.35–0.47 | 0.41–0.49 | 0.35–0.45 | 0.39–0.47 | 0.43–0.47 | 0.26–0.38 | 0.38–0.44 | 0.4–0.54 | |
| Sample size 1 | 18 | 16 | 12 | 12 | 9 | 9 | 11 | 14 | |
| Average | 0.26 | 0.26 | 0.22 | 0.26 | 0.31 | 0.23 | 0.26 | 0.27 | |
| Bus | Median | 0.23 | 0.25 | 0.23 | 0.22 | 0.27 | 0.21 | 0.24 | 0.26 |
| Standard dev. | 0.129 | 0.102 | 0.035 | 0.088 | 0.106 | 0.046 | 0.085 | 0.038 | |
| 95% CI 2 | 0.2–0.32 | 0.21–0.31 | 0.2–0.24 | 0.21–0.31 | 0.25–0.37 | 0.2–0.26 | 0.23–0.31 | 0.25–0.29 | |
| Willingness to Pay for ATGIS ($/month) | ||||||
|---|---|---|---|---|---|---|
| Socio-Demographics | Gender | Income | ||||
| ATGIS Users | Male | Female | < $50,000 | $50,000 to $100,000 | > $100,000 | |
| Including “$0” responses | Sample size 1 | 52 | 56 | 49 | 36 | 36 |
| Average | 1.69 | 2.93 | 1.37 | 1.51 | 3.03 | |
| Excluding “$0” responses | Sample size 1 | 16 | 20 | 14 | 10 | 12 |
| Average | 5.51 | 8.22 | 4.8 | 7.2 | 9.1 | |
| Median | 4.3 | 6.25 | 4.0 | 7.5 | 8 | |
| Standard dev. | 3.86 | 4.06 | 3.63 | 3.55 | 5.65 | |
| 95% CI 2 | 3.6–7.4 | 6.4–10 | 2.9–6.7 | 5.0–9.4 | 5.6–12.6 | |
© 2018 by the authors. Licensee MDPI, Basel, Switzerland. This article is an open access article distributed under the terms and conditions of the Creative Commons Attribution (CC BY) license (http://creativecommons.org/licenses/by/4.0/).
Share and Cite
Daher, N.; Yasmin, F.; Wang, M.R.; Moradi, E.; Rouhani, O. Perceptions, Preferences, and Behavior Regarding Energy and Environmental Costs: The Case of Montreal Transport Users. Sustainability 2018, 10, 514. https://doi.org/10.3390/su10020514
Daher N, Yasmin F, Wang MR, Moradi E, Rouhani O. Perceptions, Preferences, and Behavior Regarding Energy and Environmental Costs: The Case of Montreal Transport Users. Sustainability. 2018; 10(2):514. https://doi.org/10.3390/su10020514
Chicago/Turabian StyleDaher, Nayer, Farhana Yasmin, Min Ru Wang, Ehsan Moradi, and Omid Rouhani. 2018. "Perceptions, Preferences, and Behavior Regarding Energy and Environmental Costs: The Case of Montreal Transport Users" Sustainability 10, no. 2: 514. https://doi.org/10.3390/su10020514
APA StyleDaher, N., Yasmin, F., Wang, M. R., Moradi, E., & Rouhani, O. (2018). Perceptions, Preferences, and Behavior Regarding Energy and Environmental Costs: The Case of Montreal Transport Users. Sustainability, 10(2), 514. https://doi.org/10.3390/su10020514