Article

Joint Pricing and Product Carbon Footprint Decisions and Coordination of Supply Chain with Cap-and-Trade Regulation

1
School of Management Engineering, Anhui Polytechnic University, Wuhu 241000, China
2
School of Economics and Business Administration, Chongqing University, Chongqing 400030, China
3
Antai College of Economics and Management, Shanghai Jiao Tong University, Shanghai 200052, China
*
Author to whom correspondence should be addressed.
Sustainability 2018, 10(2), 481; https://doi.org/10.3390/su10020481
Submission received: 14 January 2018 / Revised: 6 February 2018 / Accepted: 6 February 2018 / Published: 11 February 2018
(This article belongs to the Section Economic and Business Aspects of Sustainability)

Abstract

:
The implementation of cap-and-trade regulation worldwide is bound to have some effects on supply chain decision-making. This paper investigates optimal pricing and product carbon footprint decisions of the supply chain consisting of a manufacturer and a retailer under cap-and-trade regulation by applying optimization and game theory. By comparing the optimal results between the centralized and decentralized decision-making models, we find that the optimal product carbon footprint and selling price not only depend on the carbon trading price and carbon cap allocated by the government, but also relate to the initial carbon footprint of the product and the decision-making methods in the supply chain. It is found that there is also a “double marginalization” in the decentralized situation, thus we coordinate the supply chain using a two-part tariff contract. Specifically, only the manufacturer adjusts dynamically the wholesale price and fixed fee within the coordinating contract according to different initial carbon footprint and the range of the carbon cap reduction by the government. Finally, we obtain several interesting conclusions from the numerical examples and provide managerial insights and policy implications from the analytical results.

1. Introduction

In recent years, with the rapid development of industrial economy, some firms based on fossil energy create wealth for humans while releasing large amounts of carbon emissions that cause serious environmental problems, such as global warming and climate change, which become increasingly obvious as extreme weather becomes more frequent and the greenhouse effect is increasing. To mitigate the negative effects of climate change on human survival and development, more and more countries and districts are imposing a series of legislations to reduce carbon emissions. For example, European Union established a carbon emissions trading system (ETS EU) in 2005, and has adopted cap-and-trade regulation to curb the amount of carbon emissions [1,2]. Subsequently, cap-and-trade regulation has been established by the United States, Australia, Canada, Japan and other countries [3,4]. It is worth mentioning that the National Development and Reform Commission (NDRC) of China has chosen Beijing, Shanghai, Tianjin, Chongqing, Guangdong, Hubei and Shenzhen to carry out regional pilot work on carbon emissions trading, and to explore the correct path to establish a national cap-and-trade mechanism in the country in the near future [5,6]. Clearly, cap-and-trade regulation is widely accepted and applied in many countries to curb carbon emissions.
Under cap-and-trade regulation, manufacturers receive emission quotas called “the carbon cap” from the government, and they can buy or sell carbon emission credits through carbon trading market. It is generally known that the carbon emissions incur in almost all stages of the production process, therefore cap-and-trade regulation has significant effects on the manufacturers’ operational decisions. Meanwhile, some key decision-making problems of the supply chain partners will also been affected. Correspondingly, retailers should adjust their ordering/pricing strategies to meet consumer demand for the low-carbon products so they can maximize their profits.
In addition, the government has implemented cap-and-trade to encourage manufacturers to reduce their carbon emissions, but at the same time the government should also scientifically evaluate the effects of the carbon cap and carbon trading price on the operational decisions of supply chain, such as inventory management, production/pricing decisions and the investment of low-carbon technology. In other words, the government needs to adjust the carbon cap according to the actual fluctuation of the carbon trading price and the effects of carbon emission reduction.
In view of the gap between the existing research and the practical problems faced by the supply chain under cap-and-trade regulation, this paper will develop the game models to explore the following important issues:
(1)
How do the manufacturer and the retailer make optimal product carbon footprint and pricing decisions under the carbon cap and trade regulation?
(2)
What effects does the cap-and-trade regulation have on the product carbon footprint, selling price, consumer demand and the profit of the supply chain system?
(3)
How does the manufacturer design coordinating contract (such as the wholesale price and fixed fee in the two-part tariff) to ensure the retailer to cooperate based on the change of the carbon cap and the carbon trading price?
(4)
For the government, what policies and measures are also implemented to encourage the manufacturer to invest in low-carbon technology under cap-and-trade regulation, and then to reduce the product carbon footprint more effectively.
To answer these questions, a game theory approach is used for modeling and solving the problem. With this approach, we can find the optimal product carbon footprint and selling price, solve the problems of the manufacturer and retailer’ decisions, increase the controllability, and improve the operation efficiency for the supply chain. We obtain some new research results, which provide a theoretical basis and decision support for decision makers in the supply chain as wll as give some useful managerial implications for the government to design and implement the cap-and-trade regulation more efficiently.
The rest of this paper is organized as follows. In Section 2, we present a review of the relative literature. Section 3 describes the problem and assumptions and solves the optimization models, and then designs coordinating contract for the supply chain. In Section 4, we analyze the results and conduct numerical studies to investigate the effects of the carbon trading price and the carbon cap allocated by the government on the optimal decisions and the coordinating contract, and then give some managerial implications. The conclusion is presented in Section 5 with some insights summarized and remarks on potential extension in the future.

2. Literature Review

In recent years, the literature on cap-and-trade regulation is growing. This paper is highly related to the three streams of literature on inventory management, production decision and the coordination of supply chain under cap-and-trade regulation.
In the firm’s order decisions with the cap-and-trade regulation literature, Hua et al. [7] investigated the optimal order quantity decisions for the retailer under the cap-and-trade mechanism based on the classical economic order quantity model, and discussed the impacts of carbon cap and carbon price on the carbon footprints and total cost. Benjaafar et al. [8] formulated lot-sizing models for single and multiple firms with a variety of regulatory policies, summarized key findings and offered ideas for future research. Chen et al. [9] provided some conditions that can reduce emissions by modifying order quantities based on the Economic Order Quantity (EOQ) model, in which the parameters of the carbon emission regulation are exogenous. He et al. [10] investigated the impacts of production and regulation parameters on the optimal lot-size and emissions, and compared the firm’s optimal carbon emissions under the cap-and-trade and carbon tax. Dong et al. [11] examined the optimal order quantity (or production quantity) and sustainability investment under the cap-and-trade regulation.
As an extensive study concentrating on the firm’s production decision with the cap-and-trade regulation, Song and Leng [12] investigated the firm’s optimal production quantity and corresponding expected profit under cap-and-trade system based on the single-period newsvendor model, and found that the firm’s expected profit is increased and carbon emissions are reduced. Jaber et al. [13] studied the production-inventory decisions in a two-level (vendor–buyer) supply chain context with cap-and-trade regulation, and they illustrated the behavior of the supply chain cost function for several possible scenarios by using numerical examples. Zhang and Xu [14] investigated the multi-item production planning with carbon cap-and-trade mechanism, and analyzed the impact of carbon trading price on the firm’s optimal production and the total carbon emissions. Du et al. [15] investigated the optimal decisions on permits pricing and production quantity for an emission-dependent supply chain under the cap-and-trade mechanism, and they concluded several managerial implications by numerical example and sensitivity. Zhou et al. [16] proposed a multi-stage production system to solve the production planning and emission trading problem under cap-and-trade scheme, and developed analytic models to help manufacturers put the environmental resource plan into practice.
Meanwhile, some of the literature studied the firm’s optimal production and pricing problems considering carbon emission constraints, and obtained some managerial implications. For example, Xu et al. [17] explored the impacts of the carbon trading price on the two products’ production and pricing decisions in a supply chain. Zheng et al. [18] studied the impacts of cap-and-trade on optimal pricing and order quantities and carbon emissions with different transportation modes, and found that the retailers prefer a low-carbon transportation mode when the carbon trading price is high. Du et al. [19] investigated the impacts of cap-and-trade on the manufacturer’s multi-product pricing and production, and found that this regulation can constrain carbon emissions and promote low-carbon production simultaneously.
Although this paper is also related to the literature on the supply chain coordination considering cap-and-trade regulation, the literature is limited. Xu et al. [20] studied the impacts of cap-and-trade on the optimal decisions with a make-to-order setting, and finally proposed the contract to coordinate the sustainable supply chain. Xu et al. [21] explored the impacts of cap-and-trade on the production and emission abatement decisions, and designed a contract to achieve Pareto improvement for the supply chain. However, in their research, the carbon trading price is fixed and the impacts of the carbon trading price on the product carbon footprint decision are not discussed. For the former, some studies show that there are many factors influencing the carbon trading price, such as the economic and policy factors [22,23,24], so there is a certain gap between theory and management practice of cap-and-trade regulation. For the latter, the current developments in the product carbon footprint are supported and reviewed by organization, and this measure can report the low-carbon degree of the product and its production and environmental performance in supply chains [25,26,27]. It is believed that the impact of cap-and-trade regulation on the optimal product carbon footprint is also significant. Moreover, how does the government dynamically adjust the carbon cap to inspire the manufacturers to reduce product carbon footprint with the changing of carbon trading price? All these questions are worth investigating.
In addition to the above two contributions, this paper differs from the above studies in the following two aspects. First, considering the product carbon footprint can better reflect the actual level of carbon emissions and environmental impacts of the manufacturer during low-carbon operation, this paper integrates product carbon footprint and pricing strategies. How to set the selling price for the low-carbon product under the cap-and-trade regulation is a new challenge for the supply chain members. By incorporating the selling price as a decision variable into our models, and analyzing the effects of carbon trading price and the carbon cap on the selling price of the products, we can further explore the effects of cap-and-trade on consumer demand and supply chain performance. Second, this paper denotes that the carbon trading price is a linear decreasing function of the carbon cap, which allows a theoretical approach to management practice. Through analysis, some conclusions and suggestions can be given for the government to better encourage the manufacturer to reduce product carbon footprint, that is, it can adjust the carbon cap according to the initial carbon footprint.

3. Models and Decision Analysis

3.1. Problem Statement and Assumption

In this study, we consider a two-level supply chain consisting of a manufacturer and a retailer, the manufacturer produces a product and sells it to the retailer, who in turn sells the product to consumer. Since the cap-and-trade regulation was put into effect, the manufacturer has to adopt low-carbon technology to reduce product carbon footprint. Obviously, the product carbon footprint and wholesale price are determined by the manufacturer, according to the carbon cap and carbon trading price and the investment costs for the low-carbon technology. Then, the retailer determines the selling price based on the wholesale price and consumer demand for the product.
For the purposes of discussion, and without loss of generality, we will make the following basic assumptions.
(1)
The manufacturer produces the product with unit cost c and sells it at wholesale price w to the retailer, which is a decision variable of the manufacturer.
(2)
Under cap-and-trade regulation, the manufacturer is allocated a predetermined emission quota N (hereinafter referred to as the carbon cap, which is similar to the studies of Hua et al. [7], Benjaafar et al. [8], Zhou et al. [16] and Xu et al. [21]), and the carbon trading price in an outside market is denoted by θ . If the actual emissions exceed the carbon cap N , the manufacturer needs to buy carbon permits. Conversely, if the emissions are less than the carbon cap N , the manufacturer can sell the extra carbon permits. We assume that X is traded quantity of carbon emissions: if X > 0 , it means that the manufacturer can sell X units of carbon credit; if X < 0 , it means that the manufacturer need to buy | X | units of carbon credit; and if X = 0 , it means that the manufacturer neither buys nor sells any carbon emission credits.
(3)
If the manufacturer carries out investment in low-carbon technology, the initial carbon footprint of the product f 0 can be reduced to f ( 0 f < f 0 ) with an investment cost C ( f ) = K ( f 0 f ) 2 , which is similar to the study of Yalabik and Fairchild [28], where K > 0 represents the cost factor related to low-carbon technology, f is the product carbon footprint, which is decision-making variable for the manufacturer.
(4)
Following the study of Goyal and Netessine [29] and Xu et al. [17], we assume that consumer demand for the product is Q = a b p , where a ( a > 0 ) represents the potential market size, b ( b > 0 ) is the price sensitivity of consumer, and p ( p > w > c + θ f 0 ) is the selling price, which is a decision-making variable for the retailer.
To guarantee the non-negativity of consumer demand and the supply chain system can realize profit maximization, that is, it is profitable for the manufacturer to adopt low-carbon technology to reduce the product carbon footprint, the related parameters should satisfy:
( i )   0 < f 0 < a b c b θ
( ii )   0 < θ < 2 K b b
Under the above model assumptions, we can express the manufacturer’s (M), retailer’s (R) and the supply chain’s (SC) profit functions as follows:
M C T = ( w c ) ( a b p ) K ( f 0 f ) 2 + θ X
R C T = ( p w ) ( a b p )
S C C T = ( p c ) ( a b p ) K ( f 0 f ) 2 + θ X

3.2. The Centralized Decision-Making Model

With centralized decision-making, the manufacturer and retailer jointly make decisions to optimize the whole supply chain with the constraint of cap-and-trade regulation. The decision problem faced by central controller is to decide the product carbon footprint and the selling price based on carbon cap allocated by the government and carbon trading price, and then decides whether to sell or buy carbon permits by comparing the carbon cap and the actual carbon emissions, and to achieve profit maximization. Therefore, the optimization problem for the centralized supply chain can be expressed as follows:
Max f , p S C C T π s c = ( p c ) ( a b p ) K ( f 0 f ) 2 + θ X     s . t .   ( a b p ) f + X = N
Firstly, we substitute the constraint condition into the objective function, and then the centralized supply chain’s profit can be expressed as
S C C T = ( p c θ f ) ( a b p ) K ( f 0 f ) 2 + θ N
Taking the second-order partial derivatives of S C C T with respect to f and p , we have the Hessian matrix:
H C T C = ( 2 S C C T f 2 2 S C C T f p 2 S C C T p f 2 S C C T p 2 ) = ( 2 K b θ b θ 2 b )
Since 2 S C C T / f 2 = 2 K < 0 and | H C T C | = 4 K b b 2 θ 2 > 0 , we can know that S C C T is strictly jointly concave in f and p . Therefore, the optimal solutions of this optimization problem exist.
Letting the first-order conditions of the objective function be zero, that is S C C T / f = 0 and S C C T / p = 0 , and simultaneously solving the equations, the optimal product carbon footprint and the selling price in the centralized supply chain system are given by:
{ f C T C * = 4 K f 0 θ ( a b c ) 4 K b θ 2 p C T C * = 2 K ( a + b c + b θ f 0 ) a b θ 2 4 K b b 2 θ 2
Based on the optimal product carbon footprint and selling price, we can easily get consumer demand, the traded quantity of carbon emissions and the profit of the centralized supply chain system, respectively.
Q C T C * = 2 K ( a b c b θ f 0 ) 4 K b θ 2 ,   X C T C * = N 2 K ( a b c b θ f 0 ) [ 4 K f 0 θ ( a b c ) ] ( 4 K b θ 2 ) 2 S C C T C * = K ( a b c b θ f 0 ) 2 + b θ N ( 4 K b θ 2 ) b ( 4 K b θ 2 )
As the central controller’s optimal product carbon footprint and selling price, the following proposition is obtained.
Proposition 1.
Given the carbon cap, carbon trading price and the initial carbon footprint, the optimal strategy combination of the centralized decision-making model is ( f C T C * , p C T C ), the equilibrium consumer demand is Q C T C * , the traded quantity of carbon emissions is X C T C * and the profit of the whole supply chain system is S C C T C * .
Note. With centralized decision-making, if the carbon cap allocated by the government is relatively large ( N > N 0 C T C ), the manufacturer can sell N N 0 C T C emission permits to the carbon trading market. If the carbon cap is relatively small ( N < N 0 C T C ), the manufacturer needs to buy N 0 C T C N carbon rights to emit additional emissions from the carbon trading market. If the carbon cap satisfies N = N 0 C T C , the manufacturer neither sells nor buys carbon permits.
where   N 0 C T C = 2 K ( a b c b θ f 0 ) [ 4 K f 0 θ ( a b c ) ] ( 4 K b θ 2 ) 2 .
Corollary 1.
With centralized decision-making, given that the carbon cap (N):
(a)
If the initial carbon footprint ( f 0 ) and carbon trading price ( θ ) satisfy any of the following two conditions, the optimal product carbon footprint will decrease with increasing carbon trading price:
  0 < f 0 < γ C T C ,   0 < θ < 2 K b b ;     γ C T C < f 0 < a b c b θ ,   0 < θ < θ 1 C T C .
(b)
If the initial carbon footprint ( f 0 ) and carbon trading price ( θ ) satisfy, respectively, γ C T C < f 0 < a b c b θ and θ 1 C T C < θ < 2 K b b , the optimal product carbon footprint will increase with increasing carbon trading price.
  0 < f 0 < γ C T C ,   0 < θ < 2 K b b ;     γ C T C < f 0 < a b c b θ ,   0 < θ < θ 1 C T C ;
where   γ C T C = ( a b c ) K b 2 K b ,   θ 1 C T C = 4 K b f 0 2 K b [ 4 K b f 0 2 ( a b c ) 2 ] ( a b c ) b .
The above Corollary 1 states that, under the centralized decision-making, if the initial carbon footprint of the product is relatively small, the increasing carbon trading price may prompt the manufacturer to reduce the product carbon footprint; if the initial carbon footprint of the product is relatively large, only when carbon trading price is less than a threshold, the increasing carbon trading price can prompt the manufacturer to reduce the product carbon footprint; otherwise, the increasing carbon trading price does not make the manufacturer reduce the product carbon footprint.
Corollary 2.
With centralized decision-making, given that the carbon cap ( N ):
(a)
If the initial carbon footprint ( f 0 ) and carbon trading price ( θ ) satisfy any of the following two conditions, the optimal selling price will increase with increasing carbon trading price:
  0 < f 0 < γ C T C ,   0 < θ < θ 3 C T C     γ C T C < f 0 < a b c b θ ,   0 < θ < 2 K b b .
(b)
If the initial carbon footprint ( f 0 ) and carbon trading price ( θ ) satisfy, respectively, 0 < f 0 < γ C T C and θ 3 C T C < θ < 2 K b b , the optimal selling price will decrease with increasing carbon trading price,
where   θ 3 C T C = a b c ( a b c ) 2 4 K b f 0 2 b f 0 .
Corollary 2 shows that, under the centralized decision-making, if the initial carbon footprint of the product is relatively large, the selling price of the product will increase with increasing carbon trading price; only if the initial carbon footprint of the product is relatively small, and the carbon trading price is in a certain range, the selling price will decrease with increasing carbon trading price.

3.3. The Decentralized Decision-Making Model

With the decentralized decision-making, the manufacturer and the retailer are independent decision-makers seeking to maximize their own profits. Here, we characterize their relationship as a Stackelberg game with the manufacturer acting as the leader and the retailer as the follower. Firstly, the manufacturer decides the wholesale price and the product carbon footprint based on carbon cap allocated by the government and carbon trading price, and then decides whether to sell or buy carbon permits by comparing the carbon cap and the actual carbon emissions, and to achieve profit maximization. Then, the retailer determines the selling price according to the wholesale price. However, the manufacturer has already anticipated the retailer’s pricing reaction before determining the wholesale price. Therefore, the process of the game can be formulated as follows:
Max f , w M C T = ( w c ) ( a b p ) K ( f 0 f ) 2 + θ X s . t .   ( a b p ) f + X = N    Max p R C T = ( p w ) ( a b p )
In fact, the process of manufacturer and retailer under decentralized decision-making is a two-stage dynamic game with complete information, and the equilibrium is a subgame perfect Nash equilibrium, so we can solve the game using backward induction.
Firstly, substituting X = N ( a b p ) f into the manufacturer’s objective function, we have
M C T = ( w c θ f ) ( a b p ) K ( f 0 f ) 2 + θ N
According to Equation (8), it is easy to verify R C T is a concave function of p , and we get the retailer’s best response function as
p = a + b w 2 b
Then, substituting Equation (9) into Equation (8), the manufacturer’s objective function can be simplified
M C T = 1 2 ( w c θ f ) ( a b w ) K ( f 0 f ) 2 + θ N
Taking the second-order partial derivatives of M C T with respect to w and f , we have the Hessian matrix:
H C T D = ( 2 M C T f 2 2 M C T f w 2 M C T w f 2 M C T w 2 ) = ( 2 K b θ 2 b θ 2 b )
Since 2 M C T / f 2 = 2 K < 0 and | H C T D | = 8 K b b 2 θ 2 > 0 , it is known that M C T is strictly jointly concave in f and p . Therefore, the optimal solutions of this optimization problem exist.
Letting the first-order conditions of the objective function be zero, that is M C T / w = 0 and M C T / f = 0 , and simultaneously solving the two equations, then the optimal product carbon footprint and wholesale price in the decentralized decision-making model are given, respectively, by
{ f C T D * = 8 K f 0 θ ( a b c ) 8 K b θ 2 w C T D * = 4 K ( a + b c + b θ f 0 ) a b θ 2 8 K b b 2 θ 2
Substituting the optimal wholesale price within Equation (11) into Equation (9), we get the retailer’s optimal selling price
p C T D * = 2 K ( 3 a + b c + b θ f 0 ) a b θ 2 8 K b b 2 θ 2
Based on the optimal product carbon footprint and selling price, we can easily get consumer demand, the traded quantity of carbon emissions and the manufacturer and retailer’s profit in the decentralized supply chain system, respectively
Q C T D * = 2 K ( a b c b θ f 0 ) 8 K b θ 2 ,   X C T D * = N 2 K ( a b c b θ f 0 ) [ 8 K f 0 θ ( a b c ) ] ( 8 K b θ 2 ) 2 , M C T D * = K ( a b c b θ f 0 ) + b θ N ( 8 K b θ 2 ) b ( 8 K b θ 2 ) ,   R C T D * = 4 K 2 ( a b c b θ f 0 ) b ( 8 K b θ 2 ) 2 .
.
Proposition 2.
Given that the carbon cap, carbon trading price and the initial carbon footprint, the optimal strategy combination for the manufacturer and retailer is ( f C T D * , w C T D * , p C T D * ), the equilibrium consumer demand is Q C T C * , the traded quantity of carbon emissions is X C T C * and the manufacturer and retailer’s profits are M C T D * and R C T D * , respectively.
Note. With decentralized decision-making, if the carbon cap allocated by the government is relatively large ( N > N 0 C T D ), the manufacturer can sell N N 0 C T D emission permits to the outside market. If the carbon cap is relatively small ( N < N 0 C T D ), then the manufacturer needs to buy N 0 C T D N carbon rights to emit additional carbon emissions from a carbon trading market. If the carbon cap satisfies N = N 0 C T D , then the manufacturer neither sells nor buys carbon permits.
where   N 0 C T D = 2 K ( a b c b θ f 0 ) [ 8 K f 0 θ ( a b c ) ] ( 8 K b θ 2 ) 2 .
Corollary 3.
With decentralized decision-making, given that the carbon cap ( N ):
(a)
If the initial carbon footprint ( f 0 ) and carbon trading price ( θ ) satisfy any of the following two conditions, then the optimal product carbon footprint will decrease with increasing carbon trading price:
  0 < f 0 < γ C T D ,   0 < θ < 2 K b b ;     γ C T D < f 0 < a b c b θ ,   0 < θ < θ 1 C T D .
(b)
If the initial carbon footprint ( f 0 ) and carbon trading price ( θ ) satisfy, respectively, γ C T D < f 0 < a b c b θ and θ 1 C T D < θ < 2 K b b , then the optimal product carbon footprint will increase with increasing carbon trading price,
where   γ C T D = ( a b c ) 2 K b 4 K b ,   θ 1 C T D = 8 K b f 0 2 2 K b [ 8 K b f 0 2 ( a b c ) 2 ] ( a b c ) b .
Corollary 3 shows that, with decentralized decision-making, if the initial carbon footprint of the product is relatively small, the increasing carbon trading price may prompt the manufacturer to reduce the product carbon footprint; if the initial carbon footprint of the product is relatively large, only when the carbon trading price is less than a threshold, the increasing carbon trading price can prompt the manufacturer to reduce the product carbon footprint; otherwise, the increasing carbon trading price does not make the manufacturer to reduce the product carbon footprint.
Corollary 4.
With decentralized decision-making, given that the carbon cap ( N ):
(a)
If the initial carbon footprint ( f 0 ) and carbon trading price ( θ ) satisfy any of the following two conditions, then the optimal sales price will increase with increasing carbon trading price:
  0 < f 0 < γ C T D , 0 < θ < θ 3 CTD ;     γ C T D < f 0 < a b c b θ ,   0 < θ < 2 K b b .
(b)
If the initial carbon footprint ( f 0 ) and carbon trading price ( θ ) satisfy, respectively, 0 < f 0 < γ C T D and θ 3 C T D < θ < 2 K b b , then the optimal selling price will decrease with increasing carbon trading price,
where   θ 3 C T D = a b c ( a b c ) 2 8 K b f 0 2 b f 0 .
Corollary 4 shows that, with decentralized decision-making, if the initial carbon footprint of the product is relatively large, the optimal selling price will increase with increasing carbon trading price; only when the initial carbon footprint of the product is relatively small, and the carbon trading price is in a certain range, the optimal selling price will decrease with increasing carbon trading price.

3.4. The Comparative Analysis of Models

Proposition 3.
Under cap-and-trade regulation, given that the carbon cap ( N ):
(a)
When the initial carbon footprint ( f 0 ) and carbon trading price ( θ ) satisfy any of the following three conditions, regardless of the manufacturer and retailer taking centralized or decentralized decision-making, the optimal product carbon footprint will decrease with increasing carbon trading price:
  0 < f 0 < γ C T D ,   0 < θ < 2 K b b ;     γ C T D < f 0 < γ C T C ,   0 < θ < θ 1 C T D ;   γ C T C < f 0 < a b c b θ ,   0 < θ < θ 1 C T C .
(b)
When the initial carbon footprint ( f 0 ) and carbon trading price ( θ ) satisfy, respectively, γ C T D < f 0 < γ C T C and θ 1 C T D < θ < 2 K b b , if the manufacturer and retailer take centralized decision-making, the optimal product carbon footprint will decrease with increasing carbon trading price; and, if the manufacturer and the retailer take decentralized decision-making, the optimal product carbon footprint will increase with increasing carbon trading price.
(c)
When the initial carbon footprint ( f 0 ) and carbon trading price ( θ ) satisfy, respectively, γ C T C < f 0 < a b c b θ and θ 1 C T C < θ < θ 1 C T D , if the manufacturer and the retailer take centralized decision-making, the optimal product carbon footprint will increase with increasing carbon trading price; and, if the manufacturer and retailer take decentralized decision-making, the optimal product carbon footprint will decrease with increasing carbon trading price.
(d)
When the initial carbon footprint ( f 0 ) and carbon trading price ( θ ) satisfy, respectively, γ C T C < f 0 < a b c b θ and θ 1 C T D < θ < 2 K b b , regardless of the manufacturer and retailer taking centralized or decentralized decision-making, the optimal product carbon footprint will increase with increasing carbon trading price.
Proposition 3 indicates that, under cap-and-trade regulation, when the initial carbon footprint of the product is relatively small, regardless of the manufacturer and retailer taking centralized or decentralized decision-making, the increasing carbon trading price may prompt the manufacturer to reduce the product carbon footprint; when the initial carbon footprint of product is relatively large, the increased carbon trading price can prompt the manufacturer to reduce the product carbon footprint only if in the centralized decision-making, but in the decentralized decision-making, the increased carbon trading price cannot prompt the manufacturer to reduce the product carbon footprint; when the initial carbon footprint of products is larger than a threshold, regardless of the manufacturer and retailer taking centralized or decentralized decision-making, the increased carbon trading price does not make the manufacturer to reduce the product carbon footprint.
This proposition tells us that, under cap-and-trade regulation, for the product with small initial carbon footprint, with the carbon trading price increasing, the manufacturer and the retailer take centralized decision-making, which can prompt the manufacturer to reduce the product carbon footprint. However, for the product with large initial carbon footprint, only when the carbon trading price is less than a threshold, and the manufacturer and retailer take centralized decision-making, then the increasing carbon trading price can prompt the manufacturer to reduce the product carbon footprint.
Proposition 4.
Under cap-and-trade regulation, given that the carbon cap ( N ):
(a)
When the initial carbon footprint ( f 0 ) and carbon trading price ( θ ) satisfy any of the following two conditions, regardless of the manufacturer and retailer taking centralized or decentralized decision-making, the optimal selling price of the product will increase with increasing carbon trading price:
  0 < f 0 < γ C T C ,   0 < θ < θ 3 C T C ;     γ C T C < f 0 < a b c b θ ,   0 < θ < 2 K b b .
(b)
When the initial carbon footprint ( f 0 ) and carbon trading price ( θ ) satisfy any of the following two conditions, if the manufacturer and retailer take centralized decision-making, the optimal selling price of the product will decrease with increasing carbon trading price; and if the manufacturer and retailer take decentralized decision-making, then the optimal selling price of the product will increase with increasing carbon trading price.
  0 < f 0 < γ C T D ,   θ 3 C T C < θ < θ 3 C T D ;     γ C T D < f 0 < γ C T C ,   θ 3 C T C < θ < 2 K b b .
(c)
When the initial carbon footprint ( f 0 ) and carbon trading price ( θ ) are satisfied, respectively, 0 < f 0 < γ C T D and θ 3 C T D < θ < 2 K b b , regardless of the manufacturer and retailer taking centralized or decentralized decision-making, the optimal selling price of the product will decrease with increasing carbon trading price.
Proposition 4 indicates that, under cap-and-trade regulation, when the initial carbon footprint of the product is relatively small, if carbon trading price is less than a threshold, then the optimal selling price of the product will decrease with increasing carbon trading price only if in the centralized decision-making, but in the decentralized decision-making, the optimal selling price of the product will increase with increasing carbon trading price; and if the carbon trading price is more than the threshold, regardless of the manufacturer and retailer taking centralized or decentralized decision-making, the optimal selling price of the product will increase with increasing carbon trading price. When the initial carbon footprint of the product is relatively large, regardless of the manufacturer and retailer taking centralized or decentralized decision-making, the optimal selling price of the product will increase with increasing carbon trading price.
Proposition 5.
Under cap-and-trade regulation, if given the carbon cap, carbon trading price, and the initial carbon footprint, then the equilibrium values of product carbon footprint, selling price, consumer demand and the profit of the whole supply chain system between the centralized and decentralized decision-making are in the following order, respectively:
f C T D * > f C T C * ,   p C T D * > p C T C * ,   Q C T D * < Q C T C * ,   M C T D * + R C T D * < S C C T C * .
The results of Proposition 5 imply that, under cap-and-trade regulation, compared to the centralized decision-making model, when the manufacturer and retailer take decentralized decision-making, on the one hand, the product carbon footprint will increase; and, on the other hand, the selling price increases, thus consumer demand will reduce, which results in a declining total profits for the supply chain system.
Corollary 5.
Under cap-and-trade regulation, if the carbon trading price is given, regardless of the manufacturer and retailer taking centralized or decentralized decision-making, the product carbon footprint, selling price, consumer demand will not change with increasing (decreasing) carbon cap, only the traded quantity of carbon emissions and the profits for the supply chain will decrease with the decreasing carbon cap allocated by the government.
Note. The conclusions of Corollary 5 are similar to the research of Hua et al. [7], Benjaafar et al. [8] and Chen et al. [9]: given a fixed carbon trading price, the carbon emissions quota allocated by the government does not affect the retailer’s order quantities and carbon footprints. In fact, in Corollary 5, if the government reduces the carbon cap for the manufacturer, then the manufacturer has less carbon credit to sell, but to buy additional carbon credit through outside market, so the profits for the supply chain will be reduced.

3.5. The Design of Coordinating Mechanism

From Proposition 5, we find that if the manufacturer and retailer take the decentralized decision-making under cap-and-trade, it will lead inevitably to a “double marginalization” and result in lowering the profits of supply chain system. More importantly, the optimal product carbon footprint is higher than that of in the centralized decision-making. Thus, we try to introduce the two-part tariffs contract to coordinate the supply chain. The specific form of the contract is ( w C T T , F C T ), where w C T T ( > 0 ) is the manufacturer’s wholesale price to the retailer and F C T ( > 0 ) is a fixed fee paid by the retailer to the manufacturer. Therefore, the profits of the manufacturer and retailer under the two-part-tariff contract are as following, respectively.
M C T T = ( w C T T c ) ( a b p ) K ( f 0 f ) 2 + θ X + F C T    s . t .   ( a b p ) f + X = N
R C T T = ( p w C T T ) ( a b p ) F C T
Proposition 6.
Under cap-and-trade regulation, given the carbon trading price and the initial carbon footprint of the product, if the contract parameters ( w C T T , F C T ) satisfy the following condition:
w C T T = 4 K ( c + θ f 0 ) a θ 2 4 K b θ 2 ,   0 < F C T < 4 K 2 ( a b c b θ f 0 ) 2 b ( 4 K b θ 2 ) 2 ,
then the two-part tariffs contract can coordinate the supply chain system.
Proposition 6 provides the conditions that the two-part tariffs will coordinate the supply chain system under cap-and-trade regulation. Specifically, it shows that if the terms of the contract provided by the manufacturer to the retailer meet the corresponding conditions, the optimal strategies can be achieved to those in the centralized decision-making, then the product carbon footprint and selling price will decrease, consumer demand will increase, which will bring more benefits to consumers, the performance of supply chain system will also be improved. Therefore, the members of the supply chain, consumers and natural environment have all benefited from the coordination mechanism, and achieve a win–win situation for economic development and ecological protection.

4. Numerical Examples

In this section, we will provide several numerical examples with a sensitivity analysis to illustrate the theoretical results and gain more insights from our modeling framework. Based on the previous assumptions and constraints in Equations (1) and (2), the common parameters in our models are assigned: a = 200 , b = 2 , c = 40 , K = 17 , θ ( 0 , 5 ) . In addition, from Propositions 3 and 4, we learn that the different initial carbon footprint of products have significant impacts on the product carbon footprint and pricing decisions for the manufacturer and retailer. Therefore, we use three different initial carbon footprint ( f 0 = 6 , f 0 = 9 , f 0 = 11 ) separately to compare the effects of the carbon cap and carbon trading price on the product carbon footprint, selling price, consumer demand, the profits of centralized and decentralized decision-making models and coordination mechanism for the supply chain.
It is known that there are many factors influencing the carbon trading price under cap-and-trade regulation, for example the financial crisis of 2008 resulted in serious setbacks in industrial production, thus the consumption of electricity and coal decreased, and carbon emissions were correspondingly reduced, making the market demand for carbon quota decline, resulting in carbon trading prices decreasing (Daskalakis et al. [30]). The European Union proposed an aviation carbon tax in 2011, which brought about a rapid increase in demand for carbon permits and resulted in increasing carbon trading price. The EU slashed the amount of carbon cap free allocation in 2013, thus some firms believed that the government might strictly control carbon emissions in the future, thus the demand for carbon emission quota increased rapidly, which caused carbon trading prices to increase (Zhang and Wei [31]).
Meanwhile, many scholars research the important issue of which factors affect carbon trading price. Further details can be found in the literature: Seifert et al. [26], Aatola et al. [27], and Zhang et al. [28]. Based on these studies, we summarize the factors of carbon trading price including the impact of the policy (energy policy, fiscal policy, and environmental policy), the impact of the economic environment, the impact of energy (oil, natural gas and coal) prices, the carbon emissions control and quota allocation, etc. Based on the above findings, two main factors cause the fluctuation of carbon trading price: the first one is the economic and policy factors, which is exogenous; and the second one is the distribution of carbon quota, which is controlled by the government.
Therefore, the following discussions will be divided into two cases:
CT1: Given the carbon cap ( N = 300 ), the carbon trading price is an exogenous variable, which means that the amount of carbon allowances allocated by the government has been fixed already, but some external factors cause the fluctuation of carbon trading price to some extent.
CT2: Similar to the assumption in the study by Hua et al. [7], the carbon trading price is a decreasing function of the carbon cap, which means that, if the government reduces the amount of carbon allowances, then the carbon trading prices are likely to rise. In consideration of the constraint conditions of the model parameters, the functional form of the carbon trading prices can be shown as θ = 5 0.01 N .
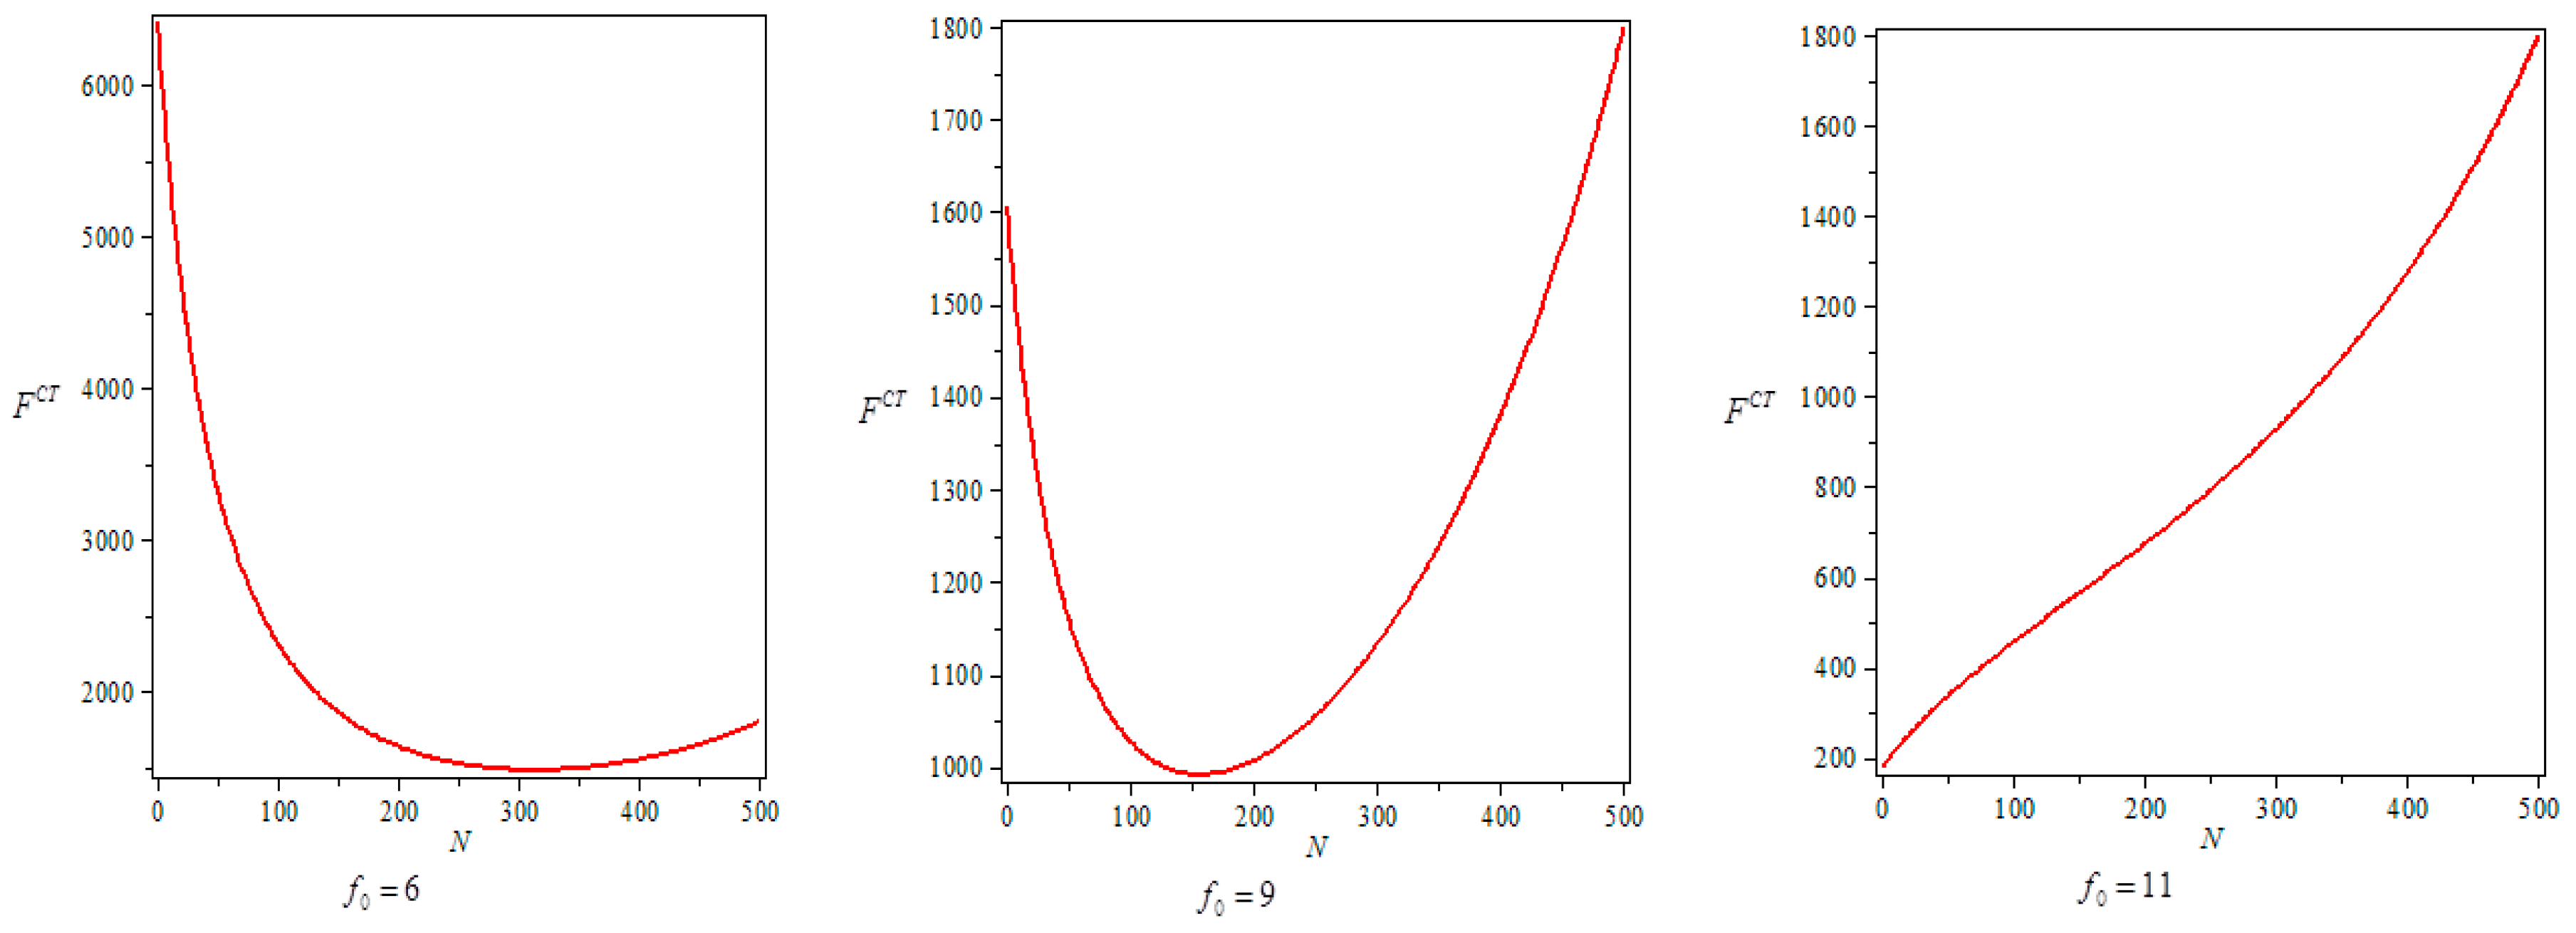
Next, we will discuss the effects of the carbon trading price and the carbon cap on the product carbon footprint, selling price, consumer demand, the profits and coordination mechanism for the supply chain, as shown in Figures 1–12.

4.1. The Effects of Carbon Trading Price on Product Carbon Footprint

Figure 1 shows that, when the initial carbon footprint of the product is relatively small ( f 0 = 6 ), regardless of the manufacturer and retailer taking centralized or decentralized decision-making, the product carbon footprint decrease as the carbon trading price increases; when the initial carbon footprint of products is relatively large ( f 0 = 9 ), the product carbon footprint decrease as the carbon trading price increases in centralized decision-making, but the product carbon footprint decreases first and then increases as the carbon trading price increases in decentralized decision-making; and when the initial carbon footprint of products is large ( f 0 = 11 ), regardless of the manufacturer and the retailer taking centralized or decentralized decision-making, the product carbon footprint decreases first and then increases as the carbon trading price increases.
The analysis results of Figure 1 show that, under cap-and-trade regulation, for the product with small initial carbon footprint, regardless of the manufacturer and retailer taking centralized or decentralized decision-making, the increasing carbon trading price may motivate the manufacturer to reduce product carbon footprint. For the product with relatively large initial carbon footprint, only in centralized decision-making, the increasing carbon trading price can motivate the manufacturer to reduce product carbon footprint, but in centralized decision-making, the increasing carbon trading price does not completely motivate the manufacturer to reduce product carbon footprint. For the product with large initial carbon footprint, regardless of the manufacturer and retailer taking centralized or decentralized decision-making, the increasing carbon trading price does not completely make the manufacturer reduce product carbon footprint.

4.2. The Effects of Carbon Trading Price on Selling Price

Figure 2 shows that, when the initial carbon footprint of the product is relatively small ( f 0 = 6 ), regardless of the manufacturer and retailer taking centralized or decentralized decision-making, the selling price increases first and then decreases as the carbon trading price increases; when the initial carbon footprint of the product is relatively large ( f 0 = 9 ), the selling price increase first and then decrease as the carbon trading price increases in centralized decision-making, but in decentralized decision-making, the selling price increase as the carbon trading price increases; and when the initial carbon footprint of the product is large ( f 0 = 11 ), regardless of the manufacturer and retailer taking centralized or decentralized decision-making, the selling price increase as the carbon trading price increases.
The analysis results in Figure 2 show that, under cap-and-trade regulation, for the product with small initial carbon footprint, the retailer should adopt the pricing strategy with first increase and then decrease for the product as the carbon trading price increases; for the products with relatively large initial carbon footprint, the retailer should adopt the pricing strategy with first increase and then decrease for the product in centralized decision-making, but in decentralized decision-making, the retailer should adopt the price reduction strategy; and for the product with large initial carbon footprint, whether it utilizes centralized or decentralized decision-making, the retailer should lower prices with the increasing of the carbon trading price.

4.3. The Effects of Carbon Trading Price on Consumer Demand

Figure 3 shows that, when the initial carbon footprint of the product is relatively small ( f 0 = 6 , f 0 = 9 ), consumer demand decreases first and then increases as the carbon trading price increases in centralized decision-making, but in decentralized decision-making, consumer demand decrease as the carbon trading price increases; when the initial carbon footprint of products is relatively large ( f 0 = 11 ), whether it is centralized or decentralized, consumer demand decreases as the carbon trading price increases. This conclusion shows that, if the manufacturer and retailer strengthen coordination and cooperation under cap-and-trade regulation, the increasing of the carbon trading price will make consumer demand for the product with small initial carbon footprint increase.

4.4. The Effects of Carbon Trading Price on Supply Chain Profits

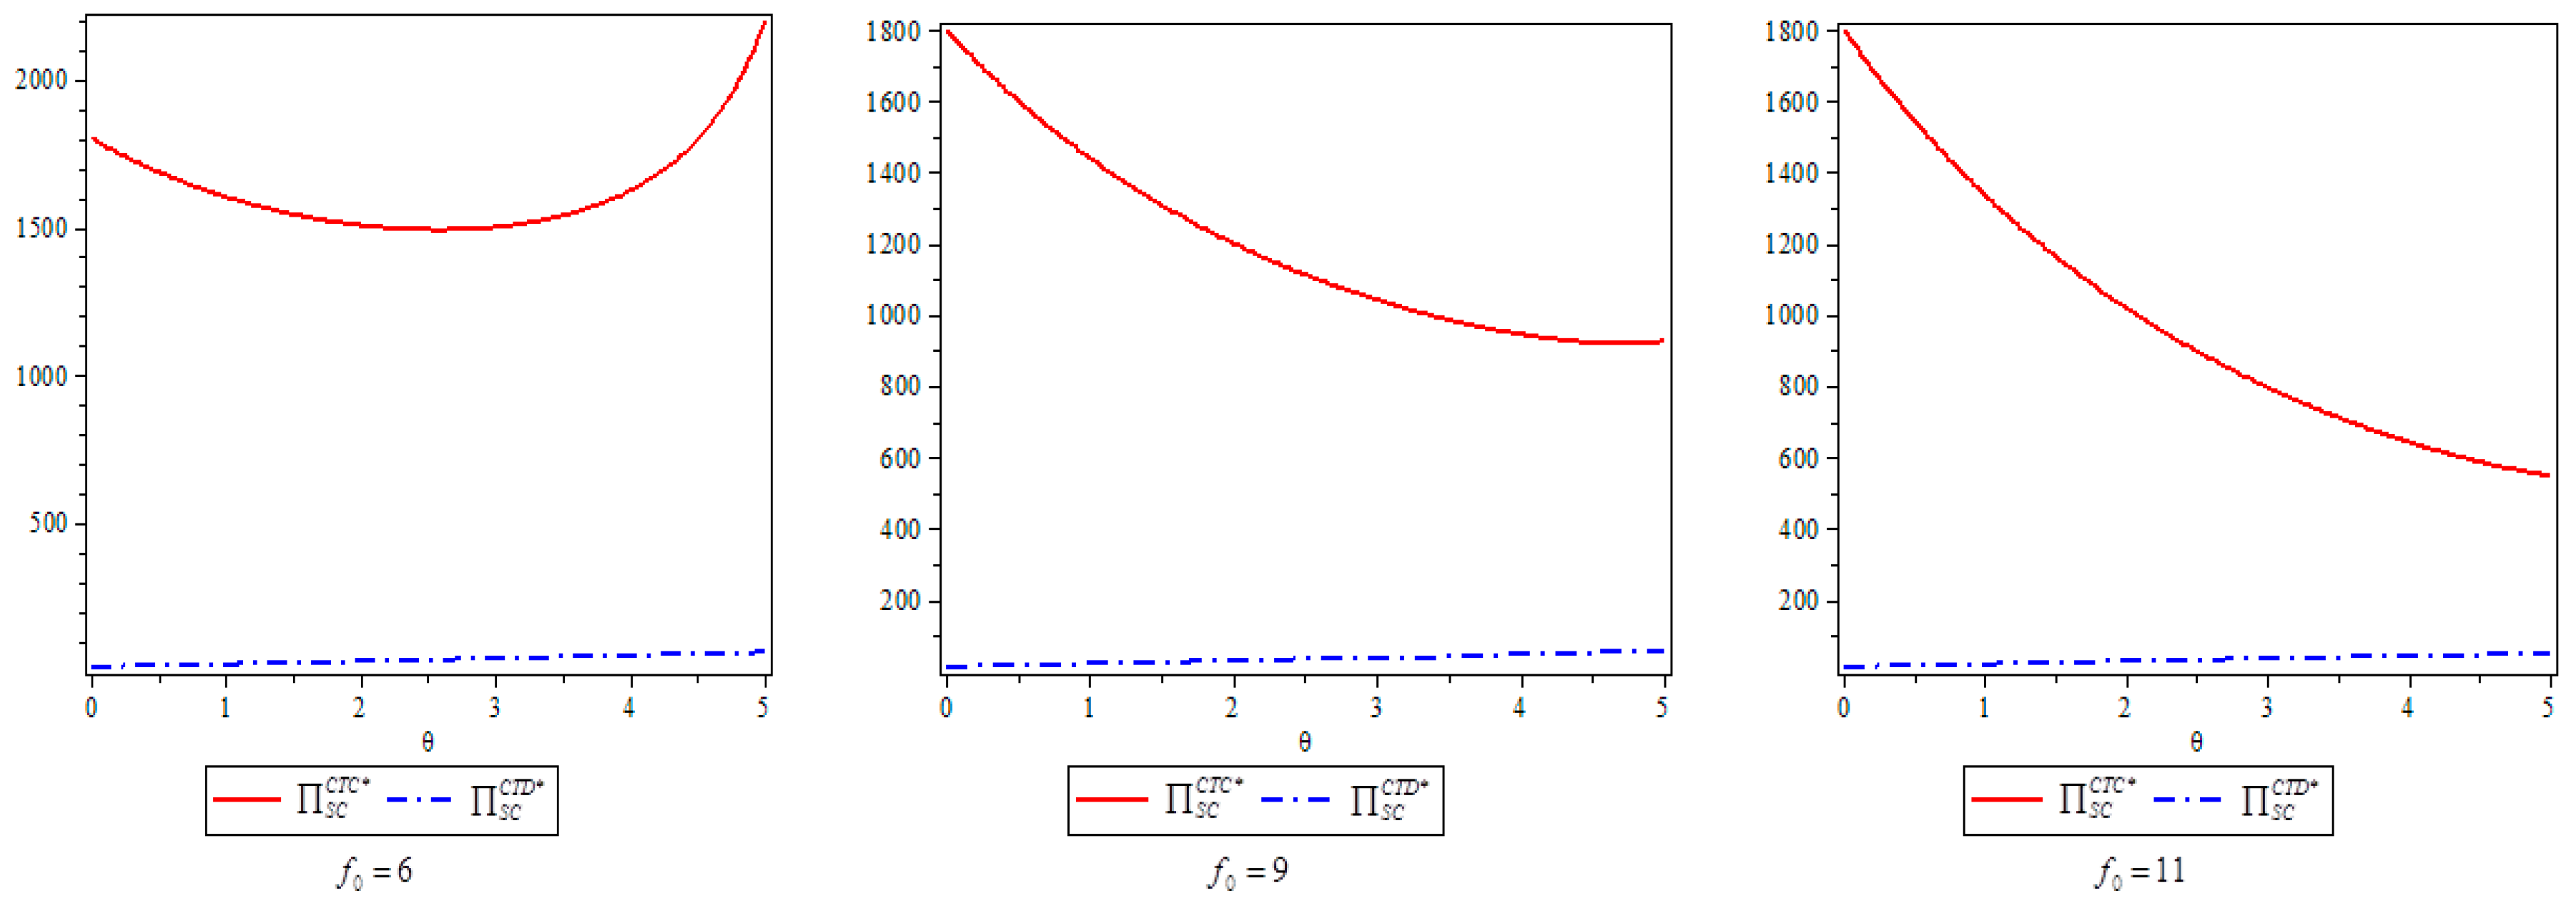
Figure 4 shows that, when the initial carbon footprint of the product is relatively small ( f 0 = 6 ), the profits of the supply chain decrease first and then increase as the carbon trading price increases in centralized decision-making; when the initial carbon footprint of the product is relatively large ( f 0 = 9 or f 0 = 11 ), the profits of the supply chain decrease as the carbon trading price increases in the centralized decision-making. It should be stated that, although the profits of supply chain in the decentralized decision-making increase as the carbon trading price increases, it is much less than that of the centralized decision-making. Therefore, the manufacturer and retailer should strengthen coordination and cooperation under cap-and-trade regulation, especially for the product with initial small carbon footprint as, if the carbon trading price is greater than a threshold, the profits of supply chain will increase as the carbon trading price increases.
Figure 1, Figure 2, Figure 3 and Figure 4 show that, if the carbon cap is given, compared with the centralized decision-making, the product carbon footprint is relatively greater and the selling price is relatively higher in the decentralized decision-making, those results in the declining of consumer demand and the profits of the supply chain. However, the two-part-tariff contract in Proposition 6 has coordinated the supply chain perfectly. Thus, Figure 5 and Figure 6 analyze the effects of carbon trading price on coordination mechanism (wholesale price and fixed fee).

4.5. The Effects of Carbon Trading Price on the Coordination Mechanism

In Figure 5 and Figure 6, we can see that, when the initial carbon footprint of the product is relatively small ( f 0 = 6 , f 0 = 9 ), the wholesale price increases first and then decreases as the carbon trading price increases, but the fixed fee decreases first and then increases as the carbon trading price increases; and when the initial carbon footprint of the product is large ( f 0 = 11 ), the wholesale price increase as the carbon trading price increases, but the fixed fee increase as the carbon trading price increases. Therefore, only the manufacturer dynamically adjusts the wholesale price ( w C T ) and fixed fee ( F C T ) according to the initial carbon footprint and the carbon trading price, then the two-part tariff contract can achieve the coordination of supply chain.
Figure 1, Figure 2, Figure 3, Figure 4, Figure 5 and Figure 6 analyze the impacts of the carbon trading price on the product carbon footprint, selling price, consumer demand, the profits of the supply chain and the coordination mechanism (the two-part tariff contract); these conclusions have important reference value for the manufacturer and retailer to make decisions on the product carbon footprint and selling price, and design the coordination mechanism for the supply chain. Moreover, Figure 1, Figure 2, Figure 3, Figure 4, Figure 5 and Figure 6 also show the impacts of the carbon trading price on consumer demand and the profits of the supply chain, which have guiding significances for the government to evaluate the impacts of the cap-and-trade regulation on carbon emissions reduction and the performance of the supply chain.
It is worth noting that, in Figure 1, when the initial carbon footprint of the product is large ( f 0 = 11 ), whether it utilizes centralized or decentralized decision-making, if the carbon trading price is greater than a threshold, the product carbon footprint increases gradually with the increasing carbon trading price. This illustrates that the increased carbon trading price does not completely motivate the manufacturer to reduce the product carbon footprint, thus the government should impel the manufacturer to reduce their carbon footprint by controlling their carbon allowances (that is, the carbon cap). Of course, the controlling of the carbon cap may have some impacts on decision variables and coordination mechanisms. Therefore, Figures 7–12 analyze the effects of the carbon cap on the product carbon footprint, selling price, consumer demand, and coordination mechanism of the supply chain.

4.6. The Effects of Carbon Cap on Product Carbon Footprint

Figure 7 shows that, when the initial carbon footprint of the product is relatively small ( f 0 = 6 ), whether it is centralized or decentralized, the product carbon footprint decreases as the carbon cap decreases; when the initial carbon footprint of the product is relatively large ( f 0 = 9 ), the product carbon footprint decreases as the carbon cap decreases in the centralized decision-making, but in the decentralized decision-making, the product carbon footprint decreases first and then increases as the carbon cap decreases; and when the initial carbon footprint of the product is large ( f 0 = 11 ), regardless of the manufacturer and retailer taking the centralized or decentralized decision-making, the product carbon footprint decrease first and then increase as the carbon cap decreases. Therefore, based on the analysis in Figure 1 and Figure 7, the following conclusions can be drawn:
(1)
For the product with small initial carbon footprint ( f 0 = 6 ), whether it is centralized or decentralized, with the increasing of carbon trading price, the government should cut down the carbon cap to impel the manufacturer to reduce the product carbon footprint.
(2)
For the product with large initial carbon footprint ( f 0 = 9 ), with the decreasing of the carbon trading price, if the manufacturers and retailer take the centralized decision-making, the government should cut the carbon cap to impel the manufacturer to reduce the product carbon footprint. However, if the manufacturer and retailer take the decentralized decision-making, the government should first cut and then increase the carbon cap to motivate the manufacturer to reduce the product carbon footprint.
(3)
For the product with great initial carbon footprint ( f 0 = 11 ), whether it is centralized or decentralized, with the increasing of the carbon trading price, the government should first cut and then increase the carbon cap to motivate the manufacturer to reduce the product carbon footprint.

4.7. The Effects of Carbon Cap on Selling Price

Figure 8 shows that, when the initial carbon footprint of the product is relatively small ( f 0 = 6 , f 0 = 9 ), the selling prices increases first and then decreases as the carbon cap decreases in the centralized decision-making, but in the decentralized decision-making, the selling prices increases as the carbon cap decreases; and when the initial carbon footprint of the product is large ( f 0 = 11 ), regardless of the manufacturer and retailer taking the centralized or decentralized decision-making, the selling prices increase as the carbon cap decreases. The analysis results in Figure 8 show that, under cap-and-trade mechanism, for the product with small initial carbon footprint, if the government cuts the carbon cap, then the retailer should decreases first and then increases the selling price in the centralized decision-making, but in the decentralized decision-making, the retailer should increase the selling price; and for the product with large initial carbon footprint, whether it is centralized or decentralized, the retailer should increase the selling price.

4.8. The Effects of Carbon Cap on Consumer Demand

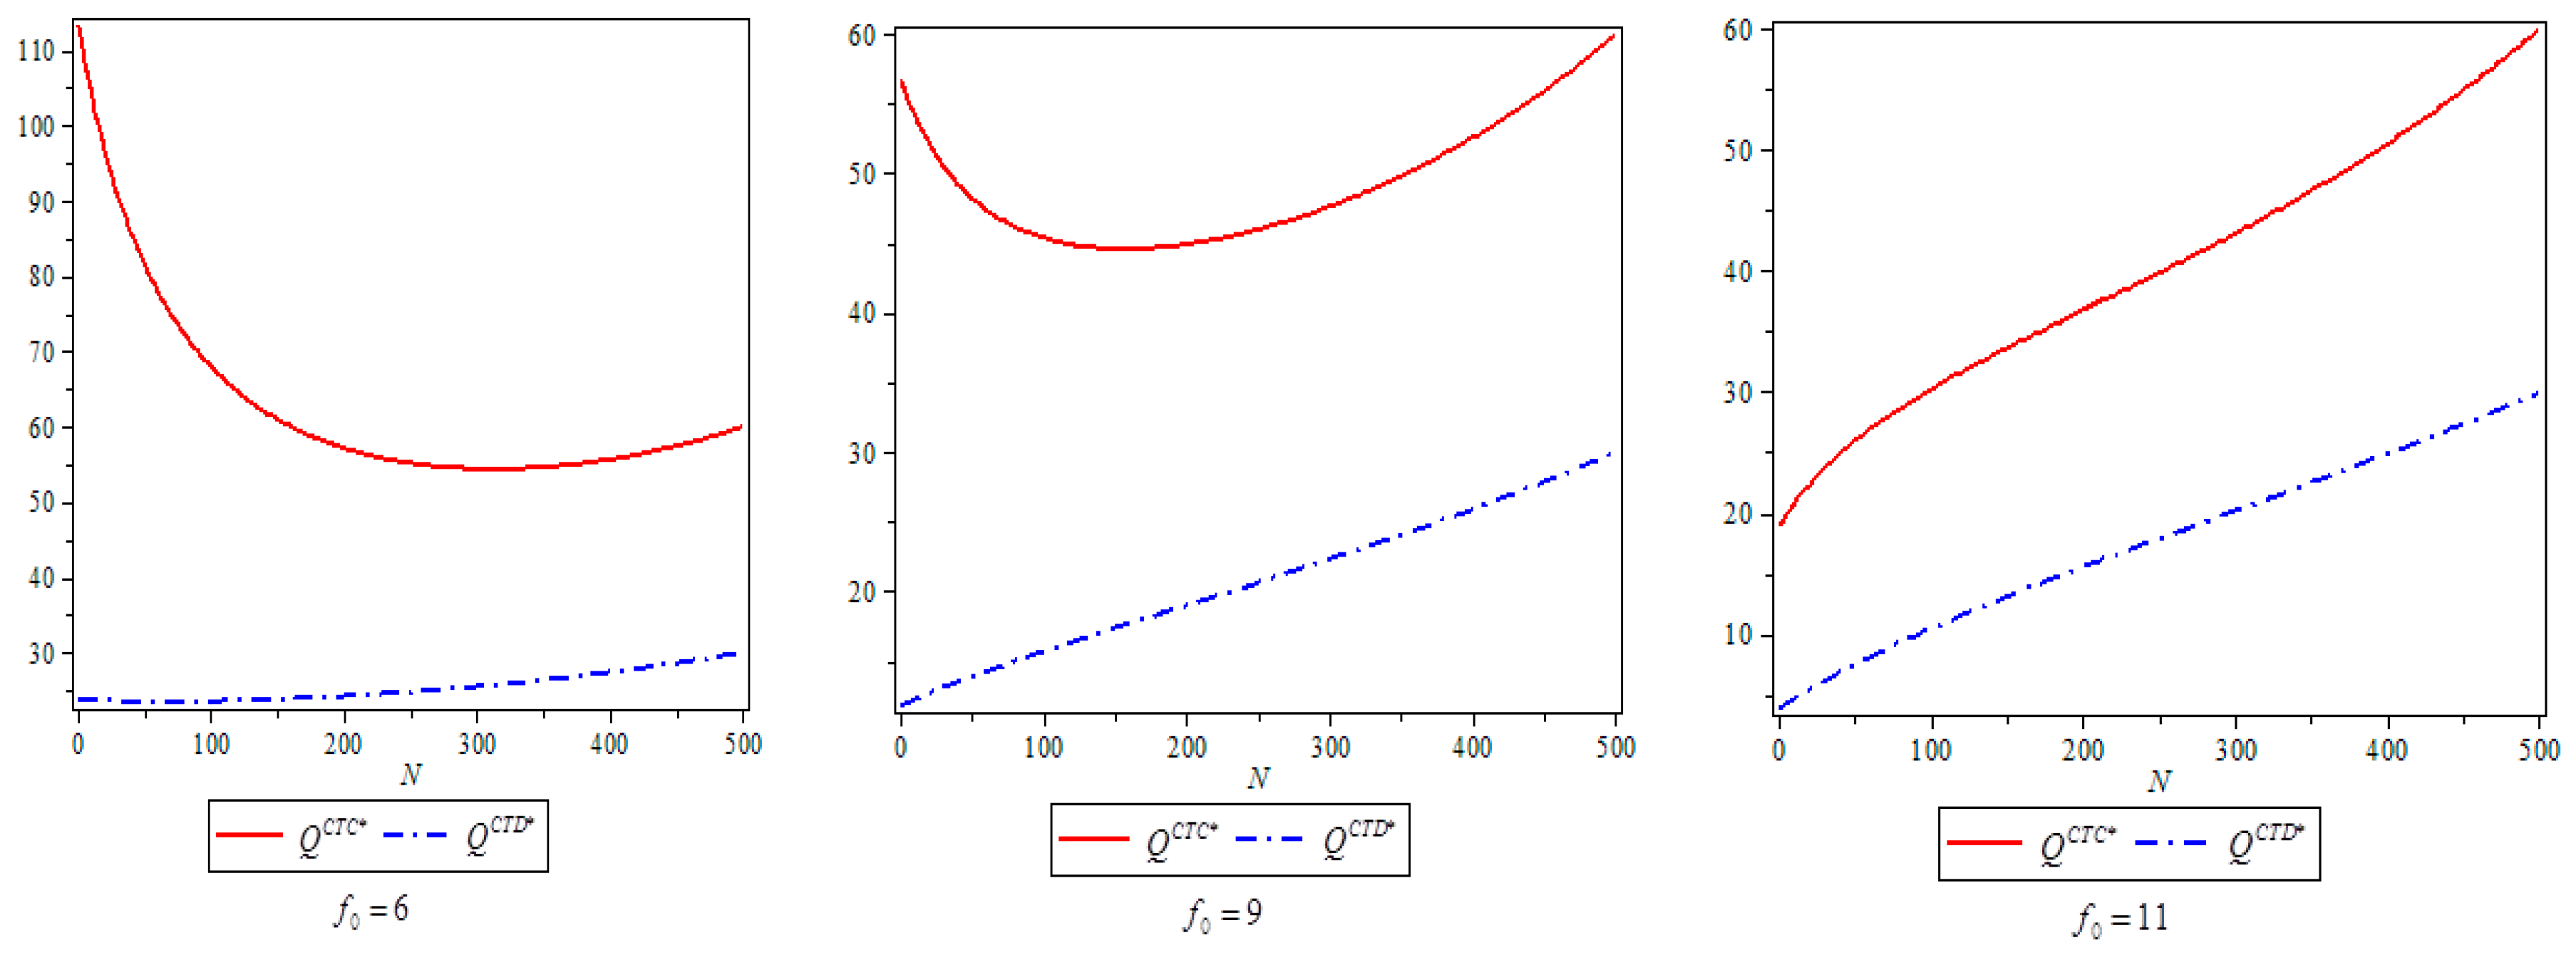
Figure 9 shows that, when the initial carbon footprint of the product is relatively small ( f 0 = 6 , f 0 = 9 ), consumer demand decreases first and then increases as the carbon cap decreases in the centralized decision-making, but in the decentralized decision-making, consumer demand decreases as the carbon cap decreases; and when the initial carbon footprint of the product is large ( f 0 = 11 ), regardless of the manufacturer and retailer taking the centralized or decentralized decision-making, consumer demand decreases as the carbon cap decreases.

4.9. The Effects of Carbon Cap on the Profits of the Supply Chain

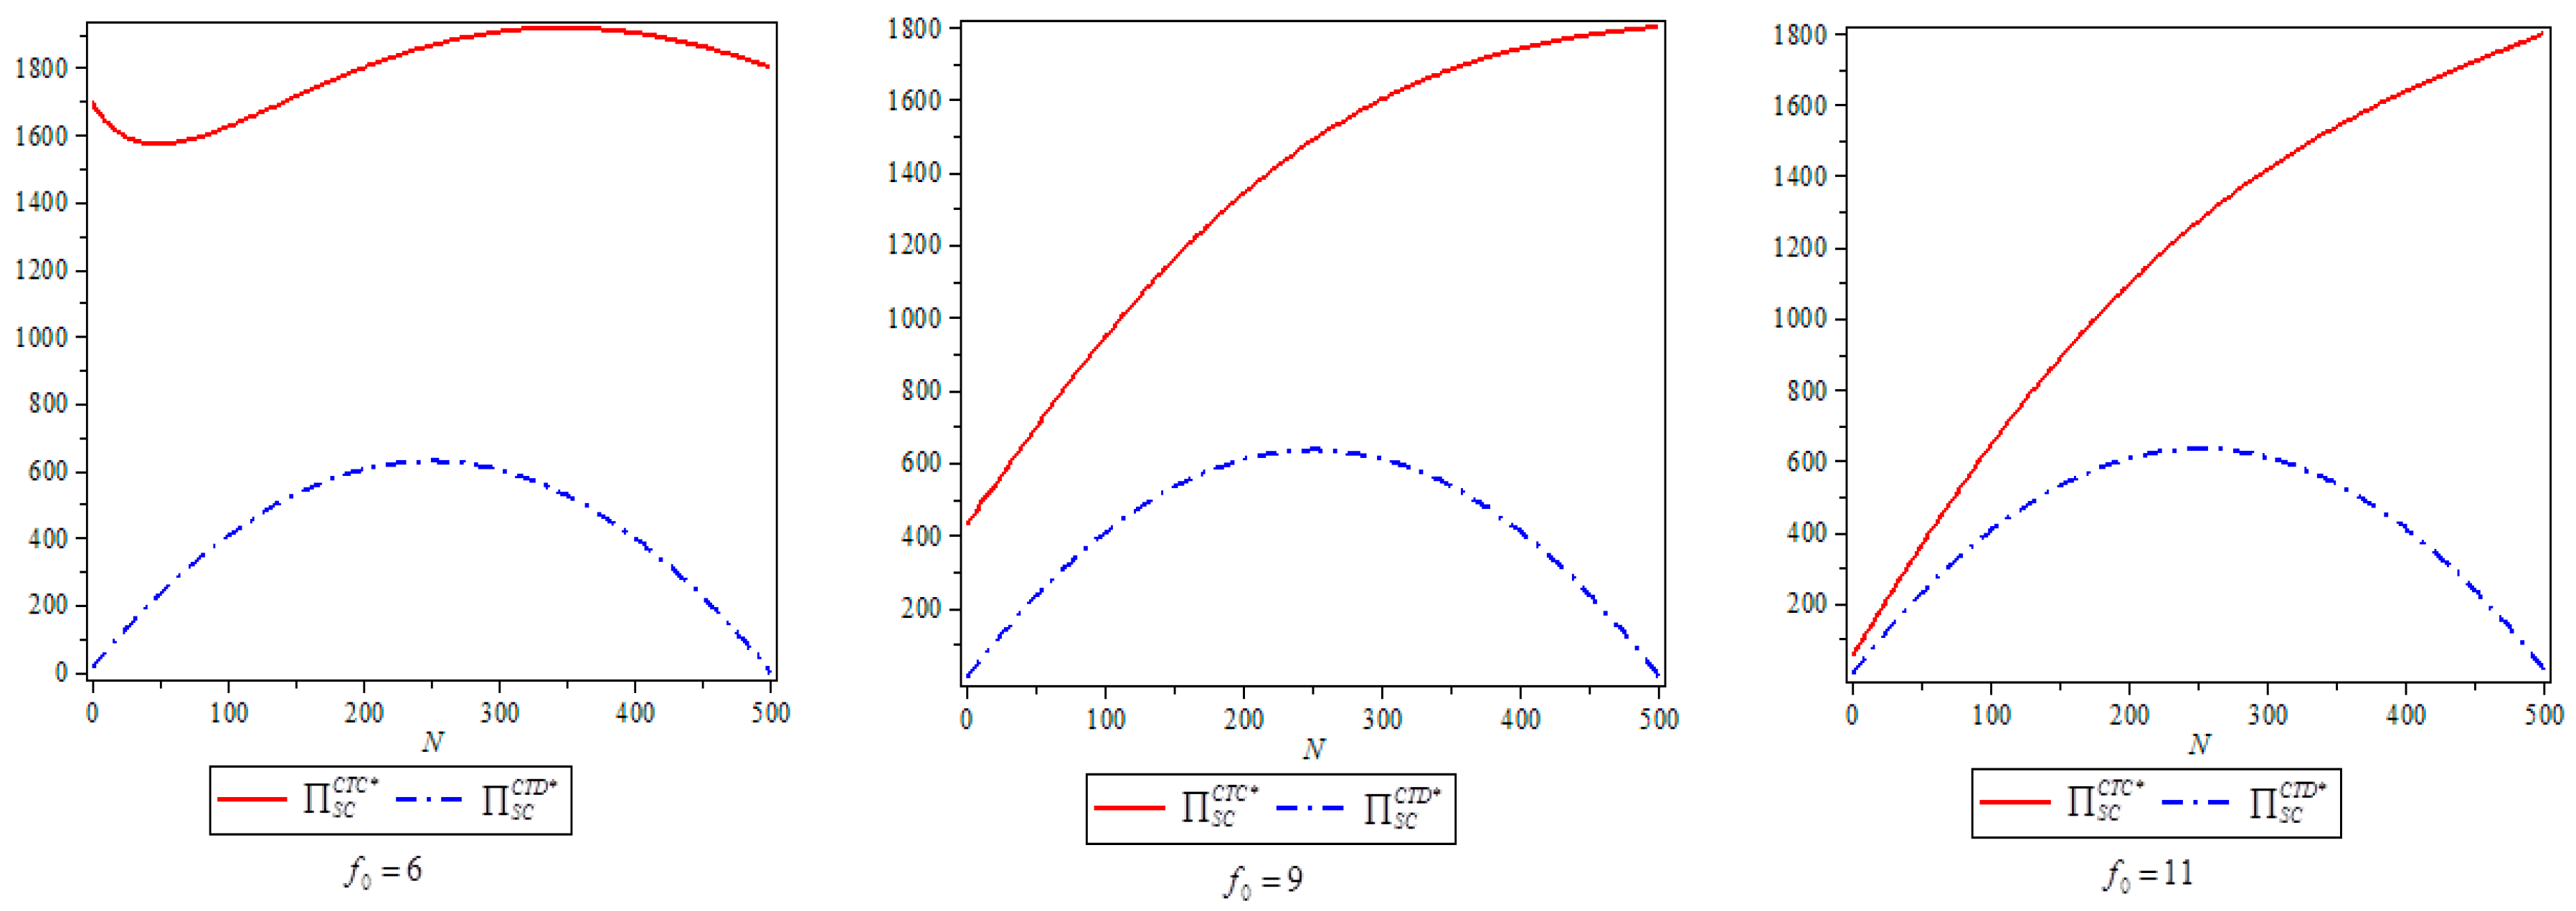
Figure 10 shows that, when the initial carbon footprint of the product is relatively small ( f 0 = 6 ), the profits of the supply chain in the centralized decision-making decreases first and then increases as the carbon cap decreases; and when the initial carbon footprint of the product is large ( f 0 = 9 , f 0 = 11 ), the profits of the supply chain in the centralized decision-making decrease as the carbon cap decreases, but in the decentralized decision-making, whether the initial carbon footprint of products is small or large, the profits of the supply chain decrease first and then increase as the carbon cap decreases.

4.10. The Effects of Carbon Cap Price on the Coordination Mechanism

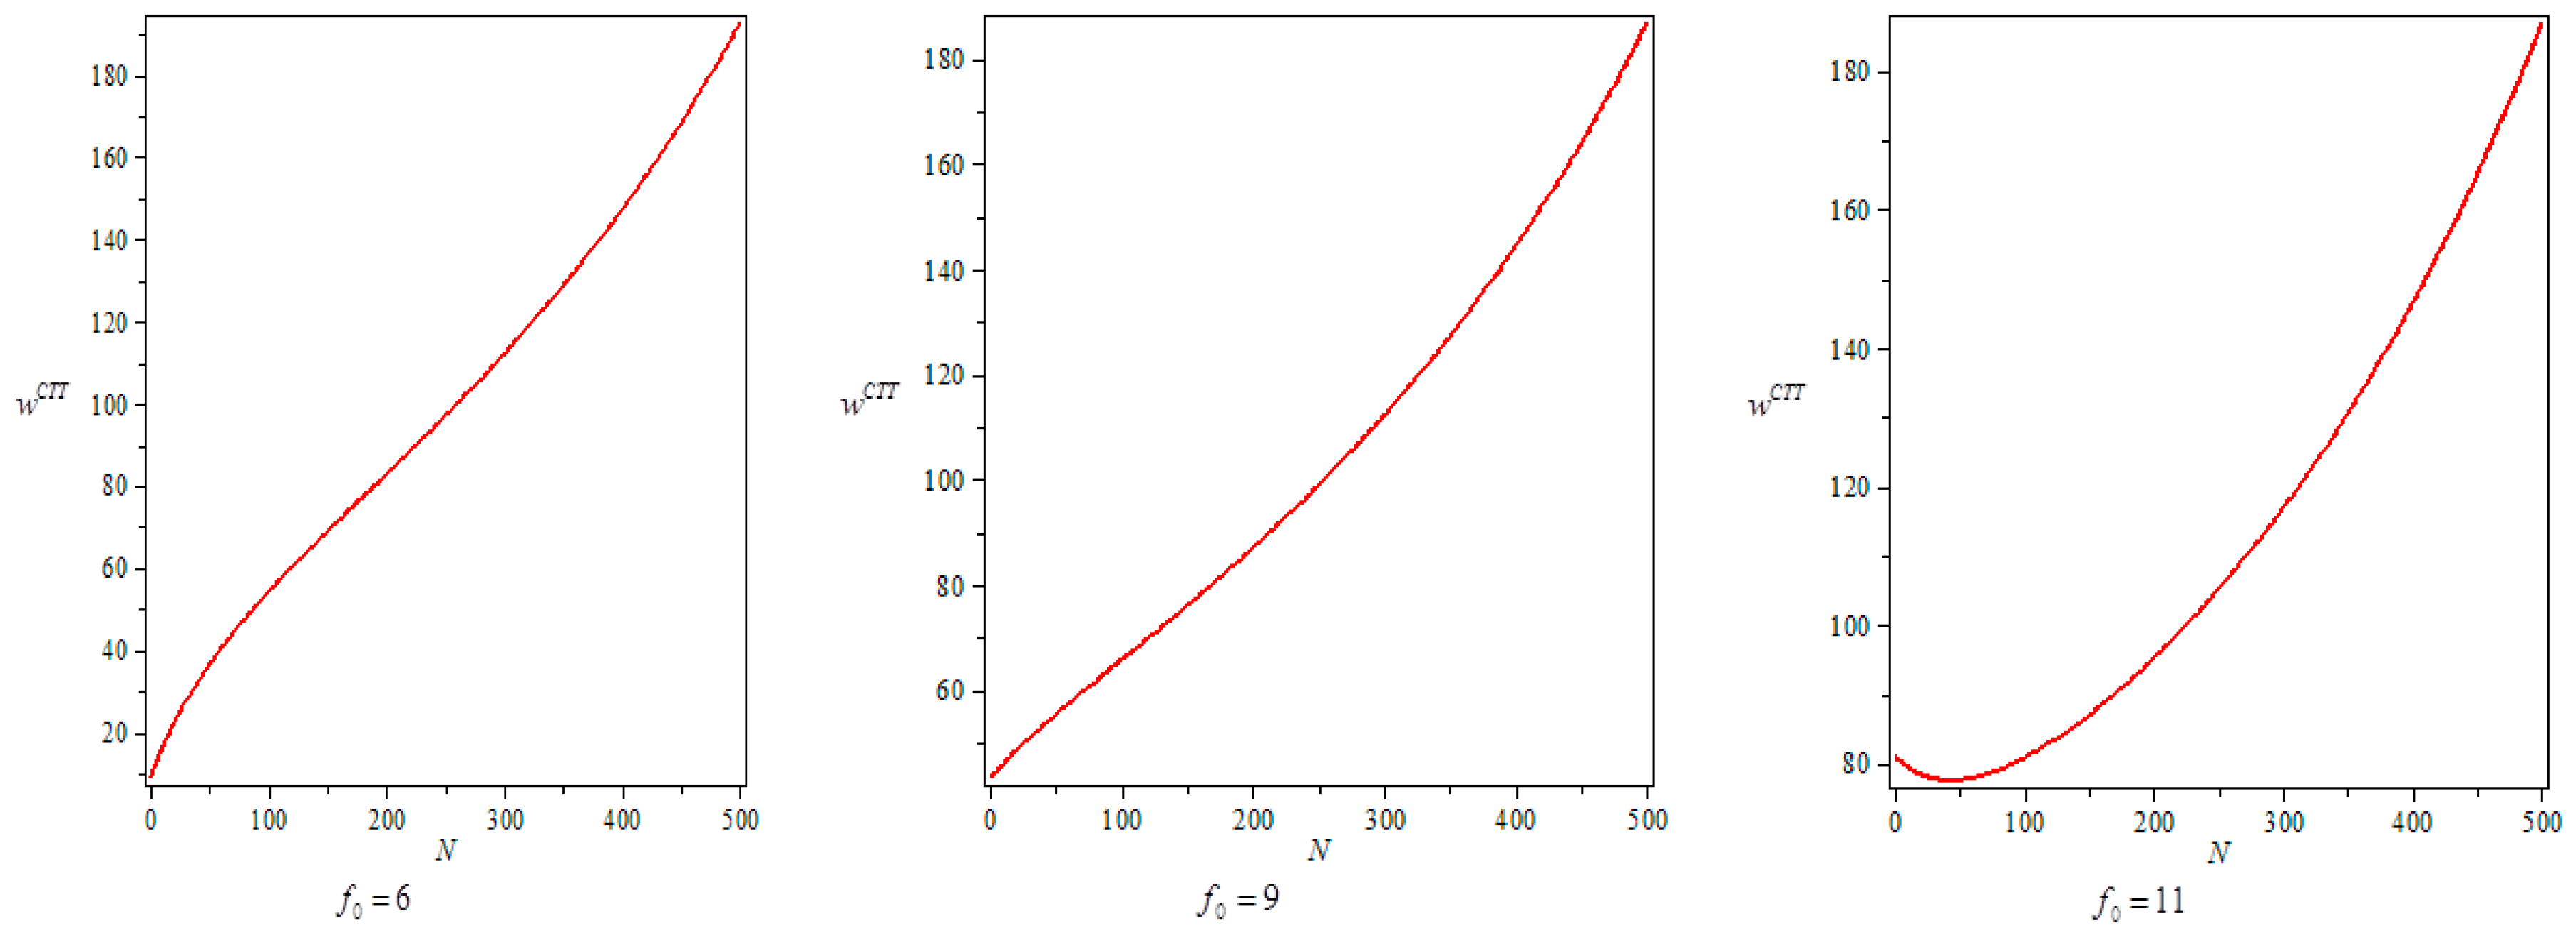
In Figure 11 and Figure 12, we can see that, when the initial carbon footprint of the product is relatively small ( f 0 = 6 , f 0 = 9 ), the wholesale prices decrease as the carbon cap decreases, and the fixed fees decrease first and then increase as the carbon cap decreases; and when the initial carbon footprint of the product is large ( f 0 = 11 ), the wholesale price decreases first and then increases as the carbon cap decreases, and the fixed fee decreases as the carbon cap decreases. Therefore, the manufacturer should dynamically adjust the wholesale price ( w C T ) and the fixed fee ( F C T ) according to different initial carbon footprint and the range of the carbon cap reduced by the government, then the supply chain system will be coordinated with the two-part tariff contract.

5. Conclusions and Future Research

Motivated by real industrial practices, in this paper, we develop an analytical modeling framework to investigate the pricing and product carbon footprint decisions of the supply chain under cap-and-trade regulation by applying optimization and game theory. In addition, we solve the “double marginalization” and achieve the coordination of supply chain system through the two-part tariff contract, and also discuss the effects of the carbon cap and the carbon trading price on the product carbon footprint, selling price, consumer demand, and the profit of the supply chain and its coordination mechanism.
Our modeling framework obtains some new results differing from those in the existing literature. It is found that, under cap-and-trade regulation, the product carbon footprint and selling price not only depend on the carbon trading price and the carbon cap allocated by the government, but also relate to the initial carbon footprint of the product and the decision-making method of the supply chain, and only the manufacturer adjusts dynamically the wholesale price and the fixed fee within the two-part tariff contract, and, according to different initial carbon footprint and the range of the carbon cap reduced by the government, the supply chain system will be coordinated with the two-part tariff contract. The specific conclusions of our modeling framework are as follows:
(1)
Under cap-and-trade regulation, when the initial carbon footprint of the product is relatively small, regardless of the manufacturer and retailer taking the centralized or decentralized decision-making, the product carbon footprint decreases with the rising of carbon trading price, and also decreases with the decreasing of the carbon cap. The selling price first increases and then decreases with the increasing of carbon trading price, and also first increases and then decreases with the decreasing of the carbon cap.
(2)
Under cap-and-trade regulation, when the initial carbon footprint of the product is relatively large, if the manufacturer and retailer take centralized decision-making, then the product carbon footprint decreases with the increasing of carbon trading price, and also decreases with the decreasing of the carbon cap, the selling price first increases and then decreases with the increasing of carbon trading price, and also first increases and then decreases with the decreasing of the carbon cap; and if the manufacturer and retailer take the centralized decision-making, then the product carbon footprint first decreases and then increases with the increasing of carbon trading price, and also first decreases and then increases with the decreasing of the carbon cap, the selling price increases with the increasing of carbon trading price, and also first increases and then decreases with the decreasing of the carbon cap.
(3)
Under cap-and-trade regulation, when the initial carbon footprint of the product is large, regardless of the manufacturer and retailer taking the centralized or decentralized decision-making, the product carbon footprint first decreases and then increases with the increasing of carbon trading price, and also first decreases and then increases with the decreasing of the carbon cap; and the selling price increases with the increasing of carbon trading price, and also increases with the decreasing of the carbon cap.
(4)
Under cap-and-trade regulation, when the initial carbon footprint of the product is relatively small, the manufacturer’s wholesale price first increases and then decreases with the increasing of carbon trading price, and also decreases with the decrease of the carbon cap, and the fixed fee first decreases and then increases with the increasing of carbon trading price, and also first decreases and then increases with the decreasing of the carbon cap; and when the initial carbon footprint of the product is relatively large, the manufacturer’s wholesale price increases with the increasing of carbon trading price, and also first decreases and then increases with the decreasing of the carbon cap, and the fixed fee decreases with the increasing of carbon trading price, and also decreases with the decreasing of the carbon cap, then the contract can solve the “double marginalization” problem and coordinate the supply chain system.
Based on the conclusion of this study, we can get the following management inspiration.
Under cap-and-trade regulation, the government can motivate the manufacturer to reduce the product carbon footprint according to different initial carbon footprints and the change of carbon trading price, and must be complemented by controlling the carbon cap. The specific circumstances are as follows:
(1)
For the product with small initial carbon footprint, the increasing of carbon trading price may inspire the manufacturer to reduce the product carbon footprint, but, if the carbon trading price is low, then the government can encourage the manufacturer to reduce their carbon footprint by reducing the carbon cap.
(2)
For the product with large initial carbon footprint, in the centralized decision-making, the increasing of carbon trading price may inspire the manufacturer to reduce the product carbon footprint. Contrary, if carbon trading price is low, then the government can motivate the manufacturer to reduce their carbon footprint by reducing the carbon cap. In the decentralized decision-making, the increasing of carbon trading price cannot inspire the manufacturer to reduce the product carbon footprint, and then the government can first decrease and then increase the carbon cap to inspire the manufacturer to reduce the product carbon footprint.
(3)
For the product with great initial carbon footprint, such as some high energy consumption, high-emission product, the increaseof carbon trading price cannot promote the manufacturer to reduce product carbon footprint. Therefore, if the carbon trading price increases, the government should first decrease and then increase the carbon cap to motivate the manufacturer to reduce the product carbon footprint.
There are several limitations in this paper, but some of them have potential for further studies in this important field. Firstly, to simplify the discussion, the model considers joint pricing and product carbon footprint decisions only in one period, so we can further discuss a multi-period problem in the supply chain (Kumar et al. [32]). Secondly, the model does not allow us to study demand uncertainty. In the future, we could relax this assumption and consider that consumers have uncertain expectations for the products, and discuss the effect of demand uncertainty and risk assessment on supply chain cooperation under the cap-and-trade regulation (Fera et al. [33] and Martino et al. [34]). Another possible extension is to analyze other supply chain structures such as competing manufacturers selling their products through a single retailer, or competing retailers order from a common manufacturer. This leads to a potential research opportunity.

Acknowledgments

This work was supported by Humanities and Social Science Foundation of Chinese Ministry of Education (16YJC630012), the Key Project of Natural Science Research of Higher Education of Anhui Province (KJ2016A052), the Scientific Research Foundation for the Introduction of Talents of Anhui Polytechnic University (2015YQQ009) and the National Natural Science Foundation of China (71671001).

Author Contributions

Yonghong Cheng and Zhongkai Xiong developed the model and conducted the analysis. Yonghong Cheng, Zhongkai Xiong and Qinglin Luo performed the research and wrote the paper. All authors read and approved the final manuscript.

Conflicts of Interest

The authors declare no conflict of interest.

Appendix A

Proof of Corollary 1.
From Proposition 1, we know that f C T C * θ = ( a b c ) b θ 2 + 8 K b f 0 θ 4 K ( a b c ) ( 4 K b θ 2 ) 2 . To simplify discussion, we denote Z 1 C T C ( θ ) = ( a b c ) b θ 2 + 8 K b f 0 θ 4 K ( a b c ) . Clearly, Z 1 C T C ( θ ) is a quadratic function with a parabola going downwards and its discriminant is Δ Z 1 C T C ( θ ) = 16 K b [ 4 K b f 0 2 ( a b c ) 2 ] . It is not difficult to find that, if f 0 > ( a b c ) K b 2 K b , then Δ Z 1 C T C ( θ ) > 0 , and Z 1 C T C ( θ ) has two intersections with the horizontal axis, respectively, θ 1 C T C = 4 K b f 0 2 K b [ 4 K b f 0 2 ( a b c ) 2 ] ( a b c ) b and θ 2 C T C = 4 K b f 0 + 2 K b [ 4 K b f 0 2 ( a b c ) 2 ] ( a b c ) b .
Based on the constraints in Equation (1), we know that 0 < θ < a b c b f 0 and 4 K f 0 a b c > a b c b f 0 . Obviously, the point θ 2 C T C does not satisfy the assumption, so it will not be discussed. Therefore, if 0 < θ < θ 1 C T C , then Z 1 C T C ( θ ) < 0 , that is f C T C * θ < 0 ; and if θ 1 C T C < θ < 2 K b b , then Z 1 C T C ( θ ) < 0 , that is f C T C * θ > 0 . However, if f 0 < ( a b c ) K b 2 K b , then Δ Z 1 C T C ( θ ) < 0 , that is, Z 1 C T C ( θ ) has no intersection with the horizontal axis. Thus, as long as 0 < θ < 2 K b b , then Z 1 C T C ( θ ) < 0 , that is, f C T C * θ < 0 .
Proof of Corollary 2.
From Proposition 1, we know that p C T C * θ = 2 K b 2 [ b f 0 θ 2 2 ( a b c ) θ + 4 K f 0 ] ( 4 K b b 2 θ 2 ) 2 . To simplify discussion, we denote Z 2 C T C ( θ ) = b f 0 θ 2 2 ( a b c ) θ + 4 K f 0 . Clearly, Z 2 C T C ( θ ) is a quadratic function with a parabola going downwards and its discriminant is Δ Z 2 C T C ( θ ) = 4 [ ( a b c ) 2 4 K b f 0 2 ] . It is not difficult to find that, if f 0 < ( a b c ) K b 2 K b , then Δ Z 2 C T C ( θ ) > 0 , and Z 2 C T C ( θ ) has two intersections with the horizontal axis, respectively, θ 3 C T C = a b c ( a b c ) 2 4 K b f 0 2 b f 0 and θ 4 C T C = a b c + ( a b c ) 2 4 K b f 0 2 b f 0 .
Based on the constraints in Equation (1), we know that 0 < θ < a b c b f 0 . Obviously, the point θ 4 C T C does not satisfy the assumption, so it will not be discussed. Therefore, if 0 < θ < θ 3 C T C , then Z 2 C T C ( θ ) > 0 , that is p C T C * θ > 0 ; and if θ 3 C T C < θ < 2 K b b , then Z 2 C T C ( θ ) < 0 , that is p C T C * θ < 0 . However, if f 0 > ( a b c ) K b 2 K b , then Δ Z 2 C T C ( θ ) < 0 , that is, Z 2 C T C ( θ ) has no intersection with the horizontal axis. Thus, as long as 0 < θ < 2 K b b , then G 2 C T C ( θ ) > 0 , that is p C T C * θ > 0 .
Proof of Corollary 3.
From Proposition 2, we find that f C T D * θ = ( a b c ) b θ 2 + 16 K b f 0 θ 8 K ( a b c ) ( 8 K b θ 2 ) 2 . To simplify discussion, we denote Z 1 C T D ( θ ) = ( a b c ) b θ 2 + 16 K b f 0 θ 8 K ( a b c ) . Clearly, Z 1 C T D ( θ ) is a quadratic function with a parabola going downwards and its discriminant is Δ Z 1 C T D ( θ ) = 32 K b [ 8 K b f 0 2 ( a b c ) 2 ] . It is not difficult to find that, if f 0 > ( a b c ) 2 K b 4 K b , that is, Z 1 C T D ( θ ) has two intersections with the horizontal axis, respectively, θ 1 C T D = 8 K b f 0 2 2 K b [ 8 K b f 0 2 ( a b c ) 2 ] ( a b c ) b and θ 2 C T D = 8 K b f 0 + 2 2 K b [ 8 K b f 0 2 ( a b c ) 2 ] ( a b c ) b .
Based on the constraints in Equation (1), we know that 0 < θ < a b c b f 0 and 8 K f 0 a b c > a b c b f 0 . Obviously, the point θ 2 C T D does not suit the assumption, so it will not be discussed. Therefore, if 0 < θ < θ 1 C T D , then Z 1 C T D ( θ ) < 0 , that is f C T D * θ < 0 ; and if θ 1 C T D < θ < 2 K b b , then Z 1 C T D ( θ ) < 0 , that is f C T D * θ > 0 . However, if f 0 < ( a b c ) 2 K b 4 K b , then Δ Z 1 C T C ( θ ) < 0 , that is, Z 1 C T C ( θ ) has no intersection with the horizontal axis. Thus, as long as 0 < θ < 2 K b b , then Z 1 C T D ( θ ) < 0 , that is, f C T D * θ < 0 .
Proof of Corollary 4.
From proposition 2, we know that p C T D * θ = 2 K b 2 [ b f 0 θ 2 2 ( a b c ) θ + 8 K f 0 ] ( 8 K b b 2 θ 2 ) 2 . To simplify discussion, we denote Z 2 C T D ( θ ) = b f 0 θ 2 2 ( a b c ) θ + 8 K f 0 . Clearly, Z 2 C T D ( θ ) is a quadratic function with a parabola going downwards and its discriminant is Δ Z 2 C T C ( θ ) = 4 [ ( a b c ) 2 8 K b f 0 2 ] . It is not difficult to find that, if f 0 < ( a b c ) 2 K b 4 K b , then Δ Z 2 C T D ( θ ) > 0 , and Z 2 C T C ( θ ) has two intersections with the horizontal axis, respectively, θ 3 C T D = a b c ( a b c ) 2 8 K b f 0 2 b f 0 and θ 4 C T D = a b c + ( a b c ) 2 8 K b f 0 2 b f 0 .
Based on the constraints in Equation (1), we know that 0 < θ < a b c b f 0 . Obviously, the point θ 4 C T D does not suit the assumption, so it will not be discussed. Therefore, if 0 < θ < θ 3 C T D , then Z 2 C T D ( θ ) > 0 , that is p C T D * θ > 0 ; and if θ 3 C T D < θ < 2 K b b , then Z 2 C T D ( θ ) < 0 , that is p C T D * θ < 0 . However, if f 0 > ( a b c ) 2 K b 4 K b , then Δ Z 2 C T D ( θ ) < 0 , that is, Z 2 C T D ( θ ) has no intersection with the horizontal axis. Thus, as long as 0 < θ < 2 K b b , then Z 2 C T D ( θ ) > 0 , that is p C T D * θ > 0 .
Proof of Proposition 3.
From Corollaries 1 and 3, it is known that, when 0 < f 0 < γ C T D , if only 0 < θ < 2 K b b , then f C T D * θ < 0 , f C T C * θ < 0 . When γ C T D < f 0 < γ C T C , if 0 < θ < θ 1 C T D , then f C T D * θ < 0 , f C T C * θ < 0 ; and if θ 1 C T D < θ < 2 K b b , then f C T D * θ > 0 , f C T C * θ > 0 . When γ C T C < f 0 < a b c b θ , if 0 < θ < θ 1 C T C , then f C T D * θ < 0 , f C T C * θ < 0 ; if θ 1 C T C < θ < θ 1 C T D , then f C T D * θ < 0 , f C T C * θ > 0 ; and if θ 1 C T D < θ < 2 K b b , then f C T D * θ > 0 , f C T C * θ > 0 .
Proof of Proposition 4.
From Corollaries 2 and 4, it is known that, when 0 < f 0 < θ C T D , if 0 < θ < θ 3 C T C , then p C T D * θ > 0 , p C T C * θ > 0 ; if θ 3 C T C < θ < θ 3 C T D , then p C T D * θ > 0 , p C T C * θ < 0 ; and if θ 3 C T D < θ < 2 K b b , then p C T D * θ < 0 , p C T C * θ < 0 . When γ C T D < f 0 < γ C T C , if 0 < θ < θ 3 C T C , then p C T D * θ > 0 , p C T C * θ > 0 ; and if θ 3 C T C < θ < 2 K b b , then p C T D * θ > 0 , p C T C * θ < 0 . When γ C T C < f 0 < a b c b θ , only if 0 < θ < 2 K b b , then p C T D * θ > 0 , p C T C * θ > 0 .
Proof of Proposition 5.
Based on Propositions 1 and 2, the above relationships are derived through algebraic comparison of the product carbon footprint, sales price, consumer demand and supply chain profit of centralized and decentralized decision-making models. It is then straightforward to show that f C T D * > f C T C * , Q C T D * < Q C T C * , p C T D * p C T C * = 8 K 2 b ( a b c b θ f 0 ) > 0 , and M C T D * + R C T D * S C C T C * = ( 8 K b θ 2 ) 2 24 K 2 ( 8 K b θ 2 ) 2 < 1 .
Proof of Corollary 5.
Based on Propositions 1 and 2, the proof is easy to derive, therefore it is omitted.
Proof of Proposition 6.
From the first order conditions of Equation (14), we have p = a + b w C T T 2 b . However, to ensure the profits of the supply chain with the two-part tariffs contract are equal to those in the centralized system, we set a + b w C T T 2 b = p C T C * , that is w C T T = 4 K ( c + θ f 0 ) a θ 2 4 K b θ 2 , then the retailer’s profit can be denoted as R C T T = 4 K 2 ( a b c b θ f 0 ) 2 b ( 4 K b θ 2 ) 2 F C T . Moreover, to make the retailer willing to accept the manufacturer’s two-part tariff contract terms, the retailer’s optimal profit must meet the condition R C T T > 0 , so the fixed fee paid by the retailer to the manufacturer needs to satisfy 0 < F C T < 4 K 2 ( a b c b θ f 0 ) 2 b ( 4 K b θ 2 ) 2 .

References

  1. Anger, N. Emission trading beyond Europe: Linking schemes in a Post-Kyoto World. Energy Econ. 2006, 30, 2028–2049. [Google Scholar] [CrossRef]
  2. Whitesell, W. Carbon taxes, cap-and-trade administration, and US legislation. Clim. Policy 2007, 7, 457–462. [Google Scholar] [CrossRef]
  3. He, L.; Zhao, D.; Xia, L. Game theoretic analysis of carbon emission abatement in fashion supply chains considering vertical incentives and channel structures. Sustainability 2015, 7, 4280–4309. [Google Scholar] [CrossRef]
  4. Goulder, L.; Hafstead, M.; Dworsky, M. Impacts of alternative emissions allowance allocation methods under a federal cap-and-trade program. J. Environ. Econ. Manag. 2010, 60, 161–181. [Google Scholar] [CrossRef]
  5. The National Development and Reform Commission of China (NDRC). The Notice on Implementing Pilot Cap-and-Trade Schemes; NDRC: Beijing, China, 2011.
  6. Ye, B.; Jiang, J.; Miao, L.; Li, J.; Peng, Y. Innovative carbon allowance allocation policy for the Shenzhen emission trading scheme in China. Sustainability 2016, 8, 3. [Google Scholar] [CrossRef]
  7. Hua, G.; Cheng, T.C.E.; Wang, S. Managing carbon footprints in inventory management. Int. J. Prod. Econ. 2011, 132, 178–185. [Google Scholar] [CrossRef]
  8. Benjaafar, S.; Li, Y.; Daskin, M. Carbon footprint and the management of supply chains: Insights from simple models. IEEE Trans. Autom. Sci. Eng. 2013, 10, 99–116. [Google Scholar] [CrossRef]
  9. Chen, X.; Benjaafar, S.; Elomri, A. The carbon constrained EOQ. Oper. Res. Lett. 2013, 41, 172–179. [Google Scholar] [CrossRef]
  10. He, P.; Zhang, W.; Xu, X. Production lot-sizing and carbon emissions under cap-and-trade and carbon tax regulations. J. Clean. Prod. 2015, 103, 241–248. [Google Scholar] [CrossRef]
  11. Dong, C.W.; Shen, B.; Chow, P.S.; Yang, L.; Ng, C.T. Sustainability investment under cap-and-trade regulation. Ann. Oper. Res. 2016, 240, 509–531. [Google Scholar] [CrossRef]
  12. Song, J.; Leng, M. Analysis of the single-period problem under carbon emissions policies. In Handbook of Newsvendor Problems; Springer: New York, NY, USA, 2012; pp. 297–313. [Google Scholar]
  13. Jaber, M.; Glock, C.; Ahmed, S. Supply chain coordination with emissions reduction incentives. Int. J. Prod. Res. 2013, 51, 69–82. [Google Scholar] [CrossRef]
  14. Zhang, B.; Xu, L. Multi-item production planning with carbon cap and trade mechanism. Int. J. Prod. Econ. 2013, 144, 118–127. [Google Scholar] [CrossRef]
  15. Du, S.; Ma, F.; Fu, Z. Game-theoretic analysis for an emission-dependent supply chain in a ‘cap-and-trade’ system. Ann. Oper. Res. 2015, 228, 135–149. [Google Scholar] [CrossRef]
  16. Zhou, M.; Pan, Y.; Chen, Z. Environmental resource planning under cap-and-trade: Models for optimization. J. Clean. Prod. 2016, 112, 1582–1590. [Google Scholar] [CrossRef]
  17. Xu, X.; Zhang, W.; He, P. Production and pricing problems in make-to-order supply chain with cap-and-trade regulation. Omega 2015, 66, 248–257. [Google Scholar] [CrossRef]
  18. Zheng, Y.; Liao, H.; Yang, X. Stochastic pricing and order model with transportation mode selection for low-carbon retailers. Sustainability 2016, 8, 48. [Google Scholar] [CrossRef]
  19. Du, S.; Tang, W.; Song, M. Low-carbon production with low-carbon premium in cap-and-trade regulation. J. Clean. Prod. 2016, 134, 652–662. [Google Scholar] [CrossRef]
  20. Xu, J.; Chen, Y.; Bai, Q. A two-echelon sustainable supply chain coordination under cap-and-trade regulation. J. Clean. Prod. 2016, 135, 42–56. [Google Scholar] [CrossRef]
  21. Xu, X.; He, P.; Xu, H. Supply chain coordination with green technology under cap-and-trade regulation. Int. J. Prod. Econ. 2017, 183, 433–442. [Google Scholar] [CrossRef]
  22. Seifert, J.; Uhrig-Homburg, M.; Wagner, M. Dynamic behavior of CO2 spot prices. J. Environ. Econ. Manag. 2008, 56, 180–194. [Google Scholar] [CrossRef]
  23. Aatola, P.; Ollikainen, M.; Toppinen, A. Impact of the carbon price on the integrating European electricity market. Energy Policy. 2013, 61, 1236–1251. [Google Scholar] [CrossRef]
  24. Zhang, Y.; Wang, A.; Tan, W. The impact of China’s carbon allowance allocation rules on the product prices and emission reduction behaviors of ETS-covered enterprises. Energy Policy 2015, 86, 176–185. [Google Scholar] [CrossRef]
  25. Trappey, A.; Trappey, C.; Hsiao, C. System dynamics modelling of product carbon footprint life cycles for collaborative green supply chains. Int. J. Comput. Integr. Manuf. 2012, 25, 934–945. [Google Scholar] [CrossRef]
  26. Jensen, J.K. Product carbon footprint developments and gaps. Int. J. Phys. Distrib. Logist. Manag. 2012, 42, 338–354. [Google Scholar] [CrossRef]
  27. Arıkan, E.; Jammernegg, W. The single period inventory model under dual sourcing and product carbon footprint constraint. Int. J. Prod. Econ. 2014, 157, 15–23. [Google Scholar] [CrossRef]
  28. Yalabik, B.; Fairchild, R. Customer, regulatory, and competitive pressure as drivers of environmental innovation. Int. J. Prod. Econ. 2011, 131, 519–527. [Google Scholar] [CrossRef]
  29. Goyal, M.; Netessine, S. Strategic technology choice and capacity investment under demand uncertainty. Manag. Sci. 2007, 53, 192–207. [Google Scholar] [CrossRef]
  30. Daskalakis, G.; Psychoyios, D.; Markellos, R. Modeling CO2 emission allowance prices and derivatives: Evidence from the European trading scheme. J. Bank. Financ. 2009, 33, 1230–1241. [Google Scholar] [CrossRef]
  31. Zhang, Y.; Wei, Y. An overview of current research on EU ETS: Evidence from its operating mechanism and economic effect. Appl. Energy 2010, 87, 1804–1814. [Google Scholar] [CrossRef]
  32. Kumar, R.S.; Choudhary, A.; Irfan Babu, S.A.K.; Kumar, S.K.; Goswami, A.; Tiwari, M.K. Designing multi-period supply chain network considering risk and emission: A multi-objective approach. Ann. Oper. Res. 2017, 250, 427–461. [Google Scholar] [CrossRef] [Green Version]
  33. Fera, M.; Fruggiero, F.; Lambiase, A.; Macchiaroli, R.; Miranda, S. The role of uncertainty in supply chains under dynamic modeling. Int. J. Ind. Eng. Comput. 2017, 8, 119–140. [Google Scholar] [CrossRef]
  34. Martino, G.; Fera, M.; Iannone, R.; Miranda, S. Supply chain risk assessment in the fashion retail industry: An analytic network process approach. Int. J. Appl. Eng. Res. 2017, 12, 140–154. [Google Scholar]
Figure 1. Effects of carbon trading price on product carbon footprint.
Sustainability 10 00481 g001
Figure 2. Effects of carbon trading price on selling price.
Sustainability 10 00481 g002
Figure 3. Effects of carbon trading price on consumer demand.
Sustainability 10 00481 g003
Figure 4. Effects of carbon trading price on supply chain profits.
Sustainability 10 00481 g004
Figure 5. Effects of carbon trading price on wholesale price in the two-part tariff contract.
Sustainability 10 00481 g005
Figure 6. Effects of carbon trading price on fixed fee in the two-part tariff contract.
Sustainability 10 00481 g006
Figure 7. Effects of carbon cap on product carbon footprint.
Sustainability 10 00481 g007
Figure 8. Effects of carbon cap on selling price.
Sustainability 10 00481 g008
Figure 9. Effects of carbon cap on consumer demand.
Sustainability 10 00481 g009
Figure 10. Effects of carbon cap on the profits of the supply chain.
Sustainability 10 00481 g010
Figure 11. Effects of carbon cap on wholesale price in the two-part tariff contract.
Sustainability 10 00481 g011
Figure 12. Effects of carbon cap on fixed fee in the two-part tariff contract.
Sustainability 10 00481 g012