Article

A New Framework for Assessing the Sustainability Reporting Disclosure of Water Utilities

by
Silvia Cantele
1,*,
Thomas A. Tsalis
2 and
Ioannis E. Nikolaou
2
1
Department of Business Administration, University of Verona, 37129 Verona, Italy
2
Department of Environmental Engineering, Democritus University of Thrace, Xanthi 67100, Greece
*
Author to whom correspondence should be addressed.
Sustainability 2018, 10(2), 433; https://doi.org/10.3390/su10020433
Submission received: 7 January 2018 / Revised: 2 February 2018 / Accepted: 4 February 2018 / Published: 7 February 2018
(This article belongs to the Special Issue Challenges for a Sustainable Water Use and Re-Use)

Abstract

:
Sustainability reporting is becoming more and more widespread among companies aiming at disclosing their contribution to sustainable development and gaining legitimacy from stakeholders. This is more significant for firms operating in a public services’ context and mainly when supplying a fundamental public resource, like water utilities. While the literature on sustainability reporting in the water sector is scant, there is an increasing need to study the usefulness and quality of its sustainability disclosures to adequately inform the stakeholders about the activities of water utilities to protect this fundamental resource and general sustainable development. This article presents a novel assessment framework based on a scoring technique and an empirical analysis on the sustainability reports of Italian water utilities carried out through it. The results highlight a low level of disclosure on the sustainability indicators suggested by the main sustainability reporting guidelines (Global Reporting Initiative, (GRI), and Sustainability Accounting Standard Board, (SASB)); most companies tend to disclose only qualitative information and fail to inform about some material aspects of water management, such as water recycled, network resilience, water sources, and effluent quality. These findings indicate that sustainability reporting is mainly considered as a communication tool, rather than a performance measurement and an accountability tool, but also suggest the need for a new and international industry-specific sustainability reporting standard.

1. Introduction

Water utilities play a critical role in sustainable development by ensuring the protection of the quality of water resources and the continuous supply of water to current and future generations. Regardless of the management structure (public or private) and shortcomings of each type of management (e.g., lack of public utilities’ innovativeness and lack of social goals of the private water companies [1], water utilities need to adopt certain sustainability practices in order to handle water resources and contribute to the three aspects of sustainability (economy, environment, and society). This need is also expressed by the current pressures of society which are evolving from the traditional hygiene and eutrophication issues to the modern environmental problems which are more complex and ask for novel solutions [2].
Society considers water as a public good which is valuable for the lives of the living beings, and therefore water utilities have to offer appropriate conditions for fair public access and achieve a good sustainable performance in order to gain public legitimacy. Besides the design and implementation of well-tailored sustainability programs, there is a need for appropriate information disclosures to stakeholders regarding water utilities’ sustainability performance; this implies the need to assess water services not exclusively with reference to the traditional three dimensions of sustainability, but also with regards to governance, by including aspects such as public participation, transparency, and accountability [3]. Among the first kind of initiatives are sustainability programs provided by well-known organizations such as the International Organization for Standardization (ISO 14001 and ISO 26000) and Environmental Management and Audit Schemes (EMAS), which offer suitable guidelines and standards for water utilities to deal with sustainability issues [4,5]. Furthermore, various environmental accounting and reporting systems have been proposed to help firms in preparing sustainability reports which aim to inform stakeholders about their contribution to sustainability. The Global Reporting Initiative (GRI) standards, ISO 14031 and the Sustainability Accounting Standard Board (SASB) provide detailed accounting and reporting frameworks which improve the corporate transparency and accountability.
Broadly speaking, environmental accounting offers to society suitable information in relation to the corporate sustainable performance and helps firms to gain legitimacy. Actually, firms with high public surveillance and critique (like water utilities) have to disclose information regarding their sustainability performance to protect their reputation from future social criticism [6]. Findings from the literature have shown that the accountability of public organizations (or public services’ organizations) is different from that of private organizations. In particular, public accountability encompasses four categories of accountability [7]: financial accountability (e.g., information regarding the financial situation of firms), accountability in provision services (e.g., product quality and distribution issues), political accountability (e.g., performance of the public owners), and citizen accountability (e.g., financial and non-financial information suitable for citizens).
To cover such aspects of accountability, information could be drawn from water utilities’ reports through scoring or benchmarking, content analysis, and survey or interviews techniques [7]. The scoring and benchmarking systems and the content analysis techniques obtain quantitative information from the sustainability reports of water utilities regarding sustainability issues aiming to measure the kind, quality, and quantity of the sustainability disclosure, while interviews and surveys focus on the motivations to report [8,9,10,11]. However, a basic problem in this field is the limited number of studies which focus on water utilities accountability and legitimacy strategy for sustainability issues [12,13].
Taking into account the above-mentioned limitation, this article suggests a new approach in scoring the sustainability disclosure which could help water utilities to estimate the effectiveness of their reporting practices. The proposed methodological framework offers a straightforward guideline which sheds light on the quality and the extent of information disclosed through sustainability reports. Furthermore, management teams could use it as a measurement tool to compare their reporting performance with those of their competitors, providing constructive feedbacks about the effectiveness of their reporting strategies.
To describe and test this new scoring framework, the article presents an empirical analysis of sustainability reporting disclosure in the Italian water industry, in particular with reference to the use of qualitative and quantitative indicators relating to water management issues. This analysis provides new insights on the topic of sustainability disclosure in water utilities, thus contributing to enrich the scant literature focusing on sustainability reporting practices in Italian listed companies [14,15] or public utilities [16,17].
The remainder of the article is organized in four sections. The second section describes the literature on sustainability reporting and performance of water utilities. The third section presents the research methodology. The fourth section analyzes and discusses the results of the empirical research, while the last one includes implications, limitations, and conclusions.

2. Theoretical Background

The business sector is more and more asked to contribute to the solution of many societal problems (e.g., poverty, human rights violations, deterioration of the environment) by incorporating sustainable development goals (SDGs) [18] in its strategic purposes and operations. The pressures towards sustainability are not new, as the debate on the boundaries of Corporate Social Responsibility (CSR) started several decades ago [19] and is still alive and somehow renovated from a strategic point of view [20,21]. When firms acknowledge their social and environmental responsibility, they are also asked to be accountable by disclosing their principles, processes, and performance towards sustainability. In fact, there are several significant theories to elucidate the reasons why firms disclose sustainability information, such as the stakeholder theory, the resource dependency theory, the institutional theory, the legitimacy and accountability and communitarian theory [22,23]. These theories shed light on the different incentives for firms to disclose sustainability information. The majority of such theories is designed to explain the initiatives of the private sector to offer such information, while less attention has been dedicated to identifying the public sector’s incentives. Pressures and motivations towards sustainability reporting are differentiated between the private and the public sector. Specifically, the private sector usually makes an effort to start a debate with key stakeholders having the ultimate goal to maximize profits or gain the social license to operate, whereas the public sector focuses on voluntary disclosures mainly to achieve accountability goals toward taxpayers and the general society in the context of ethics and fairness, but is also concerned about the goal of public service excellence and the consequent choice of an adequate performance management model [24]. In this debate, Ref. [7] point out that the public organizations are responsible for offering public services by respecting environmental and social requirements and that they are accountable for disclosing the relative information to strengthen their political accountability, since they are institutional organizations.
In this sense, water utilities should adopt many practices to improve their accountability to stakeholders [25,26]. In particular, the first duty of water utilities is to adopt practices which have a positive impact on sustainable development, and the second duty is to inform society about their sustainability performance. The contribution of water utilities to sustainability issues is pursued either by integrating principles of sustainability into an organization’s operations (such as limited impacts on the environment, respect for society and stakeholders) or by handling the water resources they manage with respect to sustainability principles; actually, water utilities have a pivotal role in society descending from their nature of essential public services suppliers. The reasons for the voluntary adoption of practices such as Environmental Management Systems by water utilities are based mainly on institutional factors and less on the organization’s interest in contributing to sustainability issues [4]. This means that public organizations tend to respond to society’s needs rather than to their needs.
Only recently have water utilities perceived the pressure towards a complete accountability strategy regarding sustainability performance issues; the literature has started following these trends, but empirical studies which focus on sustainability reporting and performance measurement in the water industry are scant. Some methodologies have been suggested to measure the sustainability performance of water utilities by using composite indicators [27], while other studies analyze the content and quality of the sustainability reports of water utilities. Ref. [28] identify a significant progress in environmental and social information disclosures in environmental reports of New Zealand water utilities by using a textual analysis. Ref. [29] point out that Spanish water utilities voluntarily disclose information mainly to notify their stakeholders about sustainable organizational strategies and operational activities. Ref. [30] examine the experience of Swedish water utilities in disclosing sustainable development indicators through sustainability reports: even though they identify many sustainability indicators disclosed in sustainability reports, these indicators seem to play a limited role in their decision-making process.
Additionally, Ref. [12] provide a methodology for ranking companies’ water performance by gathering information from the overall supply chain. This method is based on checklists drawing information from sustainability reports. Similarly, Ref. [13] evaluate the water performance of the US food and beverage industry through CSR reports by utilizing classical scoring or benchmarking systems and basic GRI indicators. Ref. [31] examines the strategies of contemporary companies regarding freshwater by using the 2007 Global Water Tool and the ‘water footprint’ calculation method to analyze the annual reports of companies. Ref. [32] examine how the mining industry in South Africa measures and discloses the risks which are associated with water issues. Similarly, Ref. [33] propose a scoring framework to assess the water risks of businesses through disclosures on sustainability reports. However, Ref. [3] point out that the triple bottom line approach provides a limited context to evaluate water services, as further dimensions are necessary, such as assets and governance.
In general, the analysis of the sustainability reports has been made through scoring or benchmarking systems and content analysis techniques. The former type of methodologies assists in quantifying the information of the sustainability reports under a systematic manner. Usually, a 3- to 5-point scale quantifies the disclosure by scoring the qualitative or quantitative information with reference to a predefined disclosure indicators’ list. The meaning of each number is differentiated in accordance with the specific technique applied, but usually the scale indicates an increasing level of disclosure, from the lowest to the highest score in the scale.
The latter type of techniques relates to the content analysis [34] of the sustainability reports, which focuses on codifying sentences [35] or pages [36] of disclosure with reference to the content (issues or topics synthesized in each code) or to the kind of disclosure (e.g., qualitative rather than quantitative or monetary).

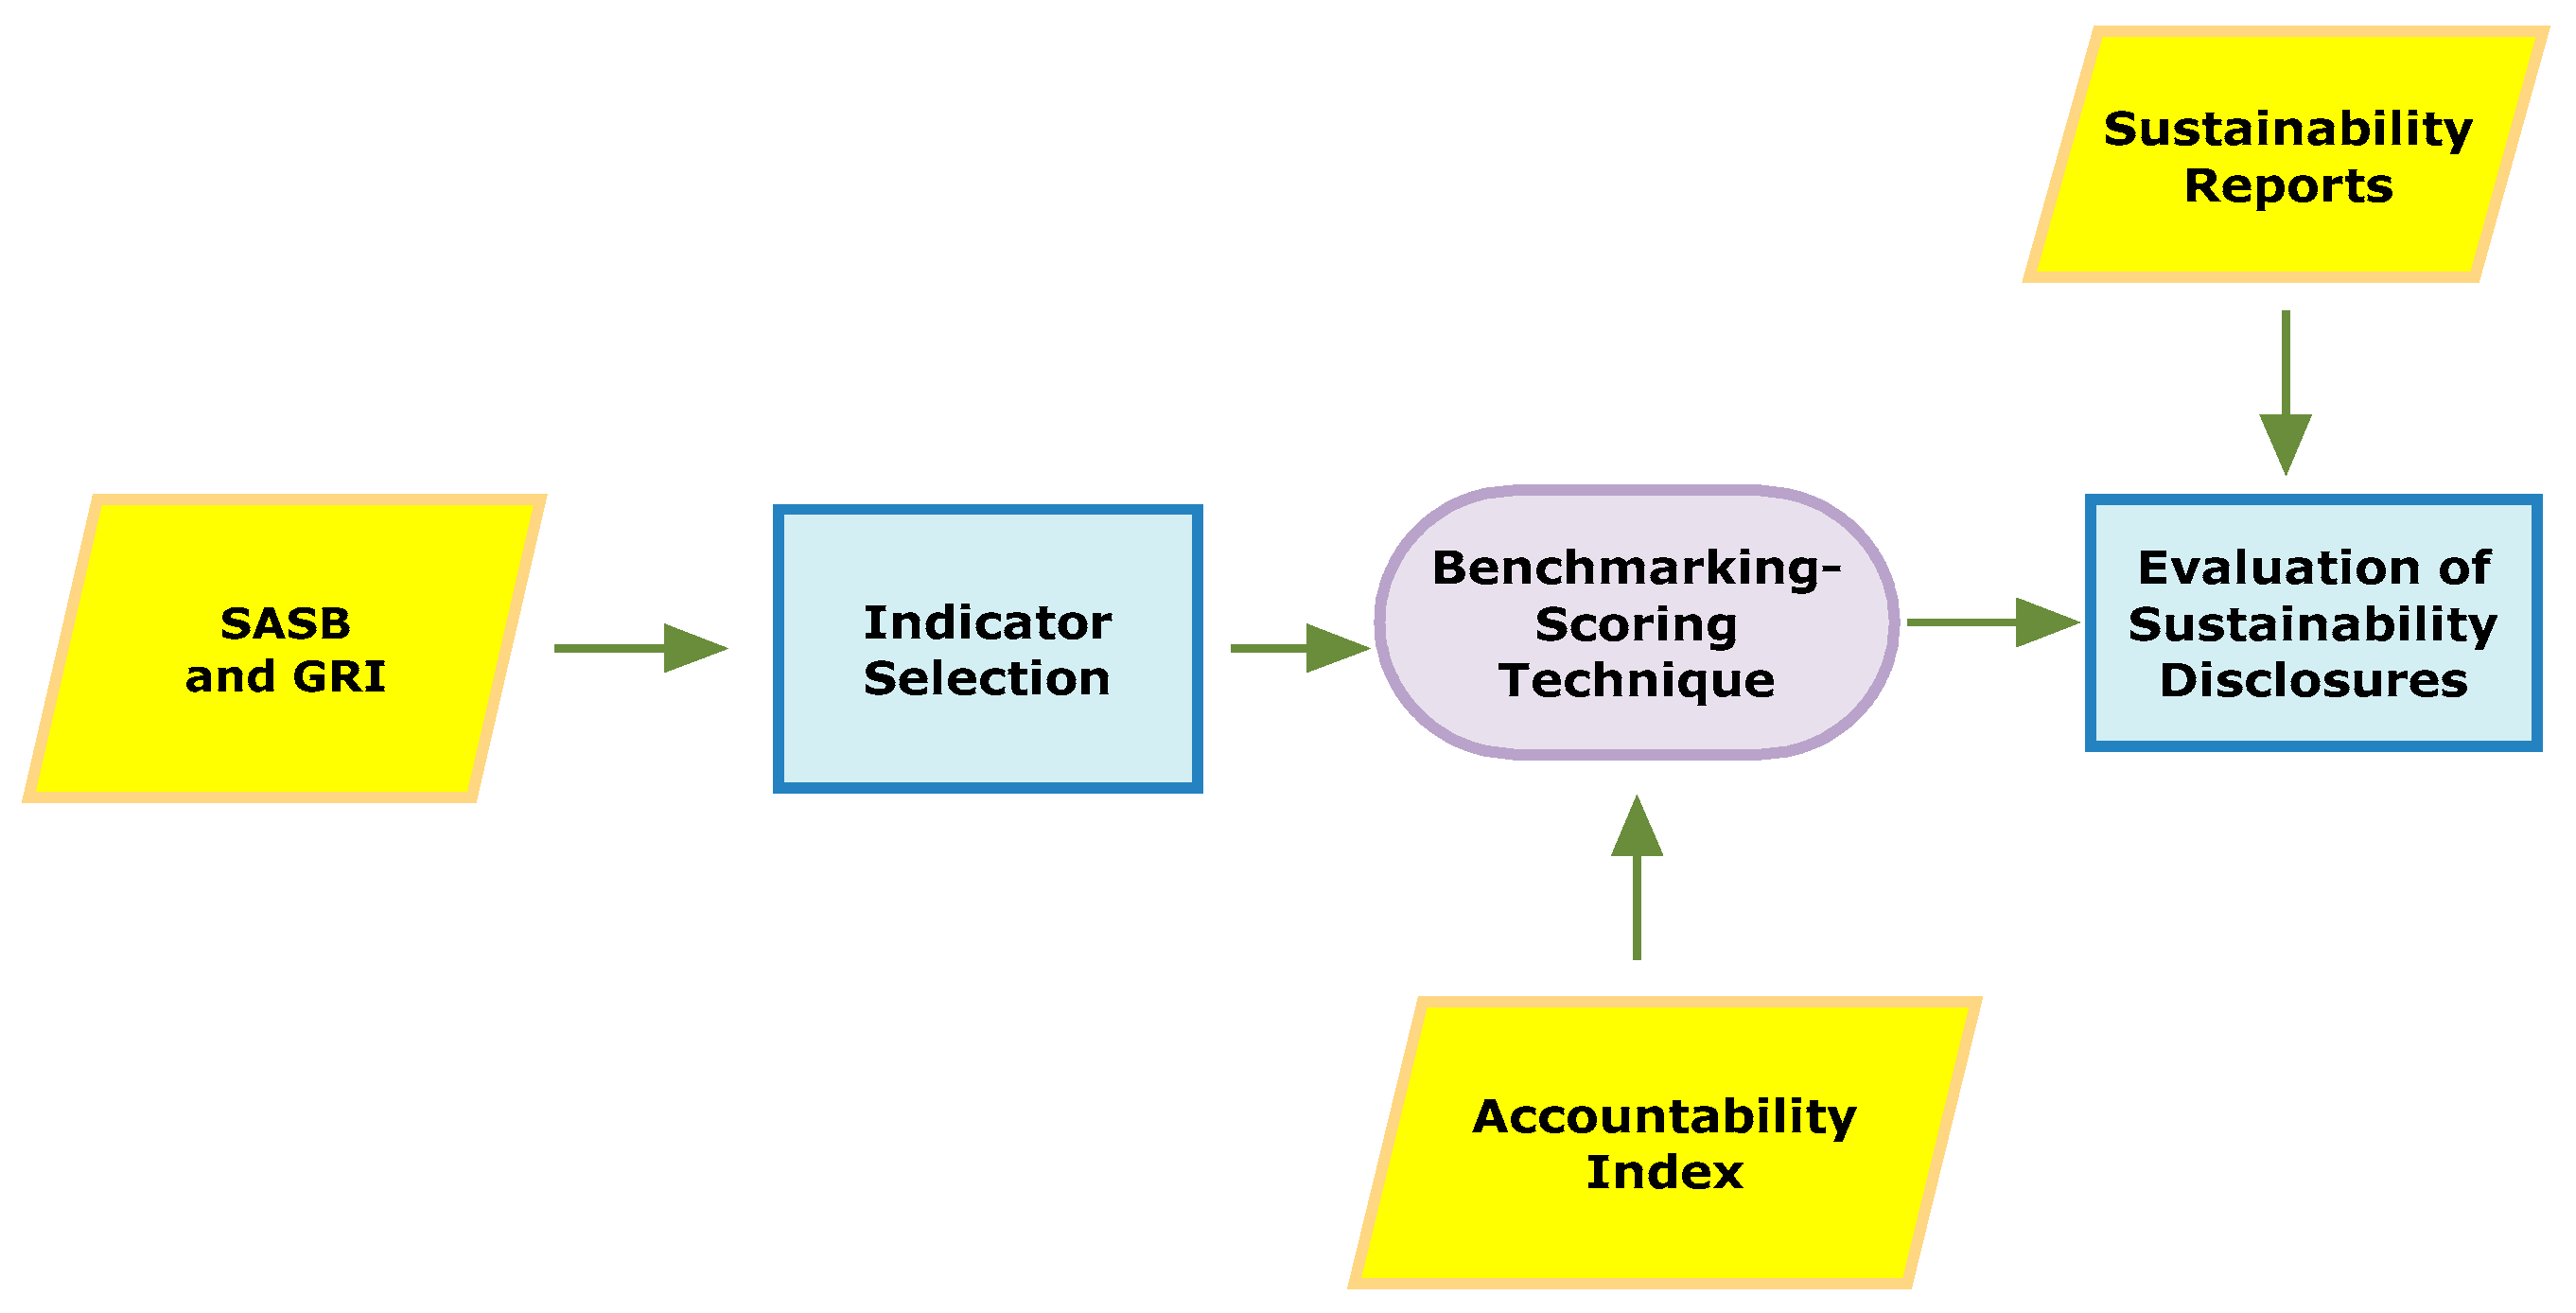
3. Research Methodology

This article presents and tests an integrated methodological framework which, based on a benchmarking-scoring technique, is dedicated to assess the quality of indicators’ disclosure in the water industry’s corporate sustainability reports (Figure 1).
As in most benchmarking systems, the indicators’ selection and the architecture of the scoring system are fundamental components which have an impact on the effectiveness of the benchmarking techniques and their ability to assess the completeness and transparency of the examined reports. Taking into account this vital prerequisite for a successful benchmarking system, the proposed methodology combines a predefined set of indicators, mainly derived from outstanding sustainability standards (such as GRI water standards 303 and 306 and SASB water utilities sustainability standards) and an objective scoring system, in order to increase their credibility and validity.
In general, GRI provides a set of standards which help organizations to disclose accurate information about various aspects of the three dimensions of corporate sustainability. The proposed methodology adopts GRI’s water standards 303 and 306 which are focused on water consumption issues (water sources, water withdrawal, water recycled and reused) as well as issues related to organizations’ effluents (water discharge). The SASB water utilities sustainability standard [37] is an industry-specific standard for water utilities providing a standardized guide to disclose complete and comprehensive information regarding their sustainability performance. The proposed guideline includes both performance and accounting metrics about various dimensions of water utilities’ activities, such as: Energy Management, Effluent Quality Management, Water Scarcity, Drinking Water Quality, Fair Pricing & Access, End-Use Efficiency, Distribution Network Efficiency, Network Resiliency and Impacts of Climate Change

3.1. Indicators’ Selection

The predominant concern for the indicators’ selection process was that the final set of indicators had to cover as much as possible a wide range of aspects associated with the sustainability performance of water utilities. To do so, 39 indicators were selected to gather reliable information through the sustainability reports published by water utilities. Actually, the vast majority of the proposed indicators has been extracted from the SASB’s sustainability accounting standard for water utility sector [37] and GRI water and effluent disclosure guidelines [38,39]. Both SASB and GRI are internationally recognized standards which aim to improve the quality and the content of sustainability disclosure by providing sustainability accounting standards for various industry sectors. Based on the sustainability topics discussed in the mentioned sustainability standard, selected indicators were grouped into 11 aspects which are focused on specific sustainability dimensions of water utilities’ performance. Table 1 presents the final set of indicators which comprises both qualitative and quantitative indicators (5 and 34, respectively)

3.2. Scoring System

The second crucial component of the proposed benchmarking-scoring technique is the scoring system used to evaluate the quality of sustainability disclosure. In this field, some previous works have proposed scoring and benchmarking systems to evaluate sustainability reports of water utilities [27,29]. These techniques are based mainly on GRI indicators [40,41,42]. The possibility to benchmark the performance of different water utilities is a relevant incentive towards the improvement in the quality of services; starting from the recent sunshine regulation, a performance assessment system is presented by [43]. The analysis presented in this article is based on an updated version of the Accountability Index (AI) proposed by [44] (see also [33,45,46]). It is a straightforward scoring system based on a four-level measurement scale:
  • 0 points (Level 0): when information is not mentioned for a specific indicator;
  • 1 point (Level 1): when qualitative information is mentioned for a specific indicator or when a quantitative indicator is present but not exactly in the form required by the standard;
  • 2 points (Level 2): when quantitative information is mentioned for a specific indicator as required by the corresponding standard;
  • 3 points (Level 3): when the report provides information which shows the progress of water utility‘s performance for a specific indicator (e.g., there is at least the previous year’s indicator to benchmark present performance).
For the sake of clarity, it is important to stress that the maximum score which can be achieved by a qualitative indicator is 1 point. Because of their descriptive nature, it is very complicated to assess the utility’s disclosure in these aspects. Also, any attempt to assess the actual performance of qualitative indicators would cast doubt upon the validity of the evaluation process.
Considering the Accountability Index and the total number of the selected indicators, the Total Accountability Index (TAI) can be calculated as the sum of the scores achieved within all indicators (Equation (1)).
T A I = i = 1 5 A I Q L t + j = 1 34 A I Q n t
where i is the number of qualitative indicator and j is the number of quantitative indicators.
As can be seen from Table 2, the TAI score ranges from zero, when an examined sustainability report does not provide any information concerning water utility’s sustainability performance, to 107 when a sustainability report thoroughly covers all aspects of sustainability performance, providing also information which indicates the progress of the water utility’s performance for all quantitative indicators. In other words, the TAI score measures the level of disclosure in terms of the quality and quantity of the information provided by a particular sustainability report. Moreover, the mean score of each aspect was defined as a threshold score which indicates the minimum acceptable level of reporting performance

3.3. Sample Selection

As stressed above, the goal of this article is to develop a novel methodological framework which facilitates the evaluation process of the sustainability reports published by firms operating in the water utility sector.
To test the completeness and the effectiveness level of the proposed methodology, an empirical analysis was carried out in a sample of 22 Italian water utilities; these companies are representative of all water utilities in northern Italy presenting a sustainability report on their websites; other companies from different parts of Italy were added because were known for having published their sustainability reports on the web.
Furthermore, by means of this analysis, some interesting findings emerged concerning the reporting practices adopted by the water utility sector. For confidentiality reasons, the authors do not present the trade names of the selected companies.
The sample consists of 9 water utilities and 13 multiutilities—which not only provide drinking water and sewages services, but also operate in other public services’ sectors such as energy and gas distribution and waste management; to collect homogeneous data, the multi-utilities were analyzed only with reference to water management services. As for the organizational size, according to GRI’s reporting list classification criteria [47], 13 sampled utilities can be considered large, while five utilities are listed on the stock exchange. The average number of reports published by the water utilities is six, which indicates that the Italian water sector has sufficient experience in the field of sustainability reporting (see Table 3).
As for the examined reports, the authors focused on the latest sustainability report available which was provided by each utility in order to highlight the current trends in the reporting strategies of water utilities: most of the sustainability reports were referred to the financial year 2016, with an average number of 126 pages. Finally, Table 3 shows that the external assurance of the sustainability report is a process adopted by only one-third of utilities in the sample.

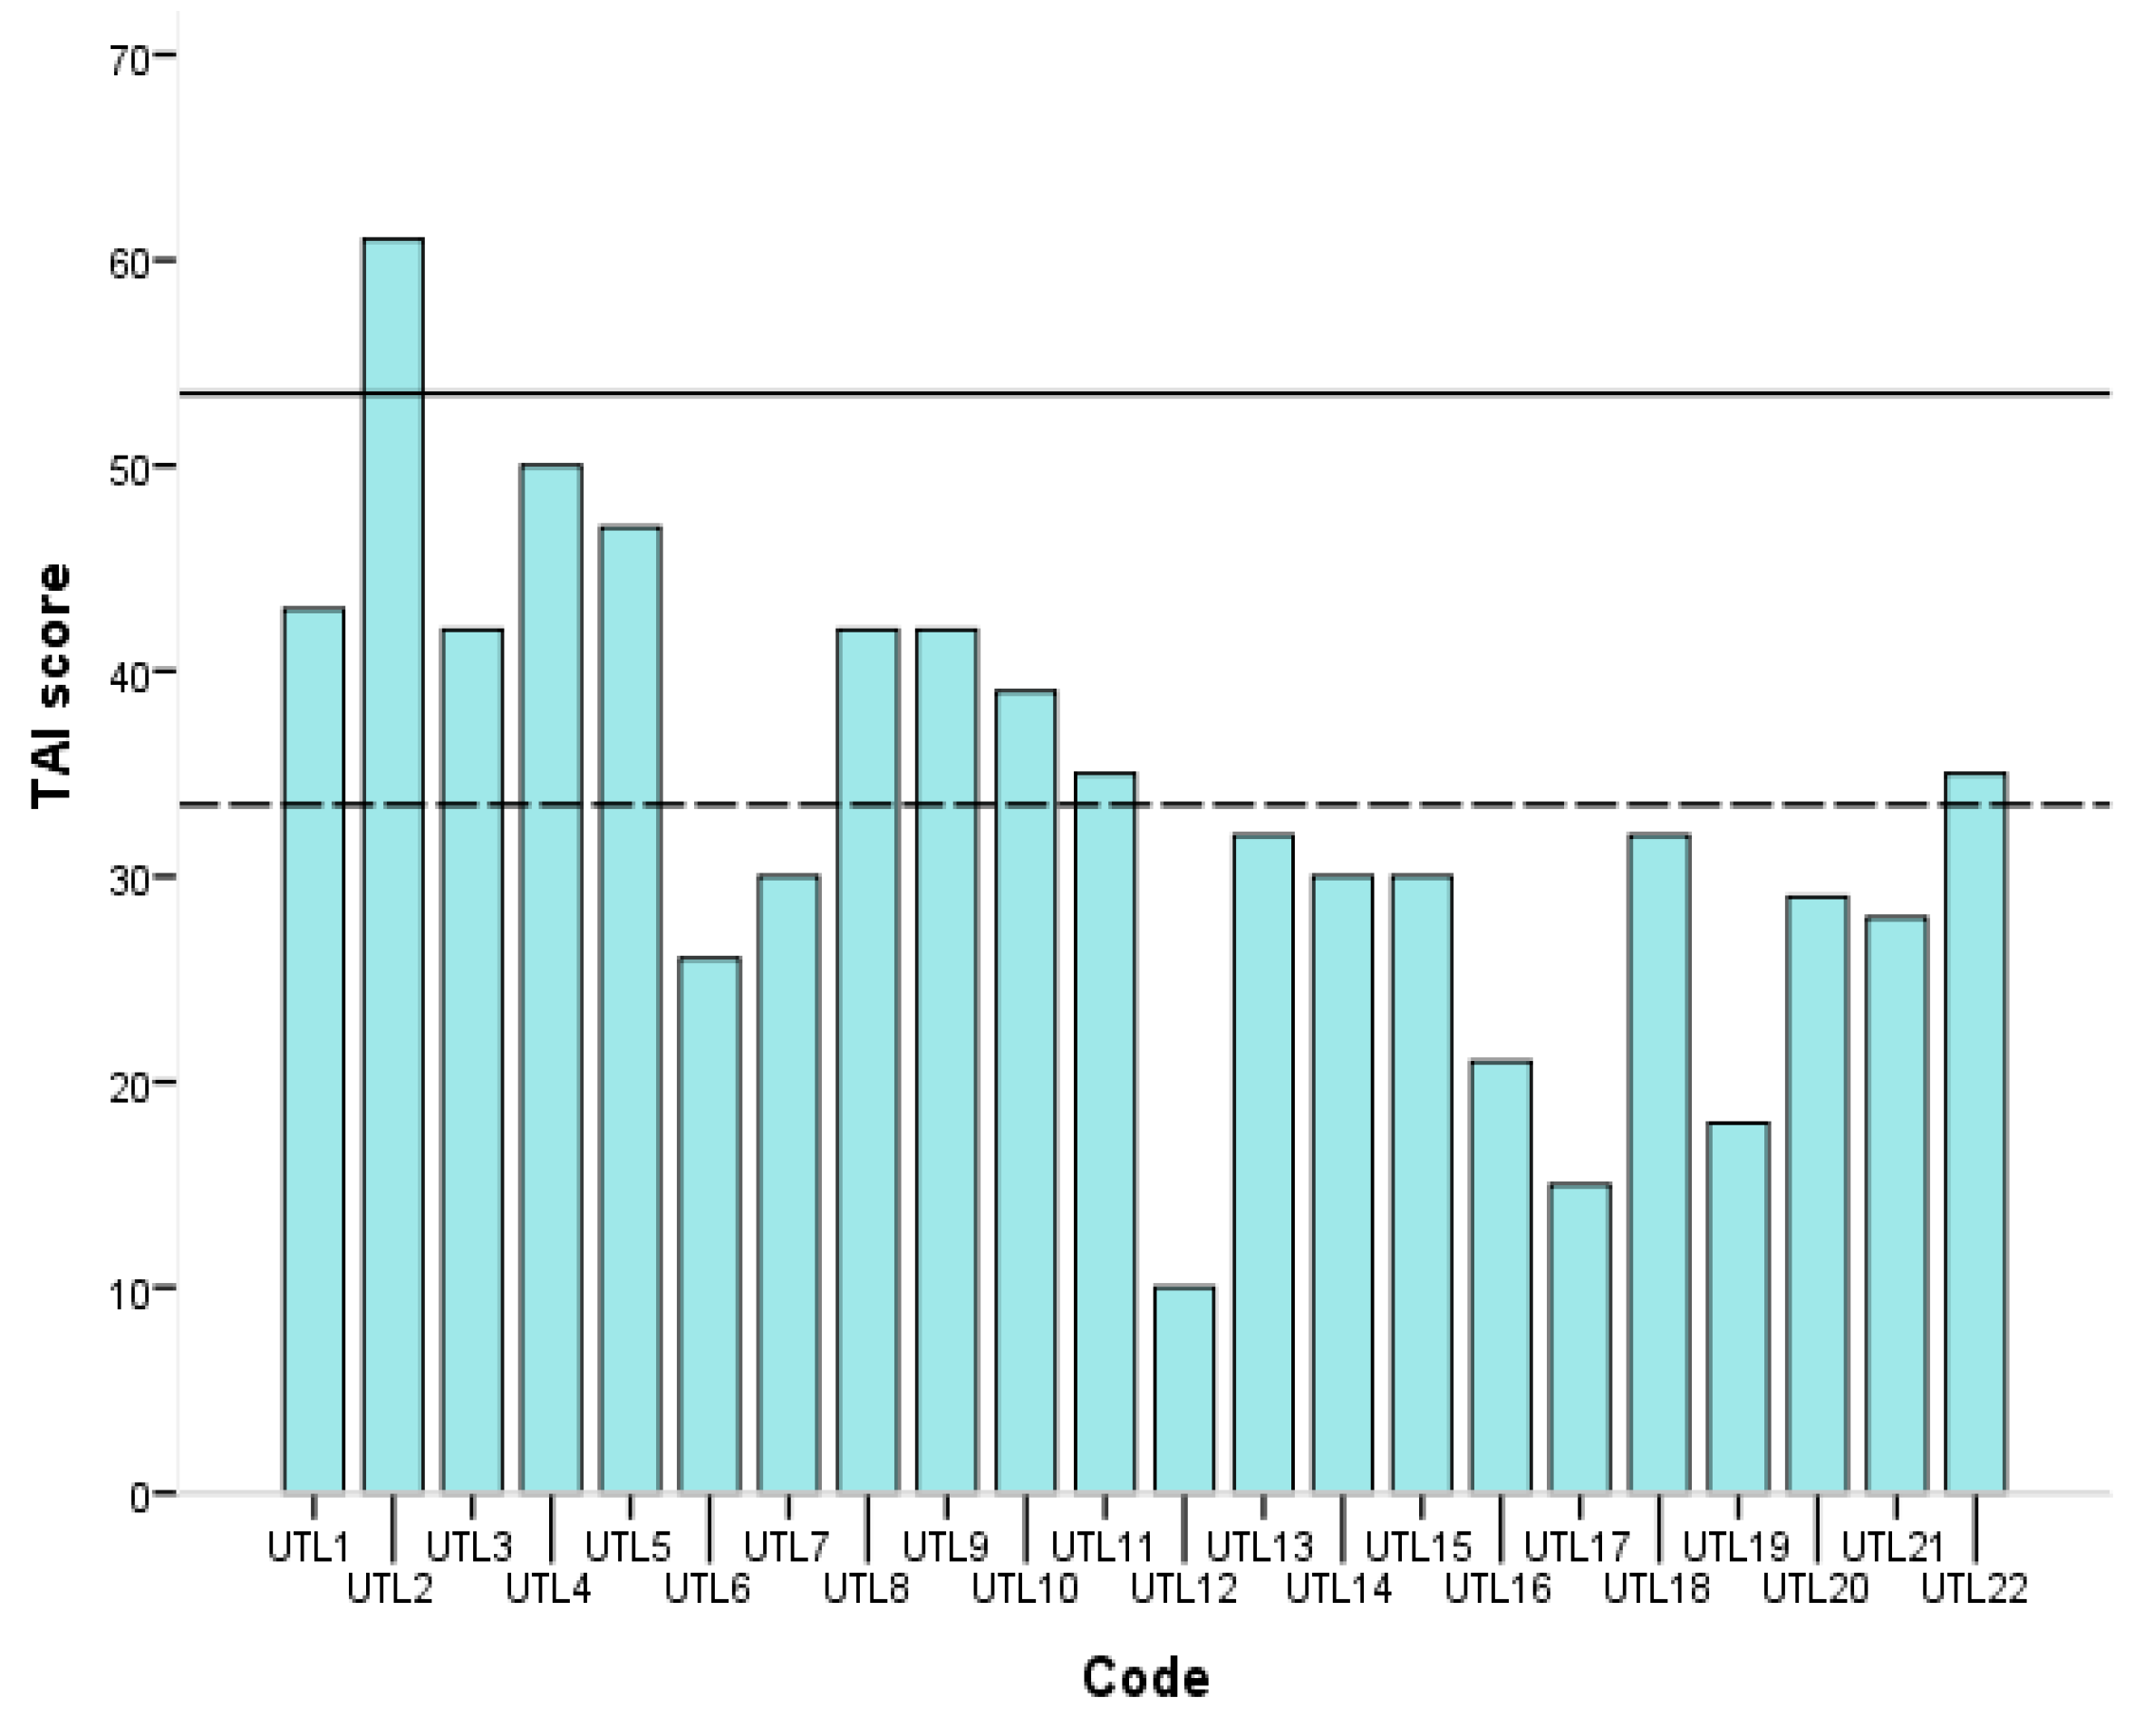
4. Data Analysis and Discussion

This section outlines the main results from the assessment of water utilities’ sustainability reports. In general, the quality of the disclosed information is disappointing. The vast majority of water utilities did not provide information on half of the proposed indicators which is a clear indication that the reporting performance of water utilities is very low (see Table 4). None of the reports analyzed disclosed information about the C2 and K1 indicators which are associated with the percentage of water recycled for potable reuse and the water treatment capacity located in flood hazard areas, respectively.
The majority of sustainability indicators had an average score which ranged from 0 to 1 which denotes that the examined reports mainly provided qualitative information (Level 1), which cannot be used to assess the process of water utilities performance in various aspects of sustainability and evaluate the effectiveness of their sustainability strategies. If we consider the five qualitative indicators, we can see that the majority of firms only disclosed the relative information for H4 and I2; for B4, B5, and K6 there was a prevailing part of companies not disclosing any information. For the 34 quantitative indicators, the situation is similar: on average, 12 companies out of 22 did not disclose any information (level 0), 3 companies disclosed information which did not correspond to the required indicators (level 1), 3 other companies disclosed precise indicators but without comparison with the previous year (level 2), and the remaining 4 companies (on average) reported correctly the indicators with consistent comparisons.
These findings are corroborated by the TAI scores of the sustainability aspects which are almost all below the threshold scores (see Table 5). The only aspect with an average score above the threshold value was Aspect D, which is related to the activity metrics. A possible explanation of this outcome could be that utilities are more familiar with the scope of this aspect because it is associated with their core business and operations; however, the indicators included in aspect D are mainly descriptive figures about the water utilities’ business models (such as number of customers, volume of water delivered or treated, length of lines) and they do not provide useful information on the sustainability performance of the companies; besides, aspect D, aspects A, E, G, and J had a relatively “high” disclosure, compared to the remaining others, as their mean score ranged from 35% to 44% of the maximum score; these are the aspects dedicated to water withdrawal, energy management, distribution network efficiency, and drinking water quality. The least reported aspect was Aspect C (water recycled or reused and discharged); the indicators included in this aspect are mainly taken from GRI, which is not a standard dedicated to water utilities, but rather to water management in any other company. The second less reported aspect was K (network resiliency and impacts from climate change) which mainly concerns unusual situations like overflows and disruptions. The remaining aspects (B, F, H, I) had a mean score ranging from 20% to 28% of the maximum score; this means that only a minority of companies are disclosing material information about water sources, effluent quality, customers complaints, end-use efficiency, and water protection initiatives; these results are disappointing if we consider that these aspects are among the most relevant in explaining the impact of the utilities on the critical resource they manage, which is their main contribution to sustainable development.
The last data we are presenting in this analysis are synthesized in Figure 2, which presents the TAI scores achieved by each utility. The black line corresponds to the threshold value (53.5 points) which defines the acceptable level of the sustainability reporting performance, while the dashed line corresponds to the average score (33.5 points) achieved by the sample utilities. As already stated above, the utilities’ reporting performance was very low. Although the examined utilities had previous experience in preparing sustainability reports, only one water utility (UTL2) had a score above the threshold value (61 points). The UTL12 had the lowest performance (10 points), denoting that the examined report covered very few sustainability indicators.

5. Conclusions

This article develops a new approach for assessing the quality of disclosure in sustainability reports published by water utilities. It combines a scoring scale and a set of qualitative and quantitative indicators which cover the material aspects of disclosure relating to the sustainability performance of water utilities. The proposed methodology provides a basis for an objective evaluation of the sustainability reporting practices of water utilities. It could be implemented regardless of the peculiarities and the characteristics of the water utilities (e.g., size, region in which the water utilities operate, and management structure).
Besides the methodological contribution, the application of the scoring model to Italian firms offers two other considerable outcomes. Firstly, the assessment of the disclosure level of this appropriate sample of companies. Secondly, some insights into the usefulness of indicators and aspects suggested by the main sustainability standards to the water industry. As for the first aspect, the level of disclosure of Italian water utilities has shown to be generally poor: although a significant reporting experience characterizes the vast majority of firms, the use of indicators in sustainability reporting appears to be limited, indicating a tendency to use reports mainly as communication tools—for descriptive purposes—rather than as accountability tools—aiming at reporting the sustainability performance to stakeholders. With reference to the second aspect, it is necessary to point out that the only standard dedicated to sustainability reporting in water utilities is [37], which was issued in the US context and appears to be related to specific regulations or issues typical of this territory (e.g., FEMA Special Flood Hazard Areas). On the other hand, [38,39] are designed for all kind of organizations (more often water utilities’ customers), but they are not specifically dedicated to water supply services. These considerations, combined with the low level of accountability revealed by this analysis, suggest that an international industry-specific standard could help water utilities to increase their level of disclosure and reporting quality.
This research contributes to filling a gap in the sustainability reporting literature, as few articles in previous studies were devoted to water utilities practices; the main limitation resides in having only tested the model on a sample of Italian companies. Further research could be dedicated to enlarging the analysis on the reporting practices in an international setting and to improving the scoring model by including further suggestions from updated standards or firms’ practices.

Author Contributions

Despite this article is the result of a joint work of the three authors, Ioannis E. Nikolaou wrote the Section 1 and Section 2, Thomas A. Tsalis wrote Section 3, Silvia Cantele wrote Section 4 and Section 5. The authors would like to thank Arianna Boratto for her help in collecting the data from the reports.

Conflicts of Interest

The authors declare no conflict of interest.

References

  1. Bebbington, J.; Higgings, C.; Frame, B. Initiating sustainable development reporting: Evidence from New Zealand. Account. Audit. Account. J. 2009, 22, 588–625. [Google Scholar] [CrossRef]
  2. Belal, A.R.; Owen, D.L. The views of corporate managers on the current state of, and future prospects for, social reporting in Bangladesh: An engagement based study. Account. Audit. Account. J. 2007, 20, 472–494. [Google Scholar] [CrossRef]
  3. O’Dwyer, B. Managerial perceptions of corporate social disclosure: An Irish story. Account. Audit. Account. J. 2002, 15, 406–436. [Google Scholar] [CrossRef]
  4. Spence, C. Social and environmental reporting and hegemonic discourse. Account. Audit. Account. J. 2007, 20, 855–882. [Google Scholar] [CrossRef]
  5. Cantele, S. The trend of sustainability reporting in Italy: Some evidence from the last decade. Int. J. Econ. 2014, 6, 381–405. [Google Scholar] [CrossRef]
  6. Mio, C.; Venturelli, A. Non-financial Information About Sustainable Development and Environmental Policy in the Annual Reports of Listed Companies: Evidence from Italy and the UK. Corp. Soc. Responsib. Environ. Manag. 2013, 20, 340–358. [Google Scholar] [CrossRef]
  7. Mio, C. Corporate social reporting in Italian multi-utility companies: An empirical analysis. Corp. Soc. Responsib. Environ. Manag. 2010, 17, 247–271. [Google Scholar] [CrossRef]
  8. D’Andrea, A. Applying GRI Sustainability Reporting in the Water Sector: Evidences from an Italian Company. Int. J. Bus. Adm. 2017, 8, 10. [Google Scholar] [CrossRef]
  9. Baldwin, C.; Uhlmann, V. Accountability in planning for sustainable water supplies in South East Queensland. Aust. Plan. 2010, 47, 191–202. [Google Scholar] [CrossRef]
  10. Marie Lauesen, L. How well are water companies engaged in CSR? A critical cross-geographical discourse analysis. Soc. Responsib. J. 2014, 10, 115–136. [Google Scholar] [CrossRef]
  11. Greiling, D.; Traxler, A.A.; Stötzer, S. Sustainability reporting in the Austrian, German and Swiss public sector. Int. J. Public Sect. Manag. 2015, 28, 404–428. [Google Scholar] [CrossRef]
  12. Kiparsky, M.; Sedlak, D.L.; Thompson, B.H., Jr.; Truffer, B. The innovation deficit in urban water: The need for an integrated perspective on institutions, organizations, and technology. Environ. Eng. Sci. 2013, 30, 395–408. [Google Scholar] [CrossRef] [PubMed]
  13. Pahl-Wostl, C. Towards sustainability in the water sector–The importance of human actors and processes of social learning. Aquat. Sci. Res. Bound. 2002, 64, 394–411. [Google Scholar] [CrossRef]
  14. Marques, R.C.; da Cruz, N.F.; Pires, J. Measuring the sustainability of urban water services. Environ. Sci. Policy 2015, 54, 142–151. [Google Scholar] [CrossRef]
  15. Schaefer, A. Contrasting institutional and performance accounts of environmental management systems: Three case studies in the UK water and sewerage industry. J. Manag. Stud. 2007, 44, 506–535. [Google Scholar] [CrossRef]
  16. Arnold, M. The lack of strategic sustainability orientation in German water companies. Ecol. Econ. 2015, 117, 39–52. [Google Scholar] [CrossRef]
  17. Deegan, C. Introduction: The legitimising effect of social and environmental disclosures—A theoretical foundation. Account. Audit. Account. J. 2002, 15, 282–311. [Google Scholar] [CrossRef]
  18. Greiling, D.; Grüb, B. Sustainability reporting in Austrian and German local public enterprises. J. Econ. Policy Reform 2014, 17, 209–223. [Google Scholar] [CrossRef]
  19. United Nations General Assembly. Transforming Our World: The 2030 Agenda for Sustainable Development, Resolution A/70/L.1, 2015. Available online: https://sustainabledevelopment.un.org/content/documents/21252030%20Agenda%20for%20Sustainable%20Development%20web.pdf (accessed on 20 November 2017).
  20. Carroll, A.B. A three-dimensional conceptual model of corporate performance. Acad. Manag. Rev. 1979, 4, 497–505. [Google Scholar]
  21. Porter, M.E.; Kramer, M.R. Strategy & society: The link between competitive advantage and corporate social responsibility. Harv. Bus. Rev. 2006, 84, 78–92. [Google Scholar] [PubMed]
  22. Porter, M.E.; Kramer, M.R. The Big Idea: Creating Shared Value. How to reinvent capitalism—and unleash a wave of innovation and growth. Harv. Bus. Rev. 2011, 89, 62–77. [Google Scholar]
  23. Lehman, G. Disclosing new worlds: A role for social and environmental accounting and auditing. Account. Organ. Soc. 1999, 24, 217–241. [Google Scholar] [CrossRef]
  24. Chen, J.C.; Roberts, R.W. Toward a more coherent understanding of the organization–society relationship: A theoretical consideration for social and environmental accounting research. J. Bus. Ethics 2010, 97, 651–665. [Google Scholar] [CrossRef]
  25. Tomaževič, N.; Tekavčič, M.; Peljhan, D. Towards excellence in public administration: Organisation theory-based performance management model. Total Qual. Manag. Bus. Excell. 2017, 28, 578–599. [Google Scholar] [CrossRef]
  26. Clarke, J.; Gibson-Sweet, M. The use of corporate social disclosures in the management of reputation and legitimacy: A cross sectoral analysis of UK Top 100 Companies. Bus. Ethics Eur. Rev. 1999, 8, 5–13. [Google Scholar] [CrossRef]
  27. Von Schwedler, M. CSR in the UK Water Industry: ‘Doing the Right Thing’? A Case Study. Soc. Environ. Account. J. 2011, 31, 125–137. [Google Scholar] [CrossRef]
  28. Molinos-Senante, M.; Marques, R.C.; Pérez, F.; Gómez, T.; Sala-Garrido, R.; Caballero, R. Assessing the sustainability of water companies: A synthetic indicator approach. Ecol. Indic. 2016, 61, 577–587. [Google Scholar] [CrossRef]
  29. Tregidga, H.; Milne, M.J. From sustainable management to sustainable development: A longitudinal analysis of a leading New Zealand environmental reporter. Bus. Strateg. Environ. 2006, 15, 219–241. [Google Scholar] [CrossRef]
  30. Larrinaga-Gonzélez, C.; Pérez-Chamorro, V. Sustainability accounting and accountability in public water companies. Public Money Manag. 2008, 28, 337–343. [Google Scholar] [CrossRef]
  31. Palme, U.; Tillman, A.M. Sustainable development indicators: How are they used in Swedish water utilities? J. Clean. Prod. 2008, 16, 1346–1357. [Google Scholar] [CrossRef]
  32. Linneman, M.H.; Hoekstra, A.Y.; Berkhout, W. Ranking water transparency of Dutch Stock-listed companies. Sustainability 2015, 7, 4341–4359. [Google Scholar] [CrossRef]
  33. Kleinman, G.; Kuei, C.-H.; Lee, P. Using formal concept analysis to examine water disclosure in corporate social responsibility reports. Corp. Soc. Responsib. Environ. Manag. 2017, 24, 241–356. [Google Scholar] [CrossRef]
  34. Lambooy, T. Corporate social responsibility: Sustainable water use. J. Clean. Prod. 2011, 19, 852–866. [Google Scholar] [CrossRef]
  35. Askham, T.M.; Van der Poll, H.M. Water Sustainability of Selected Mining Companies in South Africa. Sustainability 2017, 9, 957. [Google Scholar] [CrossRef]
  36. Nikolaou, I.E.; Kourouklaris, G.; Tsalis, T.A. A framework to assist the financial community in incorporating water risks into their investment decisions. J. Sustain. Financ. Invest. 2014, 4, 93–109. [Google Scholar] [CrossRef]
  37. Krippendorff, K. Content Analysis: An Introduction to Its Methodology; Sage: Thousand Oaks, CA, USA, 2013. [Google Scholar]
  38. Milne, M.J.; Adler, R.W. Exploring the reliability of social and environmental disclosures content analysis. Account. Audit. Account. J. 1999, 12, 237–256. [Google Scholar] [CrossRef]
  39. Gray, R.; Kouhy, R.; Lavers, S. Corporate social and environmental reporting: A review of the literature and a longitudinal study of UK disclosure. Account. Audit. Account. J. 1995, 8, 47–77. [Google Scholar] [CrossRef]
  40. SASB. Water Utilities Sustainability Accounting Standard, Sustainability Accounting Standards Board. March 2016. Available online: https://www.sasb.org/wpcontent/uploads/2016/03/IF0103_WaterUtilities_Standard.pdf (accessed on 20 October 2017).
  41. GRI 303: Water 2016. Available online: https://www.globalreporting.org/standards/gri-standards-download-center/?g=38662903-539c-4e4b-b76f-7a105c475de0 (accessed on 20 October 2017).
  42. GRI 306: Effluents and Waste 2016. Available online: https://www.globalreporting.org/standards/gri-standards-download-center/?g=38662903-539c-4e4b-b76f-7a105c475de0 (accessed on 20 October 2017).
  43. Pinto, F.S.; Simões, P.; Marques, R.C. Raising the bar: The role of governance in performance assessments. Util. Policy 2017, 49, 38–47. [Google Scholar] [CrossRef]
  44. Nikolaou, I.E.; Tsalis, T.A. Development of a sustainable balanced scorecard framework. Ecol. Indic. 2013, 34, 76–86. [Google Scholar] [CrossRef]
  45. Tsalis, T.; Avramidou, A.; Nikolaou, I.E. A social LCA framework to assess the corporate social profile of companies: Insights from a case study. J. Clean. Prod. 2017, 164 (Suppl. C), 1665–1676. [Google Scholar] [CrossRef]
  46. Demertzidis, N.; Tsalis, T.A.; Loupa, G.; Nikolaou, I.E. A benchmarking framework to evaluate business climate change risks: A practical tool suitable for investors decision-making process. Clim. Risk Manag. 2015, 10, 95–105. [Google Scholar] [CrossRef]
  47. Global Reporting Initiative. Sustainability Disclosure Database Data Legend. 2015. Available online: https://www.globalreporting.org/SiteCollectionDocuments/GRI-Data-Legend-Sustainability-Disclosure-Database-Profiling.pdf (accessed on 20 October 2017).
Figure 1. Methodological framework.
Sustainability 10 00433 g001
Figure 2. TAI scores of water utilities.
Sustainability 10 00433 g002
Table 1. Indicators grid.
DescriptionDescription
Aspect A:Water withdrawalAspect G: Drinking Water Quality
A1Total volume of water withdrawal by source (surface water, groundwater)QntG1Drinking Water QualityQnt
A2Total volume or % of water purchased from a third partyQntG2Number of health-based and non-health-based quality violationsQnt
Aspect B: Water sources significantly affected and water scarcityAspect H: Complaints and grievance mechanism
B1Total number of water sources significantly affected by withdrawal by typeQntH1Number of customer complaints regarding pricingQnt
B2Size of the water sourceQntH2Number of customer complaints regarding water quality issuesQnt
B3Total fresh water sourced from regions with High or Extremely High Baseline Water StressQntH3Number of customer complaints regarding disruptions to water supplyQnt
B4Indication of withdrawal from nationally or internationally protected areas, or biodiversity areasQltH4Discussion of how considerations of fair pricing and access are integrated into determinations of rate structuresQlt
B5Value or importance of the water source to local communities and indigenous populationQltAspect I: End-use efficiency and water protection initiatives
Aspect C:Water recycled/reused and dischargedI1Customer water savings from efficiency measures by marketQnt
C1Total volume of water recycled and reusedQntI2Education/cooperation programs or campaigns which aim to inform the local community about the value of drinking waterQlt
C2Percentage of water recycled and reused (Potable reuse)QntAspect J: Distribution network efficiency
C3Percentage of water recycled and reused (Non-potable reuse)QntJ1Water pipe replacement rateQnt
C4Total volume of planned and unplanned water discharges by destinationQntJ2Volume of non-revenue real water lossesQnt
Aspect D: Activity metricsAspect K: Network resiliency and impacts from climate change
D1Number of residential customersQntK1Water treatment capacity located in) Special Flood Hazard Areas or foreign equivalentQnt
D2Number of non-residential customersQntK2Volume of sanitary sewer overflows (SSO), percentage recoveredQnt
D3Volume of water deliveredQntK3Number of service disruptionsQnt
D4Average volume of wastewater treated per dayQntK4Number of people affected by disruptionsQnt
D5Length of transportation and distribution linesQntK5Average duration of disruptionQnt
Aspect E: Energy ManagementK6Discussion of efforts to identify and manage risks and opportunities related to the impact of climate change on the distribution networkQlt
E1Total energy consumedQnt
E2Percentage of grid electricityQnt
E3Percentage of renewable energyQnt
E4Percentage of energy consumed per sourceQnt
E5Total CO2 emissionsQnt
Aspect F: Effluent Quality
F1Water discharges quality and the treatment methodQnt
F2Number of incidents of non-compliance with water effluent qualityQnt
Qnt: Quantitative indicator, Qlt: Qualitative indicator.
Table 2. The number of indicators and the maximum Total Accountability Index (TAI) score of each sustainability aspect.
AspectsDescriptionNumber of IndicatorsMax ScoreThreshold Score
Qualitative (Scoring Scale: 0–1)Quantitative (Scoring Scale: 0–3)
AWater withdrawal0263
BWater sources significantly affected and water scarcity23115.5
CWater recycled/reused and discharged04126
DActivity metrics05157.5
EEnergy Management05157.5
FEffluent Quality0263
GDrinking Water Quality0263
HComplaints and grievance mechanism13105
IEnd-use efficiency and water protection initiatives1142
JDistribution network efficiency0263
KNetwork resiliency and impacts from climate change15168
Total Indicators53410753.5
Table 3. Descriptive characteristics of the sample firms and sustainability reports.
Water Utilities’ CharacteristicsNumber of Water UtilitiesReports’ CharacteristicsNumber of Reports
Industry sectorWater utilities9External assuranceNo14
Multiutilities13Yes8
Listing statusNon listed water utilities17Average number of pages of the examined reports126
Listed utilities5
Size of utilitiesSmall and Medium-sized Enterprises (SME)9Reports’ Year20153
Large13201619
Average number of reports6
Table 4. The level of disclosure in the water utilities’ sustainability reports.
Information Quality Levels
Level 0LLevel 1Level 2Level 3Level 0Level 1Level 2Level 3
A163211E550413
A215115F121442
B180131F217401
B219030G111272
B319210G212163
B414800H113702
B520200H214602
C116222H310615
C222000H481400
C320110I115700
C416321I291300
D122810J114602
D211434J24828
D320515K122000
D421901K221001
D5001111K315043
E130712K420101
E215052K517032
E316042K615700
E413513
Table 5. TAI score of each Indicator.
IndicatorsAverage ScoreMax ScoreThreshold ScoreIndicatorsAverage ScoreMax ScoreThreshold Score
A11.823F11.273
A20.823F20.323
ASPECT_A2.6463ASPECT_F1.5963
B11.323G11.453
B20.273G21.003
B30.183ASPECT_G2.4563
B40.361H10.593
B50.091H20.553
ASPECT_B2.23115.5H31.053
C10.553H40.641
C203ASPECT_H2.82105
C30.143I10.323
C40.453I20.591
ASPECT_C1.14126ASPECT_I0.8242
D12.183J10.553
D21.003J21.643
D32.503ASPECT_J2.1863
D41.003K103
D52.503K20.143
ASPECT_D9.18157.5K30.773
E12.273K40.183
E20.733K50.553
E30.643K60.321
E40.733ASPECT_K1.95168
E52.143
ASPECT_E6.50157.5

