Article

Transfer of Virtual Water of Woody Forest Products from China

1
School of Remote Sensing and Geomatics Engineering, Nanjing University of Information Science and Technology, Nanjing 210044, China
2
Key Laboratory of Land Surface Pattern and Simulation, Institute of Geographic Sciences and Natural Resources Research, Chinese Academy of Sciences, Beijing 100101, China
3
College of Resources and Environment, University of Chinese Academy of Sciences, Beijing 100049, China
4
Department of Agricultural Engineering, School of Technology, Njala University, Freetown, Sierra Leone
*
Author to whom correspondence should be addressed.
Sustainability 2018, 10(2), 410; https://doi.org/10.3390/su10020410
Submission received: 23 November 2017 / Revised: 26 January 2018 / Accepted: 29 January 2018 / Published: 5 February 2018

Abstract

:
Global freshwater resources are under increasing pressure. It is reported that international trade of water-intensive products (the so-called virtual water trade) can be used to ease global water pressure. In spite of the significant amount of international trade of woody forest products, virtual water of woody forest products (VWWFP) and the corresponding international trade are largely ignored. However, virtual water research has progressed steadily. This study maps VWWFP and statistically analyzes China’s official data for the period 1993–2014. The results show a rapid increase in the trend of VWWFP flow from China, reaching 7.61 × 10¹² m3 or 3.48 times annual virtual water trade for agricultural products. The export and import volumes of China are respectively 1.27 × 10¹² m3 and 6.34 × 10¹² m3 for 1993–2014. China imported a total of 5.07 × 10¹² m3 of VWWFP in 1993–2014 to lessen domestic water pressure, which is five times the annual water transfer via China’s South–North Water Transfer project. Asia and Europe account for the highest contribution (50.52%) to China’s import. Other contributors include the Russian Federation (16.63%), Indonesia (13.45%), Canada (13.41%), the United States of America (9.60%), Brazil (7.23%) and Malaysia (6.33%). China mainly exports VWWFP to Asia (47.68%), North America (23.24%), and Europe (20.01%). The countries which export the highest amount of VWWFP include the United States of America, Japan, Republic of Korea and Canada. Then the countries which import the highest amount of VWWFP include the Russian Federation, Canada, United States of America, and Brazil. The VWWFP flow study shows an obvious geographical distribution that is driven by proximity and traffic since transportation cost of woody forest products could be significant.

1. Introduction

The challenges of feeding the world’s population using the limited water resources have been compounded by population growth, socio-economic development, climate change and global warming [1]. The geographical mismatch between freshwater demand and available freshwater resources is one of the largest threats to sustainable water supply worldwide [2]. Water used to produce a good or service becomes virtual water if the good or service is transferred from one place to another [3]. Trade of goods is an important way of transfer of water resources among places, the so-called virtual water [4]. Product trade in favor of saving water on a global scale also encourages the exchange of virtual water from highly productive regions to less productive ones, resulting in less water use per commodity produced [5,6].
Professor Tony Allan of London University first proposed and expanded the theory of virtual water in 1993 with regard to the water required for the production of goods and services along supply chains [3,7]. Virtual water footprint of woody forest commodity is the volume of water embodied in the entire transfer process of that commodity. Virtual water theory provides a new ideal on global water balance that is directed towards improving water use efficiency and easing water shortage [8]. Given its potential benefits, virtual water theory has attracted the attention of countless scholars, professionals and decision-makers and is widely applied in global water balance strategies. In the past 30 years, significant improvements have been made in the quantification and development of models on virtual water theory for agricultural products [9,10]. Hoekstra and Hung (2002) estimated the virtual water of crops in numerous countries. Virtual water of crops is generally divided into subtypes that are calculated separately [11] at river basin [12], national [11,13] and global [9,14] scales, such as soybeans, wheat, corn. Studies suggest that virtual water trade can prevent water shortage or water crisis and food insecurity [3]. In recent years, studies in this field have focused on crops, water footprints, water trade, water use efficiency and water management strategies [5,6,7,8,9,10,11,12,13,14,15]. Even though woody products have a large share in the international trade, they have not received attention deserved in previous studies.
Water footprint is based on virtual water content [15], which is the aggregate of freshwater use over a production chain of a product or service [16]. Water footprint is an indicator for both direct (domestic water use) and indirect (water required for industrial and agricultural production) water use of a consumer or producer. This is significant improvement in quantitative calculation of water footprint of agricultural products [17]. The variations in crop water footprint among countries and regions are due to differences in the geography, climate, production technology and yield [18]. Today, scholars and experts have been paying more attention to water footprint of woody forest products [19,20,21]. For example, Schyns (2017) estimated global water use of the forestry sector related to round-wood production for lumber, pulp, paper, fuel and firewood for the period 1961–2010 [20].
International virtual water trade constitutes a weighted and directed network of link directions driven by trade (i.e., from exporting to importing countries) and of link weights that give the volume of virtual water trade between the countries [15]. However, the study of this network lacks analysis on trade of virtual water of woody forest products (VWWFP). Although studies have improved the understanding and policies on agriculture, knowledge on VWWFP remains scarce. The trade of woody forest products has rapidly expanded with socio-economic and technological development, and improvement in transportation and ease of living. International trade of specific water-intensive products such as woody forest products involves large amounts of virtual water. As a strategic trade partner, China has become the second-largest importer and sixth-largest exporter of woody forest products since 2005, and its presence in the market continues to rise. Thus, the trade structure of VWWFP is closely related to the structure of woody forest trades in China. But we do not know transfer quantity and direction of virtual water of woody forest products from China for the production of wood products such as round-wood, sawn-wood, wood residues, wood charcoal, wood-based panels, wood pulp and recovered paper products.
International trade of VWWFP from China with other countries and continents and the contribution of the continents and countries to China’s net import of VWWFP were analyzed in this study. The baseline data used to analyze and depict the flow of VWWFP were obtained from China’s official data for the period 1993–2014. We quantified the amount of VWWFP transfer from China and depicted the changing trend and export structure of China’s VWWFP for the period of observation. Based on the output, we then further analyzed for the import and export patterns of China for the VWWFP trade in order to determine VWWFP flow patterns and the degree of contributions of other countries to easing water shortage in China.

2. Materials and Methods

2.1. Data Source

Trade data on China’s woody forest products were collected from the official foreign trade yearbook of China [22]. Then trade flow data on China’s woody forest products were collected from the Food and Agriculture Organization of the United Nations (FAO) [23]. Import and export data for 1993–2014 were used to quantify the amount of VWWFP and then to depict the change in trend and export structure of China’s VWWFP. China’s trade flow data for 1997–2014 were used to determine trade flow patterns of China’s VWWFP.

2.2. VWWFP Export

Virtual water is the water consumed in the production of a commodity or service [7]. VWWFP is the cumulative amount of water consumed in the production of a woody forest product [24]. As proposed by the Institute of International Hydrological and Environmental Engineering Research in the Netherlands, the World Water Resources Committee and FAO, virtual water can be calculated by multiplying the quantity of trade products or services by the related virtual water footprints (virtual water for producing unit quantity of the product or service) [25]. Thus, VWWFP export can be expressed as:
V W E [ c , t ] = C T e [ c , t ] × S W D e [ c , t ]
where VWE[c,t] is export amount of virtual water of c woody forest products in t year (m3); CTe[c,t] is export amount of c woody forest products in t year (tons); and SWDe[c,t] is water footprint of virtual water for unit woody forest product (m3/ton), including water consumption of forest (actual evaporation) and water consumption for producing a unit amount of the product. We adopted the SWDe[c,t] values as explained by Minghua et al. [24] as shown in Table S1. The total export of VWWFP in a certain country is expressed as:
G V W E [ c , t ] = V W E [ c , t ]
where GVWE[t] is total VWWFP export in t year (m3); and VWE[c,t] is export of virtual water of c woody forest product (m3).

2.3. VWWFP Import

Also, VWWFP import is expressed as:
V W I [ c , t ] = C T i [ c , t ] × S W D i [ c , t ]
where VWI[t] is import volume of virtual water of c woody forest product in t year (m3); CTi is import volume of c woody forest product in t year (tons); and SWDi[c,t] is water footprint of virtual water of unit amount of woody forest product (m3/ton). We also adopted the values given by Minghua et al. [24]. Total VWWFP import in a certain country is expressed as:
G V W I [ t ] = V W I [ c , t ]
where GVWI[t] is total VWWFP import in t year (m3); and VWI[c,t] is import virtual water of c woody forest product (m3).

2.4. VWWFP Trade Balance

There is need to understand VWWFP import and export and how it relates to trade balance. Thus, VWWFP trade balance is expressed as:
N V W I [ t ] = G V W I [ t ] G V W E [ t ]
where NVWI[t] is China’s net import of VWWFP. If the value is positive, then VWWFP import is greater than VWWFP export, and vice versa. When it is zero, then virtual water export is offset by virtual water import.

2.5. Contribution to China

Virtual water trade can improve water use efficiency and ease water shortage in water-scarce regions [8]. Here, we further estimated the contributions of the continents and countries to easing water shortage in China via virtual water trade. This is expressed as:
C R [ n ,   t ] = N E [ t ] N V W I [ t ] × 100 %
where CR[n,t] is the contribution of country/continent (n) to China, where CR[n,t] is greater than zero. NE[t] is the net import from a certain nation/continent to China in period t which is the result of being offset by virtual water import from China; when the value is positive, then we can say that this nation/continent has contribution to China in period t, and vice versa. And NVWI[t] is the total amount of net import of VWWFP of China in t period.

2.6. VWWFP Trend

In this study, the Theil-Sen estimator [26,27] was used to determine the change in trend of the various types of VWWFP, including total transfer of VWWFP, VWWFP export, VWWFP import and VWWFP trade balance (net import of VWWFP) for China in 1997–2014. The Theil-Sen estimator is robust in analyzing trends for non-parametric statistics [26,27] and is particularly effective for the estimation of trends in small time series [28]. The calculation principle is to first divide the time series data into n(n − 1)/2 pairwise combinations before calculating the slope of each data pair. The Theil-Sen median slope is then the median of all the slopes. We can express this method by computational formula as:
T S = M e d i a n ( V W W F P s j V W W F P s i t 0 t )
where TS is the Theil-Sen median slope; Median is the median of a set of data values; t0 and t represent the beginning and end year of the analysis respectively; and VWWFPsi is the value of a certain VWWFP in year i. TS > 0 indicates a downward trend and TS < 0 indicates an upward trend [24]. The absolute value of |TS| is expressed as the rate of change per year. The TS estimator is used to estimate this rate when the trend is demonstrated to be linear [29,30].

3. Results

3.1. Total VWWFP Transfer

3.1.1. Quantity and Structure

Based on China’s forest statistical yearbook [22], total export and import of VWWFP for 1993–2014 were 1.27 × 10¹² m3 and 6.34 × 10¹² m3, respectively. Of the total VWWFP export, virtual water of wood-based panels (VWWP) was the largest (8.04 × 10¹¹ m3 or 63.52%, Figure 1a), followed by that of paper and paperboard (VWPP), virtual water of sawn-wood (VWS),wood residues and wood charcoal (VWWRC), wood pulp and recovered paper (VWPRP), and round-wood (VWR), with respective values of 3.76 × 10¹¹ m3 (29.68%), 3.995 × 10¹⁰ m3 (3.16%), 3.961 × 10¹⁰ m3 (3.12%), 4.88 × 10⁹ m3 (0.39%), and 1.63 × 10⁹ m3 (0.13%) (Table 1 and Figure 1a). However, the volume of all the VWWFP import, except VWWP, was greater than that of VWWFP export, leading to a net VWWFP import of 5.11 × 10¹² m3 in 1993–2014. The largest proportion of VWWFP import was from VWPRP, with an import volume of 4.01 × 10¹² m3 (Table 1) and accounting for 62.86% (Figure 1b) of the total import. This was 4.01 × 10¹² m3 greater than that of VWWFP export. Also, the smallest proportion of VWWFP import was from VWWRC, with an import volume of 8.37 × 10¹⁰ m3, which was 3.58 × 10¹⁰ m3 more than that of virtual water export. Virtual water for sawn-wood (VWS) was 4.00 × 10¹⁰ m3.

3.1.2. Change in Trend
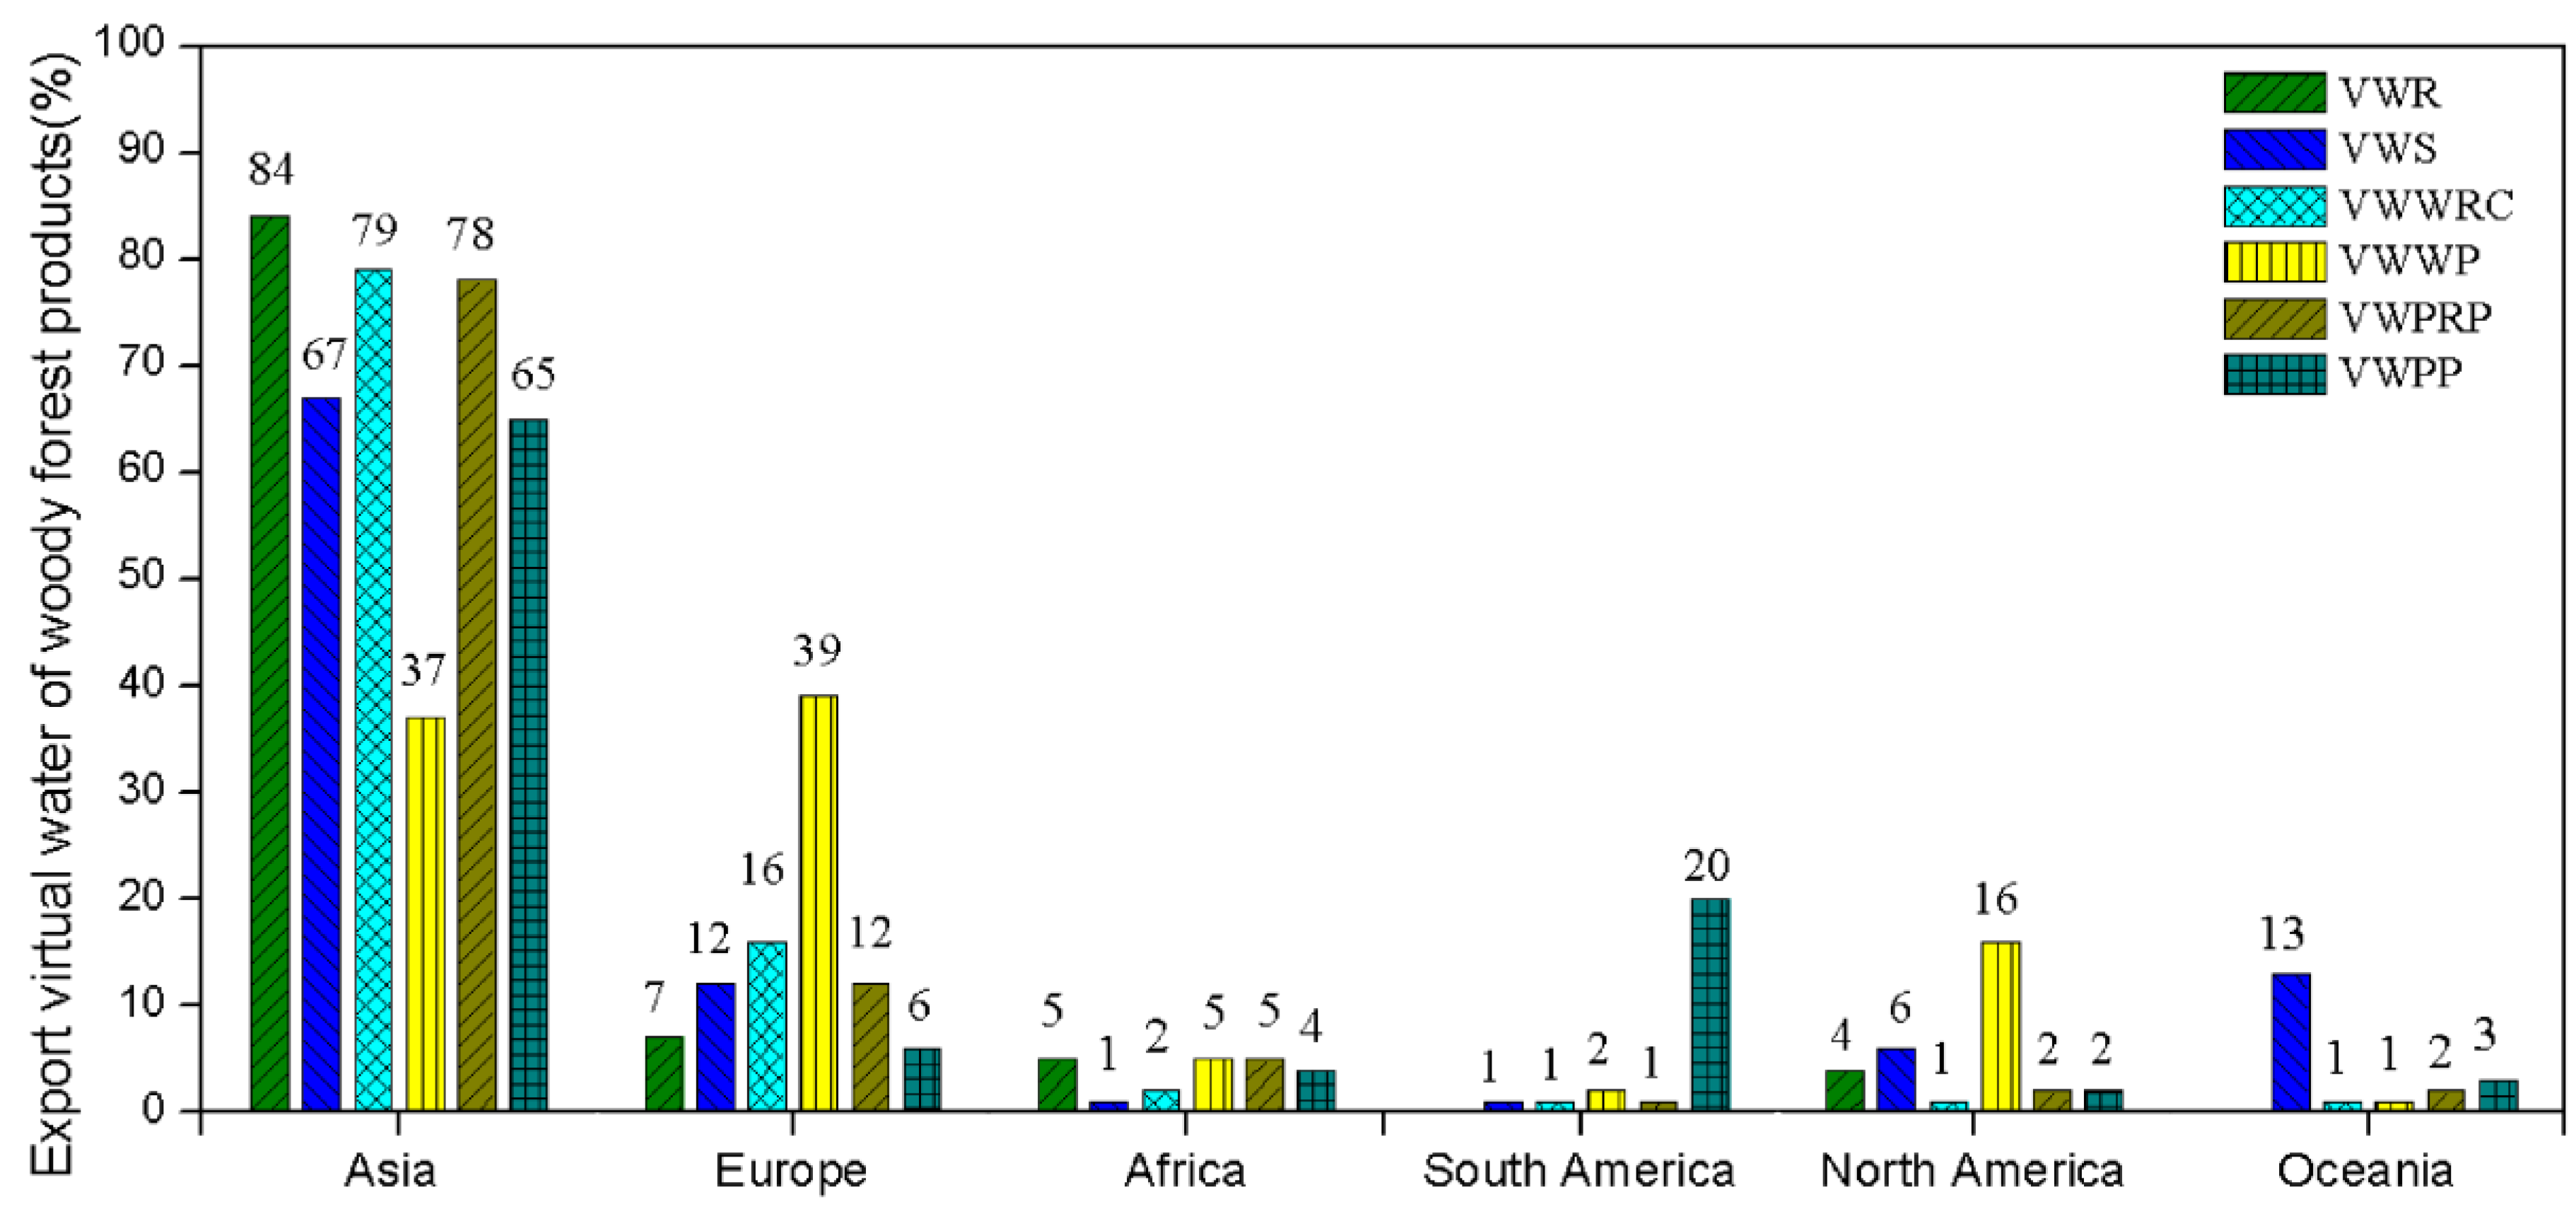
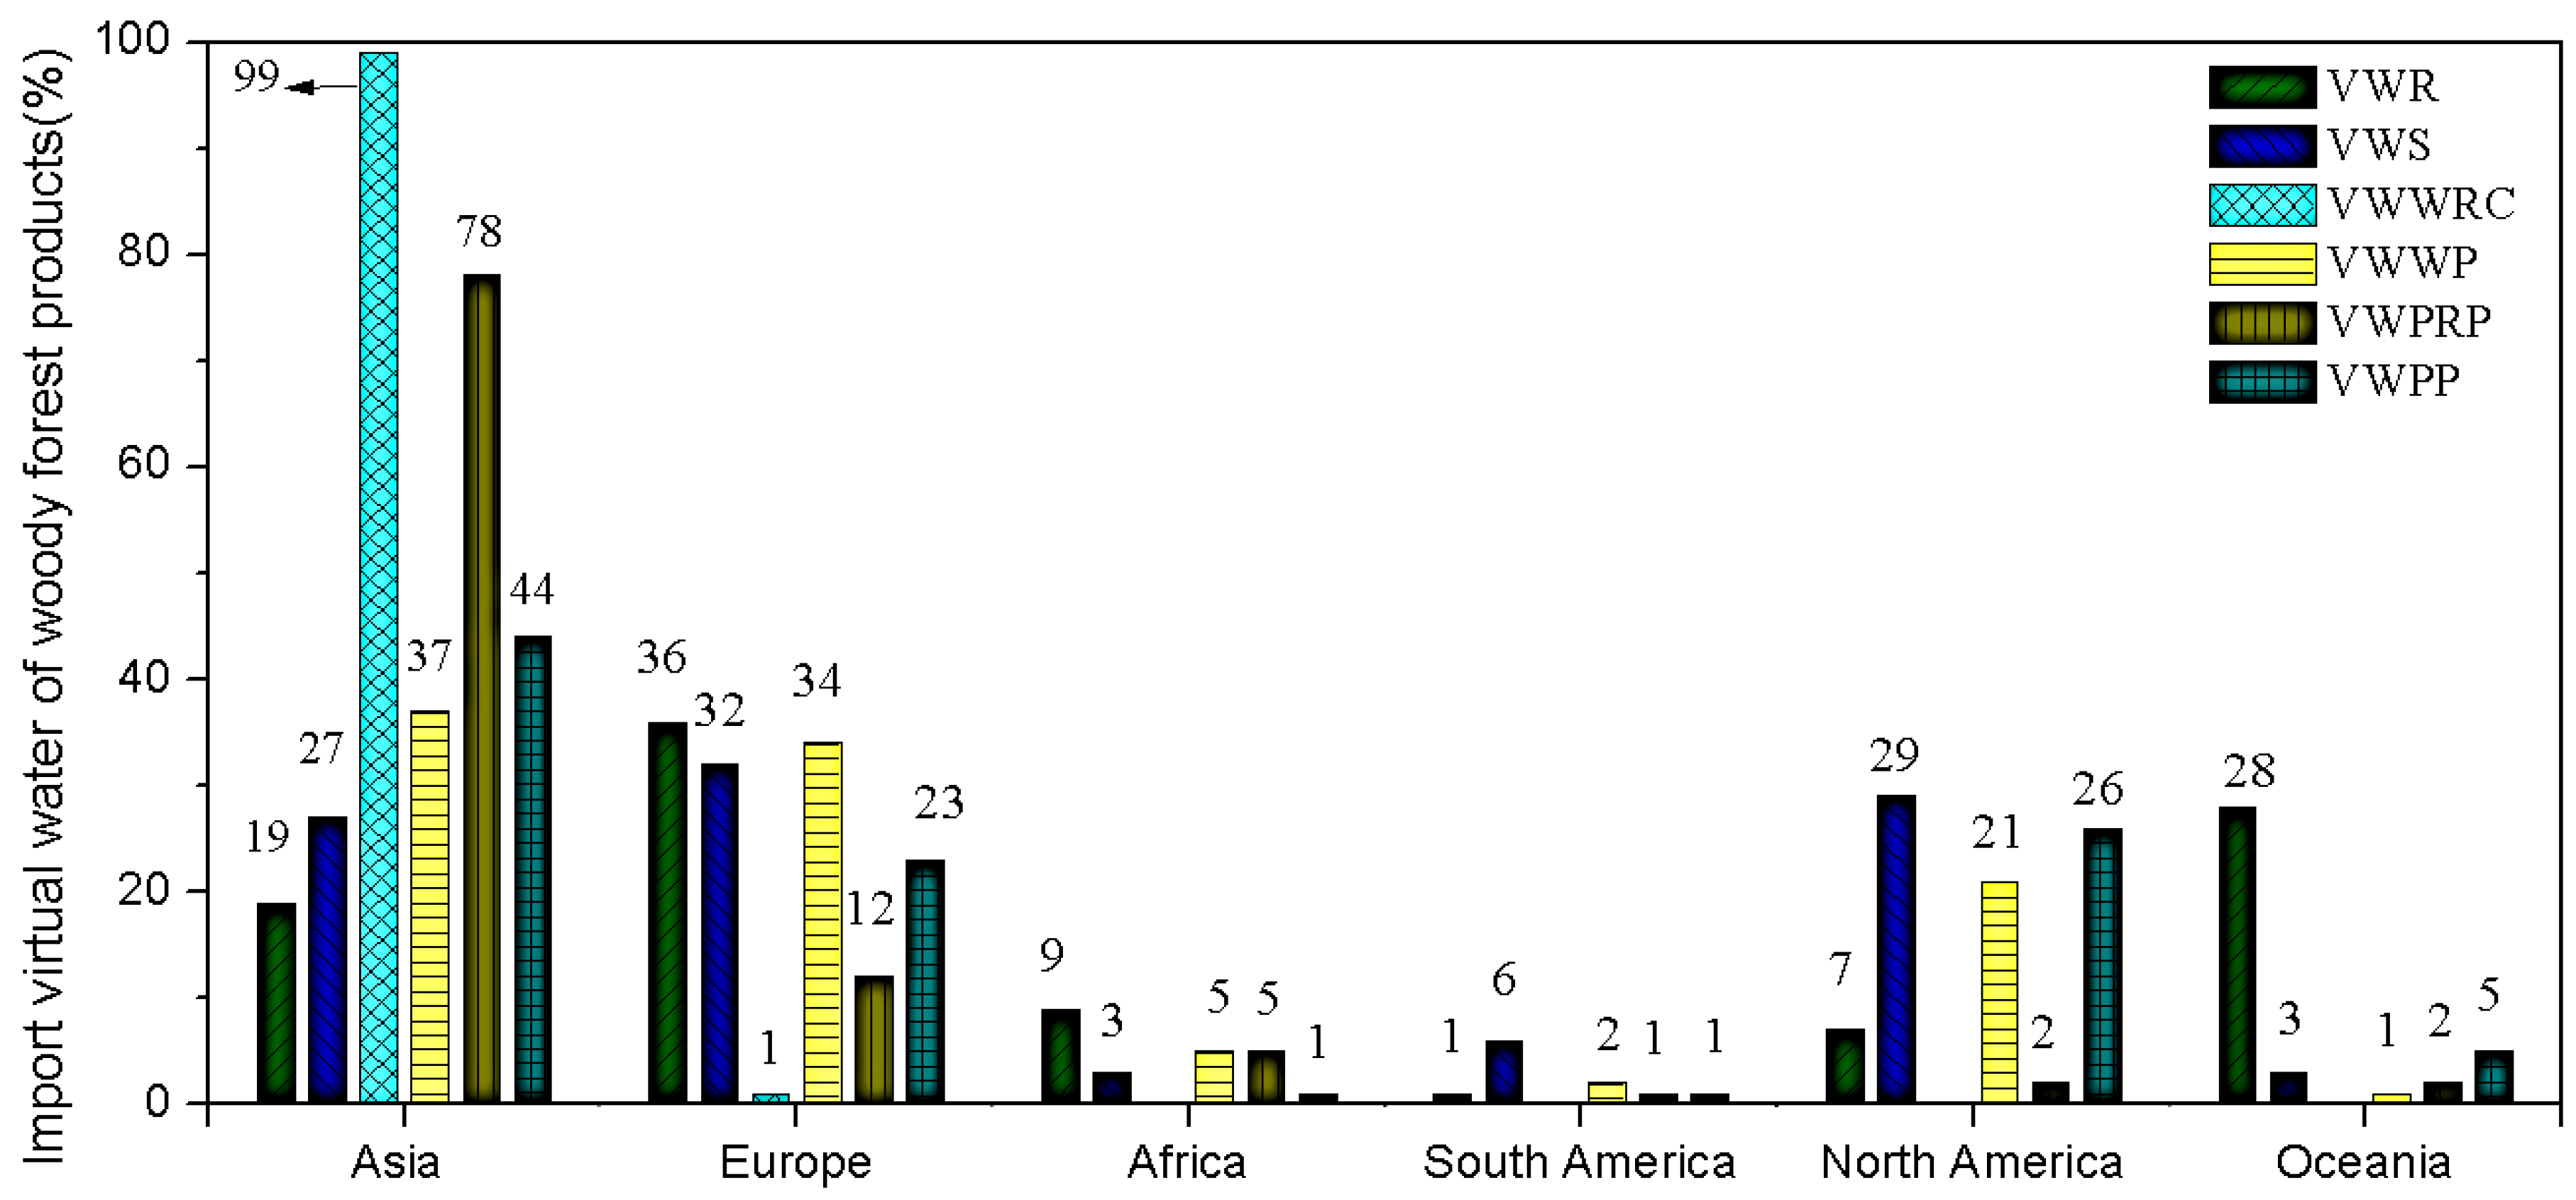
Figure 2 shows the change trend of VWWFP, including total volume transferred (export plus import volumes), export volume, import volume and trade balance (net import volume) in China for 1993–2014. Given that VWWFP export and VWWFP import had obvious growth trends (Figure 2b,c), total transfer has increased since 1993 at an annual average rate of 3.70 × 10¹⁰ m3 (Figure 2a). The volume of VWWFP import was greater than VWWFP export and the annual rate of increase in VWWFP import (8.03 × 10⁹ m3, Figure 2b) was greater than that in VWWFP export (2.90 × 10⁹ m3, Figure 2c); suggesting a trade deficit that is denoted by a negative value. This result indicated that the volume of virtual water import was greater than that of virtual water export and the volume of deficit obviously increased in trend at an annual average of 2.10 × 10¹¹ m3 (Figure 2d). Also, the total volume transferred (export plus import volumes), export volume and import volume had the most abrupt variations, with a sharp decline in 2008 and trade balance (net import volume) with a sharp rise in 2009.

3.2. Transfer Flow

Total VWWFP Transfer Flow

We further analyzed for virtual water export destinations and for virtual water import origins using the FAO data for 1997–2014 [23]. The result for intercontinental transfer of virtual water from China is plotted in Figure 3. Asia was the top importer of VWWFP from China, reaching 47.68% (6.06 × 10¹¹ m3) and North America the second-highest importer with 2.95 × 10¹¹ m3 (23.24%) (Figure 3a). Percent VWWFP export from China to Europe, Africa, Oceania and South America was respectively 20.01% (2.54 × 10¹¹ m3), 3.93% (4.99 × 10¹⁰ m3), 2.79% (3.54 × 10¹⁰ m3) and 2.35% (2.98 × 10¹¹ m3) (Figure 3a). Of the VWWFP import to China at continental scale, Asia was topped the list followed by Europe, with combined import of 61.16% (3.18 × 10¹² m3) for the observation period (Figure 3b). Meanwhile, North America, South America, Oceania and Africa were the third, fourth, fifth and sixth highest import sources of VWWFP to China for the observation period (Figure 3b).
Table 2 and Table 3 list the most reliant countries which imported from and exported to China in 1997–2014. The countries are ranked in the order of their share and volume contribution of import from or export to China (Table 2 and Table 3). The United States of America was most reliant on VWWFP import from China, with 18.00% of China’s VWWFP exported to the country in 1997–2014. This was followed by Japan and Republic of Korea, importing respectively 12.67% and 6.46% of China’s VWWFP. The United Kingdom, Canada and Saudi Arabia were the fourth, fifth and sixth most dependent on China’s VWWFP. Of the 11 most dependent countries or continents on China’s VWWFP, two countries (the United States of America and Canada) are in North America, accounting in total for 21.67% of VWWFP export from China. Three other countries are in Europe (including the United Kingdom, Belgium and Germany), accounting in total for 9.12%. Additionally, seven more countries are in Asia (Japan, Republic of Korea, Saudi Arabia, India, Malaysia, Thailand and Belgium), accounting in total for 32.71% of VWWFP export China. The other 37.86% exported from China were to the rest of the other countries in Table S3. The Russian Federation, Canada, Indonesia, United States of America and Brazil were the first, second, third, fourth and fifth highest exporters of VWWFP to China, accounting for 54.22% of the export total (Table 3). The other countries accounted for the remaining 45.78% (Table S3). The 11 countries jointly accounted for 77.21% of the total export, indicating that China’s VWWFP import sources were highly concentrated. At continental scale, 77.21% of China’s VWWFP import was from Asia (37.73%), North America (22.89%), South America (10.28) and Oceania (6.31%). The top 100 countries reliant on VWWFP import from China or export to China in 1997–2014 are listed in Tables S2 and S3.

3.3. Contribution of Nations or Continents to China

Contribution is the proportion of in the total amount of net import of VWWFP of China and net import from a certain nation/continent to China is the result of being offset by virtual water import from China in period of 1993–2014. As in Figure 4, Europe had the highest share in terms of easing China’s water pressure due to economic development, population growth and climate change; accounting for 28.64% of the total net VWWFP import. Then Asia accounted for 30.89% of China’s total net VWWFP import. The sum of both continents accounted for 58.53% of to China’s total net VWWFP import. At country scale, the first, second, third, fourth, fifth and sixth most shares came from the Russian Federation (8.33 × 10¹¹ m3 or 16.63%), Indonesia (6.73 × 10¹¹ m3 or 13.45%), Canada (6.71 × 10¹¹ m3 or 13.41%), the United States of America (4.81 × 10¹¹ m3 or 9.60%), Brazil (3.62 × 10¹¹ m3 or 7.23%) and Malaysia (3.17 × 10¹¹ m3 or 6.33%).

3.4. VWWFP Transfer Flow Type

In terms of VWWFP export from China, all VWWFP types, except VWWP, were primarily exported to Asia. VWR had the highest export volume to Asia, accounting for 84% of total VWR export in 1997–2014, followed by VWWRC (79%) and VWPRP (78%) (Figure 5). VWWP was primarily exported to Europe, Asia and North America, and the sum of VWWP export to Asia and Europe reached 76% (Figure 5). For VWWFP import types to China, most of China’s VWWRC, VWPRP and VWPP imports came from Asia. Then most of China’s VWR, VWWP and VWS imports came from Europe. VWWFP import from Africa was quite small (Figure 6). Obviously, the pattern of transfer of VWWFP from China was closely related to distance and traffic.

4. Discussions

The results showed that a significant amount of VWWFP trade occurred between China and other nations during the period of observation. Also, VWWFP transfers from China increased obviously since 1993. For China, the transfers of total VWWFP, VWWFP export and VWWFP import in 1993–2014 were 7.61 × 10¹² m3, 1.27 × 10¹² m3 and 6.34 × 10¹² m3, respectively. The annual average transfers of total VWWFP, VWWFP export, VWWFP import and net VWWFP import were 3.48 × 10¹¹ m3/yr, 5.77 × 10¹⁰ m3/yr, 2.90 × 10¹¹ m3/yr and 2.32 × 10¹¹ m3/yr, which were respectively 3.48 times, 5.05 times, 3.28 times and 3.01 times the corresponding annual mean virtual water trade in agriculture [31]. The role of VWWFP increased due to the obvious rise in total transfers of VWWFP import and export. Obviously, the trade volume of VWWFP was much higher than that of virtual water of agricultural products, strongly influencing water supply and demand. Thus, there was the need for a close monitoring of the effect of VWWFP on global water resource shortage [2].
In terms of VWWFP trade structure, VWWFP export flow from China was driven by VWWP and VWPP; which trend increased obviously. Meanwhile, import flow was driven by VWPRP and VWR and also with obvious increasing trends. These trends were mainly attributed to China’s foreign trade strategy which favored increased import of primary products and export of high-tech and value-added products [24]. The protection of forest resources and improvement of environmental awareness affected VWWFP transfers associated with woody forest [7]. As a leading country in afforestation [24] and with awareness on the numerous services of forests, China has conducted a series of ecological forest protection projects. These include Three-north Forest Protection Project, Yangtze River Forest Protection Project and Pearl River Forest Protection Project. Thus, few VWR and VWWRC were exported and the import volumes of VWWP, VWPRP and VWPP increased rapidly for the period of study.
Large net imports of VWWFP have eased water resource shortage in China. For 1993–2014, China imported 5.07 × 10¹² m3 of VWWFP, which significantly eased the water stress due to the rapid economic development. The annual average import of virtual water was 8.29% of China’s total annual freshwater (2.8 × 10¹² m3) [32]. The geographical mismatch between freshwater demand and available freshwater resources is one of the biggest threats to sustainable water supply in China [33]. Recognizing this mismatch, China has been developing over 20 major physical water transfer projects, with a total length of over 7200 km. One of these projects is the world’s largest—the South-North Water Transfer Project [32,34]. However, apart from these major physical water transfer projects, virtual water provides new way of remedying the spatial mismatch of water resources. Our study showed that VWWFP import in China is equivalent to about five times the annual transfer volume of the South-North Water Transfer Project, or the annual transfer volume (4.48 × 10¹⁰ m3) of water from Yangtze River Basin to Huang-Huai-Hai River Basin. Meanwhile, VWWFP flow is more convenient and cost-efficient than physical water transfer. Thus, it is necessary for China’s stakeholders to closely monitor virtual water transfers, including that of VWWFP.
As for the change trends of VWWFP, transfers of total VWWFP, VWWFP export and VWWFP import increased sharply whereas VWWFP trade balance declined continually in 1993–2014. The rising trend in the transfers of total VWWFP suggested that China’s participation, share and status in world’s forest virtual water trade market were increasing. But the rising trend in the transfer of total VWWFP was due to the sharp rise in VWWFP import. This is because VWWFP import increased on average at the rate of 29 × 109 m3/yr, which was 21.93 × 10⁹ m3/yr more than VWWFP export from China to other countries in 1993–2014. This led to the rapid decline in the volume of VWWFP trade balance (Figure 2d). This pattern of VWWFP transfer decreased water security due to increased dependency of China on net exporters. The sharp increase in VWWFP import was attributed to the changes of China’s foreign trade policies and the improvements in China’s market economy. Since the reform and opening-up, China has been implementing policies to encourage the import of forest products, making China the world's leading trading country in forest products; a move that has improved China’s position and competitiveness in international market [35]. After China’s government imposed a ban on forests with no cutting and limited cutting in 1998, China’s timber logging greatly reduced in a short period of time and the price of forest products on the Chinese market increased [36]. In order to meet the rising demand for forest products, China’s import of forest products rose sharply in 1998–2014. In 1993, the Chinese government completely eliminated the planned economy system, while simultaneously significantly reducing import duties in forest products [35,37]. Since joining WTO in 2001, trade in forest products has been further liberalized, import tariffs greatly reduced and non-tariff trade barriers phased out [35].
The big fluctuations of WWFP are closely related to the international financial crisis. As Figure 2 shows, virtual water in 2008 has the maximum fluctuation for the study period. The financial crisis in 2008 was responsible for the highest abrupt variations in the export, import and trade balance lines. The financial crisis in 2008 led to the collapse of a large number of enterprises dealing in forest woody products and employment in China, causing a rapid decline in import demand in WWFP [38]. This financial crisis led to the shrinking of international forest woody product market. This, in combination with the rapid rise of the value of the RMB, caused foreign markets in forest woody products to decline rapidly [39], and thus sharp decline in WWFP export. Also, the total VWWFP transfer, of course, fell rapidly. However, the Chinese government’s strong macroeconomic controls [38] delayed the most abrupt variations in VWWFP trade balance (net VWWFP import) until 2009.
VWWFP flow direction was also observed. Remarkably, VWWFP trade had obvious geographical distributions and followed the benefits of proximity and traffic. Thus, VWWFP trade countries were mainly concentrated in Asia and Europe. Indeed, the volume of wood forest products was relatively larger than that of other products but the cost of cross-regional transportation relatively higher. Thus, railway and sea lines were the main transportation paths for VWWFP flow as transportations by rail or sea decreased costs. The New Eurasian Continental Bridge made Europe the main VWWFP transfer region from China. The New Eurasian Continental Bridge began in 1992, starting from Lianyungang Port in China in the east to Rotterdam Port in the Netherlands in the west, covering a distance of 10,837 km [31], Geographical location and climatic conditions along the new Eurasian continental bridge are fine. It avoids the hot and cold regions, and the port of bridgehead-Lianyungang has no frozen period. Thus, the natural conditions are good and the volume of transportation is huge because trade activities are conducted throughout the year [40]. Meanwhile, the new Eurasian continental bridge to Europe and central Asia is about 900 km, some 2700 km shorter than the Siberian continental bridge, and thus costs less than transportation by sea [41]. As a result, the new Eurasian continental bridge has greatly strengthened and facilitated forest woody products trade of China with Asia and Europe.
Transfers of virtual water of woody forest products from China offers both opportunities and risks for other countries. On the one hand, China exported 1.27 × 10¹² m3 of VWWFP in 1993–2014, which is regarded as a possibly alternative source of water in countries with a relative shortage of freshwater [5]. Especially in the Middle East area, the net export volumes of China’s VWWFP in 1993–2014 to Iran, Turkey, Jordan, Egypt, Israel, Qatar, Kuwait, United Arab Emirates, Syrian Arab Republic, Iraq, Bahrain, Lebanon, Oman and Cyprus were 1.769 × 10¹⁰ m3, 1.398 × 10¹⁰ m3, 1.204 × 10¹⁰ m3, 0.989 × 10¹⁰ m3, 0.817 × 10¹⁰ m3, 0.689 × 10¹⁰ m3, 0.612 × 10¹⁰ m3, 0.609 × 10¹⁰ m3, 0.454 × 10¹⁰ m3, 0.248 × 10¹⁰ m3, 0.188 × 10¹⁰ m3, 0.186 × 10¹⁰ m3, 0.074 × 10¹⁰ m3 and 0.050 × 10¹⁰ m3, respectively (Tables S2 and S3). Import of water in the form of woody forest products is an effective way for China, a water-scarce country, to preserve domestic water resources as it saves water. On the other hand, export of VWWFP increases use and thus water scarcity in exporting countries with water shortage. For examples, the net imported volumes of VWWFP from Spain and Portugal to China in 1993–2014 were 1.60 × 10⁸ m3 and 5.74 × 10⁹ m3, respectively (Tables S2 and S3). However, as shown in Table 3, among the top eleven exporters of VWWFP to China, the Russian Federation, Canada, Indonesia, United States of America, Brazil, Republic of Korea, New Zealand and Papua New Guinea were relatively water-abundant countries, accounting for a total of 70.10% of the total VWWFP import. Therefore, VWWFPs flow to China had a relatively small negative impact on sustainable use of water resources in the other countries.

5. Conclusions

This study quantified VWWFP using official data. We noted a large VWWFP transfer from China via international trade in woody forest products during the 1993–2014. We also found that VWWFP trade structure was consistent with that of woody forest products. The total VWWFP trade, VWWFP import, VWWFP export and absolute net VWWFP import rapidly increased with globalization. Our results indicated that the transfer volume of VWWFP from China was equivalent to approximately five annual transfer volumes via the South-North Water Transfer Project.
The results also showed that numerous countries traded in VWWFPs with China, but VWWFP transfer of China had obvious variations in geographical distribution which was seemingly drive by convenience of proximity and traffic. The VWWFP trade paths of China were primarily concentrated in Asia and Europe, and trade with these regions were also controlled by distance and traffic. Trade patterns were based on the volume of woody forest products, which was relatively larger than that of other products. Therefore, the cross-regional transportation cost was relatively higher than other trade products.
Although a strong demand for international trade of woody forest products exists globally, virtual water of woody forest products failed to have the desired attention. Therefore, further studies on VWWFP and VWWFP trade were needed to add more dimensions to future virtual theory. This paper mapped transfers of VWWFP from China for the period 1993–2014 and quantified the contributions of all the continents and countries to China’s net import of VWWFP. However, we did not quantitatively judge whether the VWWFP patterns were reasonable. This shortcoming was attributed to the lack of evaluation methods and criteria. This is interesting point that needed critical further studies. However, this study on VWWFP flow has some theoretical and practical meaning. It could help policy makers, administrators and the scientific community to develop more effective water resources management strategies to address global water crisis by reallocations and improved water use efficiency.

Supplementary Materials

The following are available online at https://www.mdpi.com/2071-1050/10/2/410/s1, Table S1: Water footprint (m3/t) of the virtual water for woody forest products, Table S2: The top one hundred countries reliant on import of virtual water of woody forest products (VWWFP) from China in 1997–2014, Table S3: The top one hundred countries reliant on export of virtual water of woody forest products (VWWFP) to China in 1997–2014.

Acknowledgements

Funding for this study was provided by the National Key Research and Development Program of China (No. 2017YFA0604703) and the Startup Foundation for Introducing Talent of NUIST No. 2017r091. The data used are available at the websites, in official publications and referenced publication in the paper.

Author Contributions

Kaisheng Luo conducted the experiments, analysis and paper write-up. Fulu Tao conceived and designed the experiments and offered the guidance on the entire work. Juana P. Moiwo advised and modified the write-up. All the authors reviewed and revised the manuscript at every stage.

Conflicts of Interest

The authors declare no conflict of interest.

Appendix A

Water footprint of virtual water for woody forest products is the water consumed in producing per unit quantity of the product (m3/t) [24]. We adopted the calculated values of water footprint of virtual water per unit product using SWDe in Equation (1) and SWDi in Equation (3) as explained by Minghua et al. [25]—Table S1. Water footprint of virtual water per unit product for main woody forest products were calculated using the product tree method for representative species. The details of tree method are documented by Chapagain A. K. and Hoekstra A. Y. Virtual water trade: a quantification of virtual water flow among nations for livestock and livestock products (C)/Hoekstra A. Y. Virtual water trade: proceedings of international expert meeting on virtual water trade. Value of Water Research Report Series No. 12. Delft: NESCO-IHE Institute for Water Education. 2003: 49–76). The water footprint of virtual water (per unit product of a certain woody product) (SWDe in Equation (1) and SWDi in Equation (3)) multiplied by the quantity of the woody product (CTe in Equation (1) and CTi in Equation (3)) is the export or import amount of virtual water of a woody forest product type (VWE in Equation (1) and VWI in Equation (3)).

References

  1. Dalin, C.; Konar, M.; Hanasaki, N.; Rinaldo, A.; Rodriguez-Iturbe, I. Evolution of the global virtual water trade network. Proc. Natl. Acad. Sci. USA 2012, 109, 5989–5994. [Google Scholar] [CrossRef] [PubMed]
  2. Zhao, X.; Liu, J.G.; Liu, Q.Y.; Tillotson, M.R.; Guan, D.B.; Hubacek, K. Physical and virtual water transfers for regional water stress alleviation in China. Proc. Natl. Acad. Sci. USA 2015, 112, 1031–1035. [Google Scholar] [CrossRef] [PubMed]
  3. Allan, J.A. Virtual water—The water, food, and trade nexus useful concept or misleading metaphor? Water Int. 2003, 28, 106–113. [Google Scholar] [CrossRef]
  4. Tamea, S.; Laio, F.; Ridolfi, L. Global effects of local food-production crises: A virtual water perspective. Sci. Rep. 2016, 6, 18803. [Google Scholar] [CrossRef] [PubMed]
  5. Hoekstra, A.Y. Water Security of Nations: How International Trade Affects National Water Scarcity and Dependency. In Threats to Global Water Security; Jones, J.A.A., Vardanian, T.G., Hakopian, C., Eds.; Springer: Berlin, Germany, 2009; pp. 27–36. [Google Scholar]
  6. Hoekstra, A.Y.; Chapagain, A.K. The water footprints of Morocco and the Netherlands: Global water use as a result of domestic consumption of agricultural commodities. Ecol. Econ. 2007, 64, 143–151. [Google Scholar] [CrossRef]
  7. Goswami, P.; Nishad, S.N. Virtual water trade and time scales for loss of water sustainability: A comparative regional analysis. Sci. Rep. 2015, 5. [Google Scholar] [CrossRef] [PubMed]
  8. Orlowsky, B.; Hoekstra, A.Y.; Gudmundsson, L.; Seneviratne, S.I. Today’s virtual water consumption and trade under future water scarcity. Environ. Res. Lett. 2014, 9. [Google Scholar] [CrossRef]
  9. Hoekstra, A.Y.; Hung, P.Q. Globalisation of water resources: International virtual water flows in relation to crop trade. Glob. Environ. Chang. 2005, 15, 45–56. [Google Scholar] [CrossRef]
  10. Seyam, I.M.; Hoekstra, A.Y.; Savenije, H.H.G. Calculation methods to assess the value of upstream water flows and storage as a function of downstream benefits. Phys. Chem. Earth 2002, 27, 977–982. [Google Scholar] [CrossRef]
  11. Aldaya, M.M.; Hoekstra, A.Y. The water needed for Italians to eat pasta and pizza. Agric. Syst. 2010, 103, 351–360. [Google Scholar] [CrossRef]
  12. Su, X.L.; Li, J.F.; Singh, V. Optimal Allocation of Agricultural Water Resources Based on Virtual Water Subdivision in Shiyang River Basin. Water Resour. Manag. 2014, 28, 2243–2257. [Google Scholar] [CrossRef]
  13. Cazcarro, I.; Hoekstra, A.Y.; Choliz, J.S. The water footprint of tourism in Spain. Tour. Manag. 2014, 40, 90–101. [Google Scholar] [CrossRef]
  14. Hoekstra, A.Y.; Mekonnen, M.M. The water footprint of humanity. Proc. Natl. Acad. Sci. USA 2012, 109, 3232–3237. [Google Scholar] [CrossRef] [PubMed]
  15. Allan, J.A. Virtual water: A strategic resource global solutions to regional deficits. Ground Water 1998, 36, 545–546. [Google Scholar] [CrossRef]
  16. Carr, J.A.; D’Odorico, P.; Laio, F.; Ridolfi, L. Recent History and Geography of Virtual Water Trade. PloS ONE 2013, 8, e55825. [Google Scholar] [CrossRef] [PubMed]
  17. Lu, Y.; Zhang, X.Y.; Chen, S.Y.; Shao, L.W.; Sun, H.Y. Changes in water use efficiency and water footprint in grain production over the past 35 years: A case study in the North China Plain. J. Clean. Prod. 2016, 116, 71–79. [Google Scholar] [CrossRef]
  18. Chapagain, A.; Hoekstra, A. Water Footprints of Nations; UNESCO-IHE Delft: Delft, The Netherlands, 2004; Volume 1. [Google Scholar]
  19. Launiainen, S.; Futter, M.N.; Ellison, D.; Clarke, N.; Finer, L.; Hogbom, L.; Lauren, A.; Ring, E. Is the Water Footprint an Appropriate Tool for Forestry and Forest Products: The Fennoscandian Case. Ambio 2014, 43, 244–256. [Google Scholar] [CrossRef] [PubMed]
  20. Tian, M.H.; Ke, S.F. Virtual water content and trade analysis of primary woody products in China. Int. For. Rev. 2012, 14, 380–390. [Google Scholar] [CrossRef]
  21. Schyns, J.F.; Booij, M.J.; Hoekstra, A.Y. The water footprint of wood for lumber, pulp, paper, fuel and firewood. Adv. Water Resour. 2017, 107, 490–501. [Google Scholar] [CrossRef]
  22. China Forestry Administration, China Forestry Statistical Yearbook; China Forestry Press: Beijing, China, 2014; Volume 1993–2014.
  23. Food and Agriculture Organization of the United Nations (FAO). Global Forestry Product and Trade Statistics; Food and Agriculture Organization (FAO): Rome, Italy, 2014; Volume 1993–2014, Available online: http://www.fao.org/faostat/en/#data (accessed on 8 March 2017).
  24. Egan, M. The Water Footprint Assessment Manual. Setting the Global Standard. Soc. Environ. Account. J. 2011, 31, 24–25. [Google Scholar] [CrossRef]
  25. Minghua, T.; Cheng, L.; Qiujie, G. Initial Estimates of Content and Trade of Virtual Water by Woody Forest Products in China. J. Beijing For. Univ. (Soc. Sci.) 2012, 11, 82–87. (In Chinese) [Google Scholar]
  26. Theil, H. A Rank-Invariant Method of Linear and Polynomial Regression Analysis I–III. Nederl. Akad. Wetensch. Proc. 1950, 12, 345–381. [Google Scholar]
  27. Sen, P.K. Estimates of the regression coefficient based on Kendall’s tau. J. Am. Stat. Assoc. 1968, 63, 1379–1389. [Google Scholar] [CrossRef]
  28. Hoaglin, D.C.; Mosteller, F.; Tukey, J.W. Understanding Robust and Exploratory Data Analysis; Hoaglin, D.C., Mosteller, F., Tukey, J.W., Eds.; Wiley: Hoboken, NJ, USA, 2000. [Google Scholar]
  29. Ran, C.; Jiang, W.; Yuan, L.; Wang, W.; Zhongliang, L.V.; Zheng, C. Inter-annual variations in vegetation and their response to climatic factors in the upper catchments of the Yellow River from 2000 to 2010. J. Geogr. Sci. 2014, 24, 963–979. [Google Scholar]
  30. Zang, C.F.; Liu, J.G. Trend analysis for the flows of green and blue water in the Heihe River basin, northwestern China. J. Hydrol. 2013, 502, 27–36. [Google Scholar] [CrossRef]
  31. Chao, M.; Xu, C.X.; Tian, G.L. The virtual water flow in China’s foreign trade of agricultural products. Resour. Sci. 2011, 33, 729–735. [Google Scholar]
  32. Liu, J.G.; Zang, C.F.; Tian, S.Y.; Liu, J.G.; Yang, H.; Jia, S.F.; You, L.Z.; Liu, B.; Zhang, M. Water conservancy projects in China: Achievements, challenges and way forward. Glob. Environ. Chang. 2013, 23, 633–643. [Google Scholar] [CrossRef]
  33. Yu, C.Q.; Gong, P.; Yin, Y.Y. China’s water crisis needs more than words. Nature 2011, 470, 307. [Google Scholar] [CrossRef] [PubMed]
  34. Aeschbach-Hertig, W.; Gleeson, T. Regional strategies for the accelerating global problem of groundwater depletion. Nat. Geosci. 2012, 5, 853–861. [Google Scholar] [CrossRef]
  35. Huo, X. A study on china’s foreign trade policy of forest products under the new period. Econ. Res. Guide 2015, 2015, 193–195. [Google Scholar]
  36. Fu, Y.Z.; Chen, B.D. The new trade policy development of main forest woody products trade and countermeasures for China. China Econ. Trade 2012, 2012, 14–19. [Google Scholar]
  37. Huang, Y.L.; Chen, Y.N.; Li, A.Q. Analysis of trade status and countermeasures of China’ forest woody products after 2008 financial crisis. World Agric. 2012, 2012, 34–37. [Google Scholar]
  38. Guo, Z.C.; Feng, Y.H.; Gries, T. Changes of China’s agri-food exports to Germany caused by its accession to WTO and the 2008 financial crisis. China Agric. Econ. Rev. 2015, 7, 262–279. [Google Scholar] [CrossRef]
  39. Zhang, Y.L.; Wang, X.M.; Blake, D.R.; Li, L.F.; Zhang, Z.; Wang, S.Y.; Guo, H.; Lee, F.S.C.; Gao, B.; Chan, L.Y.; et al. Aromatic hydrocarbons as ozone precursors before and after outbreak of the 2008 financial crisis in the Pearl River Delta region, south China. J. Geophys. Res. Atmos 2012, 117. [Google Scholar] [CrossRef]
  40. Sun, D.; Jin, X.; Wu, Y. On New Asia-Europe Continental Bridge and its Effects on Economic Development of Jiangsu Province; Transactions of Nanjing University of Aeronautics & Astronautics: Nanjing, China, 1994. [Google Scholar]
  41. Wu, X.Y. Study on the impact of new Eurasian continental bridge transportation on China’s import and export trade. Mod. Bus. Trade Ind. 2012, 20, 56–59. [Google Scholar]
Figure 1. The transfer proportion of virtual water of forest woody products (VWWFP) for China in 1993–2014, including (a) VWWFP export in 1993–2014 and (b) VWWFP import in 1993–2014.
Sustainability 10 00410 g001
Figure 2. Change trend of virtual water of forest woody products (VWWFP) for China, including (a) total quantity transferred; (b) export quantity; (c) import quantity; and (d) and net import quantity. Note that TS is Theil-Sen median slope.
Sustainability 10 00410 g002
Figure 3. Percent intercontinental transfer of VWWFP from China to continents in 1997–2014, including (a) VWWFP export from China to the continents and (b) VWWFP import from continents to China.
Sustainability 10 00410 g003
Figure 4. Share of continents in easing of China’s water resources pressure due to economic development, population growth and climate change. The share is the proportion of net import from a continent from the total of net VWWFP import from all continents to China in 1993–2014. The calculation of the shares is based on Equation (6).
Sustainability 10 00410 g004
Figure 5. Export pattern of virtual water of woody forest products (VWWFP) sectors from China between 1997 and 2014.
Sustainability 10 00410 g005
Figure 6. Import pattern of virtual water of woody forest products (VWWFP) of China in 1997–2014.
Sustainability 10 00410 g006
Table 1. The amount (109 m3) of VWWFP transferred of China in 1993–2014.
Virtual TypeExportImportNet Export
Virtual water of round-wood (VWR)1.63819.56−817.93
Virtual water of sawn-wood (VWS)39.95480.32−440.37
Virtual water of wood residues and wood charcoal (VWWRC)39.6183.74−44.13
Virtual water of wood-based panels (VWWP)804.12206.14597.98
Virtual water of wood pulp and recovered paper (VWPRP)4.884013.27−4008.39
Virtual water of paper and paperboard (VWPP)375.75733.60−357.85
Note that VWR, VWS, VWWRC, VWWP, VWPRP and VWPP denote virtual water of round-wood, sawn-wood, wood residues and wood charcoal, wood-based panels, wood pulp and recovered paper, paper and paperboard, respectively.
Table 2. Countries most reliant on import of virtual water of woody forest products (VWWFP) from China in 1997–2014.
NationVWWFP Volume from China (1010 m3)Share of Import from China (%)Cumulative Share of Import from China (%)
United States of America20.3418.0018.00
Japan14.3212.6730.68
Republic of Korea7.306.4637.13
United Kingdom5.184.5841.71
Canada4.153.6745.38
Saudi Arabia3.743.3148.70
India3.152.7951.48
Malaysia3.062.7054.18
Thailand2.842.5156.69
Germany2.582.2858.98
Belgium2.562.2661.24
Total export from China to all other countries127
Table 3. Countries most reliant on export of virtual water of woody forest products (VWWFP) to China in 1997–2014.
NationVWWFP Volume to China (1011 m3)Share of Export to China (%)Cumulative Share of Export to China (%)
Russian Federation8.5313.9813.98
Canada7.1311.6825.66
Indonesia6.9011.3036.96
United States of America6.8411.2148.18
Brazil3.696.0454.22
Malaysia3.485.7059.92
Chile2.594.2464.16
Republic of Korea2.373.8868.04
New Zealand2.143.5171.54
Japan1.752.8774.41
Papua New Guinea1.712.8077.21
Total import from all other countries to China634

