Article

Decreased Landscape Ecological Security of Peri-Urban Cultivated Land Following Rapid Urbanization: An Impediment to Sustainable Agriculture

1
College of Earth Sciences, Jilin University, Changchun 130061, China
2
Shenyang Geological Survey Center, China Geological Survey Bureau, Shenyang 110034, China
*
Author to whom correspondence should be addressed.
Sustainability 2018, 10(2), 394; https://doi.org/10.3390/su10020394
Submission received: 24 December 2017 / Revised: 20 January 2018 / Accepted: 31 January 2018 / Published: 2 February 2018
(This article belongs to the Section Sustainable Agriculture)

Abstract

:
The sustainable management of peri-urban agriculture requires cultivated land to not only be a source of food production, but also contribute ecological resources. This paper presents a method for assessing the landscape ecological security (LES) of peri-urban cultivated land that considers both cultivated landscape and interactions with the surrounding landscape. The situation in Changchun City was assessed at three time nodes. Furthermore, its spatiotemporal variations in several landscape characteristics were also measured. The results suggest that the peri-urban cultivated landscape was affected to varying extents by urbanization. The metrics of PD (patch density), ED (edge density), AWMSI (area-weighted mean shape index), FRAC (fractal dimension) and DIVISION (landscape division index) progressively increased during urbanization for cultivated land within 20 km of the urban gravity center. Elevated fragmentation and vulnerability of the cultivated landscape was also detected. The traditional method for quantifying LES of cultivated land neglects interactions with other landscape types. When the impacts of the ecological and construction landscapes were included, the results better reflected the dynamics of cultivated landscape in a peri-urban area. Decreased LES of cultivated land poses an impediment to the sustainable peri-urban agriculture, and better management practices should be applied for maintaining the LES of peri-urban cultivated land resources.

1. Introduction

It is well established that cultivated land resources provide diverse ecosystem services such as soil conservation, biodiversity protection and climate regulation [1,2,3]. Cultivated lands are pivotal to balancing regional ecological equilibrium with the intense competition for land space between urban development and farmland preservation. Unfortunately, this leaves little space for ecological land, such as forest land and grassland [4,5]. This phenomenon is particularly common at the rural-urban fringe, namely the Desakota area [6,7]. Thus, it has become increasingly important for researchers and city planners to be able to quantify the ecological values provided by the prevalent cultivated land resources [8,9,10]. Moreover, the sustainable management of peri-urban agriculture requires cultivated land to not only be a site of food production, but to also serve as a means for conserving ecological resources [10,11].
Previous studies have demonstrated that variations in the agrarian landscape influence both utilization conditions and ecological functions of cultivated land resources [12]. For instance, land fragmentation was reported to be closely associated with increased farming costs and a higher risk of land abandonment [13,14,15]. Moreover, land fragmentation also minimizes the effective area of an ecological habitat, with additional anthropogenic disturbance one of the major factors that will negatively affect ecological function [16,17]. Peri-urban agriculture (PUA) and urban agriculture (UA) are concepts derived from the agricultural location theory [18,19,20], and are indispensable for the global food supply due to their proximity to the cities [6,19,21]. However, the geographical location of PUA and UA areas also exposes them to disturbances resulting from urbanization. The rapid urbanization has profoundly impacted the urban-rural dual structure and, for this reason, urbanization is constantly modifying regional landscape characteristics. Shrestha et al., 2015 quantified spatiotemporal land fragmentation patterns in Phoenix and measured the variations in landscape metrics along a rural-urban gradient [22] while Jiao et al., 2015 analyzed the landscape characteristics of green spaces in a collection of buffers in Wuhan City [23]. Their research identified certain interactions between the regional landscape variations and rapid urbanization. Thus, measuring cultivated landscape variations in relation to urban sprawl is an important factor in maintaining the ecological security of cultivated land resources.
Landscape ecological security (LES) of cultivated land is a useful indicator that reflects the current status of cultivated landscape morphology and can be further used to evaluate how cultivated land performs as an ecological resource. Turner and Gardner (1991) systematically presented the methods for measuring LES and argue that long-term anthropogenic disturbances will complicate regional landscape structure, i.e., intensified anthropogenic disturbances will decrease LES [24]. Pei et al., 2014 modeled the LES of cultivated land in a coastal city in China and measured displacement according to distance from the urban gravity center [25] while Inkoom et al., 2017 identified a set of landscape metrics to illustrate LES and assessed potential ecosystem services in the highly anthropogenically dominated landscapes of the Sudanian Savannah region [26]; Furthermore, Li et al., 2010 developed an early warning system that assesses LES to instruct regional urban development with Xiamen Cityin China as an empirical case [27]. However, cultivated land is an open land use system which has certain interactions with other landscape types when being deemed as the ecological resources [10,17,28], which has been neglected in many assessment of LES of cultivated land resources [25,29]. Moreover, there are relatively few studies that have especially focused on measuring the LES of peri-urban cultivated land following rapid urbanization.
To fill this gap in knowledge, this study attempts to evaluate the LES of cultivated land resources while considering the impacts of surrounding landscape and measure spatiotemporal variation in LES in response to urbanization by using Changchun City as an empirical case. Changchun City is the provincial capital of the Jilin Province, which is located in the black soil region of northeast China. The conservation of cultivated land resources in the black soil region has been advocated for decades due to the fertile soil properties [14,30], yet the excessive urban sprawl has merged as a potential threat to cultivated land in the region [14,31]. Hence, it is essential to explore how LES degradation of cultivated land resources is linked to urbanization. As such, the objectives of this research were (a) to assess the LES of cultivated land resources in Changchun City; (b) evaluate the spatiotemporal variations in cultivated landscape characteristics between 1990 and 2016; and (c) measure how urbanization contributes to LES degradation of cultivated land resources in a typical peri-urban area of the black soil region.

2. Materials and Methods
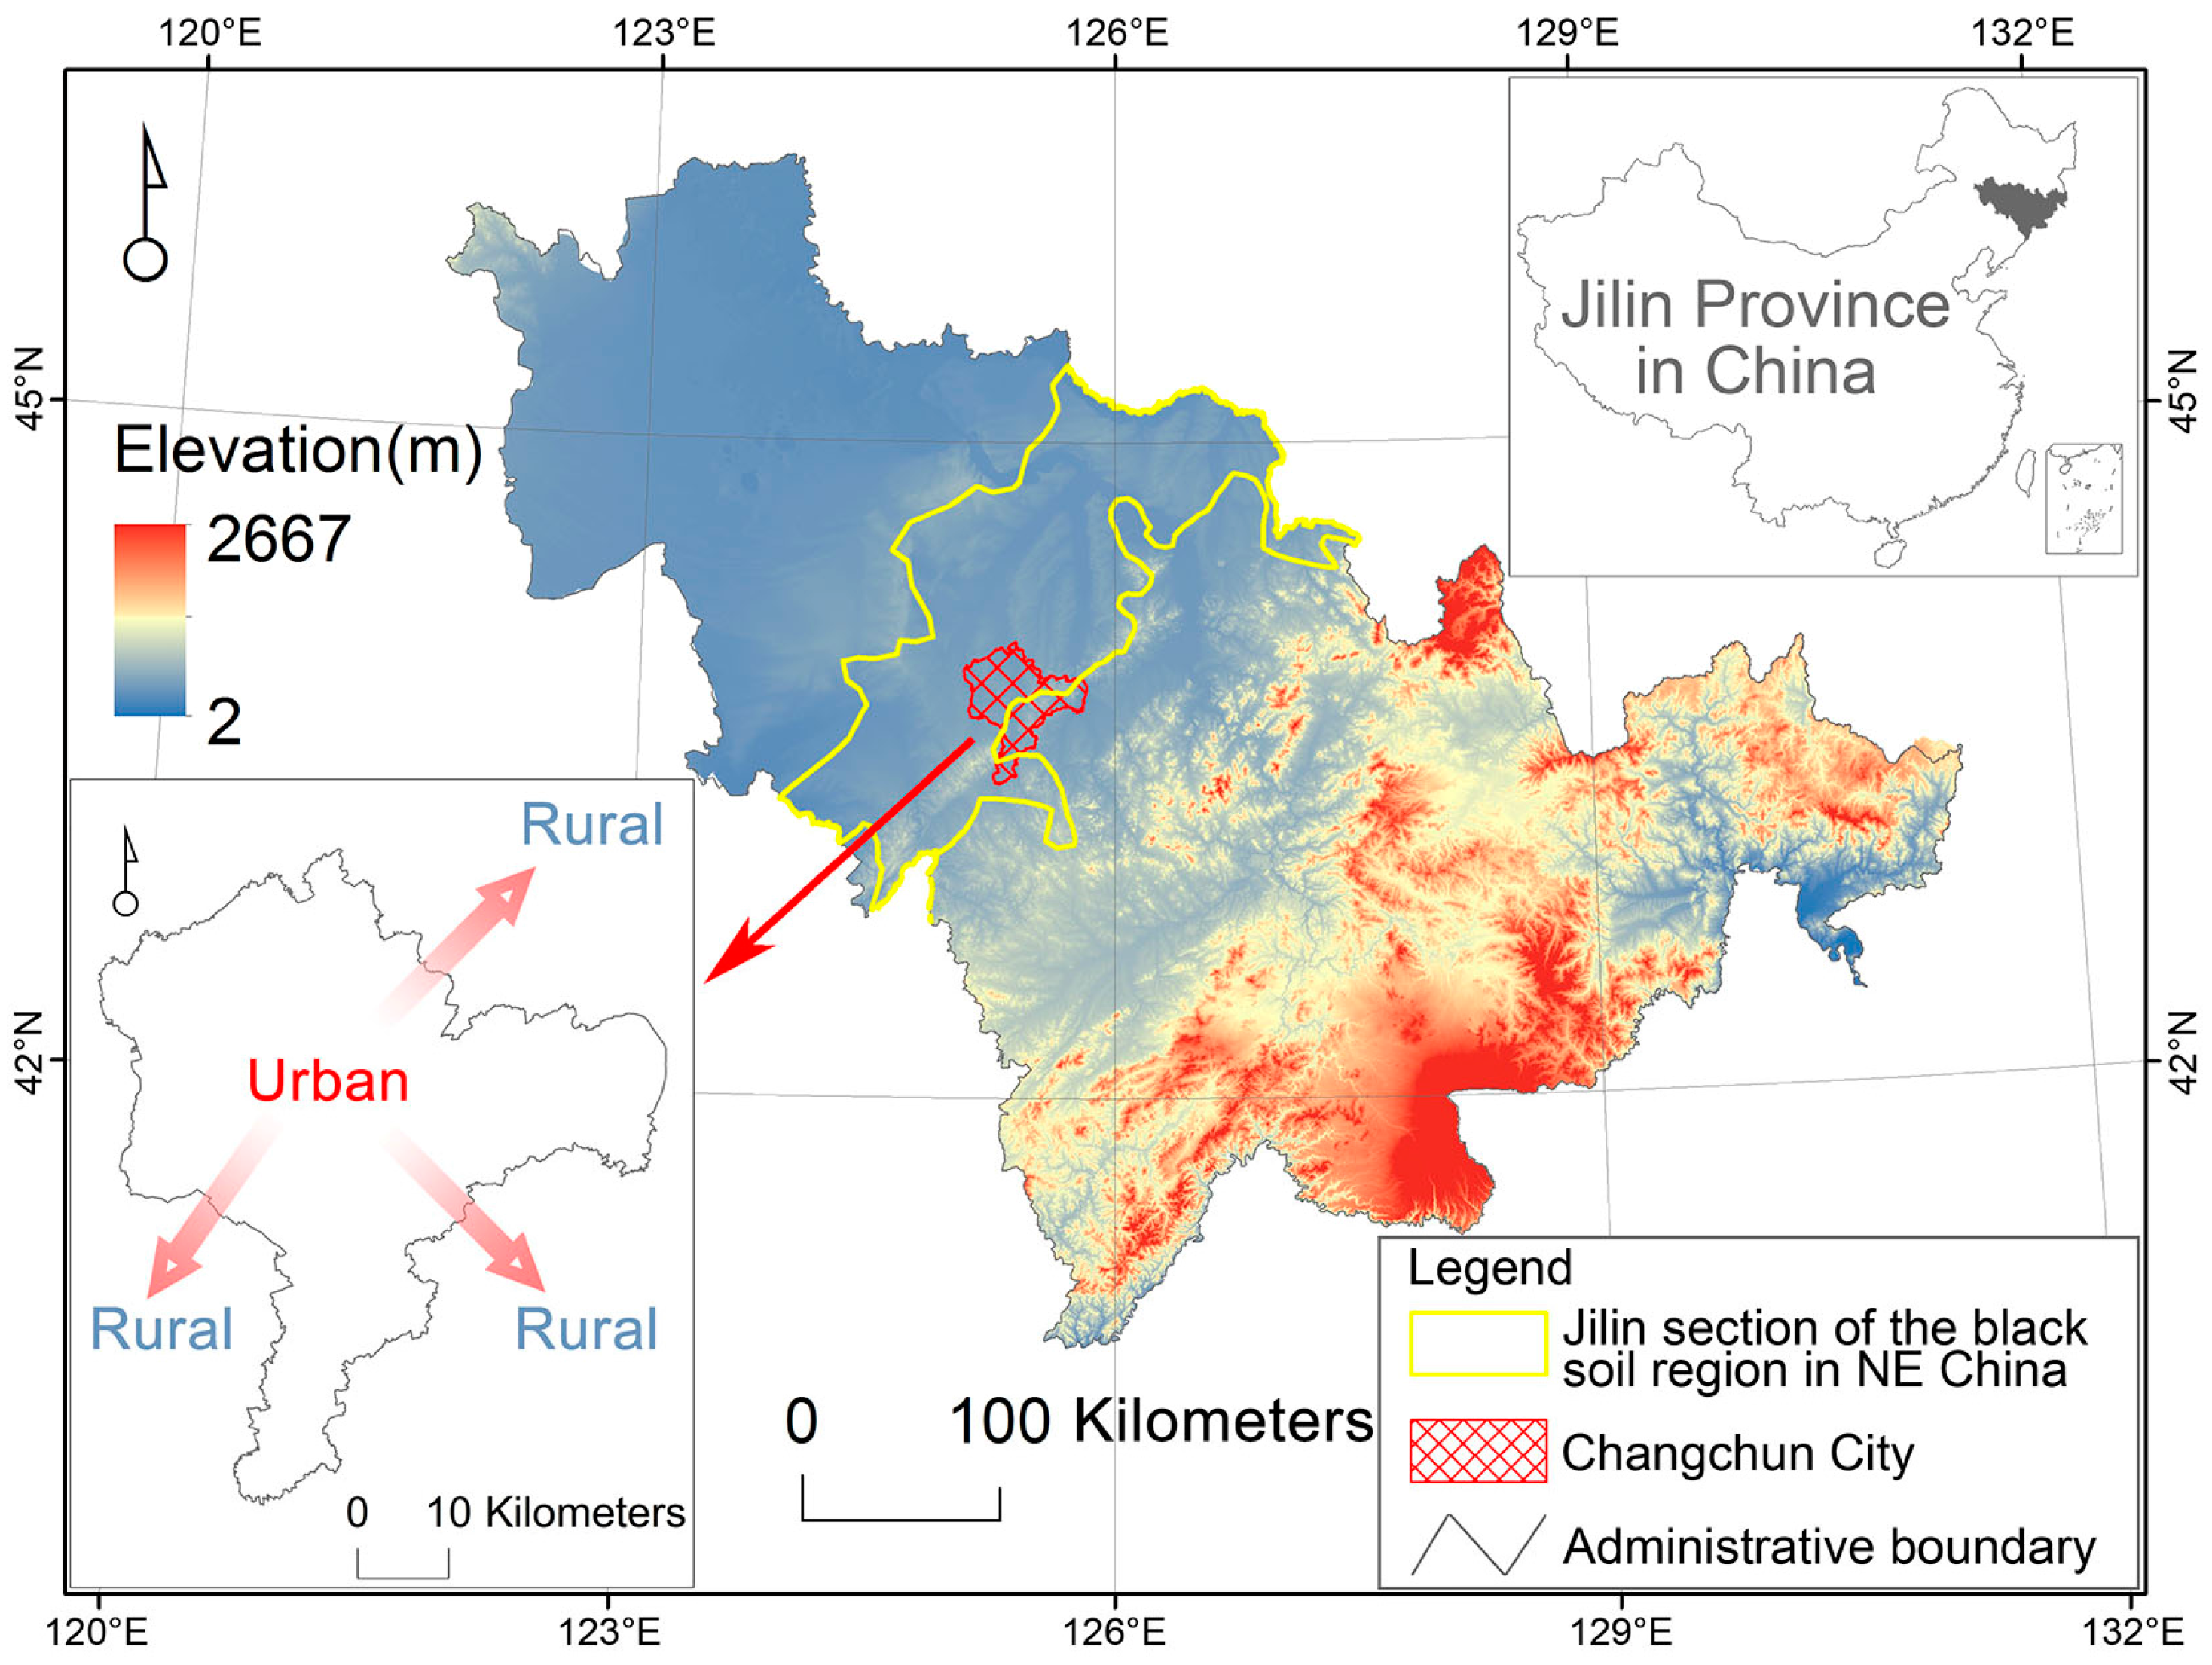
2.1. The Study Area

Changchun City was selected as the study area in which peri-urban cultivated landscape dynamic changes would be measured. Changchun City is located in the Jilin Province of northeast China (Figure 1), an area with wide distribution of black soil resources. The grain production in this area is pivotal to ensuring national food security. Nevertheless, Changchun City is also the development center for the regional economy, which has increased internal demand for urban land. This prominent contradiction between urban development and cultivated land conservation makes it an ideal area for measuring variations in cultivated landscape during the process of urbanization.

2.2. Data Processing

This study included land use data from three time nodes: 1990; 2003; and 2016. Land use data for 1990 were acquired from Landsat Thematic Mapper (TM) images, whereas land use data for 2003 were acquired from Landsat Enhanced Thematic Mapper (ETM) images and land use data for 2016 were based on Landsat Operational Land Image (OLI) images. Changchun city is located within two scenes (path/row: 118/029 and 118/030), and the images were acquired from US Geological Survey (USGS). All images were treated with radiometric calibration, atmospheric correction and geometric correction. Moreover, land use maps were verified, corrected and settled using field surveys, historical records and Google Earth maps covering the same period, and the average interpretation accuracy in 1990, 2003 and 2016 was 90.1%, 91.2% and 94.2%, respectively, which conformed to the requirements of this study. With respect to the requirements of this study, land use was classified according to six categories (urban construction land, rural settlement, cultivated land, forest land, grassland and water), and the central urban area at each time node was also demarcated, see detailed connotation in Table 1.

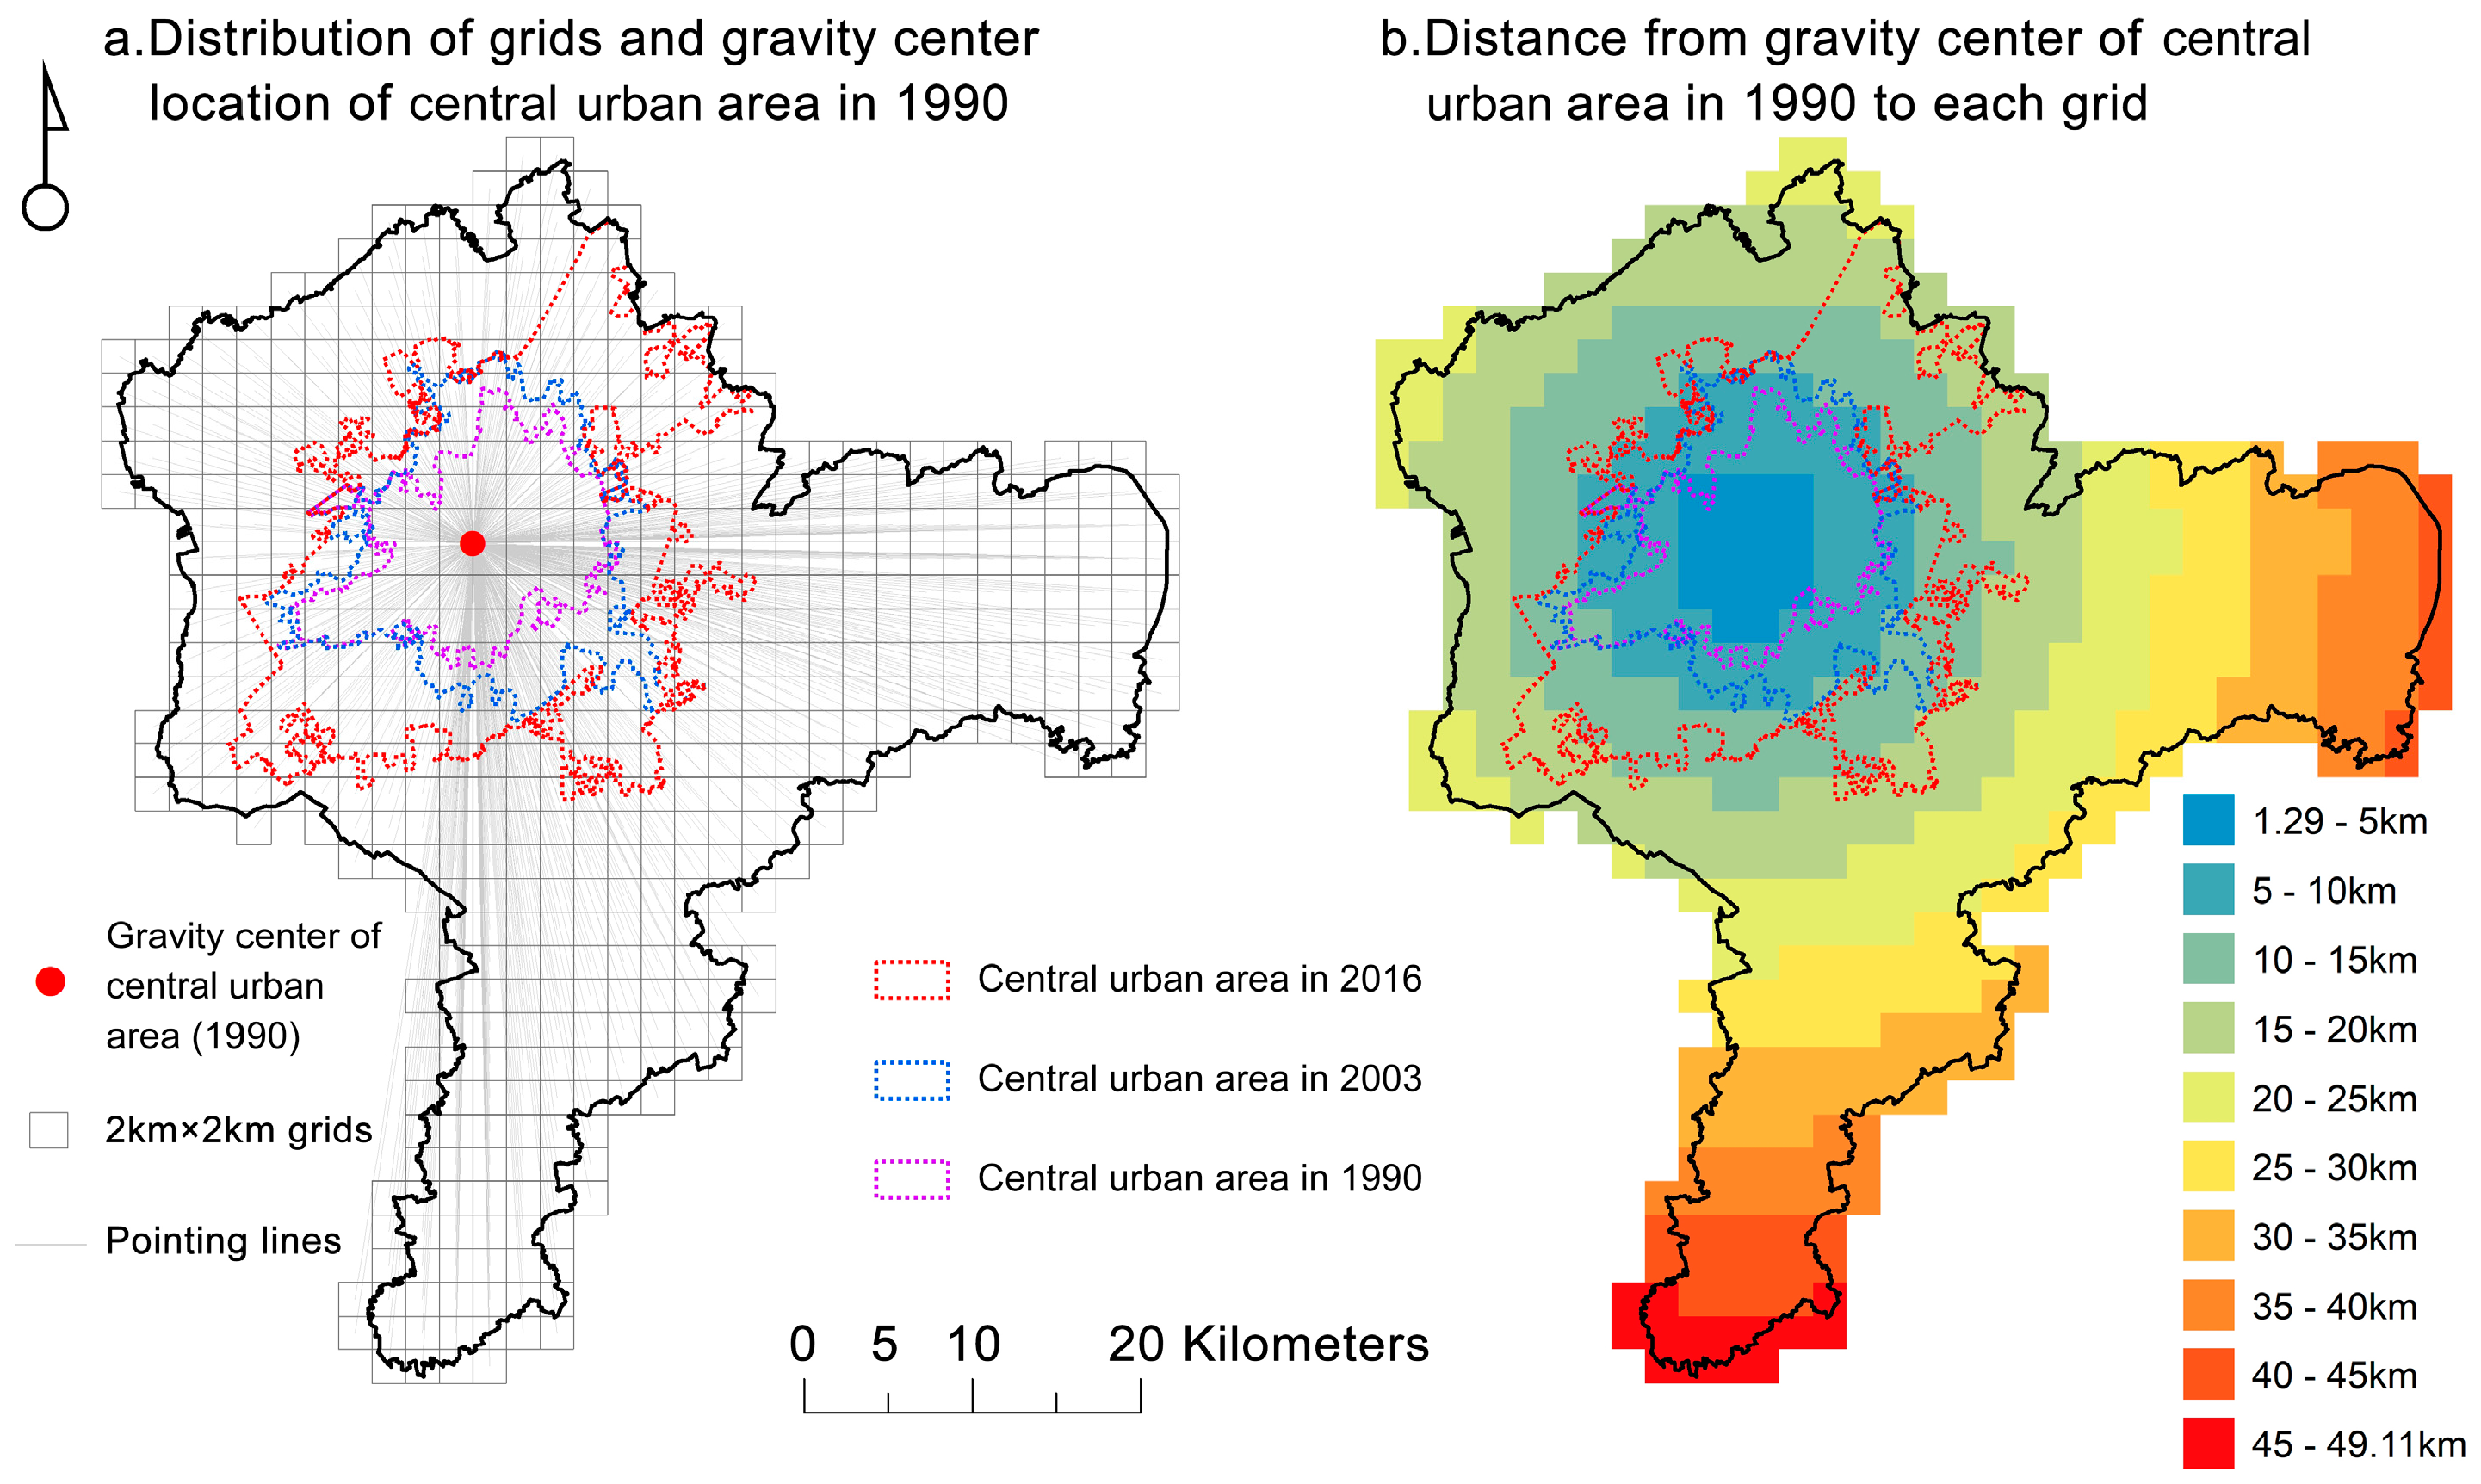
2.3. Gridding in the Study Area

As one of the objectives of this study was visualizing the spatial distribution characteristics of cultivated landscape in a peri-urban area, a total of 578 2 km × 2 km grids were generated to cover the study area (Figure 2a). The size of grid considers the scale characteristics of this study area. In addition, the distance from the gravity center of the central urban area in 1990 to each grid was measured to determine how the cultivated landscape changes in response to urbanization (Figure 2b).

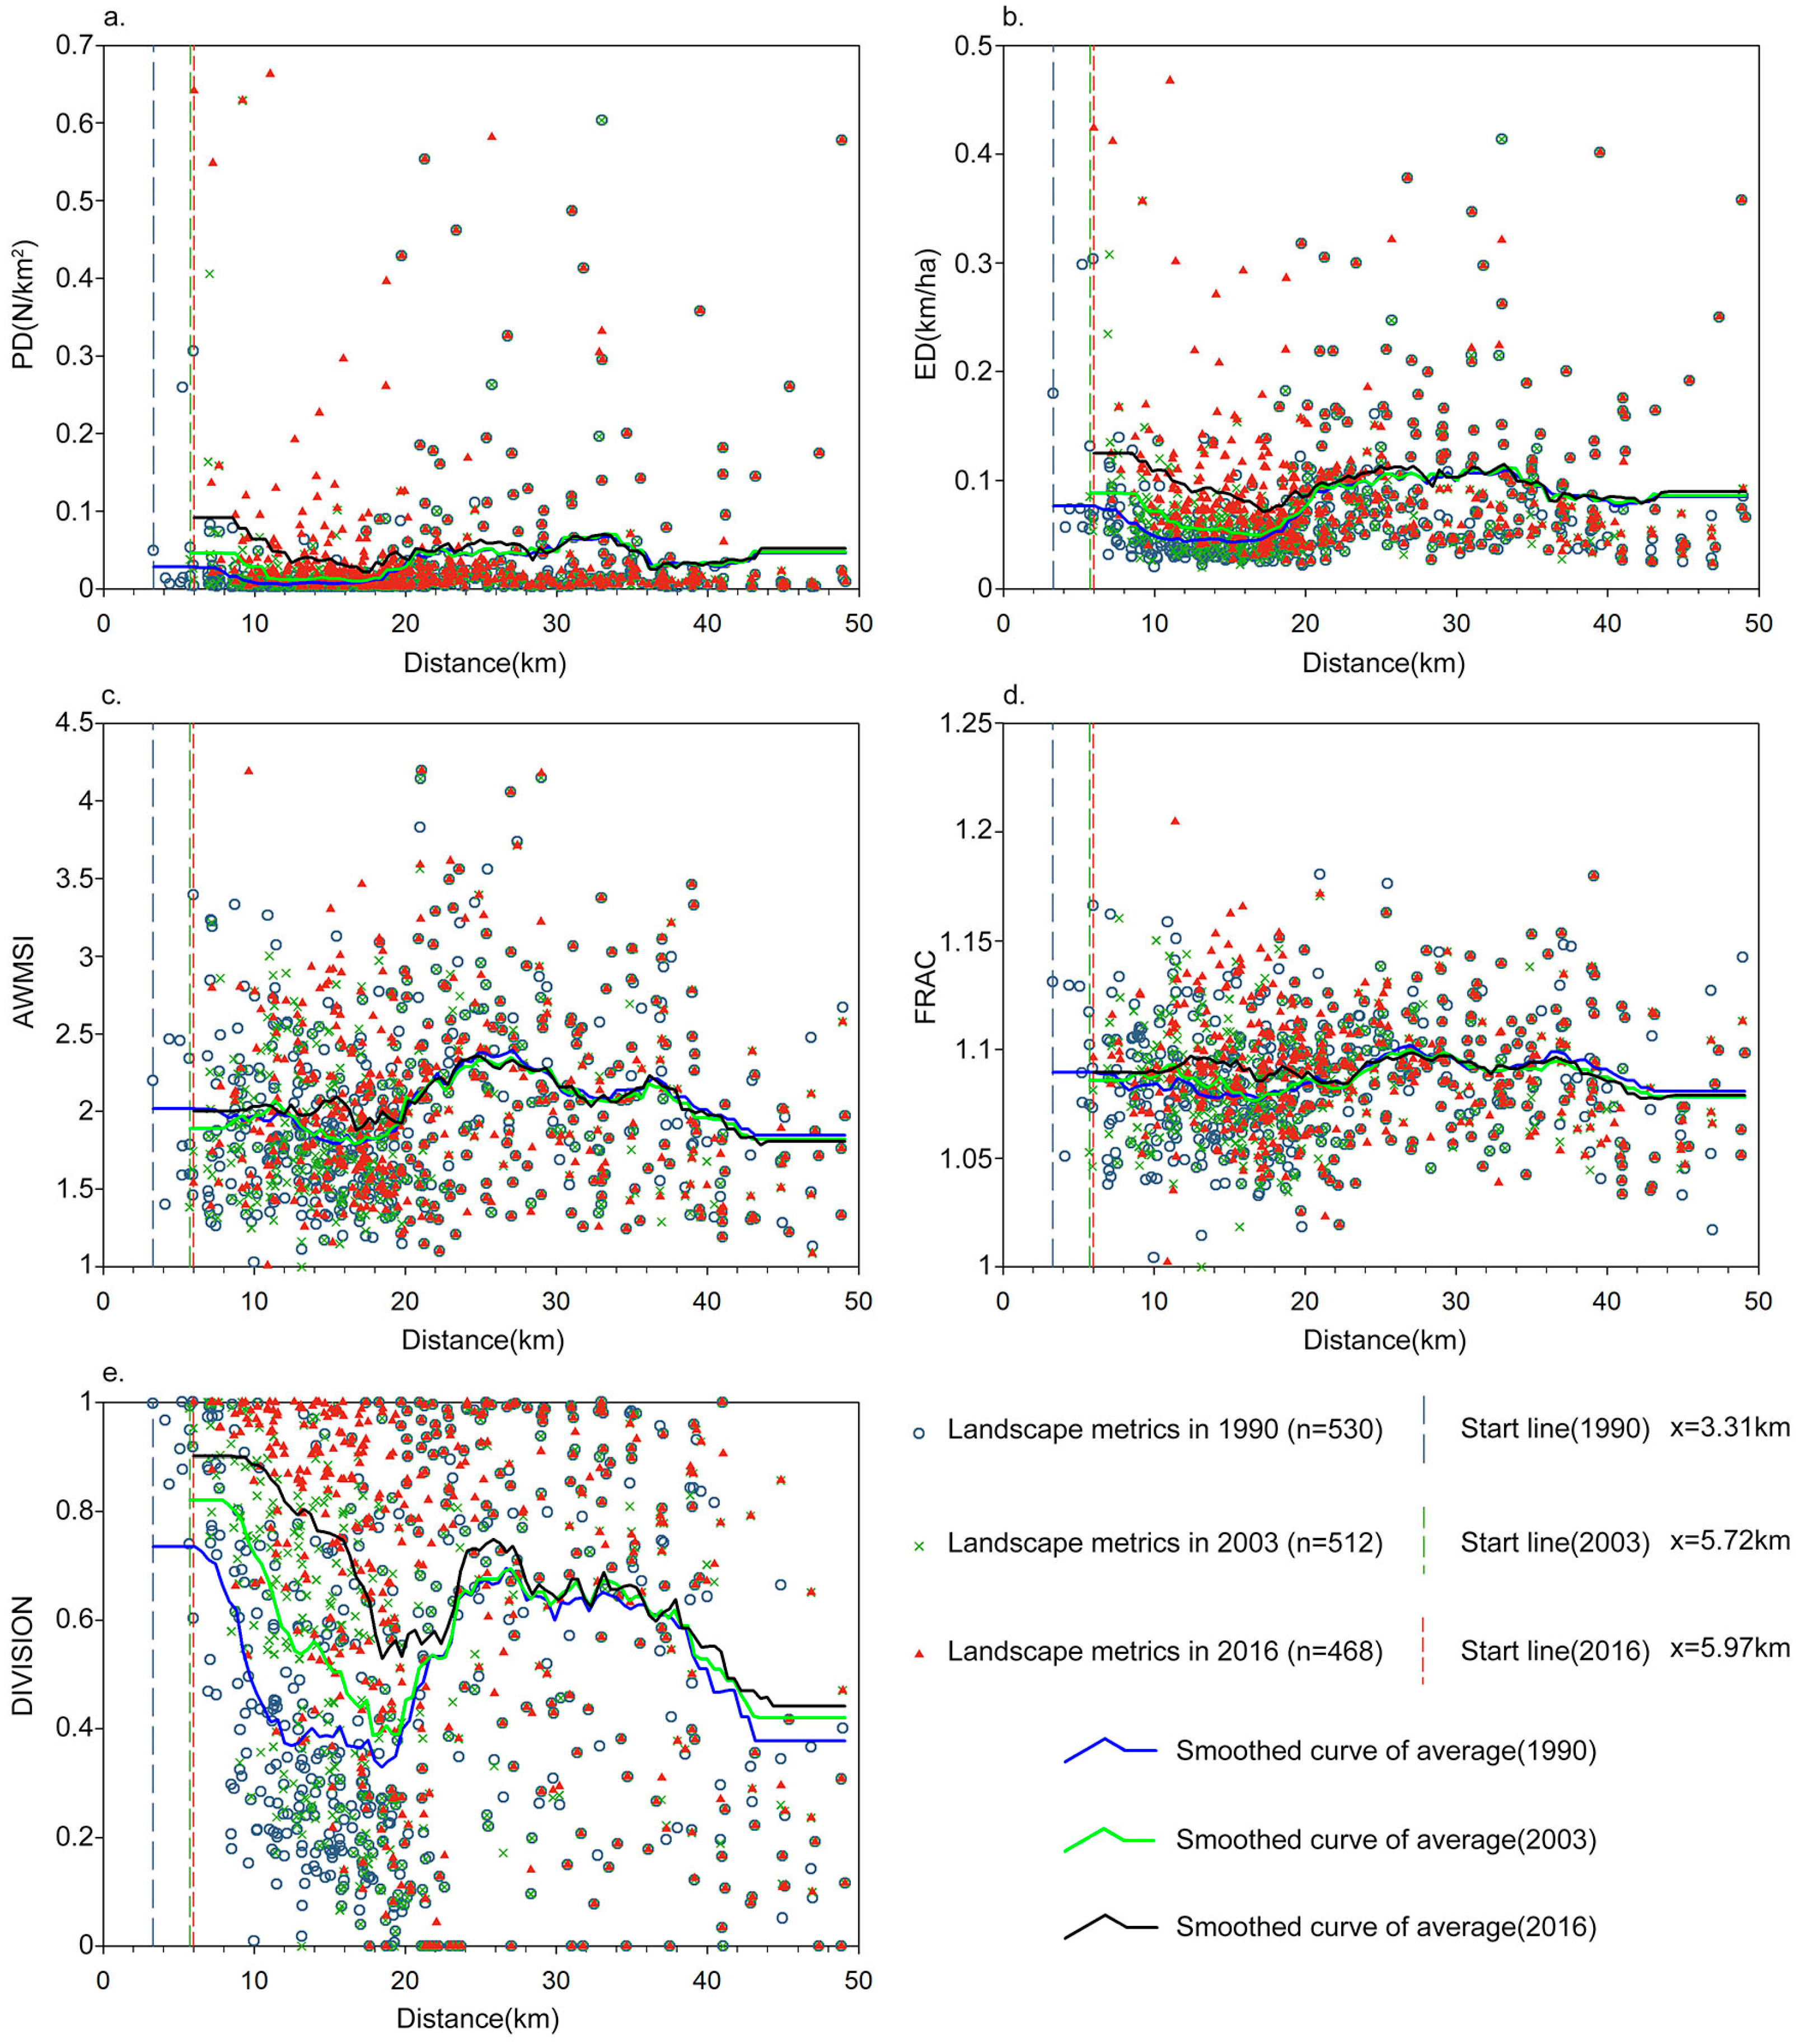
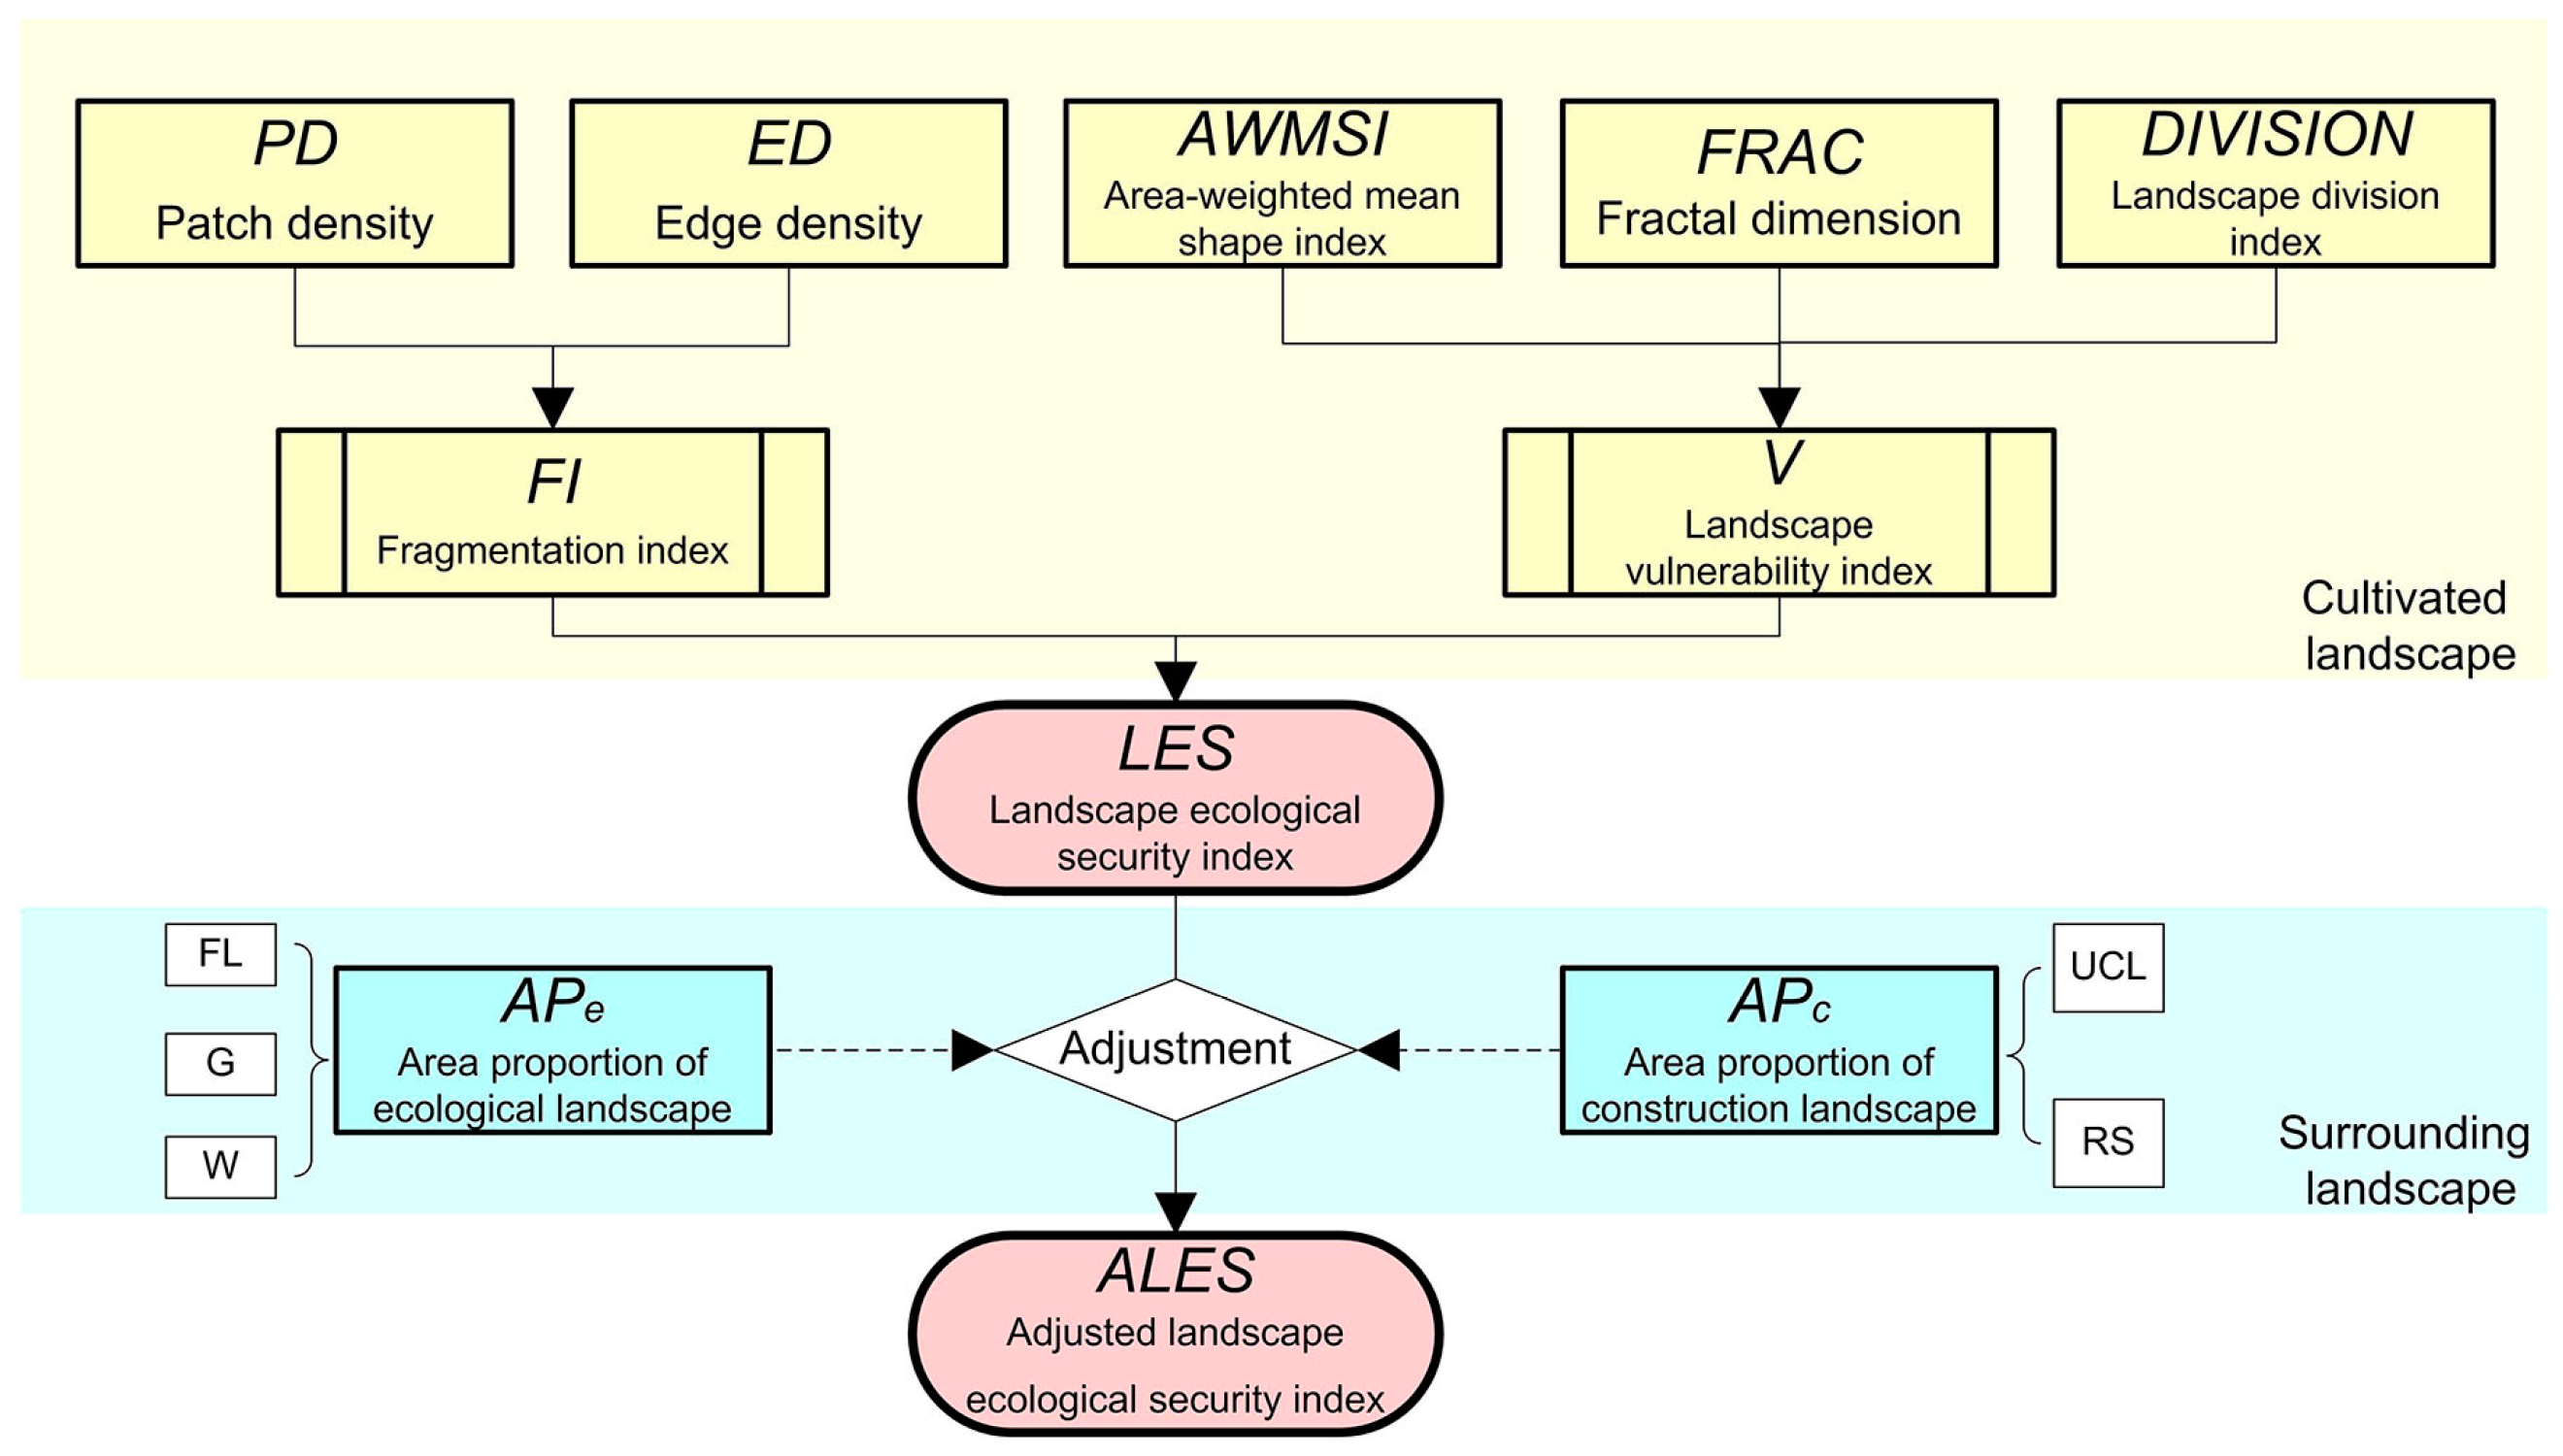
2.4. Landscape Metrics of Cultivated Land

We selected five fundamental landscape metrics to represent the spatiotemporal variation of cultivated landscapes in a peri-urban area: patch density (PD); edge density (ED); area-weighted mean shape index (AWMSI); fractal dimension (FRAC); and landscape division index (DIVISION). From these, PD and ED were chosen to represent fragmentation of the cultivated landscape, with higher PD and ED values indicating more a fragmented landscape; AWMSI was used to represent the availability of cultivated land resources, with a higher AWMSI value indicating lower utilization efficiency and availability. FRAC was used to represent the stability of cultivated land resources, with a higher FRAC value indicating that the cultivated land was in a more unstable state. DIVISION was used to represent resistance against the risks of cultivated land resources, with higher a higher DIVISION value indicating poor recovery capability [25]. The detailed computational methods for landscape metrics are as follows:
(1)
Patch density
PD   =   N / A
where PD is the patch density; N is the number of cultivated land patches located within the grid, and A is the total cultivated landscape area (km2).
(2)
Edge density
ED   =   P / A
where ED is the edge density, P is the total length of perimeters for all cultivated land patches (km), and A is the total cultivated landscape area (ha).
(3)
Area-weighted mean shape index
AWMSI = i = 1 n [ ( P i / 4 A i ) ( A i / A ) ]
where AWMSI is the area-weighted mean shape index, n is the total number of cultivated land patches, Pi is the perimeter of cultivated land patch i, Ai is the area of cultivated land patch i, and A is the total cultivated landscape area.
(4)
Fractal dimension
FRAC   =   2 ln ( P i / 4 ) / ln A i
where FRAC is the fractal dimension, Pi is the perimeter of cultivated land patch i, and Ai is the area of cultivated land patch i.
(5)
Landscape division index
DIVISION = 1 i = 1 n ( A i / A ) 2
where DIVISION is the landscape division index; n is the total number of cultivated land patches; Ai is the area of cultivated land patch i; A is the total cultivated landscape area.
The landscape metrics were computed via ArcGIS (10.1, Environmental Systems Research Institute Inc., Redlands, CA, USA) and Fragstats (4.2, Oregon State University, Corvallis, OR, USA). Moreover, aside from grids that did not include cultivated landscape, outlier grids were also excluded from the subsequent analysis and assessment based on the Pauta criterion. Ultimately, 530 grids from 1990, 512 grids from 2003 and 468 grids from 2016 were reserved for the analysis.

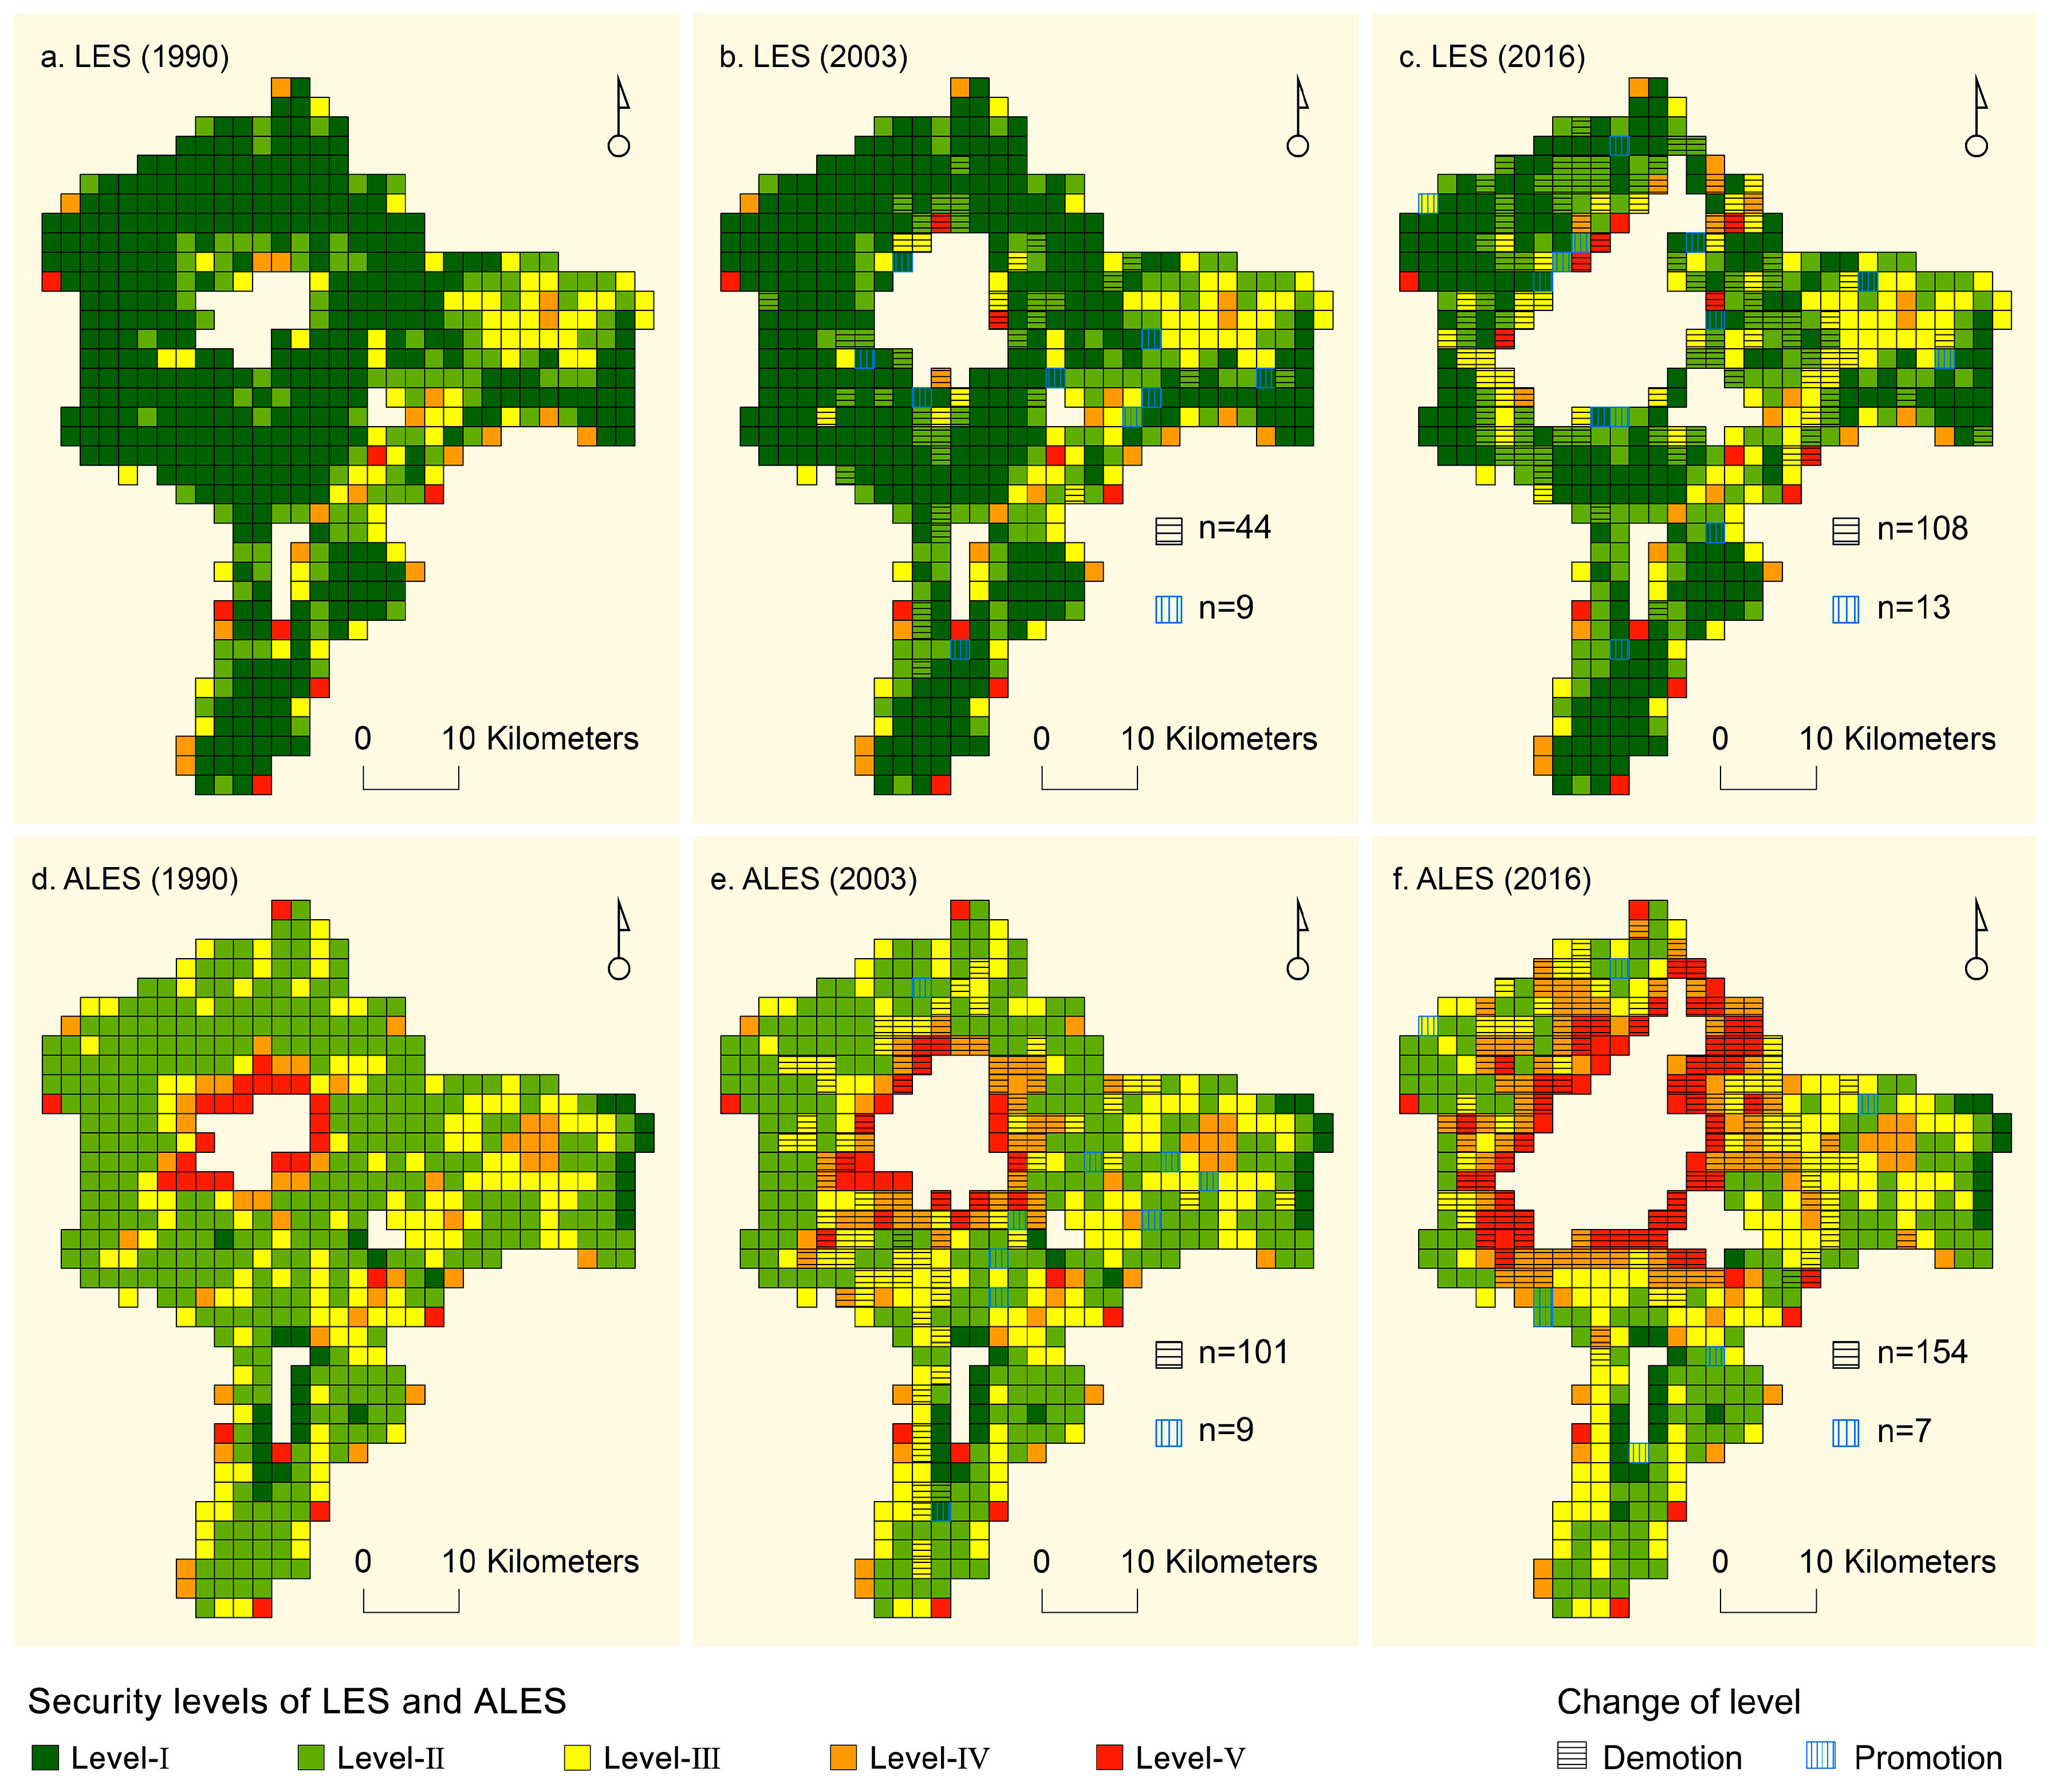
2.5. LES Assessment of Cultivated Land Resources

To begin with, fragmentation and vulnerability of the cultivated landscape in a peri-urban area were measured using the fragmentation index (FI) and landscape vulnerability index (V), respectively, which were computed on the basis of fundamental landscape metrics. Moreover, they were integrated into the LES assessment of cultivated land (Figure 3). Given that the proper ecological functioning of cultivated land is considerably affected by the surrounding land use [11,17,28], forest land, grassland and water were further grouped as ecological landscape and urban construction land and rural settlements were grouped as construction landscape. These were then applied as surrounding landscape factors to adjust the LES results. The detailed computational methods for LES assessment of cultivated land are as follows:
FI   =   ( PD   +   ED ) / 2
In Equation (6), FI is the fragmentation index, PD is the patch density, and ED is the edge density. A higher FI indicates a more fragmented cultivated landscape.
V   =   α   ×   AWMSI   +   β   ×   FRAC   +   γ   ×   DIVISION
In Equation (7), V is the landscape vulnerability index, AWMSI is the area-weighted mean shape index, FRAC is the fractal dimension, and DIVISION is the landscape division index. According to a previous study on the LES of cultivated land [25], α was set to 0.59, β was set to 0.28, and γ was set to 0.13. A higher V indicates that a cultivated landscape is more vulnerable when affected by external disturbance.
A P i = B i / B AP e = a AP FL + b AP G + c AP W AP c = d AP UCL + e AP RS
In Equation (8), APi is the landscape area proportion for land use category i, Bi is the total landscape area of land use category i, and B is the total area of all landscape. APe and APc are the proportions of ecological landscape (forest land, grassland and water) and construction landscape (urban construction land and rural settlement), respectively, in each grid whereas APFL, APG, APW, APUCL and APRS are the proportions of forest land, grassland, water, urban construction land and rural settlements, respectively, in each grid. Based on a previous study of the ecosystem service values of corresponding land use categories in Jilin Province [2], a was set to 0.26, b was set to 0.10, and c was set to 0.64. The differences between urban construction land and rural settlements were accounted for by using the Delphi method, after which d was set to 0.8, e was set to 0.2.
  LES = 1 FI   ×   V ALES = ( 1   +   AP e )   ×   LES / ( 1   +   AP c )
In Equation (9), LES is the landscape ecological security index of cultivated land, ALES is the adjusted landscape ecological security index, and APe and APc are the proportions of ecological and construction landscapes, respectively, in each grid, respectively. The assessment method for assessing LES was mainly derived from the empirical equations in Pei’s study [25] in combination with the scale characteristics of this study. The computational method for ALES originated from that of LES, but was adjusted for the influence of the surrounding landscape. Higher values for both LES and ALES indicate more secure landscapes.

3. Results and Analysis

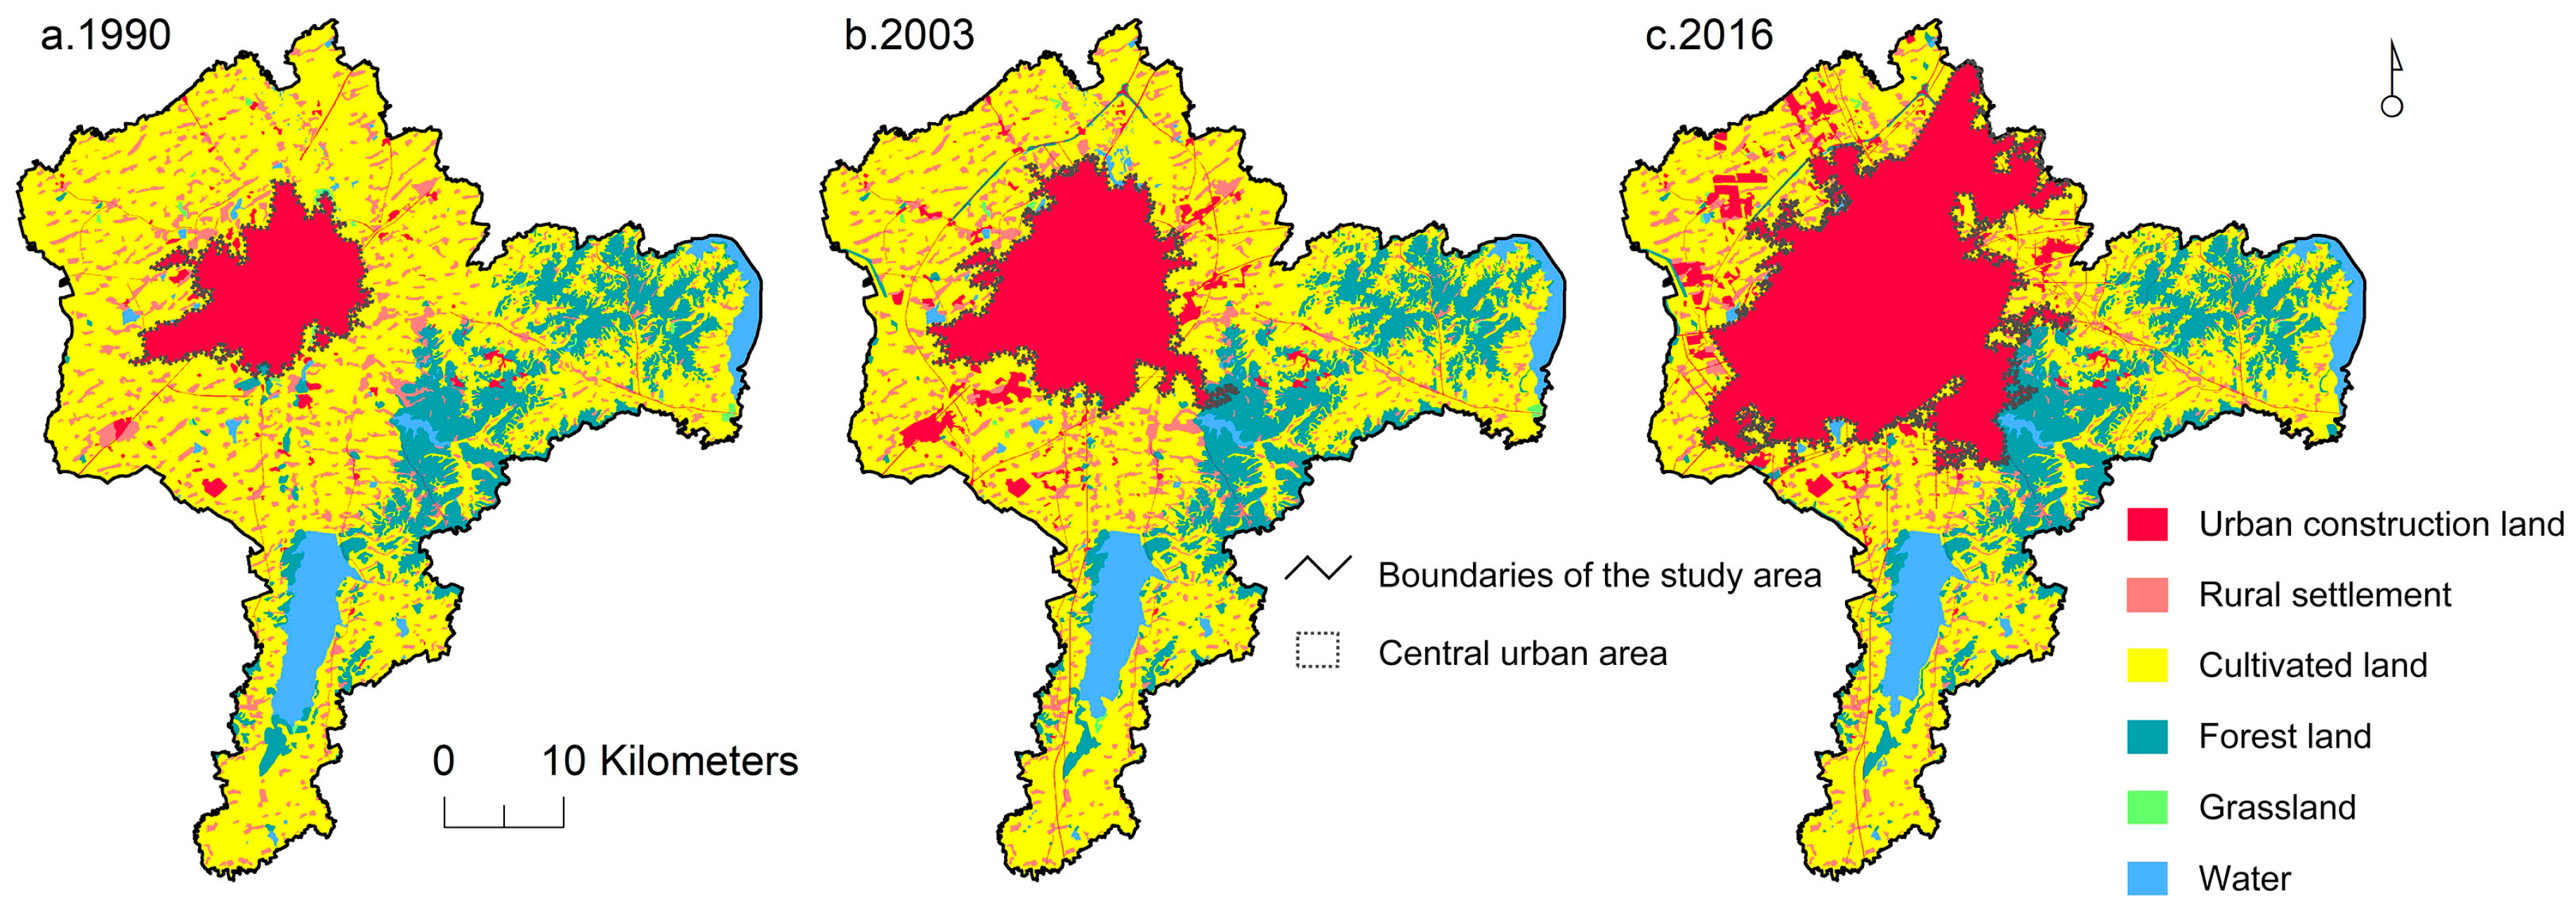
3.1. Loss of Ecological Land to Urbanization between 1990–2016

The land use maps from 1990, 2003 and 2016 showed an evident urban sprawl process within the study area (Figure 4). In 1990, the peri-urban area of Changchun City had extensive cultivated land resources, yet the expansion of the central urban area and a prominent increase in urban construction lands outside of the central urban area during 1990–2016 occupied large areas of cultivated land. Furthermore, many rural settlements and considerable amounts of cultivated land have been incorporated into the central urban area, indicating a prominent non-agricultural process. Forest land and water were mostly located in the southeast of Changchun City, which indicated abundant ecological land resources in this area. There were relatively low amounts of grassland in the study area.
If cultivated land is considered as ecological land due to its potential ecosystem service values [1,2,3], then it could be concluded that there was a considerable direct loss of ecological resources during the rapid urbanization process from 1990 to 2016 (Table 2). The extent of cultivated land loss during 2003–2016 (25,895 ha) was almost double than what was observed between 1990–2003 (12,949.38 ha), and urban construction land was the predominant land use category that cultivated land was converted to. The conversion of cultivated land to urban construction land sharply increased between 1990–2003 (9940.30 ha) and 2003–2016 (23,711.04 ha). In addition, 1642.91 ha and 841.56 ha of cultivated land was converted to rural settlements during the 1990–2003 and 2003–2016 periods. In this way, the expansion of rural construction land and the related cultivated land loss were both noteworthy. During the 1990–2003 period, large areas of forest land (437.40 ha) and grassland (243.36 ha) were occupied by the urban construction land. This can be attributed to urban sprawl towards the southeast, an area in which most of the forest land was located (Figure 4b). The areas of forest land and grassland converted to urban construction land during 2003–2016 decreased to 200.21 ha and 108.33 ha, respectively. However, natural ecological landscape loss still concerned the regional environment. In addition, large areas of water resources were occupied by urban construction land (523.89 ha) in 2003–2016 for the construction of Beihu park in the northeast. The loss of ecological land resources to urban construction increased by 13,734.62 ha between the 1990–2003 and 2003–2016 periods, a figure that exceeds the loss observed during 1990–2003 (10,808.85 ha). Thus, urbanization directly encroaches on the regional ecological environment.
Aside from the direct appropriation of ecological land for construction purposes, internal conversions between cultivated land, forest land, grassland and water were also prominent. The amounts of cultivated land converted to forest land, grassland and water during 1990–2003 were 777.4 ha, 112.62 ha and 476.11 ha, respectively, and the amount of cultivated land that was converted to forest land even increased to 1120.98 ha during 2003–2016. This indicates that large area of cultivated land became ecological land during the study period. On the other hand, some amount (1382.22 ha during 1990–2003 and 668.96 ha during 2003–2016, respectively) of cultivated land was reclaimed from other ecological land. The scale of ecological land reclamation within the study area decreased over time. In addition, land conversions between forest land, grassland and water were relatively non-significant during the study period.

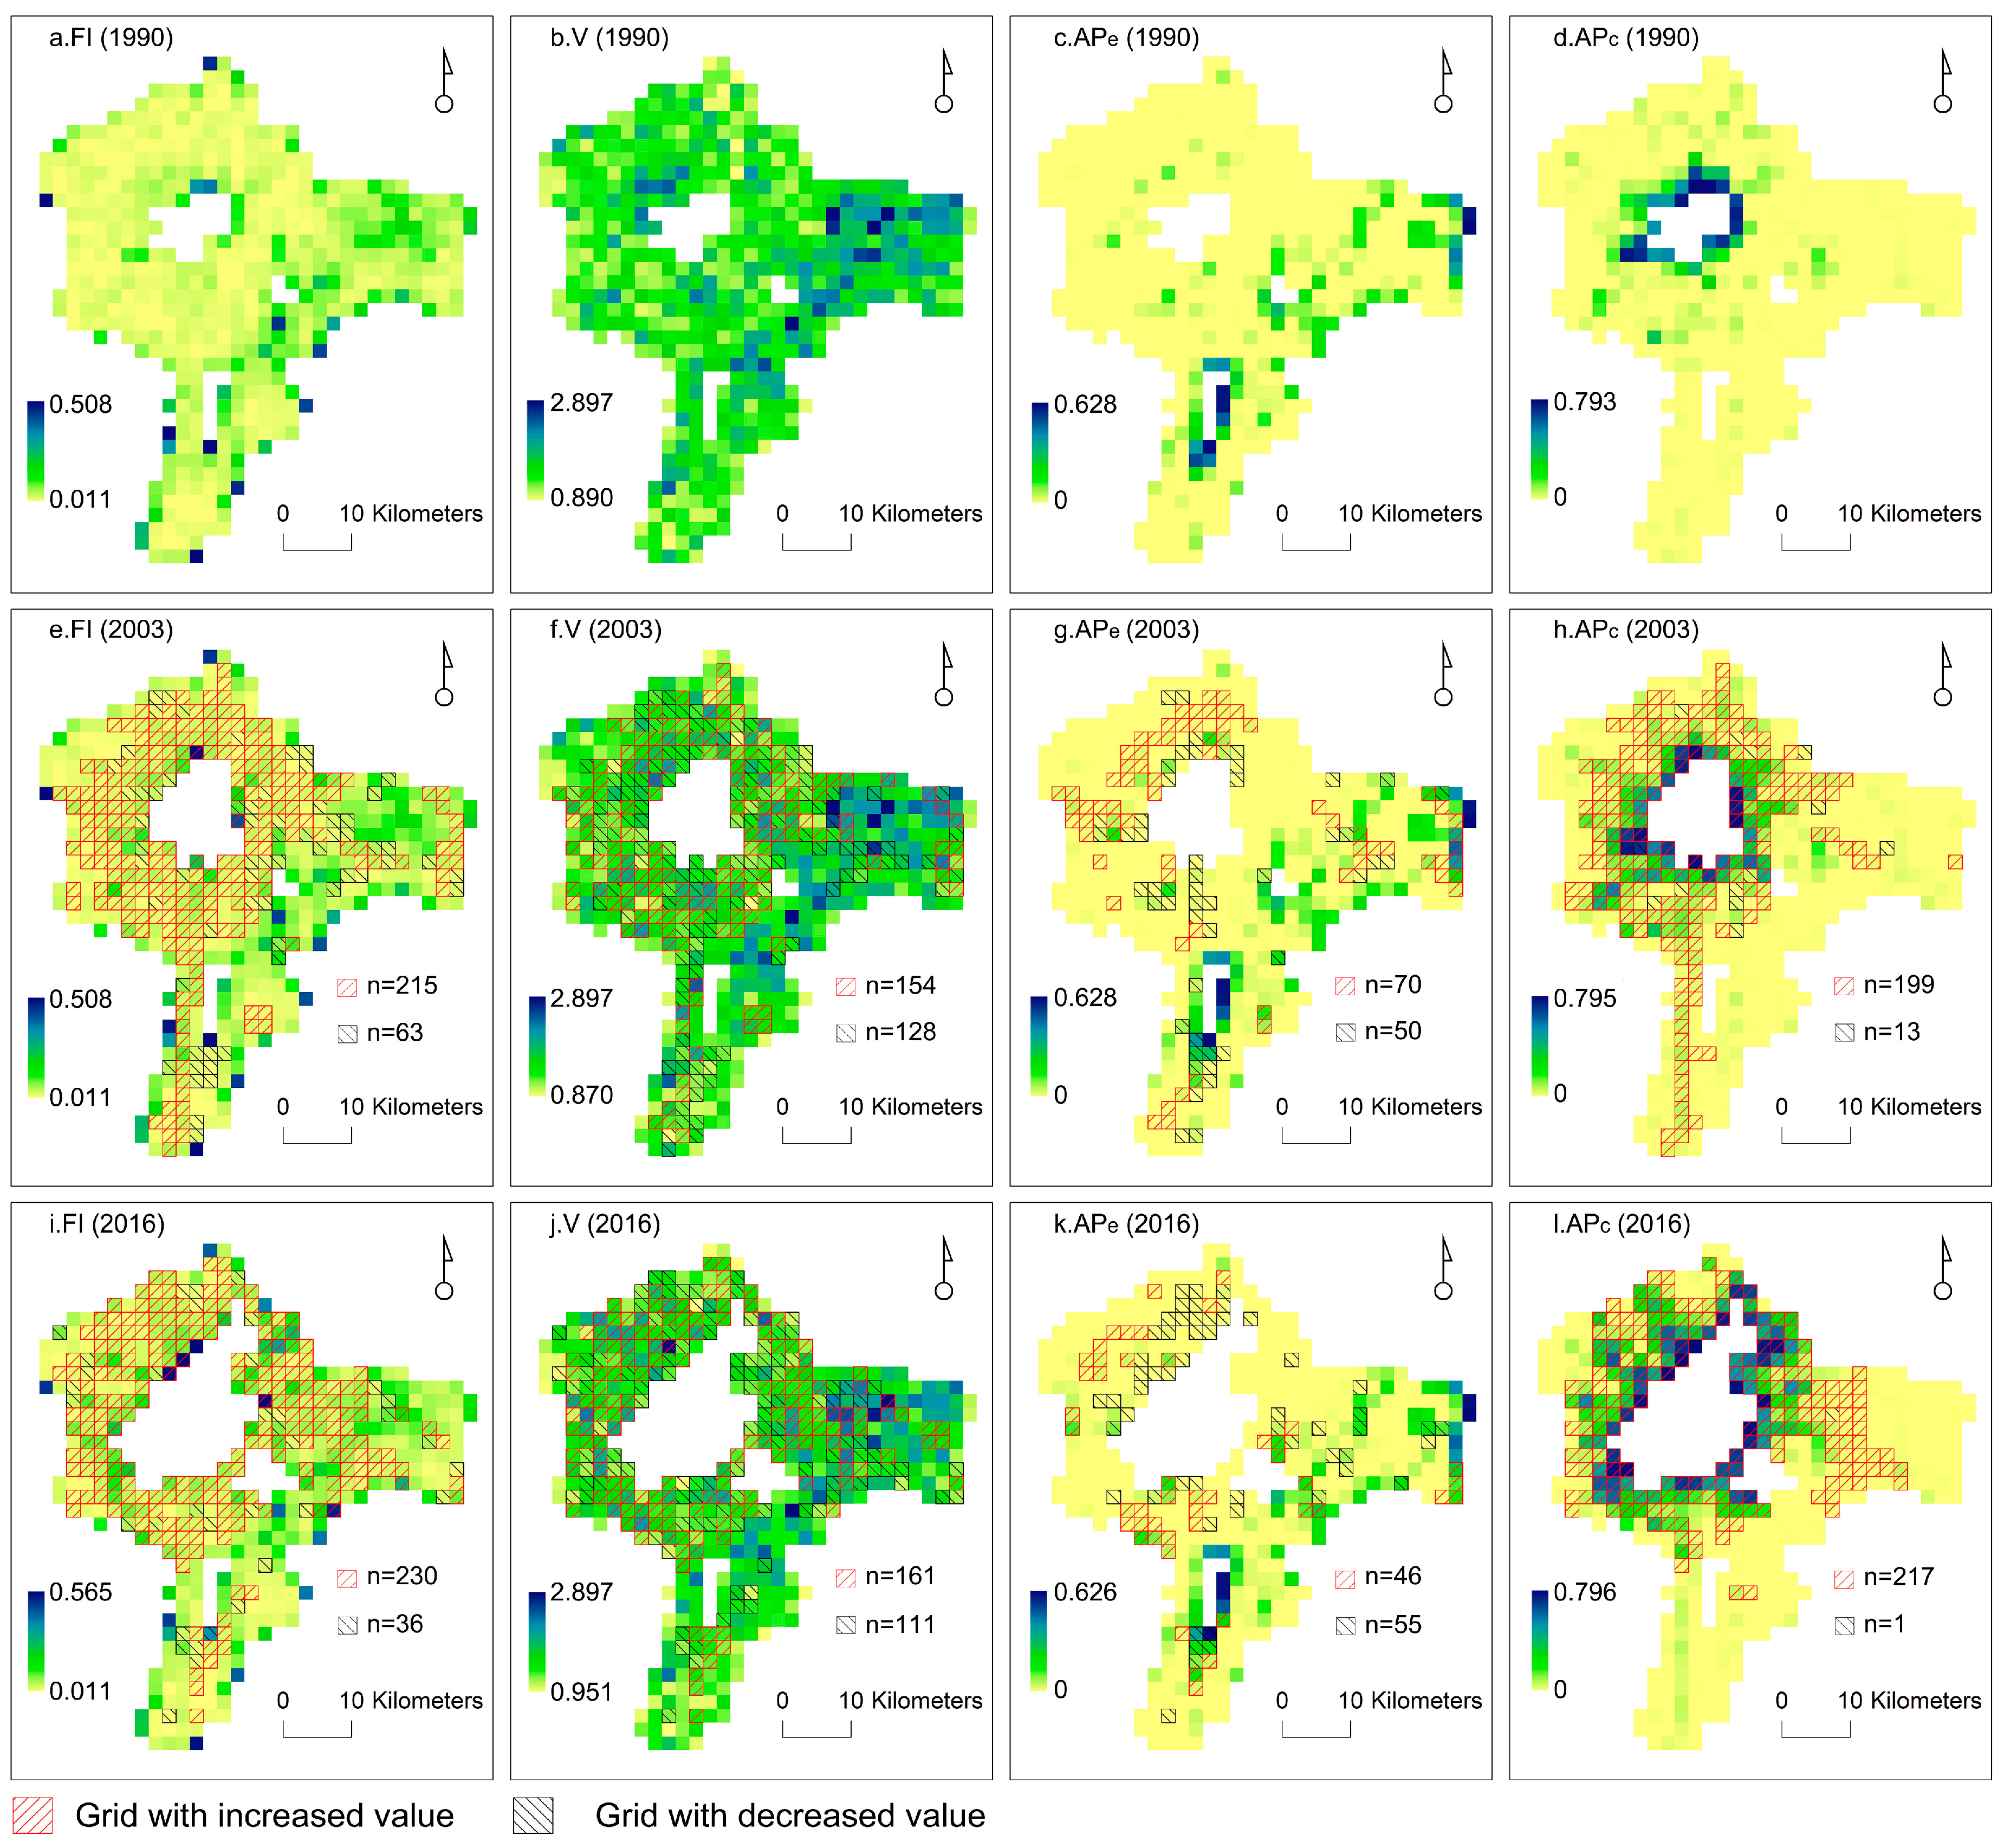
3.2. Variations in Fundamental Landscape Metrics of Cultivated Land

With the objective of measuring how urban sprawl affects cultivated landscape variations, scatter plots and smoothed curves were performed via Sigmaplot (10.0, SPSS Inc., Chicago, IL, USA). These calculations employ algorithms that smoothen sharp variations in the values of dependent variables, and local smoothing, which averages values at neighboring points, was adopted to illustrate general variation tendency. Relationships between the landscape metrics of cultivated land from different periods and distance from the gravity center of the central urban area in 1990 are presented in Figure 5.
The start lines demonstrate the distance at which the first cultivated landscape appears from the gravity center of the central urban area (1990 location) for the various analyzed time periods. The intervals between start lines indicate that the urban sprawl between 1990–2003 was relatively uniform in every direction, and development bias could be detected in the urban sprawl between 2003–2016, shown by the close proximity of the 2003 and 2016 start lines. This phenomenon is consistent with the morphological changes of the central urban area over time. PD and ED both represent the fragmentation degree of the cultivated landscape. Figure 5a,b clearly demonstrate that cultivated landscapes located at a distance of 10–20 km from the gravity center were less fragmented in 1990 and 2003 while PD and ED of grids at a distance of 20–40 km from the gravity center increased during these time periods. A similar tendency was seen for AWMSI and FRAC (Figure 5c,d) in 1990 and 2003. This phenomenon can be mainly attributed to the traditional land use pattern in the study area. In light of Figure 2 and Figure 4, the major farming area in Changchun City is located within 20 km of the gravity center, and this cultivated landscape is relatively continuous. In contrast, when the distance is extended to 30–40 km, the cultivated land mostly becomes slope cropland located among forest land, which is rather scattered and irregular in the shape.
However, areas within 20 km of the gravity center are also the most severely affected by urbanization, which affected the landscape metrics to different extents from 1990 to 2016. The smoothed curves for PD and ED showed an increasing trend during the study period (i.e., more fragmented landscapes), with a prominent increase in 2016. This indicates that the cultivated landscape tends to be fragmented and unstable under the pressure of urbanization, with the cultivated landscape around the central urban area relatively more fragmented. Variations in AMWSI and FRAC (Figure 5c,d) over the study periods showed a similar tendency, with values for grids located within 10–20 km of the urban center continuing to increase in 2016. Analyses of the DIVISION values indicated that the affected cultivated landscape area was even more extensive than the previous analyses had suggested, with cultivated areas further than 40 km from the urban center also experiencing variations in landscape. The cultivated landscape of the study area was severely affected by the urban sprawl even if certain cultivated land resources had survived the conversion to urban areas.

3.3. Spatiotemporalchanges of the Cultivated Landscape and Its Surrounding Landscape

The spatial distribution of the fragmentation index (FI) in 1990 (Figure 6a) indicated that the most fragmented cultivated landscapes were mainly located close to the boundary of the study area, which might be attributed to the division of grids near the boundary line. Other than that, the cultivated landscape among the forest land in the southeast was slightly more fragmented in comparison to the other areas. The FI values of these grids, which are in close proximity to forest land, were less affected by the urbanization process of 1990–2016 on account of their distance from the central urban area and protection by the surrounding stable ecological land (Figure 6e,i). However, the cultivated landscape around the central urban area grew more fragmented from 2003–2016, with grids with increased FI values increasing from 215 to 230 (Figure 6e,i). The extent of fragmentation observed for cultivated areas also increased throughout the studied urbanization process, which implies intensifying anthropogenic disturbance at the rural-urban fringe that both reduces the effective area of the cultivated landscape and adversely affects the ecological function of cultivated land.
The vulnerability index (V) values at all three time nodes all indicated that the cultivated landscape located among the forest land in the southeast was more vulnerable (Figure 6b,f,j), which was consistent with FI results. The irregular shape and the wide dispersal of cultivated land can both be assumed to have increased the vulnerability of the cultivated landscape in this area. The distribution of V values (when interactions between the cultivated land and the surrounding landscape were not considered) also suggested that cultivated land in this area was characterized by lower landscape ecological security, meaning that the cultivated land resources would be difficult to restore to previous conditions once affected by urbanization. The variation in V values between 1990 and 2003 was rather inconspicuous; nevertheless, grids with higher values within this period also showed higher values between 2003 and 2016. The vulnerability of cultivated landscapes generally decreased under the pressure of urbanization. However, the relatively broad distribution of grids with increased V values around the central urban area illustrated the illogical changes in vulnerability of a peri-urban area when only cultivated landscape is considered. Although the original cultivated landscape is mostly being appropriated or segmented during urbanization, V value would nevertheless remain unchanged, or even slightly increase, as long as the shape stays regular.
The APe metric showed the lowest number of grids with a change in value among the four calculated indexes: 120 in 2003 and 101 in 2016. This implies that the proportion of ecological land in each grid was relatively stable between 1990–2016, which was in accordance with the land use change noted for the study area. The grids with higher APe values were mainly distributed around the two large reservoirs in Changchun City (Figure 6c). Many grids in the northeast of the study area showed increased APe values, and this can be attributed to the establishment of greenbelts in this area. Moreover, the spatial distribution characteristics of APc in 1990, 2003 and 2016 indicated that the scale of affected cultivated landscape following urbanization extended far past the central urban area, with the range continuing to grow along with the urban sprawl. On the other hand, variations in APc also indicated that more of the cultivated landscape around the central urban area was converted to construction landscape, which suggests that more anthropogenic disturbance occurred closer to the urban center.

3.4. LES Assessment Results of Cultivated Land in a Peri-Urban Area

There is no broadly recognized classification criterion that can be used to assess LES [29]. Thus, as recommended by previous studies [25,29], the Jenks natural breaks classification method was applied to group the security levels for the assessment results into certain categories, which could then be used to compare grids within the study area. The results of all studied time nodes were classified into five levels (I, II, III, IV and V, with the values decreasing from level I to level V). Detailed classification criterion for security levels of LES and ALES are presented in Table 3.
The distribution of the LES results across the three time nodes was in accordance with the variations in landscape metrics, namely, cultivated landscape located in the southeast, an area with a broad distribution of forest land and grassland, were characterized by low security levels (Figure 7). Indeed, the cultivated landscape was more fragmented and vulnerable in this area than the others (Figure 6a,b). However, previous studies have proven that the proportion of semi-natural or natural habitats within an agricultural landscape is positively correlated with the ecological function of the cultivated land [17,28]. In conjunction with the urbanization, 44 grids in 2003 (8.59% of the total) and 108 grids in 2016 (23.08% of the total) showed demoted security levels when compared to the previous time node. Thus, the LES of cultivated land mostly showed a downward trend over time, and this was particularly evident for cultivated land located around the central urban area. However, when only cultivated landscape characteristics were considered in the LES assessment, which is paradoxical in itself, some grids close to the central urban area showed an increase in LES (Figure 7b,c). However, an increase in LES could hardly be achieved without certain land consolidation or other beneficial practices [32,33], both of which are scarcely distributed around the urban fringe, an area with a highly unstable land use structure. Thus, the observed increases in LES could be attributed to random variations in cultivated lands caused by urban sprawl rather than the practical improvement of the cultivated landscape. The interactions between cultivated land and the surrounding landscape had been ignored in the assessment of LES.
The results of the ALES assessment, when compared with those from the LES assessment, showed prominent differences and better reflected the impacts of the rapid urban sprawl process. Hence, the grids with lower security levels were mostly located around the central urban area rather than the southeast. Moreover, the security levels of cultivated land that was located near other ecological land were evidently higher than those of grids near urban land (Figure 7e,f). The analysis showed that 101 grids in 2003 (19.73%) and 154 grids in 2016 (32.91%) had demoted security levels relative to the previous time node, which indicates that the area in which security levels had fallen during urbanization had a broader distribution observed from the ALES assessment results. The ALES assessment paints a better picture of the effects of urbanization as cultivated land around the urban fringe has previously been suggested to experience severe pressure for conversion to urban land [34]. In this way, the stability of the cultivated landscape in peri-urban areas decreases sharply during urbanization. The ALES assessment indicated that the cultivated landscape was far from being secure, even if the landscape had partially improved. On the contrary, the land use maps suggested that the cultivated landscape near other ecological land was relatively well preserved from 1990–2016 (Figure 4), which indicates higher stability. Thus, the ALES assessment is more appropriate for peri-urban areas.

4. Discussion

Cultivated land is not traditionally considered a land use category that has ecological functions in contrast to, for example, forest land and grassland. Certain scholars have argued that vegetation forms within the cultivated landscape are rather simple, and that intensive agricultural activities potentially contribute to biodiversity loss [28,35]. Nevertheless, the rise of multifunctional agriculture and availability of ecosystem service value estimations [1,3] have highlighted the role of cultivated landscape in the regional ecological equilibrium. Moreover, there are relatively scarce natural landscapes that offer high ecological value in urban areas [36]. In this way, cultivated land can contribute vital ecological function, a suggestion that necessitates LES studies of peri-urban cultivated land.
The LES assessment for cultivated land presented in this paper was based on the morphological variations of land patches. According to the theory of landscape ecology, the chosen landscape metrics reflect various ecological characteristics (e.g., stability, restorability and vulnerability) of a certain land type [24]. The results from all of the analyses presented above indicated that the cultivated landscape in the study area was severely affected by urbanization, and that the affected area extended far beyond the direct occupied area. Increased fragmentation and vulnerability both indicated that the LES of the peri-urban cultivated land had degraded. The construction of highways and industrial areas outside of the central urban area constitute the major artificial corridors that segment the original landscape of a peri-urban area. These anthropogenic modifications result in fragmented cultivated landscapes that decrease the ability of the cultivated landscape to act as an ecological resource.
On the other hand, the ecological process underlying landscape variations is more complex than simply the morphological change, as it includes both natural and man-made effects [37]. The conversion from ecological land to urban construction land implies external ecological environment variations for the cultivated landscape, which have been reported to underlie the ecological function of cultivated land [11,17,28]. The loss of semi-natural or natural landscape within the cultivated area would reduce the effective area of habitat [17,28]. Moreover, close proximity to the construction landscape would also introduce a higher risk of pollution for the cultivated soil [38,39]; hence, the LES of cultivated land could be compromised on account of the surrounding landscape. In addition, the social-economic changes triggered by cultivated landscape variations also concern the ecological security of cultivated land resources. Sklenicka (2016) reported that a fragmented cultivated landscape contributes to the reductions in land value. In this way the small, scattered patches may be rented and then mismanaged by the new tenants. As a result, the management of fragmented cultivated land can be unsustainable and bring about land degradation in terms of water erosion, reduction in organic matter and nutrient depletion [13]. This is yet another way in which the ecological function of cultivated land resources is undermined by the urbanization process.
Resource conservation oriented practices constitute to be one of the core concepts of sustainable land management (SLM) [40]. However, the degradation of LES in peri-urban cultivated areas has emerged as an impediment to sustainable agriculture. To begin with, the urban sprawl in northeast China has been reported as excessive [14], with the low-density urban sprawl towards peri-urban areas detrimentally affecting both cultivated land resources and natural landscapes. When increased anthropogenic disturbances are added to the picture, it becomes clear that the protection of natural resources as well as soil and water quality in peri-urban areas will be difficult [40]. Thus, peri-urban agriculture in northeast China is unsustainable based on decreased ecological security along with the associated effects, both of which put regional grain production at risk.
The results showed that cultivated lands located around the central urban area are in a rather unstable state and include a high risk of appropriation for construction purposes. The demarcation of prime cultivated land around the central urban area could be an effective way to protect the LES of the peri-urban cultivated land resources [41]. In addition, cultivated lands located near other ecological land were more stable during the study period, even if the original landscape was relatively fragmented. These parts of the cultivated landscape could be preserved by indentifying High Nature Value (HNV) farmland [28,42], which emphasizes the importance of regional biodiversity. Moreover, structural adjustment and land consolidation could also be beneficial for maintaining LES and the continued sustainable management of peri-urban agricultural land [6,32,33].

5. Conclusions

Resource conservation and protection of the ecological environment are core concepts of sustainable land management and agricultural development. The scarcity of natural resources around the urban area requires cultivated land to not only be the source of food production, but also contribute ecological resources. This paper developed a method for assessing the landscape ecological security (LES) of peri-urban cultivated land that considers both cultivated landscape and interactions with the surrounding landscape. Moreover, we further measured and analyzed how landscape characteristics change following rapid urbanization.
In addition to the evident loss of ecological land resources between 1990–2016, the cultivated landscape of Changchun City was also affected. Our results show that PD, ED, AWMSI, FRAC and DIVISION values progressively increased over time in grids within 20 km of the urban gravity center. Furthermore, FI and V values for the cultivated landscape also increased to different extent during the study period. When cultivated landscape characteristics were used as the only factor in the LES assessment of cultivated land, it was found that the LES in some grids around the urban area even increased. The traditional LES assessment method for cultivated landscape neglects interactions with other landscape types. When the assessment was adjusted for ecological and construction landscapes, the results seemed to better reflect the rapid urban sprawl process, and the ALES results presented in this study are considered more representative of the peri-urban area. The decreased LES of the cultivated landscape is an impediment to sustainable peri-urban agriculture, and proven agricultural practices should be used to maintain the LES of peri-urban cultivated land resources.

Acknowledgments

This research work was supported by the Graduate Innovation Fund of Jilin University (grant number 2017091); Natural Science Foundation of Jilin Province, China (grant number 20170101076JC); China Geological Survey (grant number DD20160104).

Author Contributions

Dan Yu and Wenbo Li conceived and designed the research; Wenbo Li, Yongheng Zhou and Dongyan Wang collected and processed the data; Dan Yu, Shuhan Liu, Yuanli Zhu and Wenjun Wu analyzed the data; Dan Yu wrote the manuscript under the guidance of Dongyan Wang and Wenbo Li. All authors have read and approved the final manuscript.

Conflicts of Interest

The authors declare no conflict of interest.

References

  1. Costanza, R.; d’Arge, R.; de Groot, R.; Farber, S.; Grasso, M.; Hannon, B.; Limburg, K.; Naeem, S.; O’Neill, R.V.; Paruelo, J.; et al. The value of the world’s ecosystem services and natural capital. Nature 1997, 387, 253–260. [Google Scholar] [CrossRef]
  2. Li, F.; Zhang, S.; Yang, J.; Bu, K.; Wang, Q.; Tang, J.; Chang, L. The effects of population density changes on ecosystem services value: A case study in western Jilin, China. Ecol. Indic. 2016, 61, 328–337. [Google Scholar]
  3. Zander, P.; Groot, J.C.J.; Rossing, W.A.H.; Knierim, U. Multifunctionality of agriculture: Tools and methods for impact assessment and valuation. Agric. Ecosyst. Environ. 2007, 120, 1–4. [Google Scholar] [CrossRef]
  4. Su, W.Z.; Gu, C.L.; Yang, G.S.; Shuang, C.; Feng, Z. Measuring the impact of urban sprawl on natural landscape pattern of the western Taihu lake watershed, China. Landsc. Urban Plan. 2010, 95, 61–67. [Google Scholar] [CrossRef]
  5. Sun, D.F.; Hong, L.I.; Dawson, R.; Tang, C.J.; Xian-Wen, L.I. Characteristics of steep cultivated land and the impact of the grain-for-green policy in China. Pedosphere 2006, 16, 215–223. [Google Scholar] [CrossRef]
  6. Pribadi, D.O.; Pauleit, S. The dynamics of Peri-Urban agriculture during rapid urbanization of Jabodetabek metropolitan area. Land Use Policy 2015, 48, 13–24. [Google Scholar] [CrossRef]
  7. Ives, C.D.; Kendal, D. Values and attitudes of the urban public towards peri-urban agricultural land. Land Use Policy 2013, 34, 80–90. [Google Scholar] [CrossRef]
  8. Dunk, A.V.D.; Grêt-Regamey, A.; Dalang, T.; Hersperger, A.M. Defining a typology of peri-urban land-use conflicts—A case study from Switzerland. Landsc. Urban Plan. 2011, 101, 149–156. [Google Scholar] [CrossRef]
  9. Borgogno-Mondino, E.; Fabietti, G.; Ajmone-Marsan, F. Soil quality and landscape metrics as driving factors in a multi-criteria GIS procedure for peri-urban land use planning. Urban For. Urban Green. 2015, 14, 743–750. [Google Scholar] [CrossRef]
  10. Rolf, W.; Peters, D.; Lenz, R.; Pauleit, S. Farmland- An elephant in the room of urban green infrastructure? Lessons learned from connectivity analysis in German cities. Ecol. Indic. 2017. [Google Scholar] [CrossRef]
  11. Sheridan, H.; Keogh, B.; Anderson, A.; Carnus, T.; Mcmahon, B.J.; Green, S.; Purvis, G. Farmland habitat diversity in Ireland. Land Use Policy 2017, 63, 206–213. [Google Scholar] [CrossRef]
  12. York, A.M. Land fragmentation under rapid urbanization: A cross-site analysis of southwestern cities. Urban Ecosyst. 2011, 14, 429–455. [Google Scholar] [CrossRef]
  13. Sklenicka, P. Classification of farmland ownership fragmentation as a cause of land degradation: A review on typology, consequences, and remedies. Land Use Policy 2016, 57, 694–701. [Google Scholar] [CrossRef]
  14. Li, W.; Wang, D.; Li, H.; Liu, S. Urbanization-induced site condition changes of peri-urban cultivated land in the black soil region of Northeast China. Ecol. Indic. 2017, 80, 215–223. [Google Scholar] [CrossRef]
  15. Latruffe, L.; Piet, L. Does land fragmentation affect farm performance? A case study from Brittany, France. Agric. Syst. 2014, 129, 68–80. [Google Scholar] [CrossRef]
  16. Breed, M.F.; Gardner, M.G.; Ottewell, K.M.; Navarro, C.M.; Lowe, A.J. Shifts in reproductive assurance strategies and inbreeding costs associated with habitat fragmentation in Central American mahogany. Ecol. Lett. 2015, 15, 444–452. [Google Scholar] [CrossRef] [PubMed]
  17. Cerezo, A.; Conde, M.C.; Poggio, S.L. Pasture area and landscape heterogeneity are key determinants of bird diversity in intensively managed farmland. Biodivers. Conserv. 2011, 20, 2649–2667. [Google Scholar] [CrossRef]
  18. Vagneron, I. Economic appraisal of profitability and sustainability of peri-urban agriculture in Bangkok. Ecol. Econ. 2007, 61, 516–529. [Google Scholar] [CrossRef]
  19. Pölling, B.; Mergenthaler, M.; Lorleberg, W. Professional urban agriculture and its characteristic business models in metropolis Ruhr, Germany. Land Use Policy 2016, 58, 366–379. [Google Scholar] [CrossRef]
  20. Wästfelt, A.; Zhang, Q. Reclaiming localisation for revitalising agriculture: A case study of peri-urban agricultural change in Gothenburg, Sweden. J. Rural Stud. 2016, 47, 172–185. [Google Scholar] [CrossRef]
  21. Maheshwari, B.; Bristow, K.L. Peri-urban water, agriculture and urbanisation. Agric. Water Manag. 2016, 176, 263–265. [Google Scholar] [CrossRef]
  22. Shrestha, M.K.; York, A.M.; Boone, C.G.; Zhang, S. Land fragmentation due to rapid urbanization in the phoenix metropolitan area: Analyzing the spatiotemporal patterns and drivers. Appl. Geogr. 2015, 32, 522–531. [Google Scholar] [CrossRef]
  23. Jiao, L.; Xiao, F.; Xu, G.; Lu, Y. Spatial-temporal response of green land fragmentation patterns to urban expansion in Wuhan metropolitan area. Resour. Sci. 2015, 37, 1650–1660. (In Chinese) [Google Scholar]
  24. Turner, M.G.; Gardner, R.H. Quantitative Methods in Landscape Ecology; Springer: Dordrecht, The Netherlands, 1991. [Google Scholar]
  25. Pei, H.; Wei, Y.; Wang, X.; Qin, Z.; Hou, C. Method of cultivated land landscape ecological security evaluation and its application. Trans. Chin. Soc. Agric. Eng. 2014, 30, 212–219. (In Chinese) [Google Scholar]
  26. Inkoom, J.N.; Frank, S.; Greve, K.; Walz, U.; Fürst, C. Suitability of different landscape metrics for the assessments of patchy landscapes in west Africa. Ecol. Indic. 2017, 85, 117–127. [Google Scholar] [CrossRef]
  27. Li, Y.F.; Xiang, S.; Zhu, X.D.; Cao, H.H. An early warning method of landscape ecological security in rapid urbanizing coastal areas and its application in Xiamen, China. Ecol. Model. 2010, 221, 2251–2260. [Google Scholar] [CrossRef]
  28. Boyle, P.; Hayes, M.; Gormally, M.; Sullivan, C.; Moran, J. Development of a nature value index for pastoral farmland—A rapid farm-level assessment. Ecol. Indic. 2015, 56, 31–40. [Google Scholar] [CrossRef]
  29. Yu, X.; Wu, K.; Yun, W.; Wei, H.; Liu, L.; Song, Y.; Gao, X. Analysis on temporal and spatial variation of landscape ecological security in modern agricultural area. Trans. Chin. Soc. Agric. Eng. 2016, 32, 253–259. (In Chinese) [Google Scholar]
  30. Yang, W.; Guo, Y.; Wang, X.; Chen, C.; Hu, Y.; Cheng, L.; Gu, S.; Xu, X. Temporal variations of soil microbial community under compost addition in black soil of Northeast China. Appl. Soil Ecol. 2017, 121, 214–222. [Google Scholar] [CrossRef]
  31. Chen, X.; Wang, W.; Liang, H.; Liu, X.; Da, L. Dynamics of ruderal species diversity under the rapid urbanization over the past half century in Harbin, northeast China. Urban Ecosyst. 2014, 17, 455–472. [Google Scholar] [CrossRef]
  32. Bonfanti, P.; Fregonese, A.; Sigura, M. Landscape analysis in areas affected by land consolidation. Landsc. Urban Plan. 1997, 37, 91–98. [Google Scholar] [CrossRef]
  33. Muchová, Z.; Leitmanová, M.; Petrovič, F. Possibilities of optimal land use as a consequence of lessons learned from land consolidation projects (Slovakia). Ecol. Eng. 2016, 90, 294–306. [Google Scholar] [CrossRef]
  34. Skog, K.L.; Steinnes, M. How do centrality, population growth and urban sprawl impact farmland conversion in Norway? Land Use Policy 2016, 59, 185–196. [Google Scholar] [CrossRef]
  35. Wilson, W.L.; Abernethy, V.J.; Murphy, K.J.; Adam, A.; Mccracken, D.I.; Downie, I.S.; Foster, G.N.; Furnessa, R.W.; Waterhousec, S.; Ribera, I. Prediction of plant diversity response to land-use change on Scottish agricultural land. Agric. Ecosyst. Environ. 2013, 94, 249–263. [Google Scholar] [CrossRef]
  36. Araya, Y.H.; Cabral, P. Analysis and modeling of urban land cover change in Setúbal and Sesimbra, Portugal. Remote Sens. 2010, 2, 1549–1563. [Google Scholar] [CrossRef]
  37. Wu, J. Effects of changing scale on landscape pattern analysis: Scaling relations. Landsc. Ecol. 2004, 19, 125–138. [Google Scholar] [CrossRef]
  38. Marrugo-Negrete, J.; Pinedo-Hernández, J.; Díez, S. Assessment of heavy metal pollution, spatial distribution and origin in agricultural soils along the Sinú river basin, Colombia. Environ. Res. 2017, 154, 380–388. [Google Scholar] [CrossRef] [PubMed]
  39. Xu, X.; Zhao, Y.; Zhao, X.; Wang, Y.; Deng, W. Sources of heavy metal pollution in agricultural soils of a rapidly industrializing area in the Yangtze Delta of China. Ecotoxicol. Environ. Saf. 2014, 108, 161–167. [Google Scholar] [CrossRef] [PubMed]
  40. Bouma, J.; Droogers, P. A procedure to derive land quality indicators for sustainable agricultural production. Geoderma 1998, 85, 103–110. [Google Scholar] [CrossRef]
  41. Wu, Y.; Shan, L.; Guo, Z.; Peng, Y. Cultivated land protection policies in China facing 2030: Dynamic balance system versus basic farmland zoning. Habitat Int. 2017, 69, 126–138. [Google Scholar] [CrossRef]
  42. Morelli, F.; Jerzak, L.; Tryjanowski, P. Birds as useful indicators of high nature value (HNV) farmland in central Italy. Ecol. Indic. 2014, 38, 236–242. [Google Scholar] [CrossRef]
Figure 1. Location of the study area.
Sustainability 10 00394 g001
Figure 2. Distribution of grids and the central urban area within the study area.
Sustainability 10 00394 g002
Figure 3. The conceptual framework for the LES assessment of cultivated land employed in this study.
Sustainability 10 00394 g003
Figure 4. Land use maps of the study area in 1990, 2003 and 2016.
Sustainability 10 00394 g004
Figure 5. Scatter plots of the relationship between various landscape metrics of cultivated land from different periods and distance from the gravity center of the central urban area in 1990.
Sustainability 10 00394 g005
Figure 6. Maps illustrating changes in the cultivated landscape and its surrounding landscape following (The grids with changes in value were identified using overlay analysis with the previous time node).
Sustainability 10 00394 g006
Figure 7. LES and ALES assessment results regarding the study area (The level changes were the results of overlay analysis with the previous time node).
Sustainability 10 00394 g007
Table 1. Land use classifications, including demarcation of central urban area, used in this study.
Land Use CategoryAbbreviationConnotation
Central urban areaCUAThe continuous built-up region around the urban core.
Urban construction landUCLCentral urban area, as well as transportation land, industrial land, mining land and urban communities outside of the central urban area.
Rural settlementRSRural residential land.
Cultivated landCLRainfed land, irrigated land and paddy land.
Forest landFLForest, shelterbelt and shrub land.
GrasslandGNatural and artificial grass land.
WaterWRivers and reservoirs.
Table 2. Conversion of ecological land during different study periods (in ha).
Study PeriodConverted fromConverted toTotal Converted Area
UCLRSCLFLGW
1990–2003CL9940.301642.91109,455.78777.44112.62476.1112,949.38
FL437.4015.69943.8122,768.4212.0610.131419.09
G243.36086.540337.650329.90
W187.796.97351.8765.7853.779241.72666.18
2003–2016CL23,711.04841.5686,161.021120.9840.04181.3825,895.00
FL200.218.74222.2323,204.8100431.18
G108.330192.670217.0250.86351.86
W523.890254.0626.3708948.38804.32
Note: conversions between the same land categories are not included in the total converted area.
Table 3. Classification criterion for security levels of LES and ALES.
Value of LESSecurity Level
VIVIIIIII
LES(0.22,0.58)[0.58,0.77)[0.77,0.87)[0.87,0.93)[0.93,1)
ALES(0.12,0.63)[0.63,0.81)[0.81,0.92)[0.92,1.09)[1.09,1.41)

